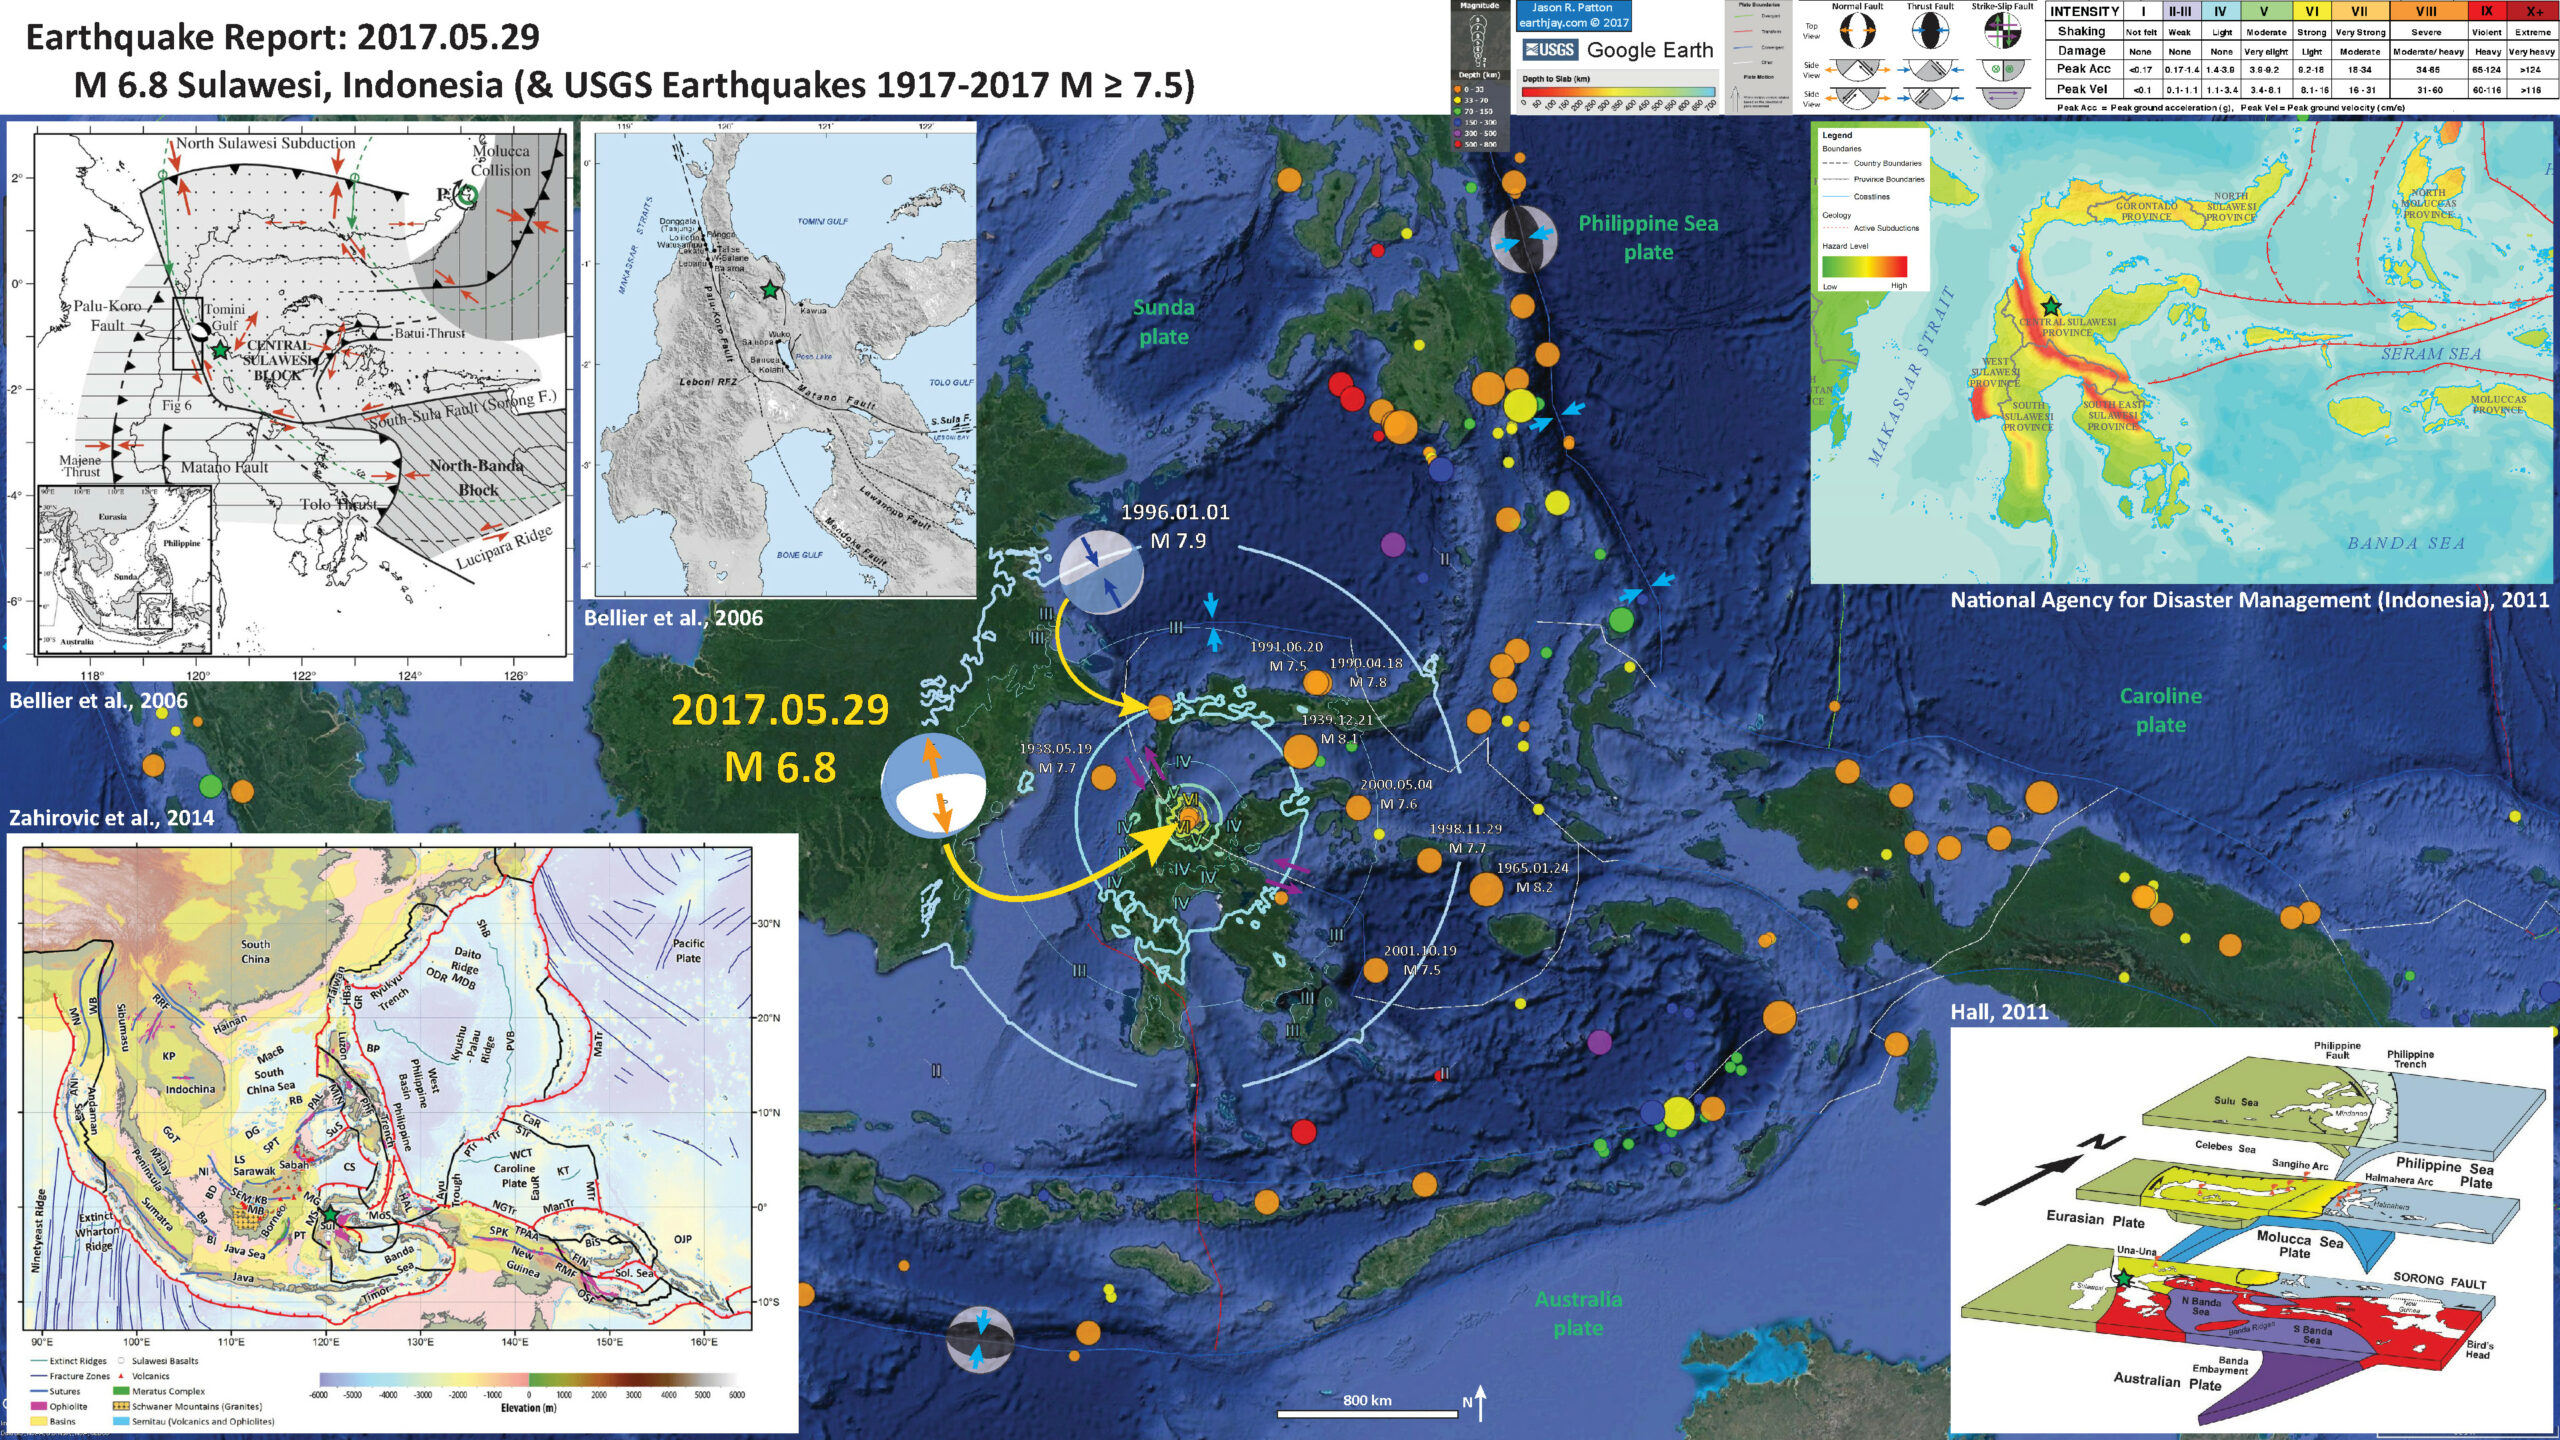
There was a series of earthquakes in Sulawesi, Indonesia earlier today, with a mainshock having a magnitude of M 6.8. This series of earthquakes is interesting as it does not occur on the main plate boundary fault, but on upper plate faults in the region. There is a major left-lateral strike-slip fault system to the west of these earthquakes (the Palu-Koro fault).
Part of this being interesting is that the orientation of the earthquake is oblique to some estimates of the orientation of extension in this region. The M 6.8 earthquake shows an extensional earthquake with extension oriented ~north-south. Some estimate extension in the upper plate to be northeast-southwest (Bellier et al., 2006), while others estimate extension in the upper plate to be oriented parallel to the M 6.8 earthquake (e.g. Walpersdorf et al., 1998). Spencer (2010) also documented normal faults in the upper plate that may also be correctly oriented for this M 6.8 earthquake. However, looking at the SRTM topographic data using the GeoMapApp, there is a structural grain that appears oriented to the extension estimated by Bellier et al., 2006.
- Here are the USGS earthquake websites for this sequence.
- 2017.05.29 14:35 M 6.8
- 2017.05.29 14:53 M 4.7
- 2017.05.29 15:04 M 5.1
- 2017.05.29 15:18 M 5.1
Below is my interpretive poster for this earthquake.
I plot the seismicity from the past month, with color representing depth and diameter representing magnitude (see legend). I also include seismicity from 1917-2017 for earthquakes with magnitudes M ≥ 7.5. Here is the USGS derived Google Earth kml file I used to create this map. I show the fault plane solutions for one of these earthquakes (1996 M 7.9). The 1996 M 7.9 earthquake is oriented with the subduction fault on the north side of Sulawesi. Interestingly, there is no seismicity M ≥ 7.5 along the strike-slip systems here.
- I placed a moment tensor / focal mechanism legend on the poster. There is more material from the USGS web sites about moment tensors and focal mechanisms (the beach ball symbols). Both moment tensors and focal mechanisms are solutions to seismologic data that reveal two possible interpretations for fault orientation and sense of motion. One must use other information, like the regional tectonics, to interpret which of the two possibilities is more likely
- I also include the shaking intensity contours on the map. These use the Modified Mercalli Intensity Scale (MMI; see the legend on the map). This is based upon a computer model estimate of ground motions, different from the “Did You Feel It?” estimate of ground motions that is actually based on real observations. The MMI is a qualitative measure of shaking intensity. More on the MMI scale can be found here and here. This is based upon a computer model estimate of ground motions, different from the “Did You Feel It?” estimate of ground motions that is actually based on real observations.
- I did not include the slab contours plotted (Hayes et al., 2012), which are contours that represent the depth to the subduction zone fault. These are mostly based upon seismicity. The depths of the earthquakes have considerable error and do not all occur along the subduction zone faults, so these slab contours are simply the best estimate for the location of the fault. The hypocentral depth plots this close to the location of the fault as mapped by Hayes et al. (2012).
- In the lower left corner is a general tectonic map for this part of the world (Zahirovic et al., 2014). I placed a green star in the location of this M 6.8 earthquake.
- In the lower right corner is a low-angle oblique view of the plate boundaries in the northern part of this region (Hall, 2011). The upper part of the diagram shows the opposing vergent subduction zones along that strike north-south along the Molucca Strait (Halmahera, Philippines). The lower panel shows the downgoing Australia plate along the Timor Trench and Seram Trench.. I placed a green star in the location of this M 6.8 earthquake.
- In the upper right corner I include an inset of a seismic hazard map for this region of Indonesia. This map is from the Indonesian National Agency for Disaster Management (2011). Note the high seismic hazard associated with the Palu-Koro and Matano faults.
- In the upper right corner I include a tectonic map showing the major fault systems and generalized plate motions (Bellier et al., 2006). Note the northeast-southwest orientation of extension in the Central Sulawesi block. I present another figure from this publication below.
- To the right of this Bellier et al. (2006) map is another figure from that same publication. This is more generalized and shows the orientation of the faults in this region.
I include some inset figures in the poster.
- Here is the tectonic map from Bellier et al., 2006. I include their caption below in blockquote.
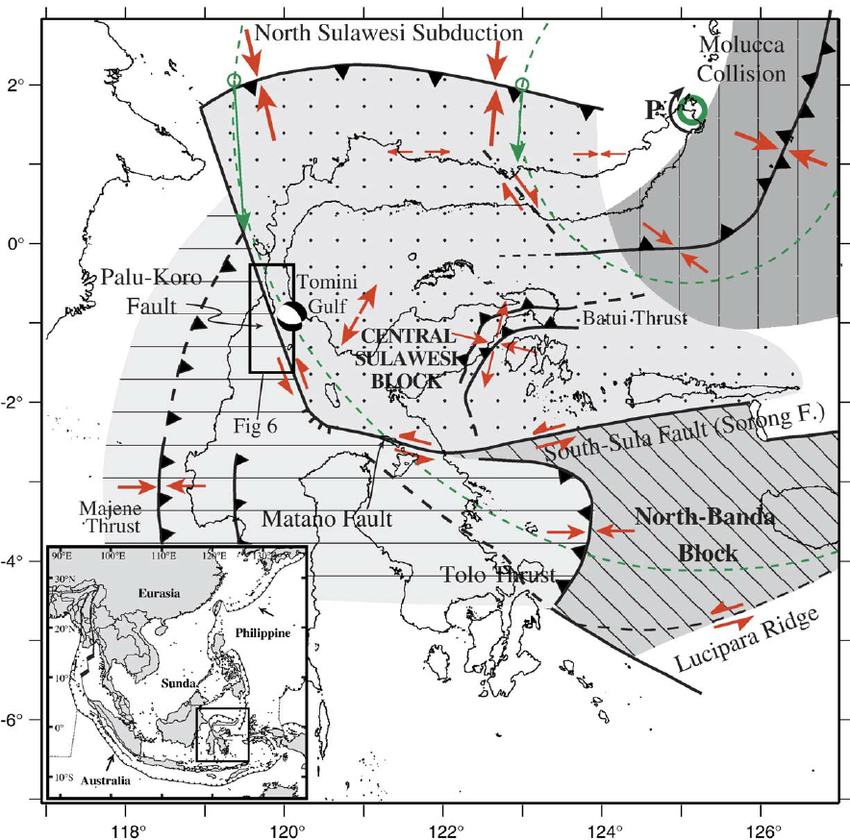
Regional geodynamic sketch that presents the present day deformation model of Sulawesi area (after Beaudouin et al., 2003) and four main deformation systems around the Central Sulawesi block, highlighting the tectonic complexity of Sulawesi. Approximate location of the Central Sulawesi block rotation pole (P) [compatible with both GPS measurements (Walpersdorf et al., 1998a) and earthquake moment tensor analyses (Beaudouin et al., 2003)], as well as the major active structures are reported. Central Sulawesi Fault System (CSFS) is formed by the Palu–Koro and Matano faults. Arrows correspond to the compression and/or extension directions deduced from both inversion and moment tensor analyses of the focal mechanisms; arrow size being proportional to the deformation rate (e.g., Beaudouin et al., 2003).We also represent the focal mechanism provided by the Harvard CMT database [CMT data base, 2005] for the recent large earthquake (Mw=6.2; 2005/1/23; lat.=0.928S; long.=120.108E). The box indicates the approximate location of the Fig. 6 that corresponds to the geological map of the Palu basin region. The bottom inset shows the SE Asia and Sulawesi geodynamic frame where arrows represent the approximate Indo-Australian and Philippines plate motions relative to Eurasia.
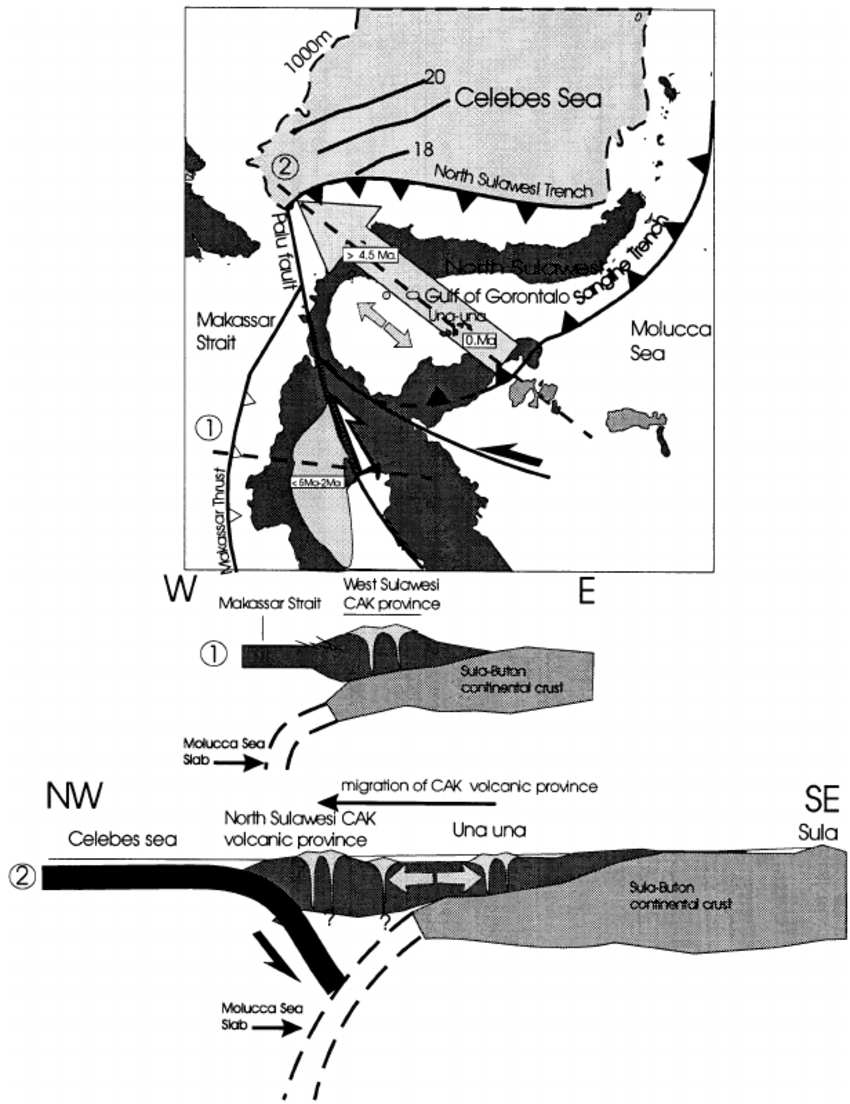
- Here is the larger scale map showing the fault configuration in this region (Bellier et al., 2006)

Sketch map of the Cenozoic Central Sulawesi fault system. ML represents the Matano Lake, and Leboni RFZ, the Leboni releasing fault zone that connects the Palu–Koro and Matano Faults. Triangles indicate faults with reverse component (triangles on the upthrown block). On this map are reported the fault kinematic measurement sites (geographic coordinates in Table 3).
- The extension shown in the Bellier et al. (2006) map above is largely the result of analyses conducted by and presented in Beaudouin et al. (2003). Here I present their figure where they summarize their results of block modeling using historic seismicity to drive the strain in this region. It is possible that the century of seismicity data is insufficient to account for the strain here. This may explain why the orientation of the M 6.8 earthquake is not oriented like suggested in this map below.


- Here is a figure from Walpersdorf et al. (1998) that shows regional plate motions and the tectonic faults in the region. Note that the extension is oriented parallel to the M 6.8 extension. These data are based upon their analyses of GPS geodetic data. So, given the orientation of the M 6.8 earthquake and these data, I suspect this is the correct orientation of extension. Though, this is not consistent with the topographic data I present below.
Distribution of the calk alkalic potassic (CAK) volcanism in Sulawesi. In the west arm this volcanism is restricted to the central part of the arm, while east of the Palu–Koro fault zone CAK volcanism is distributed across a NW–SE 200 km wide belt extending from north Sulawesi to the Una-Una Island. The two synthetic cross sections illustrate the contrasting distribution of this volcanism on both sides of the Palu–Koro fault zone. Extension of the Sula-Buton=north Sulawesi arc is speculative. The double arrow illustrates extension in the Gulf of Gorontalo. Dashed lines in cross sections indicate the presence at depth of the remnant subducted Tethys oceanic crust.
- This is smaller scale tectonic map of the region (Zahirovic et al., 2014).

Regional tectonic setting with plate boundaries (MORs/transforms = black, subduction zones = teethed red) from Bird (2003) and ophiolite belts representing sutures modified from Hutchison (1975) and Baldwin et al. (2012). West Sulawesi basalts are from Polvé et al. (1997), fracture zones are from Matthews et al. (2011) and basin outlines are from Hearn et al. (2003). ANI – Andaman and Nicobar Islands, BD– Billiton Depression, Ba – Bangka Island, BI – Belitung (Billiton) Island, BiS – Bismarck Sea, BP – Benham Plateau, CaR – Caroline Ridge, CS – Celebes Sea, DG– Dangerous Grounds, EauR – Eauripik Ridge, FIN – Finisterre Terrane, GoT – Gulf of Thailand, GR– Gagua Ridge, HAL– Halmahera, HBa – Huatung Basin, KB–Ketungau Basin, KP – Khorat Platform, KT – Kiilsgaard Trough, LS – Luconia Shoals, MacB – Macclesfield Bank, ManTr – Manus Trench, MaTr – Mariana Trench, MB– Melawi Basin, MDB– Minami Daito Basin, MG– Mangkalihat, MIN – Mindoro, MN– Mawgyi Nappe, MoS – Molucca Sea, MS– Makassar Straits, MTr – Mussau Trench, NGTr – New Guinea Trench, NI – Natuna Islands, ODR– Oki Daito Ridge, OJP –Ontong Java Plateau, OSF – Owen Stanley Fault, PAL – Palawan, PhF – Philippine Fault, PT – Paternoster Platform, PTr – Palau Trench, PVB – Parece Vela Basin, RB – Reed Bank, RMF– Ramu-Markham Fault, RRF – Red River fault, SEM– Semitau, ShB – Shikoku Basin, Sol. Sea – Solomon Sea, SPK – Sepik, SPT – abah–Palawan Trough, STr – Sorol Trough, Sul – Sulawesi, SuS – Sulu Sea, TPAA– Torricelli–Prince Alexander Arc, WB–West Burma, WCT–W Caroline Trough, YTr –Yap Trough.
- Here is a map from Spencer (2010). Today’s M 6.8 occurred along the cross section A-A.’

Elevation and shaded-relief maps and topographic cross sections derived from the SRTM DEM using GeoMapApp©. (A) Map of the Sulawesi and surrounding areas, with bathymetry derived from the Marine Geoscience Data System bathymetry database. Geologic features from Hamilton (1979) and Silver et al. (1983). (B) Map of central Sulawesi (location in A) showing inferred detachment faults (double ticks on hanging wall) and high-angle faults (red lines). (C) Map of the Tokorondo massif (location in B) showing inferred detachment fault and high-angle faults. (D) Topographic cross sections (location in C) of Tokorondo massif.
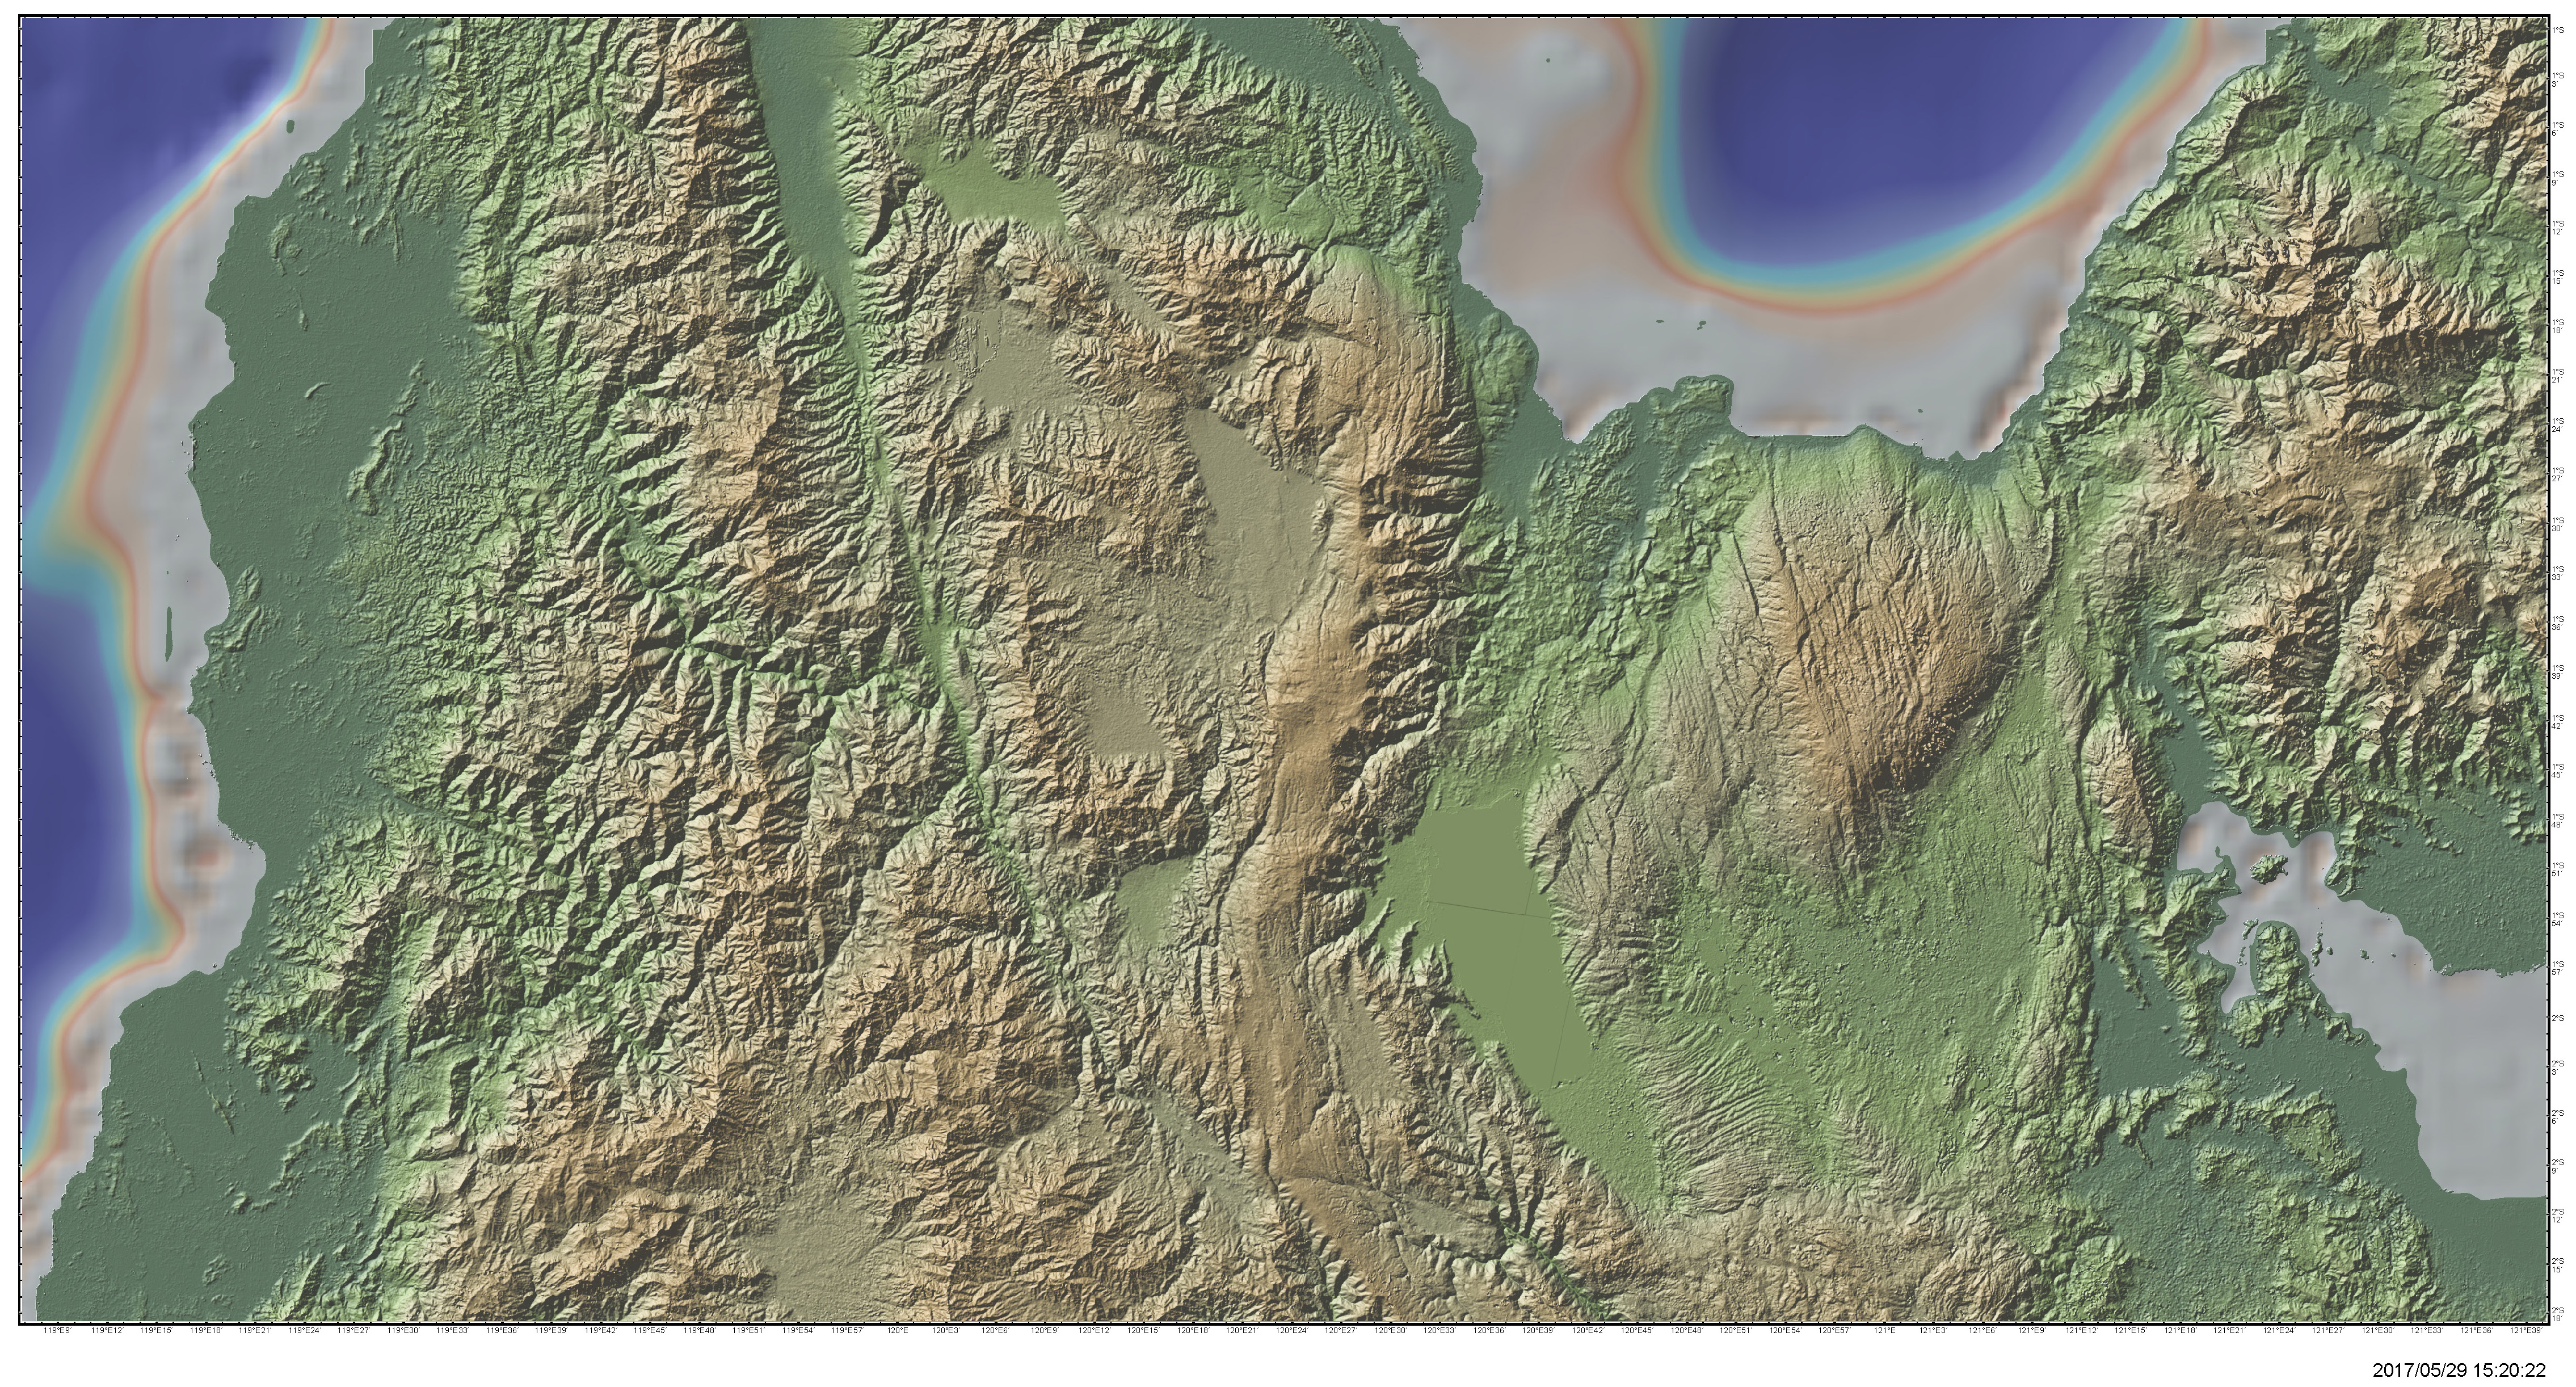
- Here is a map from the GeoMapApp, using Global Multi-Resolution Topography (GMRT) topographic data (Ryan et al., 2009). Note the north-northwest structural grain. These appear to be normal faults oriented with a east-northeast/west-southwest extension from Bellier et al. (2006). This is the same general region as presented in the Spencer (2010) map above. Note the two large rounded plateau-highlands and the low lying basins (lakes are not outlined in this map).
- Here is the seismic hazard map from the Indonesian National Agency for Disaster Management (2011). This is the full map, for which a subset is included in the interpretive poster above.

- 2017.04.28 M 6.9 Philippines
- 2017.04.08 M 5.9 Philippines
- 2017.01.10 M 7.3 Celebes Sea
- 2015.03.17 M 6.2 Molucca Sea
- 2014.11.26 M 6.8 Molucca Sea
- 2014.11.21 M 6.5 Molucca Sea
- 2014.11.15 M 7.1 Molucca Sea
Philippines
Earthquake Reports
- M 9.2 Andaman-Sumatra subduction zone 2014 Earthquake Anniversary
- M 9.2 Andaman-Sumatra subduction zone SASZ Fault Deformation
- M 9.2 Andaman-Sumatra subduction zone 2016 Earthquake Anniversary
- 2017.05.29 M 6.8 Sulawesi, Indonesia
- 2017.03.14 M 6.0 Sumatra
- 2017.03.01 M 5.5 Banda Sea
- 2016.10.19 M 6.6 Java
- 2016.03.02 M 7.8 Sumatra/Indian Ocean
- 2015.07.22 M 5.8 Andaman Sea
- 2015.11.08 M 6.4 Nicobar Isles
- 2012.04.11 M 8.6 Sumatra outer rise
- 2004.12.26 M 9.2 Andaman-Sumatra subduction zone
Indonesia | Sumatra
General Overview
Earthquake Reports
References:
- Bellier, O., Se´brier, M., Seward, D., Beaudouin, T., Villeneuve, M., and Putranto, E., 2006. Fission track and fault kinematics analyses for new insight into the Late Cenozoic tectonic regime changes in West-Central Sulawesi (Indonesia) in Tectonophysics, v. 413, p. 201-220.
- Benz, H.M., Herman, Matthew, Tarr, A.C., Hayes, G.P., Furlong, K.P., Villaseñor, Antonio, Dart, R.L., and Rhea, Susan, 2011. Seismicity of the Earth 1900–2010 New Guinea and vicinity: U.S. Geological Survey Open-File Report 2010–1083-H, scale 1:8,000,000.
- Hall, R., 2011. Australia-SE Asia collision: plate tectonics and crustal flow in Geological Society, London, Special Publications 2011; v. 355; p. 75-109 doi: 10.1144/SP355.5
- Hayes, G.P., Wald, D.J., and Johnson, R.L., 2012. Slab1.0: A three-dimensional model of global subduction zone geometries in, J. Geophys. Res., 117, B01302, doi:10.1029/2011JB008524
- Hayes, G.P., Smoczyk, G.M., Benz, H.M., Villaseñor, Antonio, and Furlong, K.P., 2015. Seismicity of the Earth 1900–2013, Seismotectonics of South America (Nazca Plate Region): U.S. Geological Survey Open-File Report 2015–1031–E, 1 sheet, scale 1:14,000,000, http://dx.doi.org/10.3133/ofr20151031E.
- Ryan, W.B.F., S.M. Carbotte, J.O. Coplan, S. O’Hara, A. Melkonian, R. Arko, R.A. Weissel, V. Ferrini, A. Goodwillie, F. Nitsche, J. Bonczkowski, and R. Zemsky, 2009. Global Multi-Resolution Topography synthesis, Geochem. Geophys. Geosyst., 10, Q03014, doi: 10.1029/2008GC002332
- Walpersdorf, A., Rangin, C., and Vigny, C., 1998. GPS compared to long-term geologic motion of the north arm of Sulawesi in EPSL, v. 159, p. 47-55.
- Zahirovic, S., Seton, M., and Müller, R.D., 2014. The Cretaceous and Cenozoic tectonic evolution of Southeast Asia in Solid Earth, v. 5, p. 227-273, doi:10.5194/se-5-227-2014