This morning (my time) there was a shallow earthquake in western China, near a region that was shocked by an M 7.9 earthquake in 2008 (the “Wenchuan Earthquake”).
Here is the USGS website for this M 6.5 earthquake.
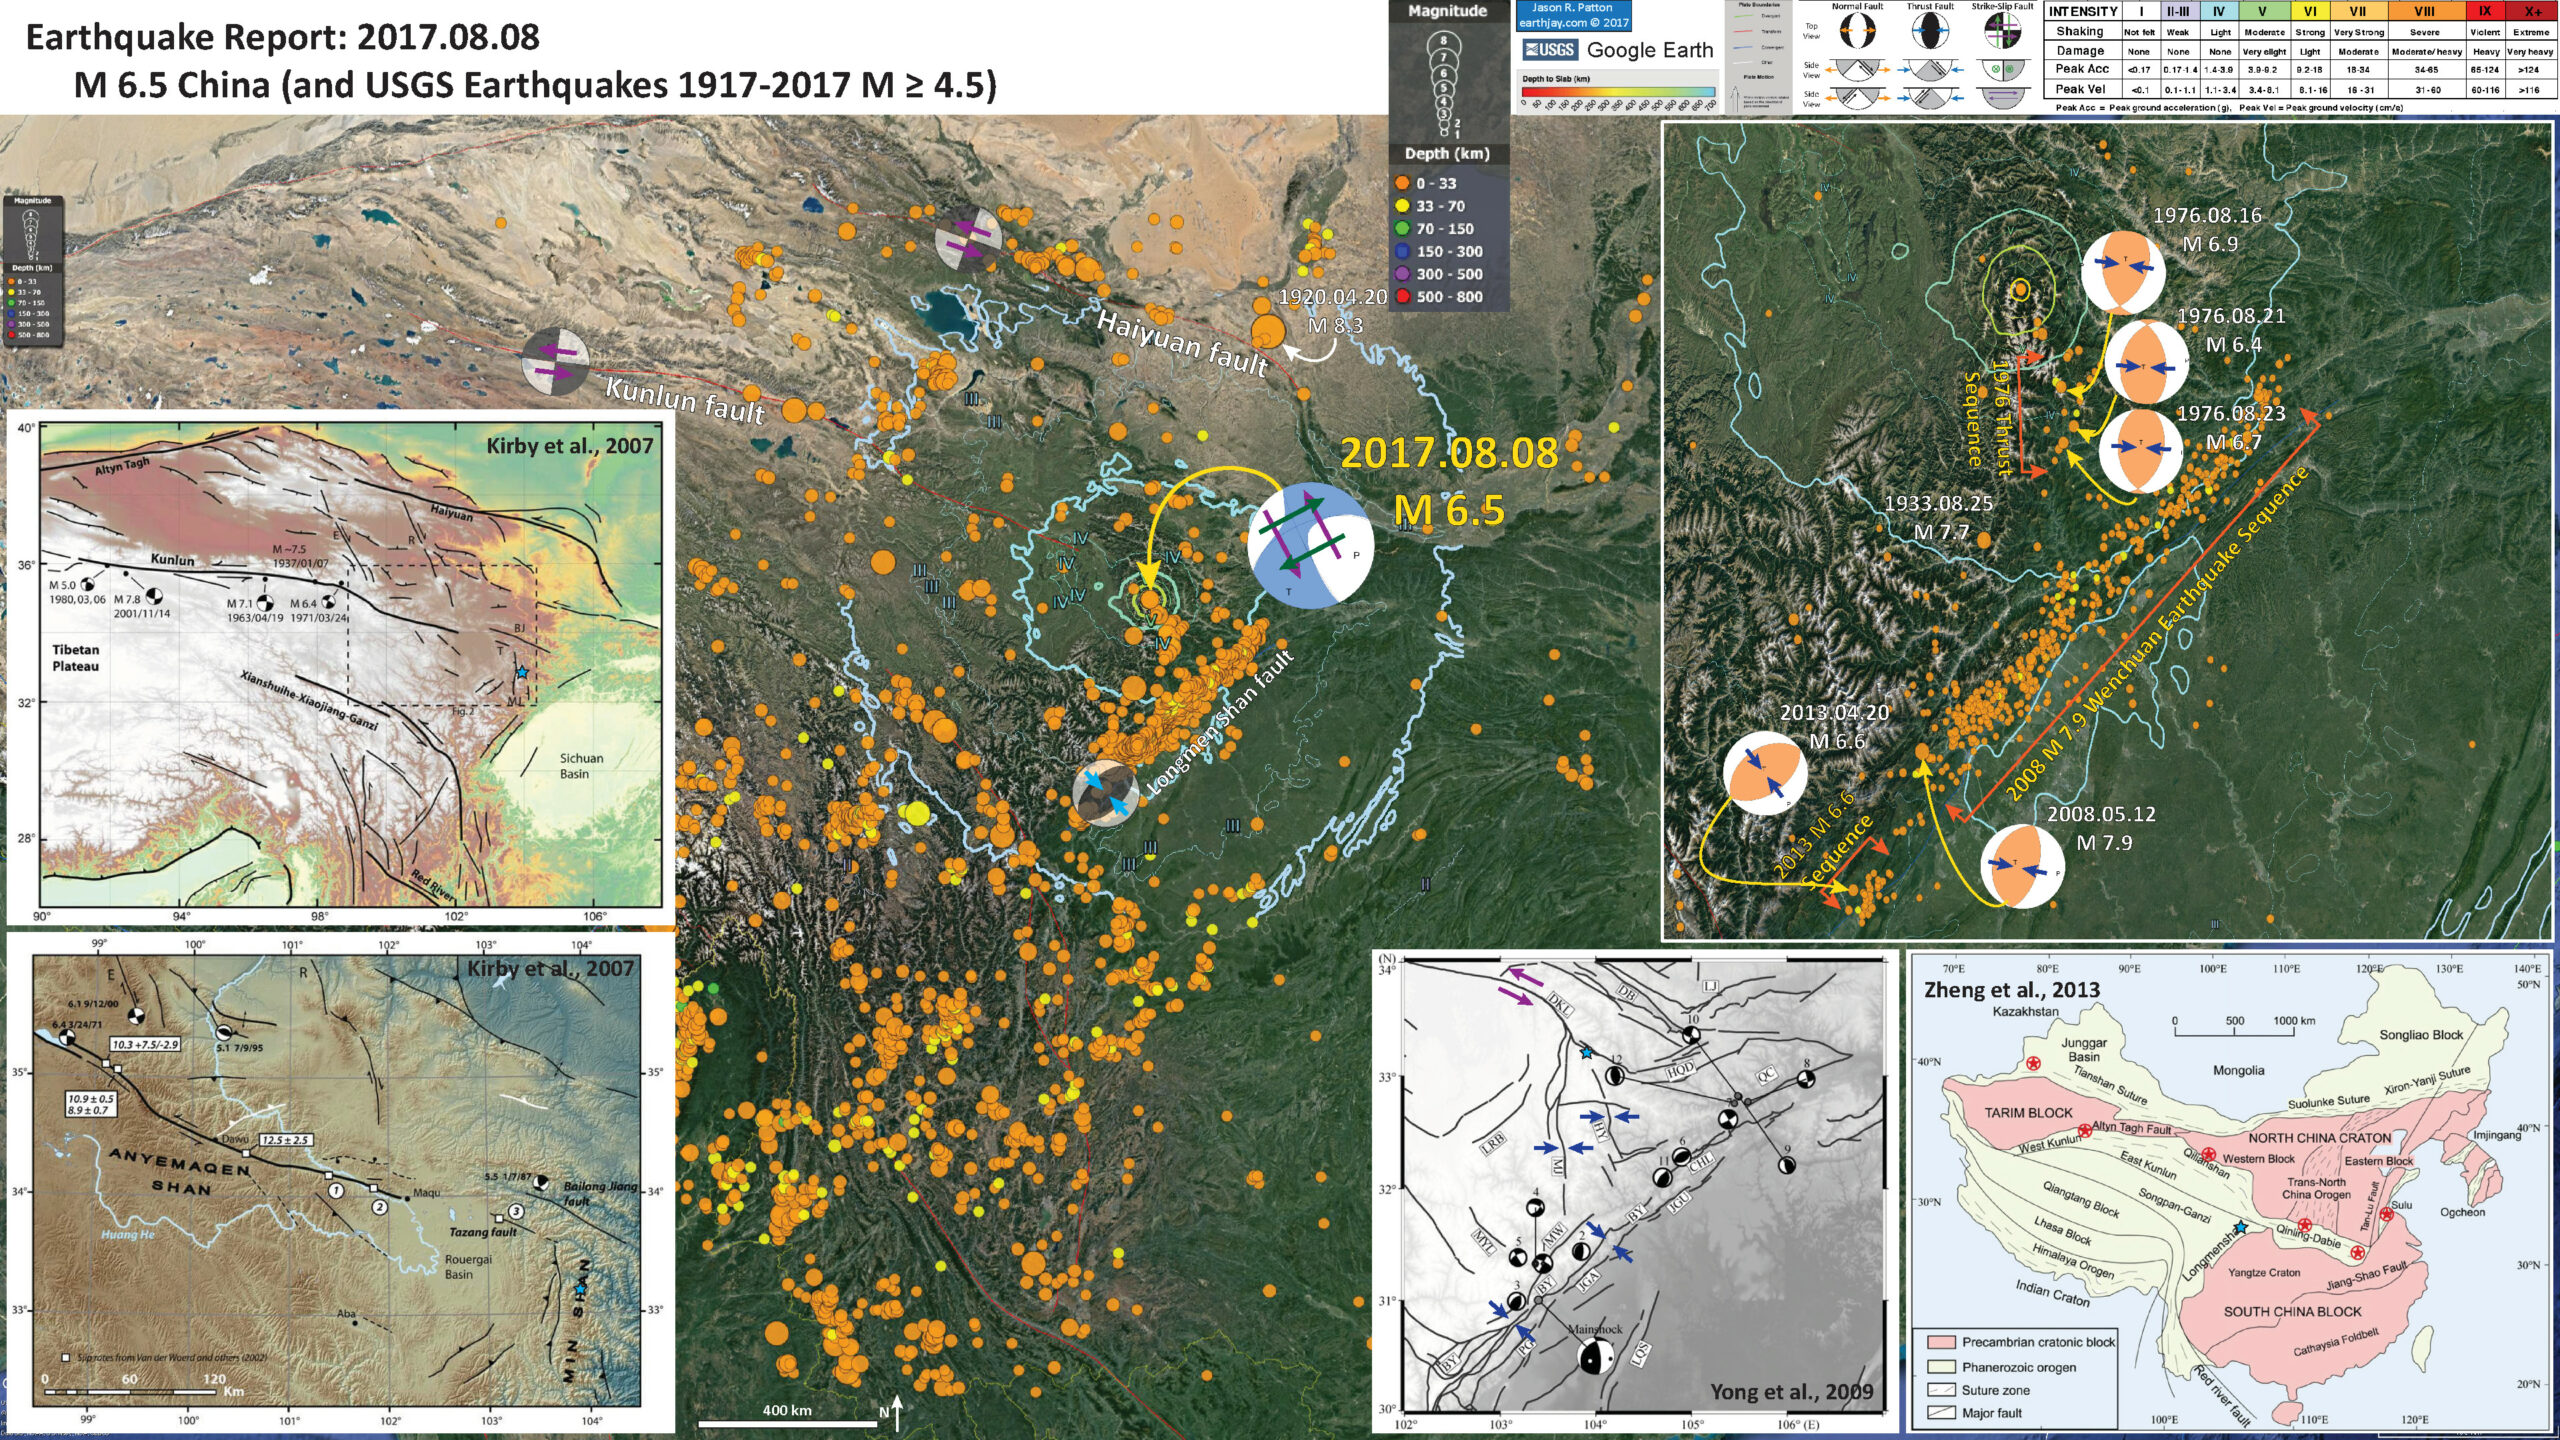
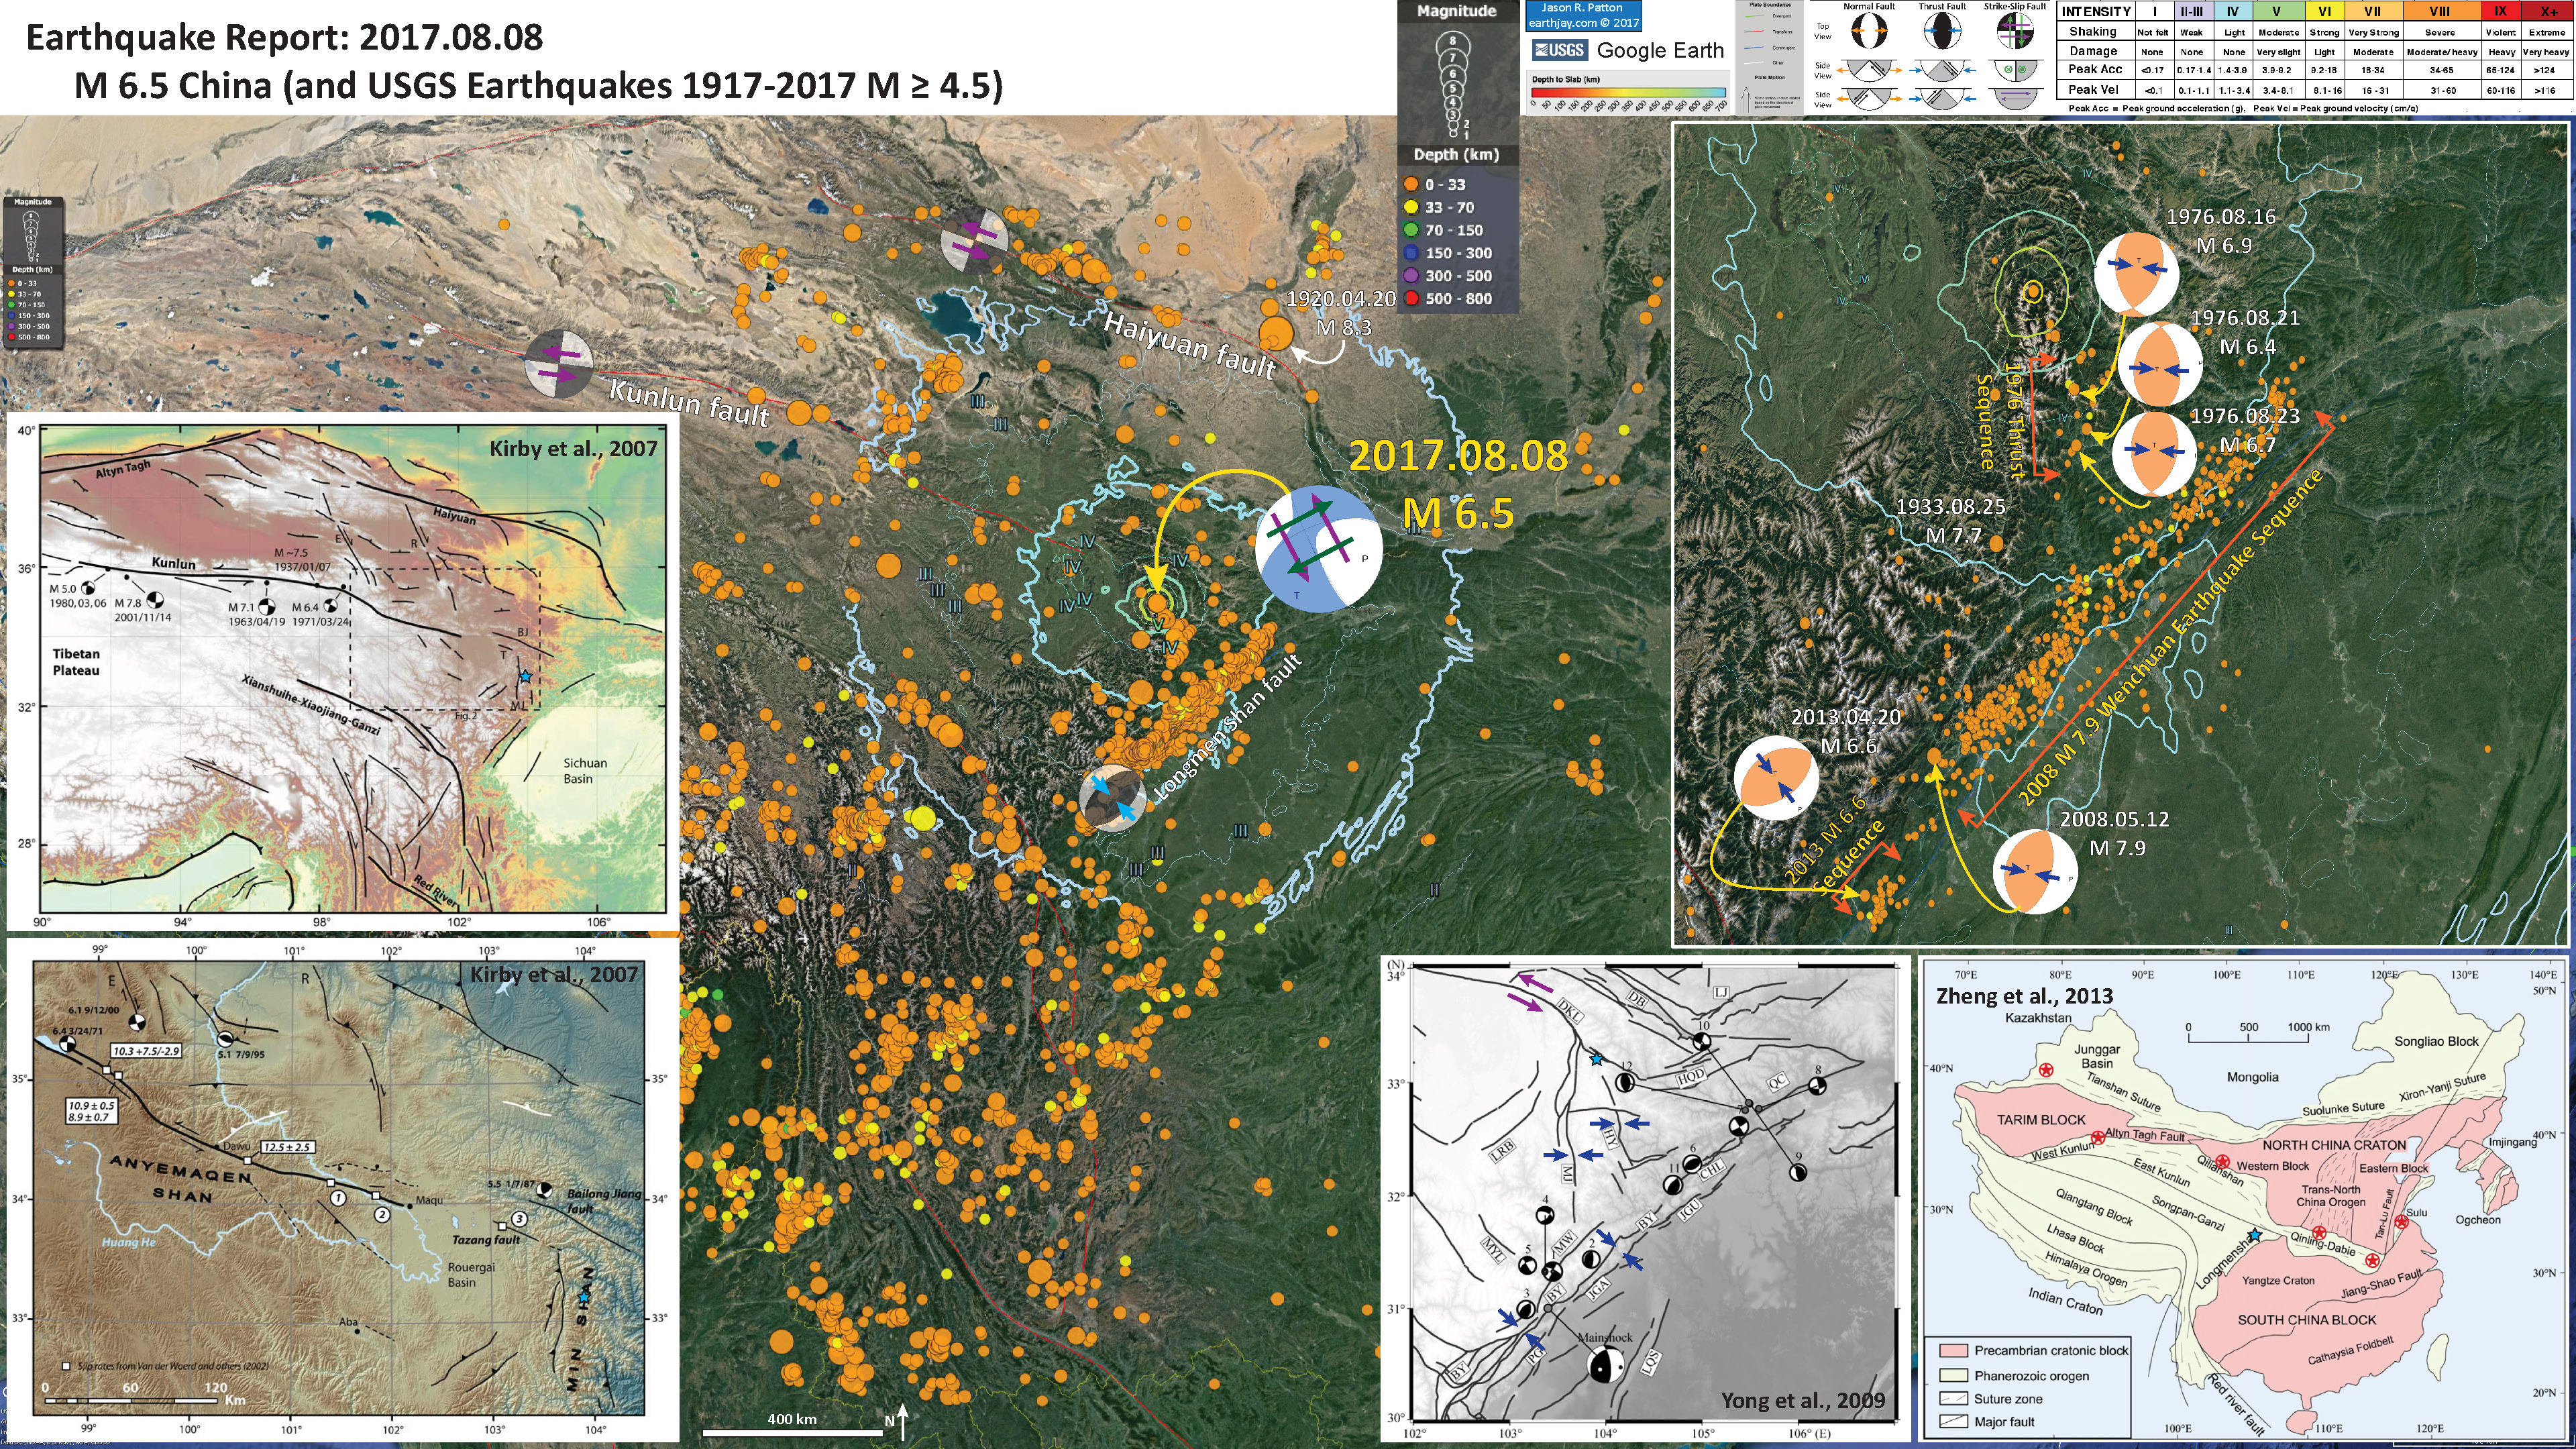
Below is my interpretive poster for this earthquake.
I plot the seismicity from the past month, with color representing depth and diameter representing magnitude (see legend). I also include USGS epicenters from 1917-2017 for magnitudes M ≥ 4.5.
I also include the USGS moment tensor for today’s earthquake. While it is possible that either nodal plane is correct, read below to see how I interpret today’s earthquake given the publications I include in this report (see discussion about inset figures).
This region lies along a boundary between extrusion tectonics related Kunlun and Haiyuan faults and the Longmen Shan thrust fault system. As the India subcontinent collides with Asia, central Asia is extruded to the east, forming these major strike-slip fault systems. The Haiyuan fault system experienced an M 8.3 earthquake on 1920.12.16 (shown on main map) and is one of the faults that is thought to experience superquakes and supercycles. There have been several M 7.8 earthquakes on the Kunlun fault (1932 and 2001)..
- I placed a moment tensor / focal mechanism legend on the poster. There is more material from the USGS web sites about moment tensors and focal mechanisms (the beach ball symbols). Both moment tensors and focal mechanisms are solutions to seismologic data that reveal two possible interpretations for fault orientation and sense of motion. One must use other information, like the regional tectonics, to interpret which of the two possibilities is more likely. Based upon the series of earthquakes and the mapped faults, I interpret this M 5.1 earthquake as a left-lateral strike-slip earthquake related to slip associated with the Gorda plate.
- I also include the shaking intensity contours on the map. These use the Modified Mercalli Intensity Scale (MMI; see the legend on the map). This is based upon a computer model estimate of ground motions, different from the “Did You Feel It?” estimate of ground motions that is actually based on real observations. The MMI is a qualitative measure of shaking intensity. More on the MMI scale can be found here and here. This is based upon a computer model estimate of ground motions, different from the “Did You Feel It?” estimate of ground motions that is actually based on real observations.
- In the lower right corner I include a map showing the tectonic domains in China (Zheng et al., 2013). I place a blue star in the general location of today’s M 6.5 earthquake (as in other figures).
- In the center left, I include a tectonic map, showing the major faults in the region (Kirby et al., 2007). The inset map is below this figure in the lower left corner. This larger scale maps shows more detail of the faults (and their study sites). Today’s earthquake happened in the mountains of Min Shan, where there are numerous north-south striking thrust faults (e.g. the Minjiang fault and the Fuya fault; the Minjian fault is labeled MJ in the upper map).
- To the left of the Zheng et al. (2013) map is a large scale map from Yong et al., 2009. This map shows more faults at this scale. The MJ (Mijiang fault) and HY (Fuya fault) are thrust faults and probably not related to today’s earthquake. The fault labeled DKL (I cannot yet determine the name of this fault, it is not listed in their publication) is the likely culprit for today’s earthquake. Given the moment tensor, shallow depth, and orientation of the DKL fault, I interpret today’s earthquake to be a west-northwest striking left-lateral strike-slip fault.
- In the upper right corner I include a larger scale map with the same earthquakes as plotted in the main map. I highlight the earthquakes associated with the 2008 M 7.9 Wenchuan Earthquake sequence. This earthquake triggered tens of thousands of landslides and killed many people. There was also a series of earthquakes (with an M 6.6 mainshock) to the southwest of the 2008 earthquakes, which were probably related to the Wenchuan Earthquake. To the south of today’s M 6.5 earthquake, there was a series of southward propagating thrust fault earthquakes [possibly/probably] along the Fuya fault system.
I include some inset figures in the poster.
- Here is the fault block map from Zheng et al. (2013). I include their figure caption below in blockquotes.
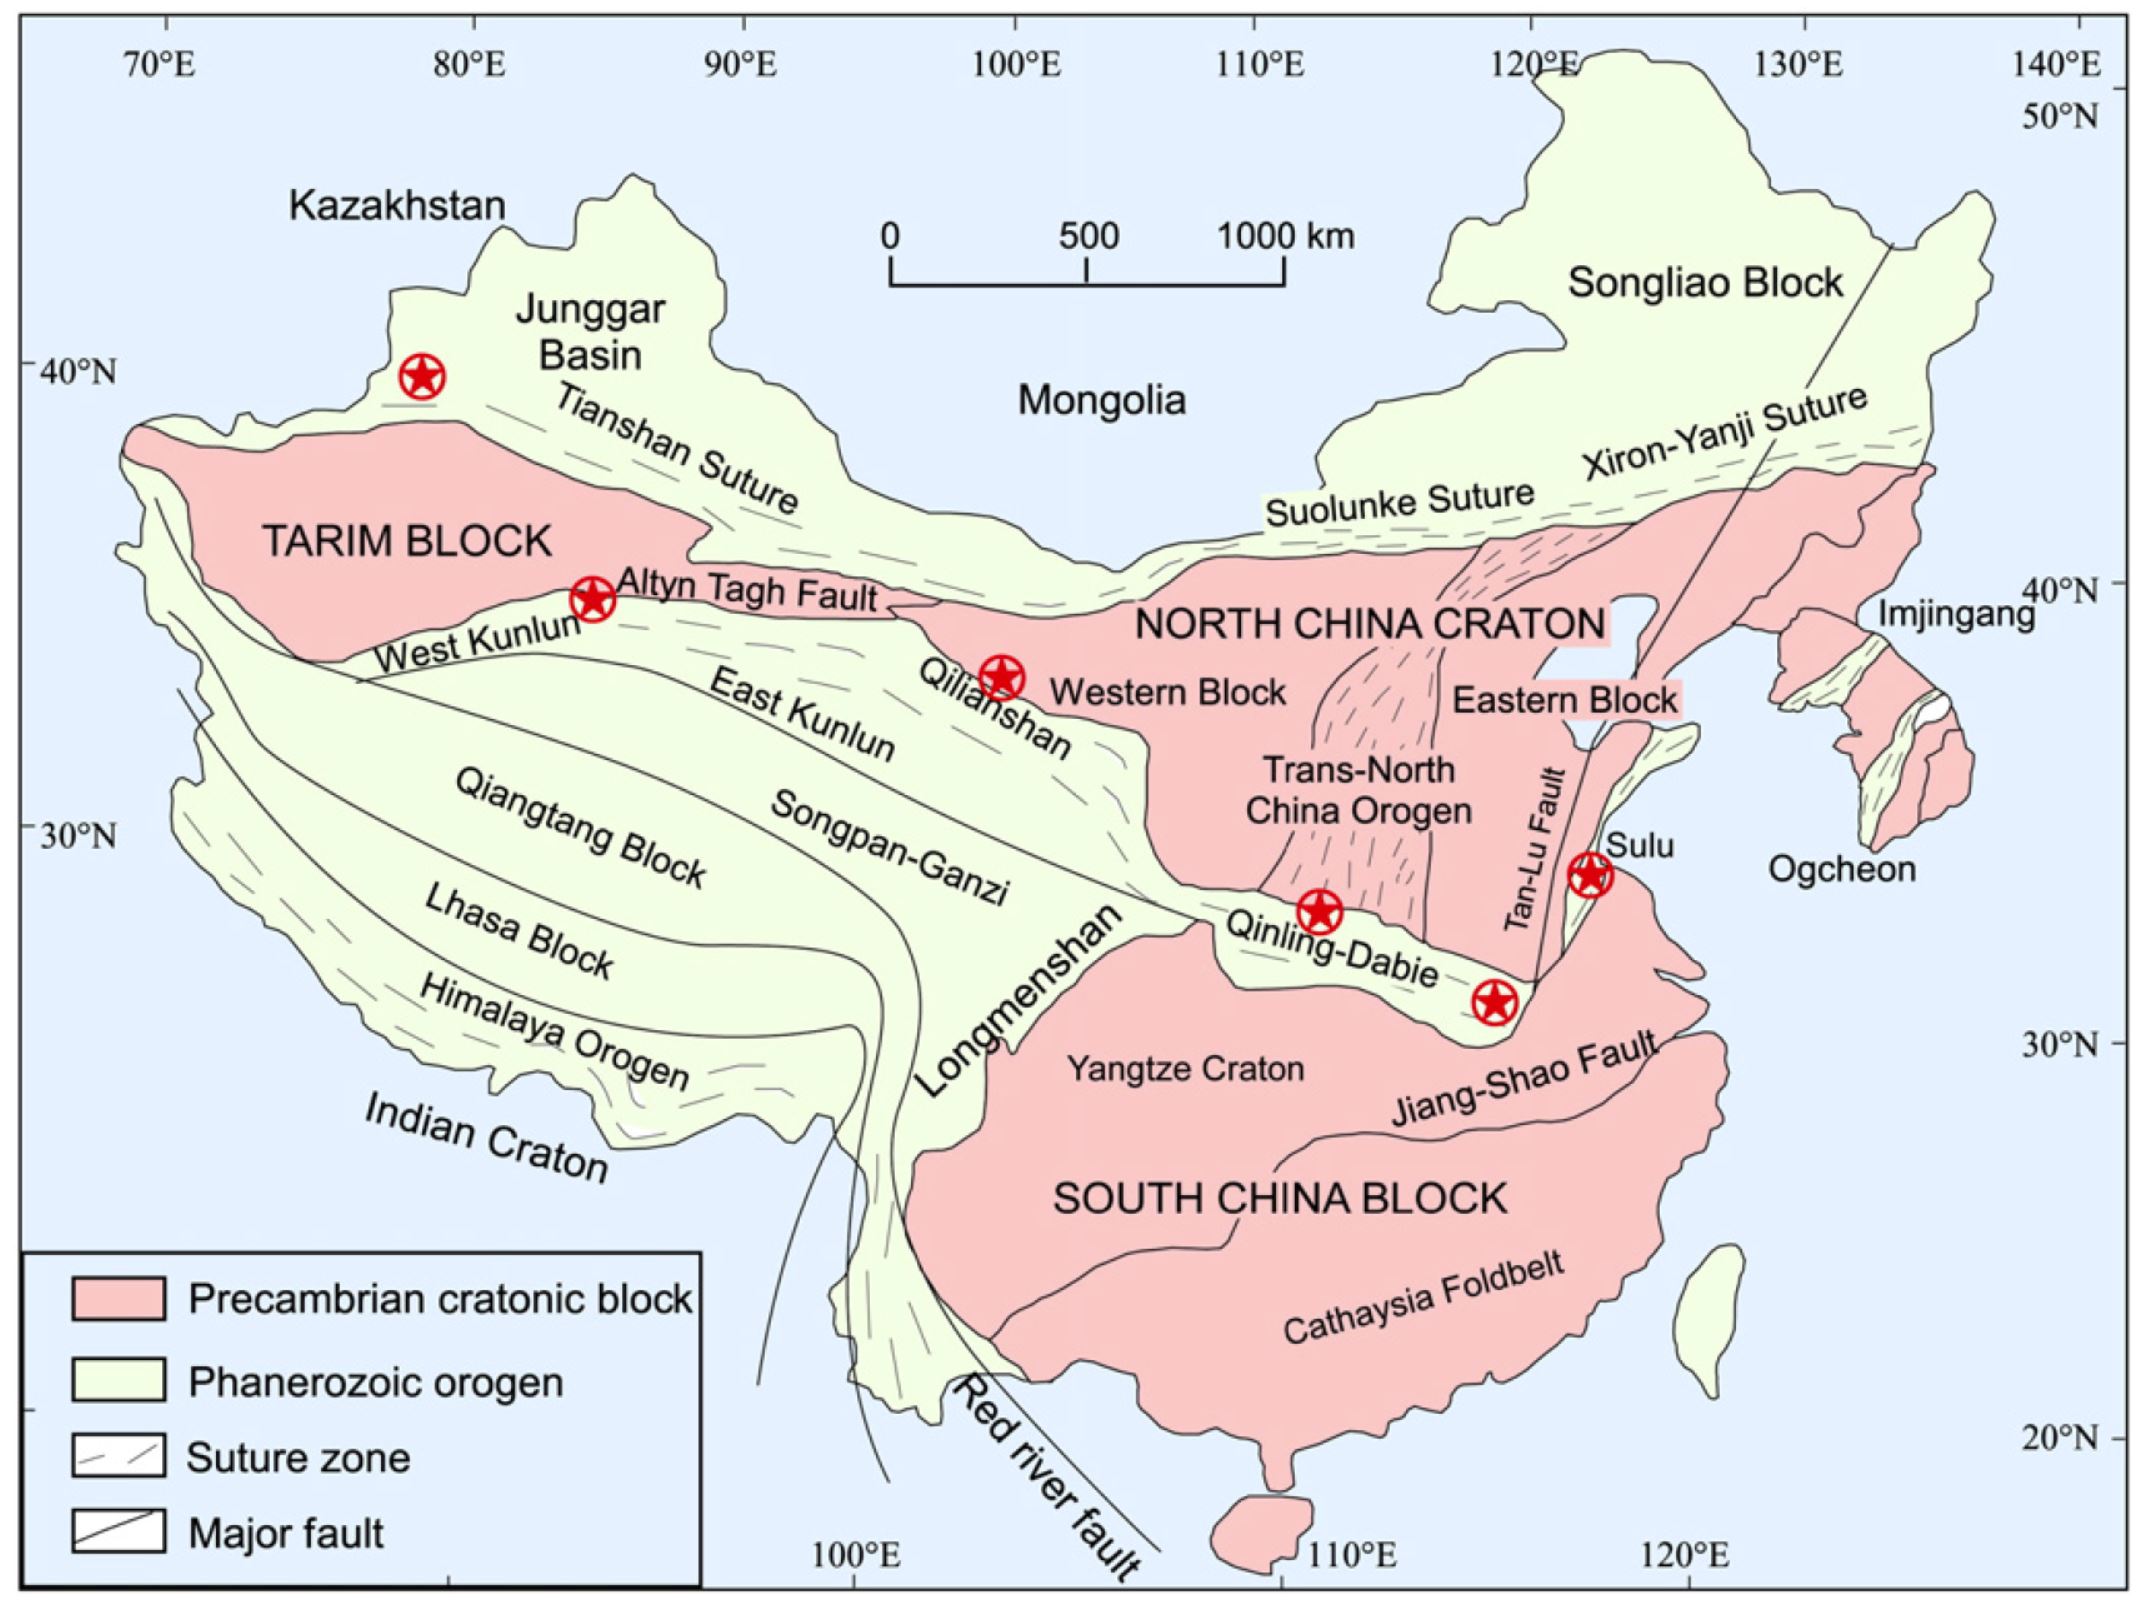
Simplified tectonic map of China showing major cratonic blocks and orogenic belts (modified after Zhao et al., 2001). Circled asterisks denote the UHP metamorphic terranes in the central orogenic belt of China (Zheng et al., 2012), which occur from west to east: Southwest Tianshan, Altyn, North Qaidam, North Qinling, and Dabie and Sulu.
- Here are the two maps from Kirby et al. (2007). I include their figure caption below in blockquotes.

Tectonic map showing major and minor active faults in eastern Tibet. Abbreviations are as follows; BJ, Bailong Jiang fault; E, Elashan fault; MJ, Min Jiang fault; R, Riyueshan fault; T, Tazang fault. Epicentral locations and focal mechanism solutions of recent seismicity along the Kunlun fault are compiled from USGS (http://neic.usgs.gov/neis/epic/epic_circ.html), Harvard CMT catalog (http://www.globalcmt.org/CMTsearch.html), and Molnar and Lyon-Caen [1989]. Topographic base is generated from the Shuttle Radar Topography Mission (SRTM) data.
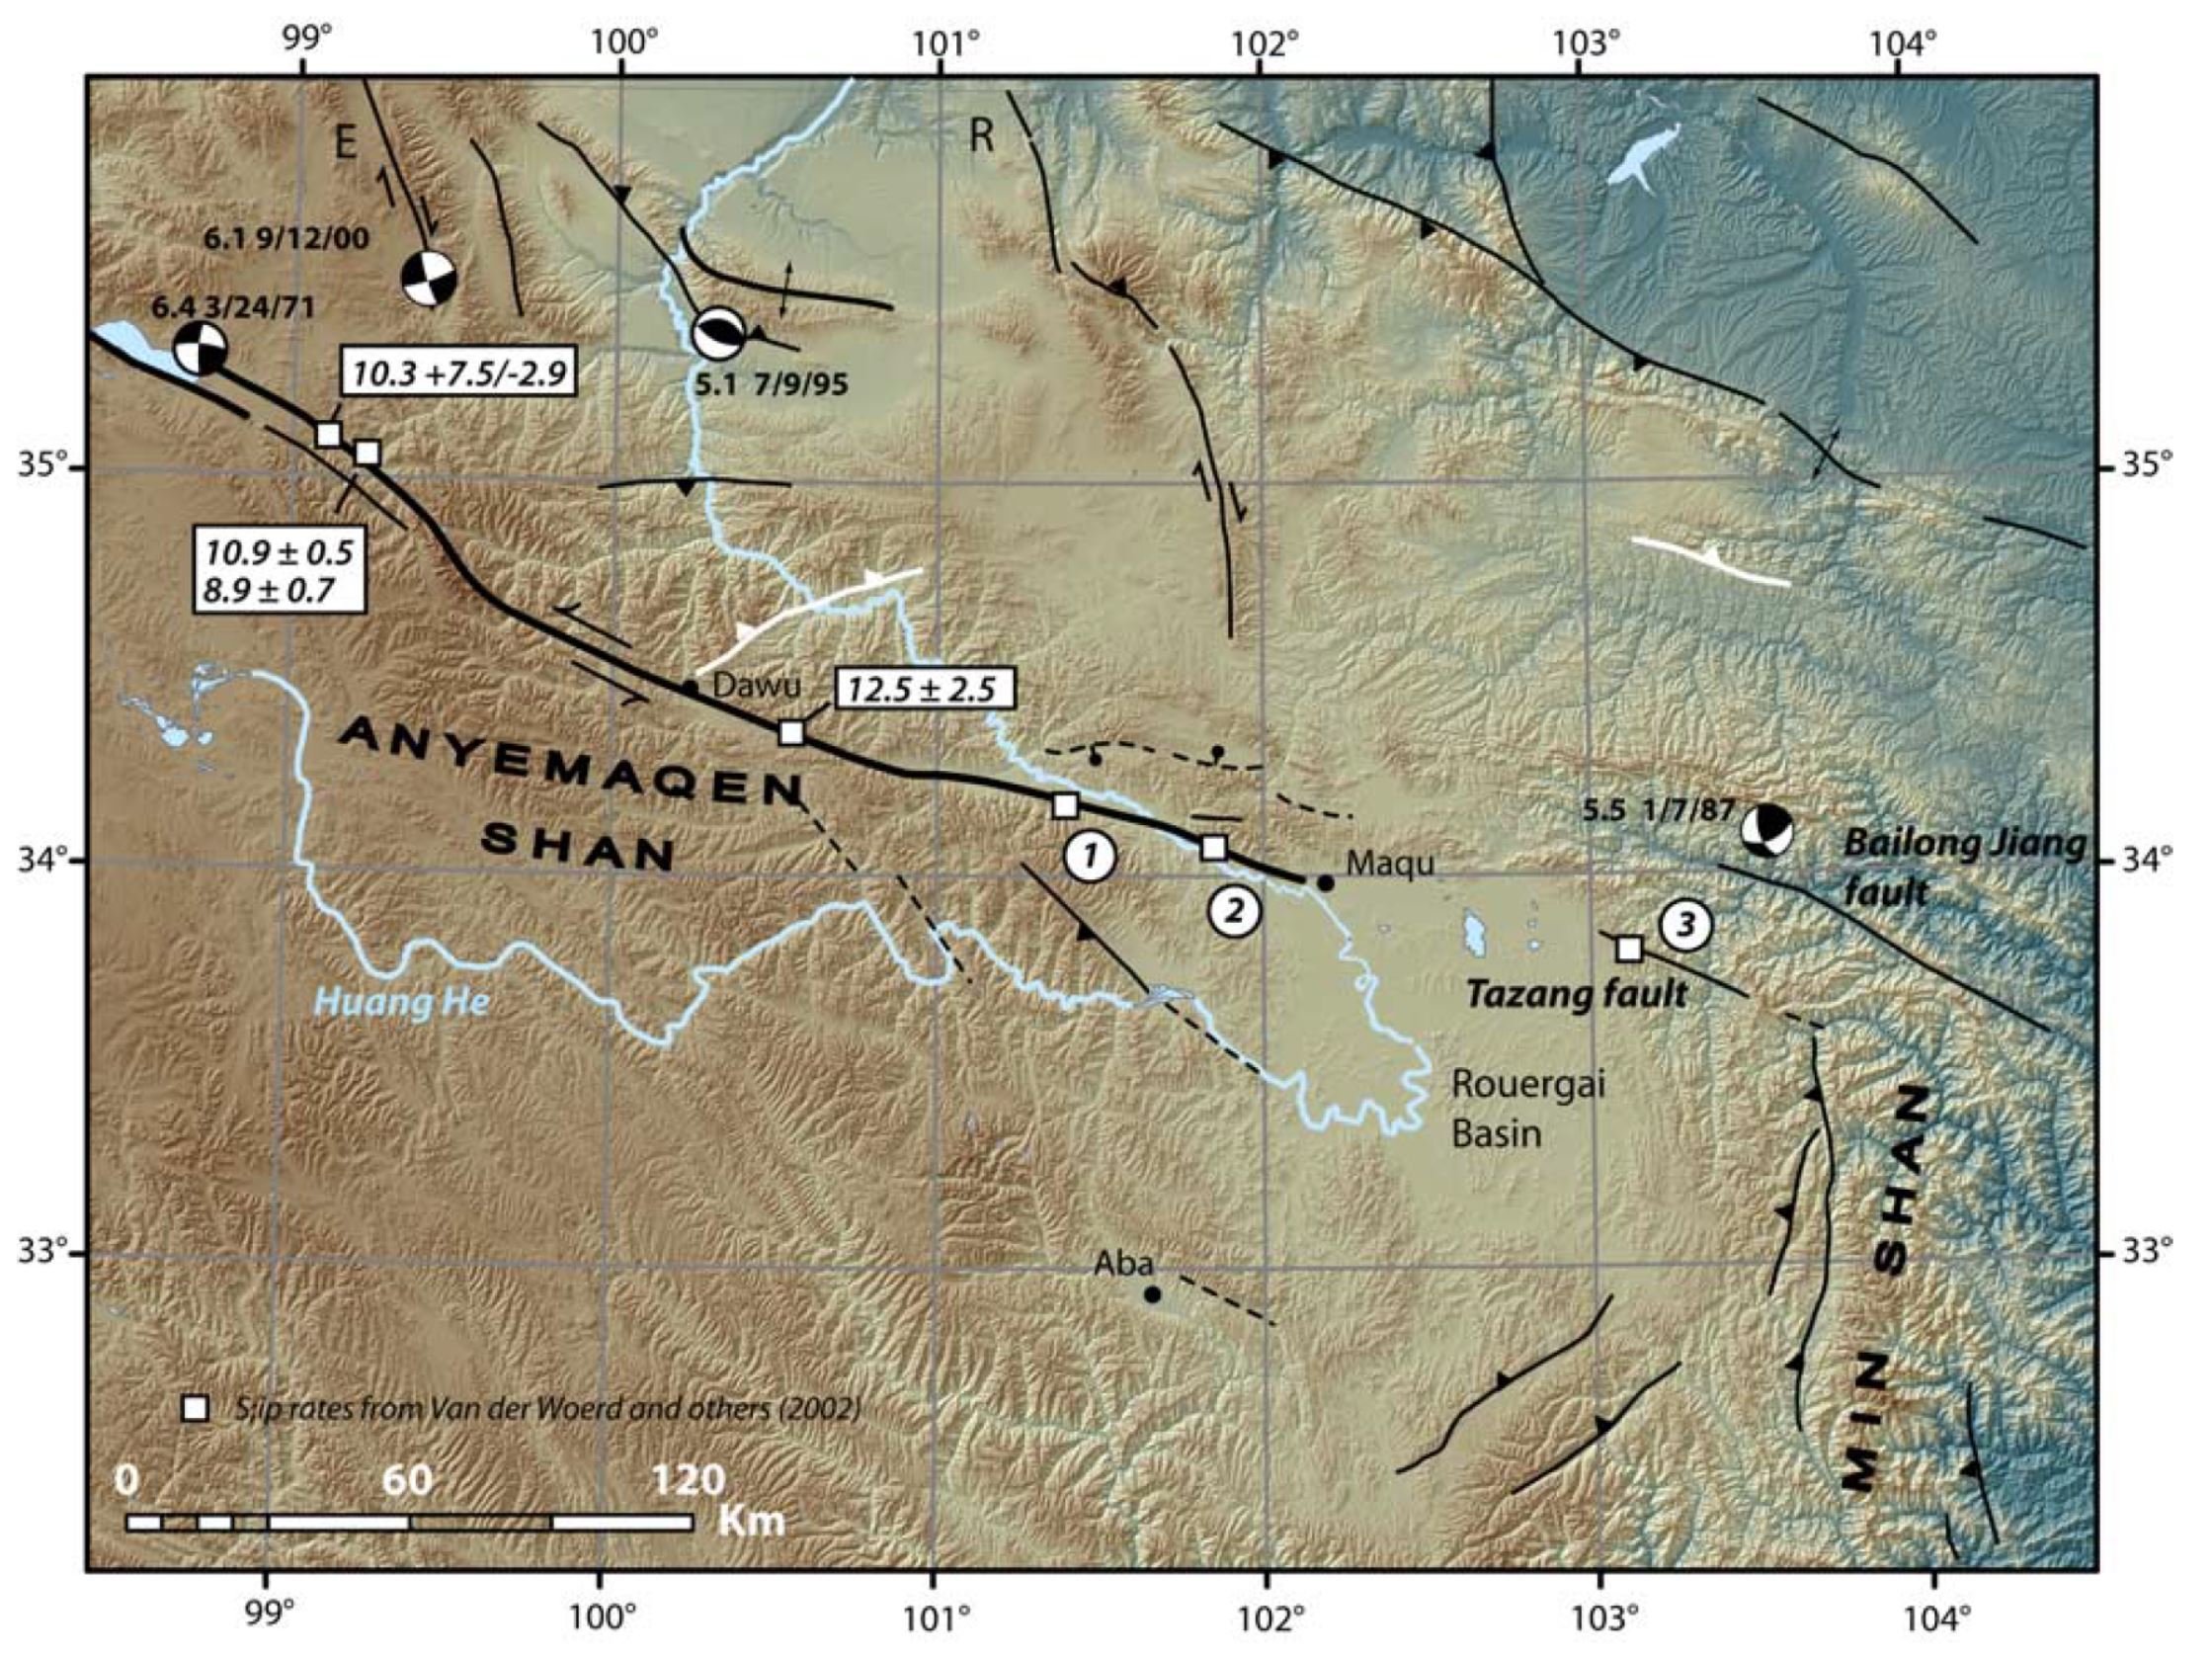
Map of the eastern segment of the Kunlun fault showing location of active faults and major physiographic features. Active faults are represented by heavy lines; dashed where recent activity is inferred. Yellow River (Huang He) is shown as blue line. White boxes represent slip rate estimates (mm/yr) [Van der Woerd et al., 2002b]. Locations of new slip rate determinations are labeled in white circles (1, 2, 3). Focal mechanisms are compiled from USGS (http://neic.usgs.gov/neis/epic/epic_circ.html).
- Here is the large scale map from Yong et al. (2009). I include their figure caption below in blockquotes.
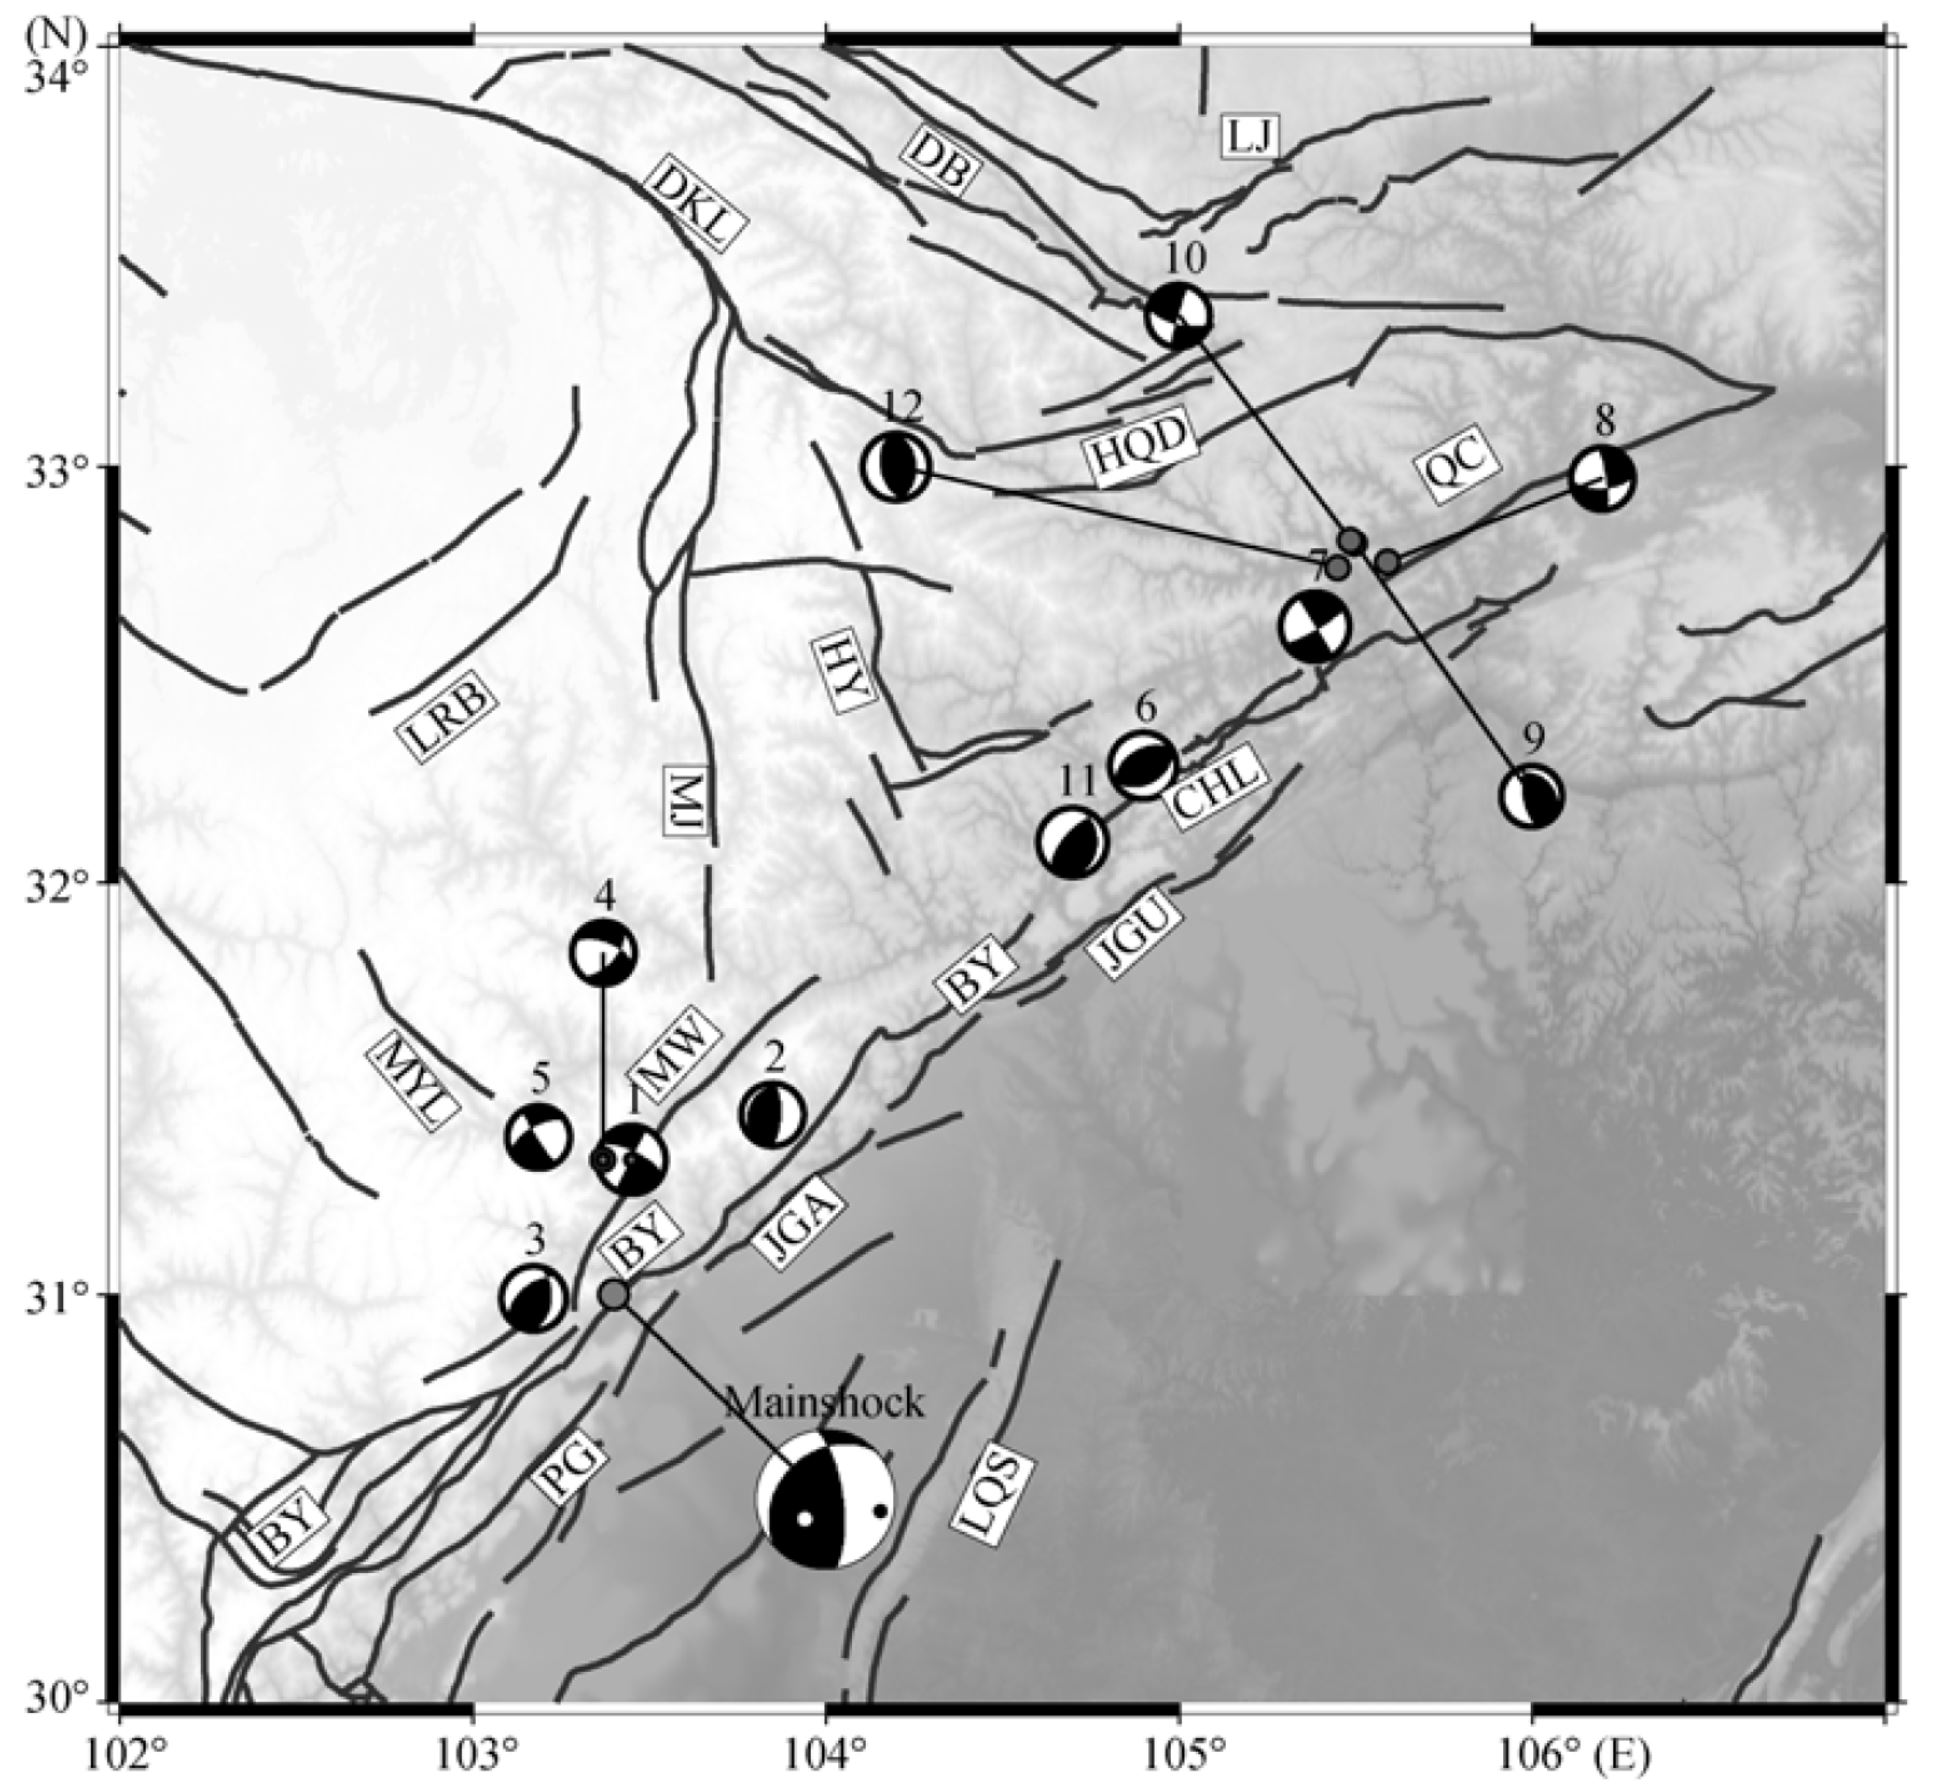
Focal mechanisms of Wenchuan earthquake aftershocks with Ms≥5.6. The numbers 1-12 are the indexes of the aftershocks (1―10 are the same as Table 2). The focal mechanism of the Wenchuan main event comes from the result of Harvard CMT solution. The black lines are the Quaternary faults. The abbreviated names of the faults are the same as Figure 2.
- Here is a figure from Yong et al. (2003) that shows the development of these large strike-slip faults (e.g. the Kunlun fault) prior to the collision of India with Asia. These faults, at this time, were thrust faults. The Longmen Shan fault system is labeled LSFB in the lower panel. I include their figure caption below in blockquotes.
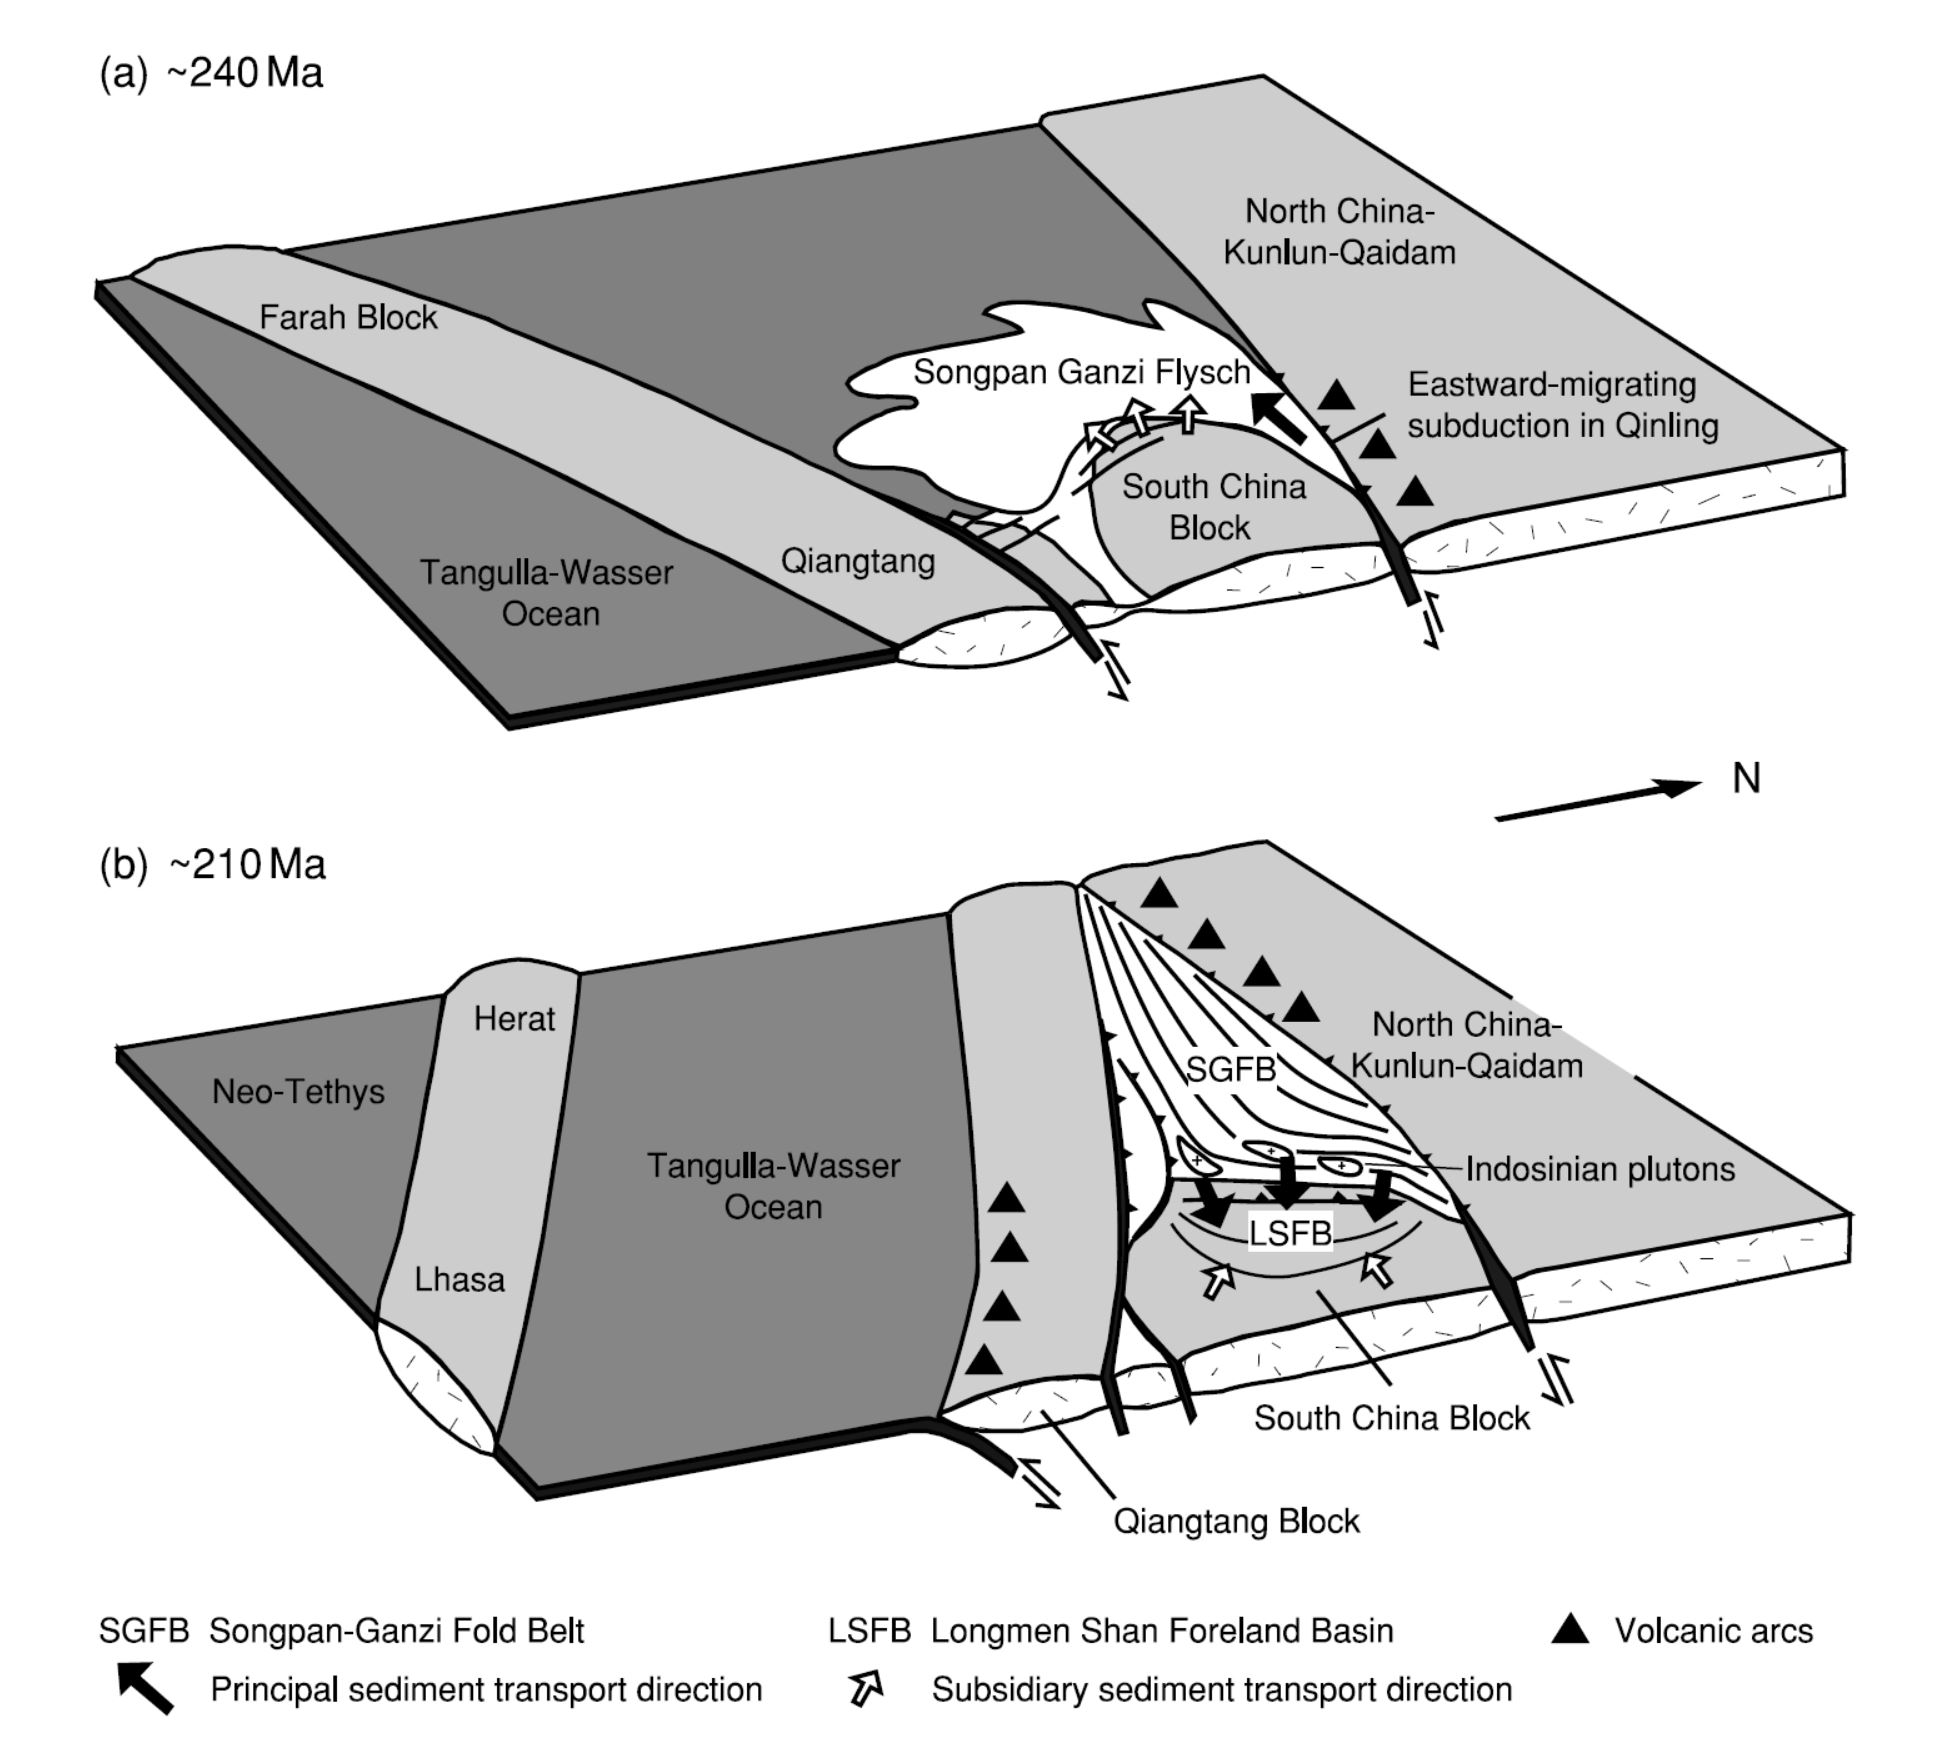
Cartoons showing geological evolution from South China Block passive margin flaking a deep remnant ocean basin accumulating sediments of the Songpan-Ganzi Complex in (a), to oceanic closure, telescoping of the Songpan-Ganzi Complex and South China margin and formation of the Longen Shan Foreland Basin as a flexural foredeep in (G). Modified from Harrowfield (2001).
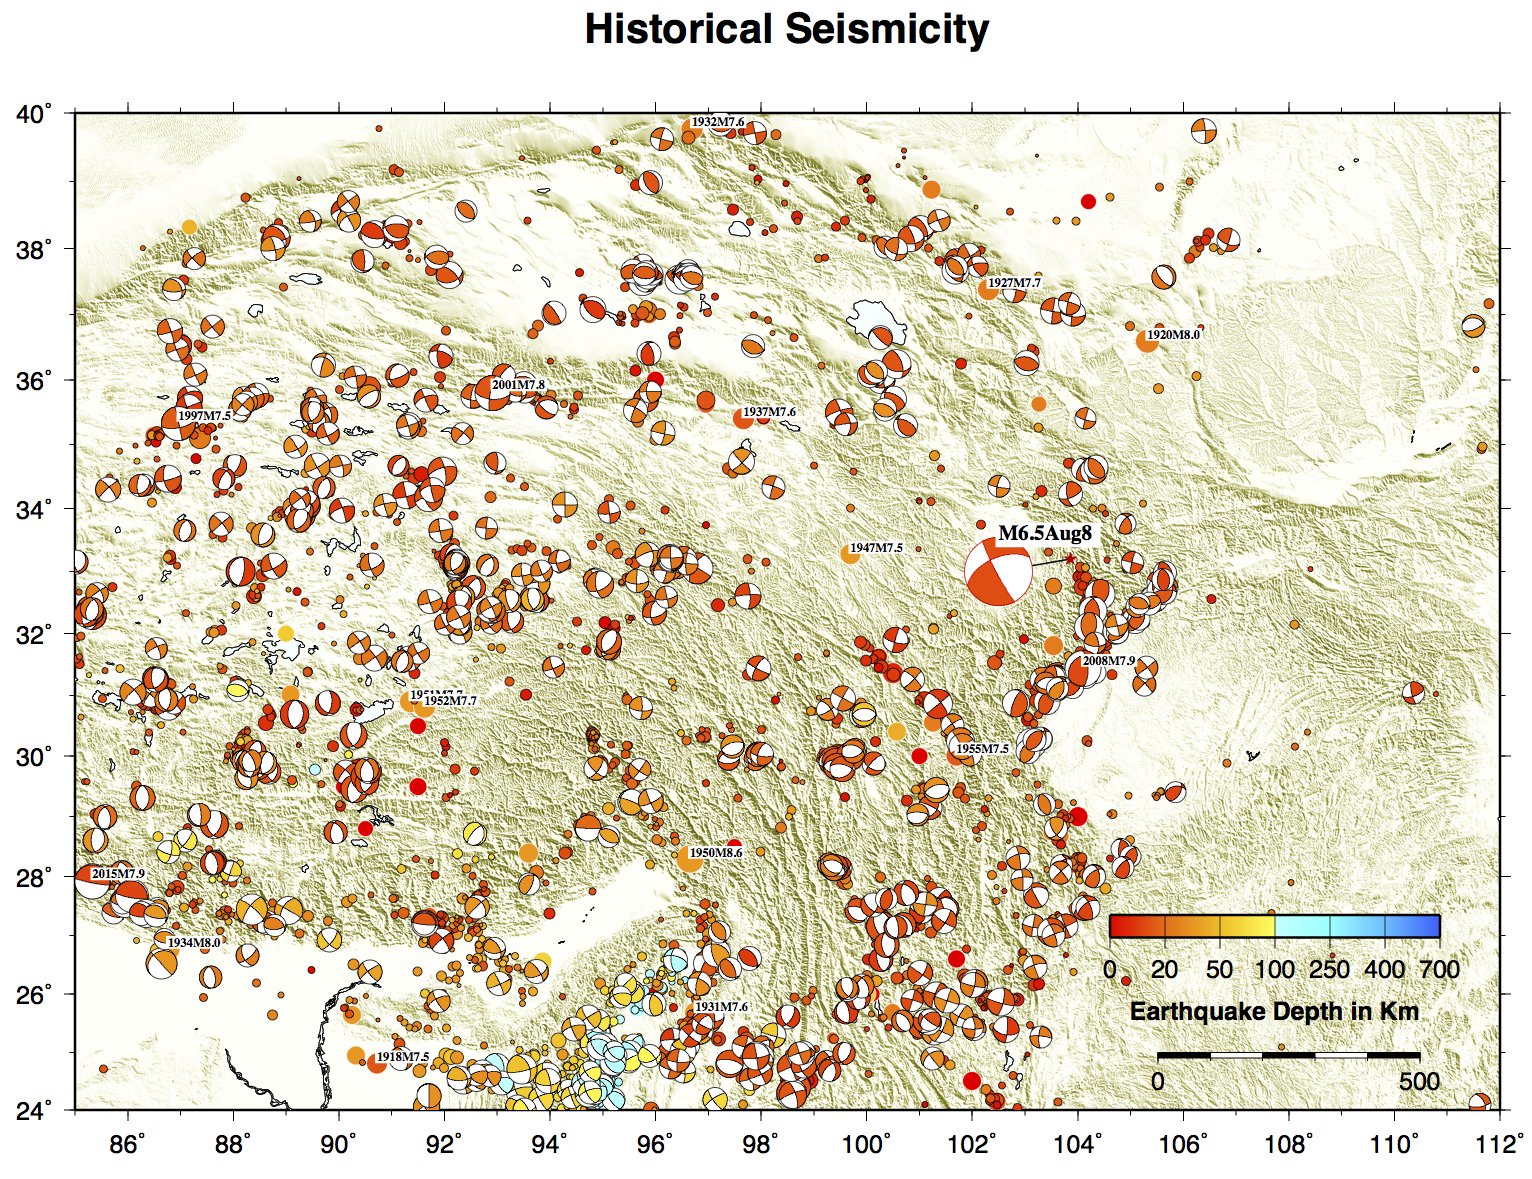
- Here is a map from Jacha Polet, a seismologist at Cal Poly Pomona. They plot moment tensors from their compiled historic database.
- Here is a figure from Gorum et al. (2008) that shows the epicenters from the Wenchuan Earthquake sequence, along with faults and historic earthquakes. I include their figure caption below in blockquotes.
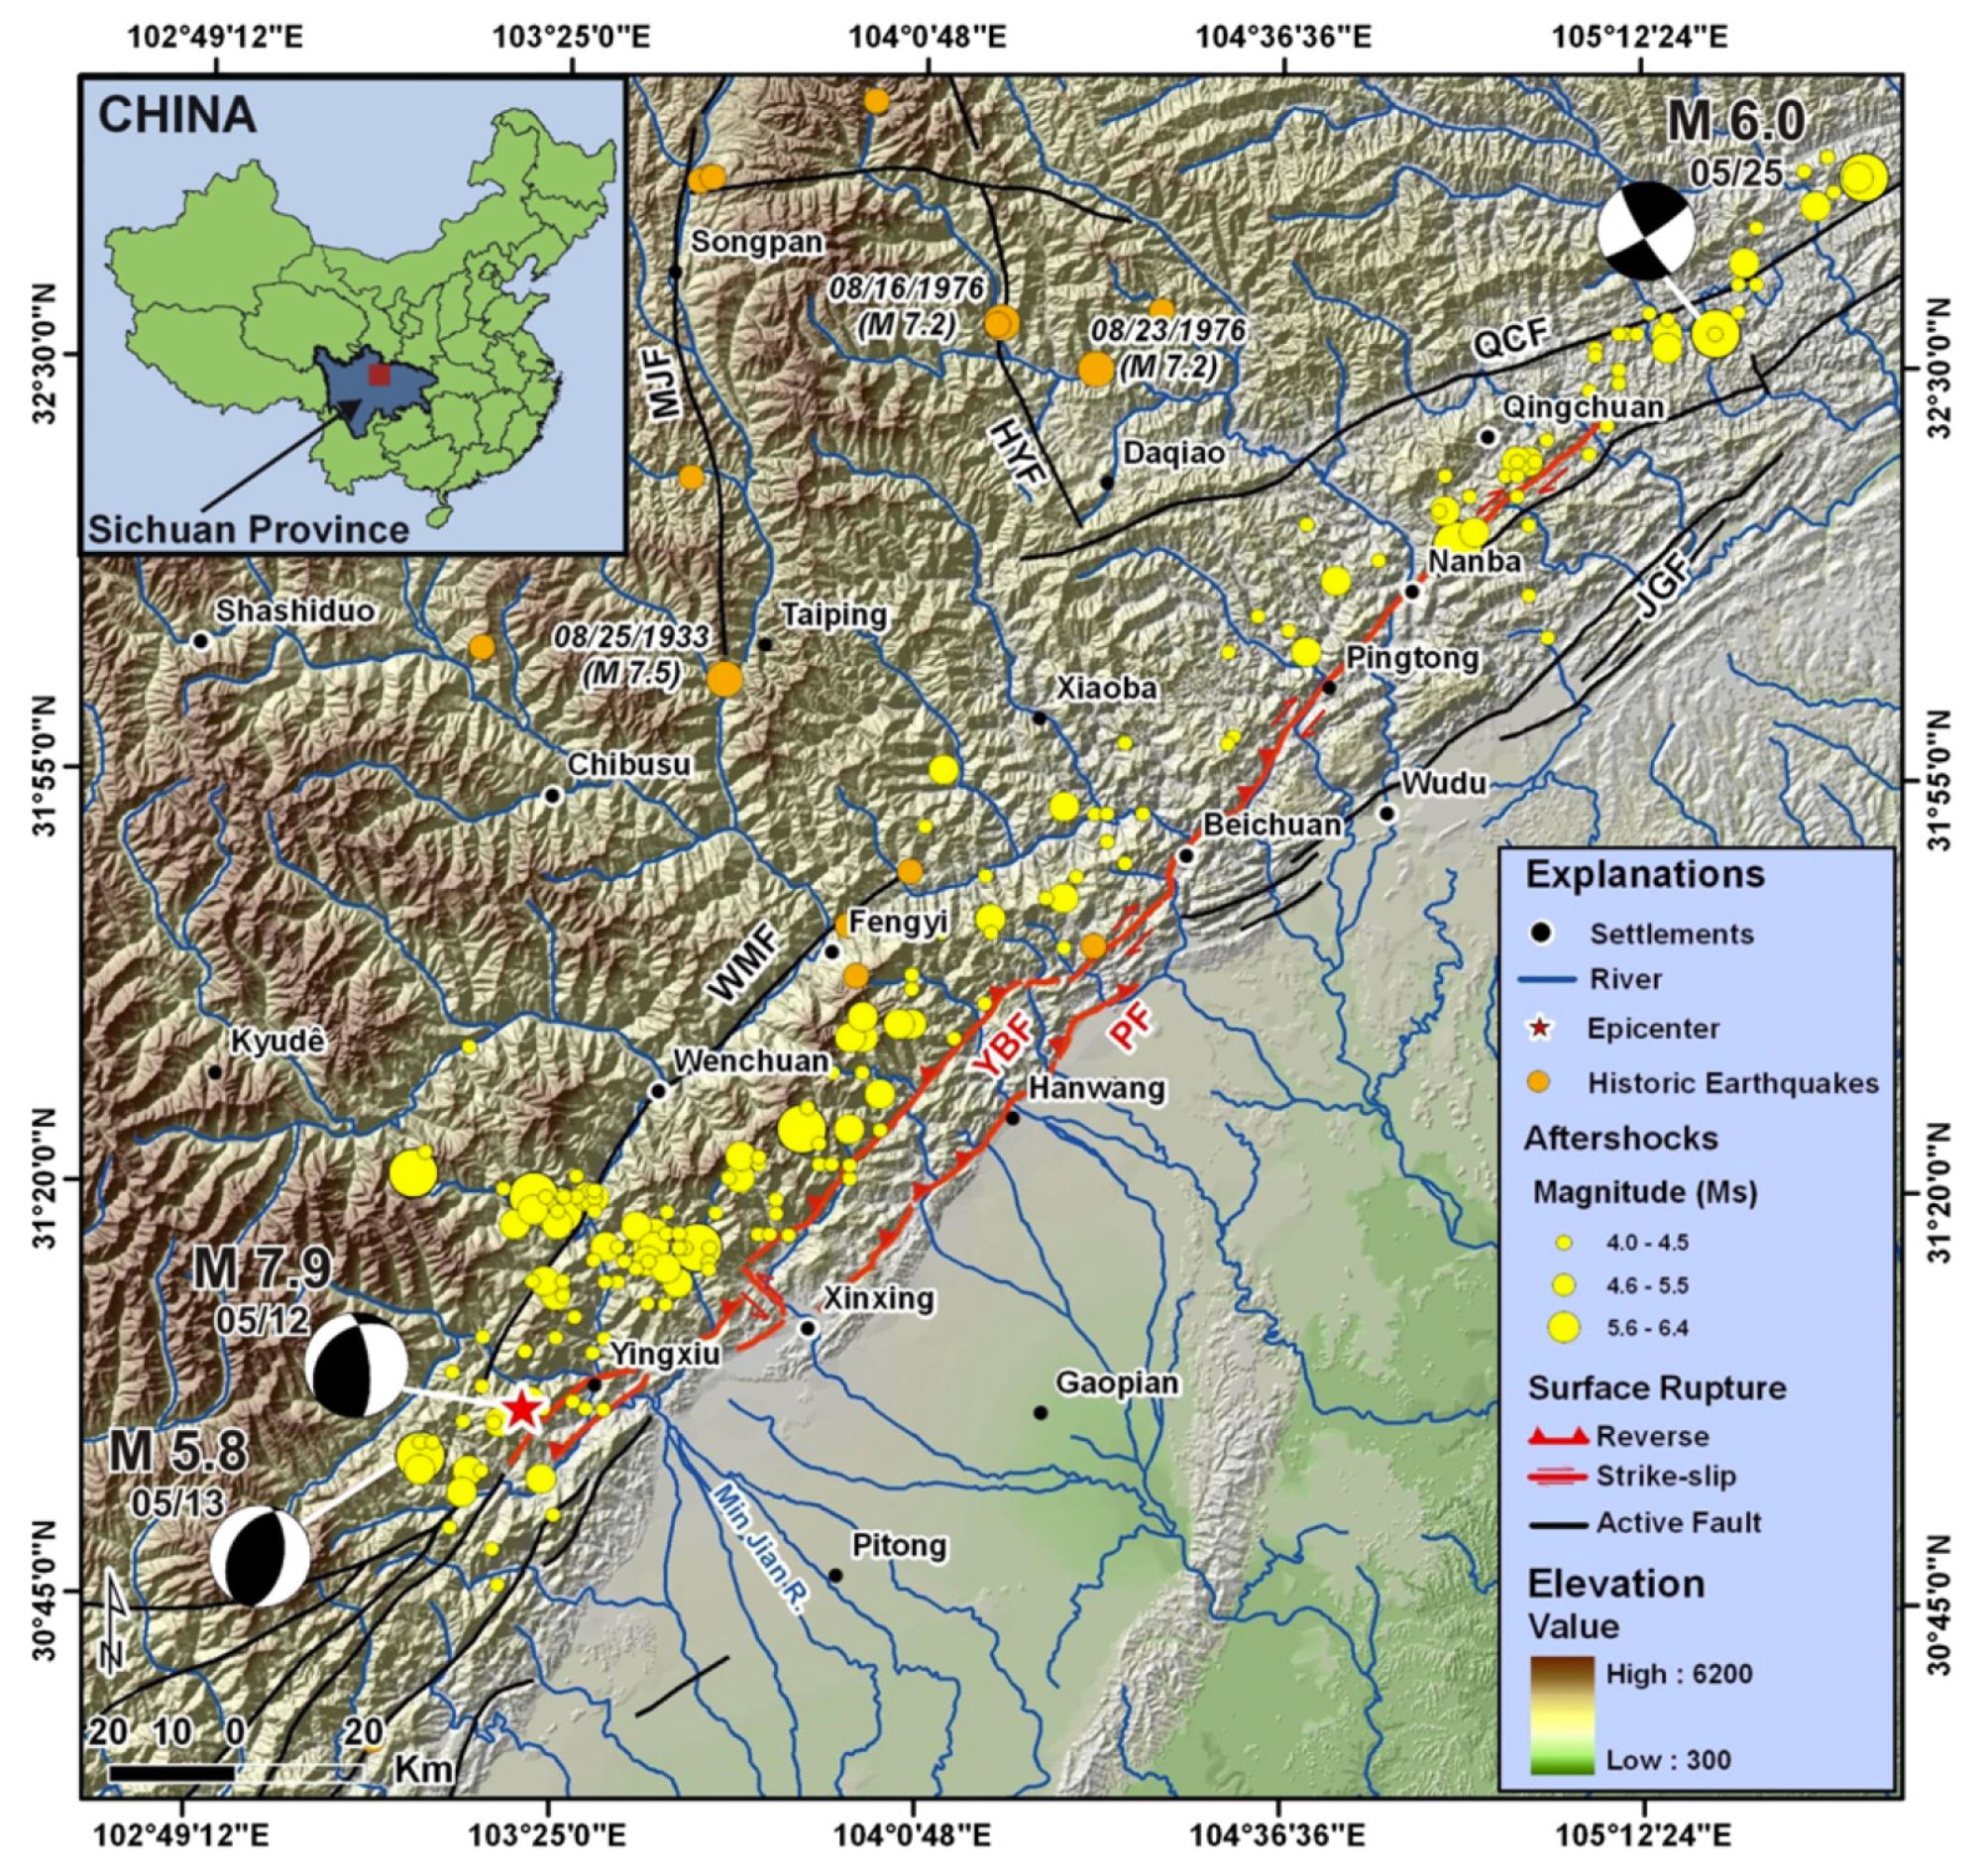
Location and 12May 2008Wenchuan earthquake fault surface rupturemap, and focalmechanisms of the main earthquake (12May) and two of the major aftershocks (13 May and 25 May). Also the epicenters of historic earthquakes are indicated. The following faults are indicated: WMF: Wenchuan–Maowen fault; BF: Beichuan–Yingxiu fault; PF: Pengguan fault; JGF: Jiangyou–Guanxian fault; QCF: Qingchuan fault; HYF: Huya fault;MJF:Minjian fault based on the following sources: (Surface rupture: Xu et al., 2009a,b; Epicenter and aftershocks: USGS 2008; Historic earthquakes: Kirby et al., 2000; Li et al., 2008; Xu et al., 2009a,b).
- Here is a figure from Gorum et al. (2008) that shows the relations between earthquake slip (proxy for ground shaking) and landslide concentration (the number of landslides per square kilometer). I include their figure caption below in blockquotes.
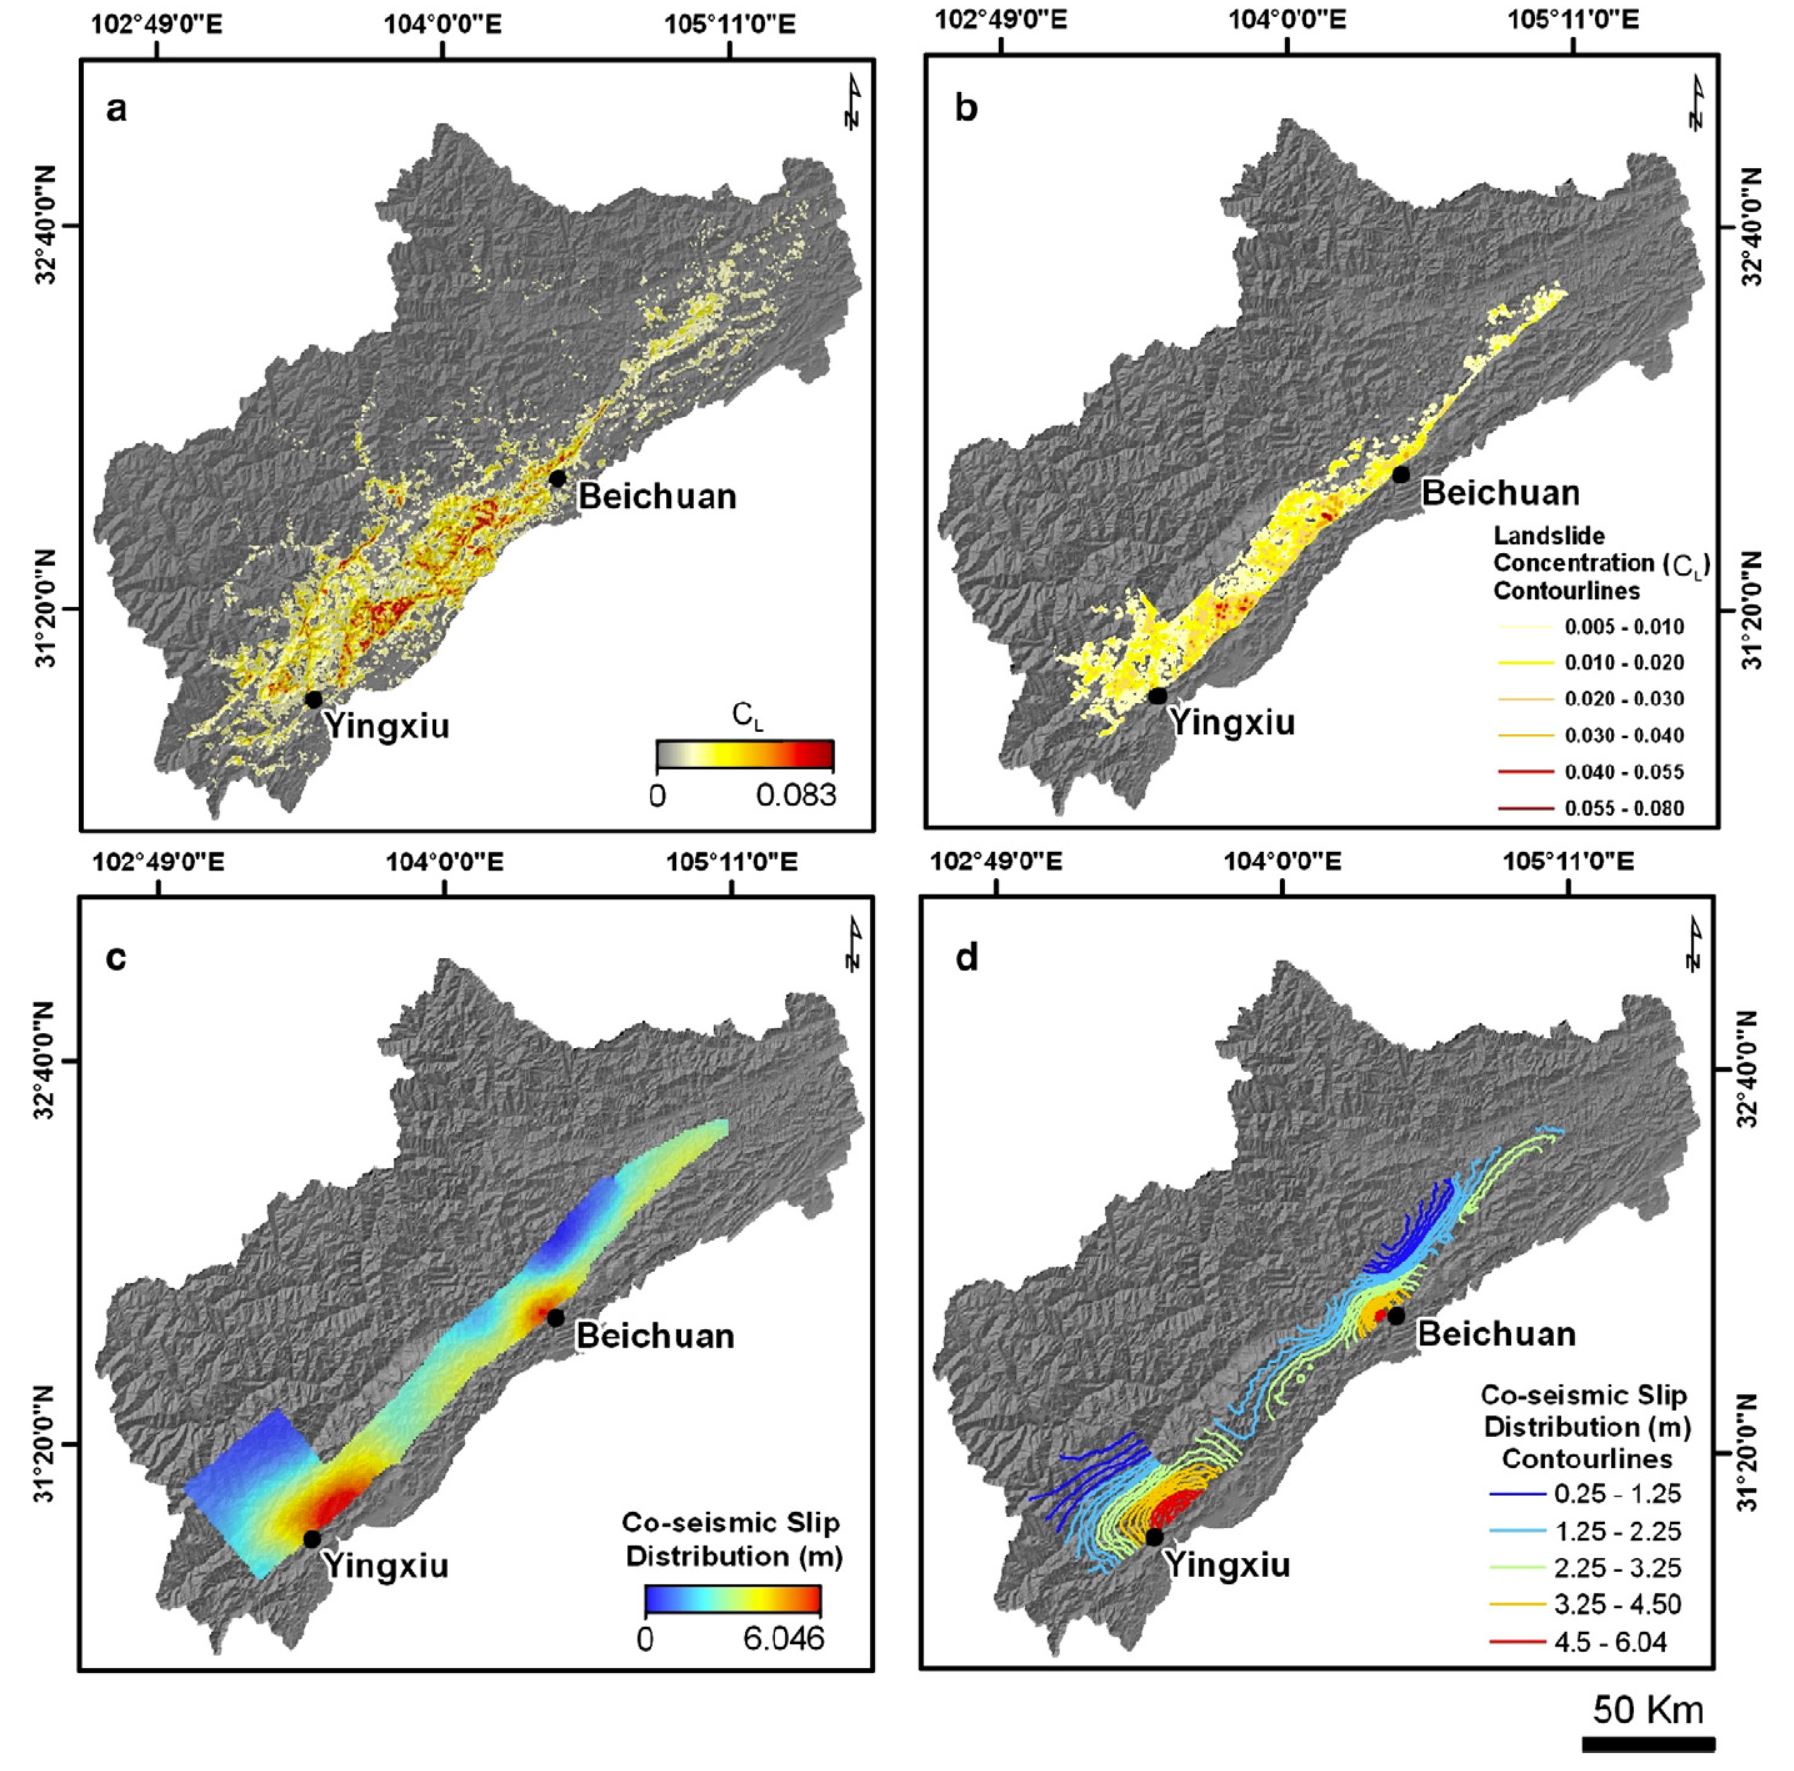
Landslide concentration in relation to the total co-seismic slip distribution of the fault rupture (co-seismic slip distribution model is from Shen et al., 2009). a: The landslide concentration; b: contour lines of landslide concentration clipped for the projected fault plane boundary; c: the co-seismic slip distribution; d: contour lines of co-seismic slip distribution.
- 2015.04.27 Nepal Seismicity
- 2011.03.11 Summary of the M 9.0 Japan (Tohoku-Oki)
- 2017.08.08 M 6.5 China
- 2017.02.08 M 6.3 Makran subduction zone (Pakistan)
- 2016.08.24 M 6.8 Burma
- 2016.07.29 M 7.7 Mariana
- 2016.02.23 M 5.9 Antarctic plate
- 2016.02.05 M 6.4 Taiwan
- 2016.02.05 M 6.4 Taiwan Update #1
- 2015.12.04 M 7.1 SE India Ridge
- 2015.10.27 M 7.5 Afghanistan
- 2015.04.26 M 7.8 Nepal
Earthquake Reports: India | Asia | India Ocean
General Overview
Earthquake Reports
- Goldfinger, C., Ikeda, Y., Yeats, R.S., and Ren, J., 2013. Superquakes and Supercycles in Seismological Research Letters, v. 84, no. 1, doi: 10.1785/0220110135
- Kirby, E., Harkins, N., Wang, E., Shi, X., Fan, C., and Burbank, D., 2007. Slip rate gradients along the eastern Kunlun fault in Tectonics, v. 26, doi:10.1029/2006TC002033
- Yong, L., Allen, P.A., Densmore, A.L., and Qiang, X., 2003. Evolution of the Longmen Shan Foreland Basin (Western Sichuan, China) during the Late Triassic Indosinian Orogeny in Basin Research, v. 15, p. 115-138
- Yong, Z., HongSheng, M., Jian, L., SiDao, N., YingChun, L., and ShengJi, W./, 2009. Source mechanism of strong aftershocks (Ms≥5.6) of the 2008/05/12 Wenchuan earthquake and the implication for seismotectonics in Science in China Series D: Earth Sciences, v. 52, no. 6, p. 739-753, doi: 10.1007/s11430-009-0074-3
- Zheng, Y-F., Xiao, W-J., and Zhao, G., 2013. Introduction to tectonics of China in Gondwana Research, v. 23, p. 1189-1206.