
This morning we had an earthquake offshore of Guatemala with a magnitude M = 6.8. Here is the USGS website for this earthquake. This earthquake occurred to the east of a sequence from about a week ago. Here is my earthquake report for that sequence.
Offshore of Guatemala is a subduction zone thrust fault, where the Cocos plate dives east beneath the North America (in the north) and Caribbean plates (in the south). Subduction zone faults are capable of generating the largest magnitude earthquakes possible because the fault width is wider than other faults. The seismogenic zone, the region of the crust that can store elastic strain and experience brittle rupture during earthquakes, extends into the earth several tens of kms. Strike-slip faults generally dip vertically, giving them the narrowest fault width. While subduction zones dip at an angle, so their fault width is wider. Earthquake magnitude is a measure of energy released during the earthquake and the moment magnitude (the magnitude most people use) is based on three factors: (1) fault area, (2) fault slip, and (3) shear modulus (how flexible, or rigid, the crust/lithosphere is). Fault area is length times width. Length is the distance on the ground surface that the fault ruptures and width is the distance into the earth that the fault ruptures. Because subduction zone faults dip into the earth at an angle, the distance that they extend before reaching a given depth is larger, owing to a larger possible magnitude.
Today’s M 6.8 earthquake has a USGS hypocentral depth of ~47 km, which is very close to the depth of the subduction zone fault. Also, the fault plane solution (moment tensor, read below) is compressional. Thus, I interpret this earthquake to be a subduction zone earthquake at or near the megathrust. This earthquake is different from the sequence from a week ago. Those earthquakes had two populations: (1) earthquakes in the accretionary prism of the subduction zone and (2) earthquakes in the downgoing Cocos plate. Those earthquakes were not subduction zone earthquakes (though the shallower earthquakes may not have had well located hypocenters, so their depths are suspect… and could have been on the subduction zone). I suspect that this M 6.8 earthquake is related to the earthquakes from last week. I include the moment tensors for 2 of the significant earthquakes from last week. See my report for more on that sequence.
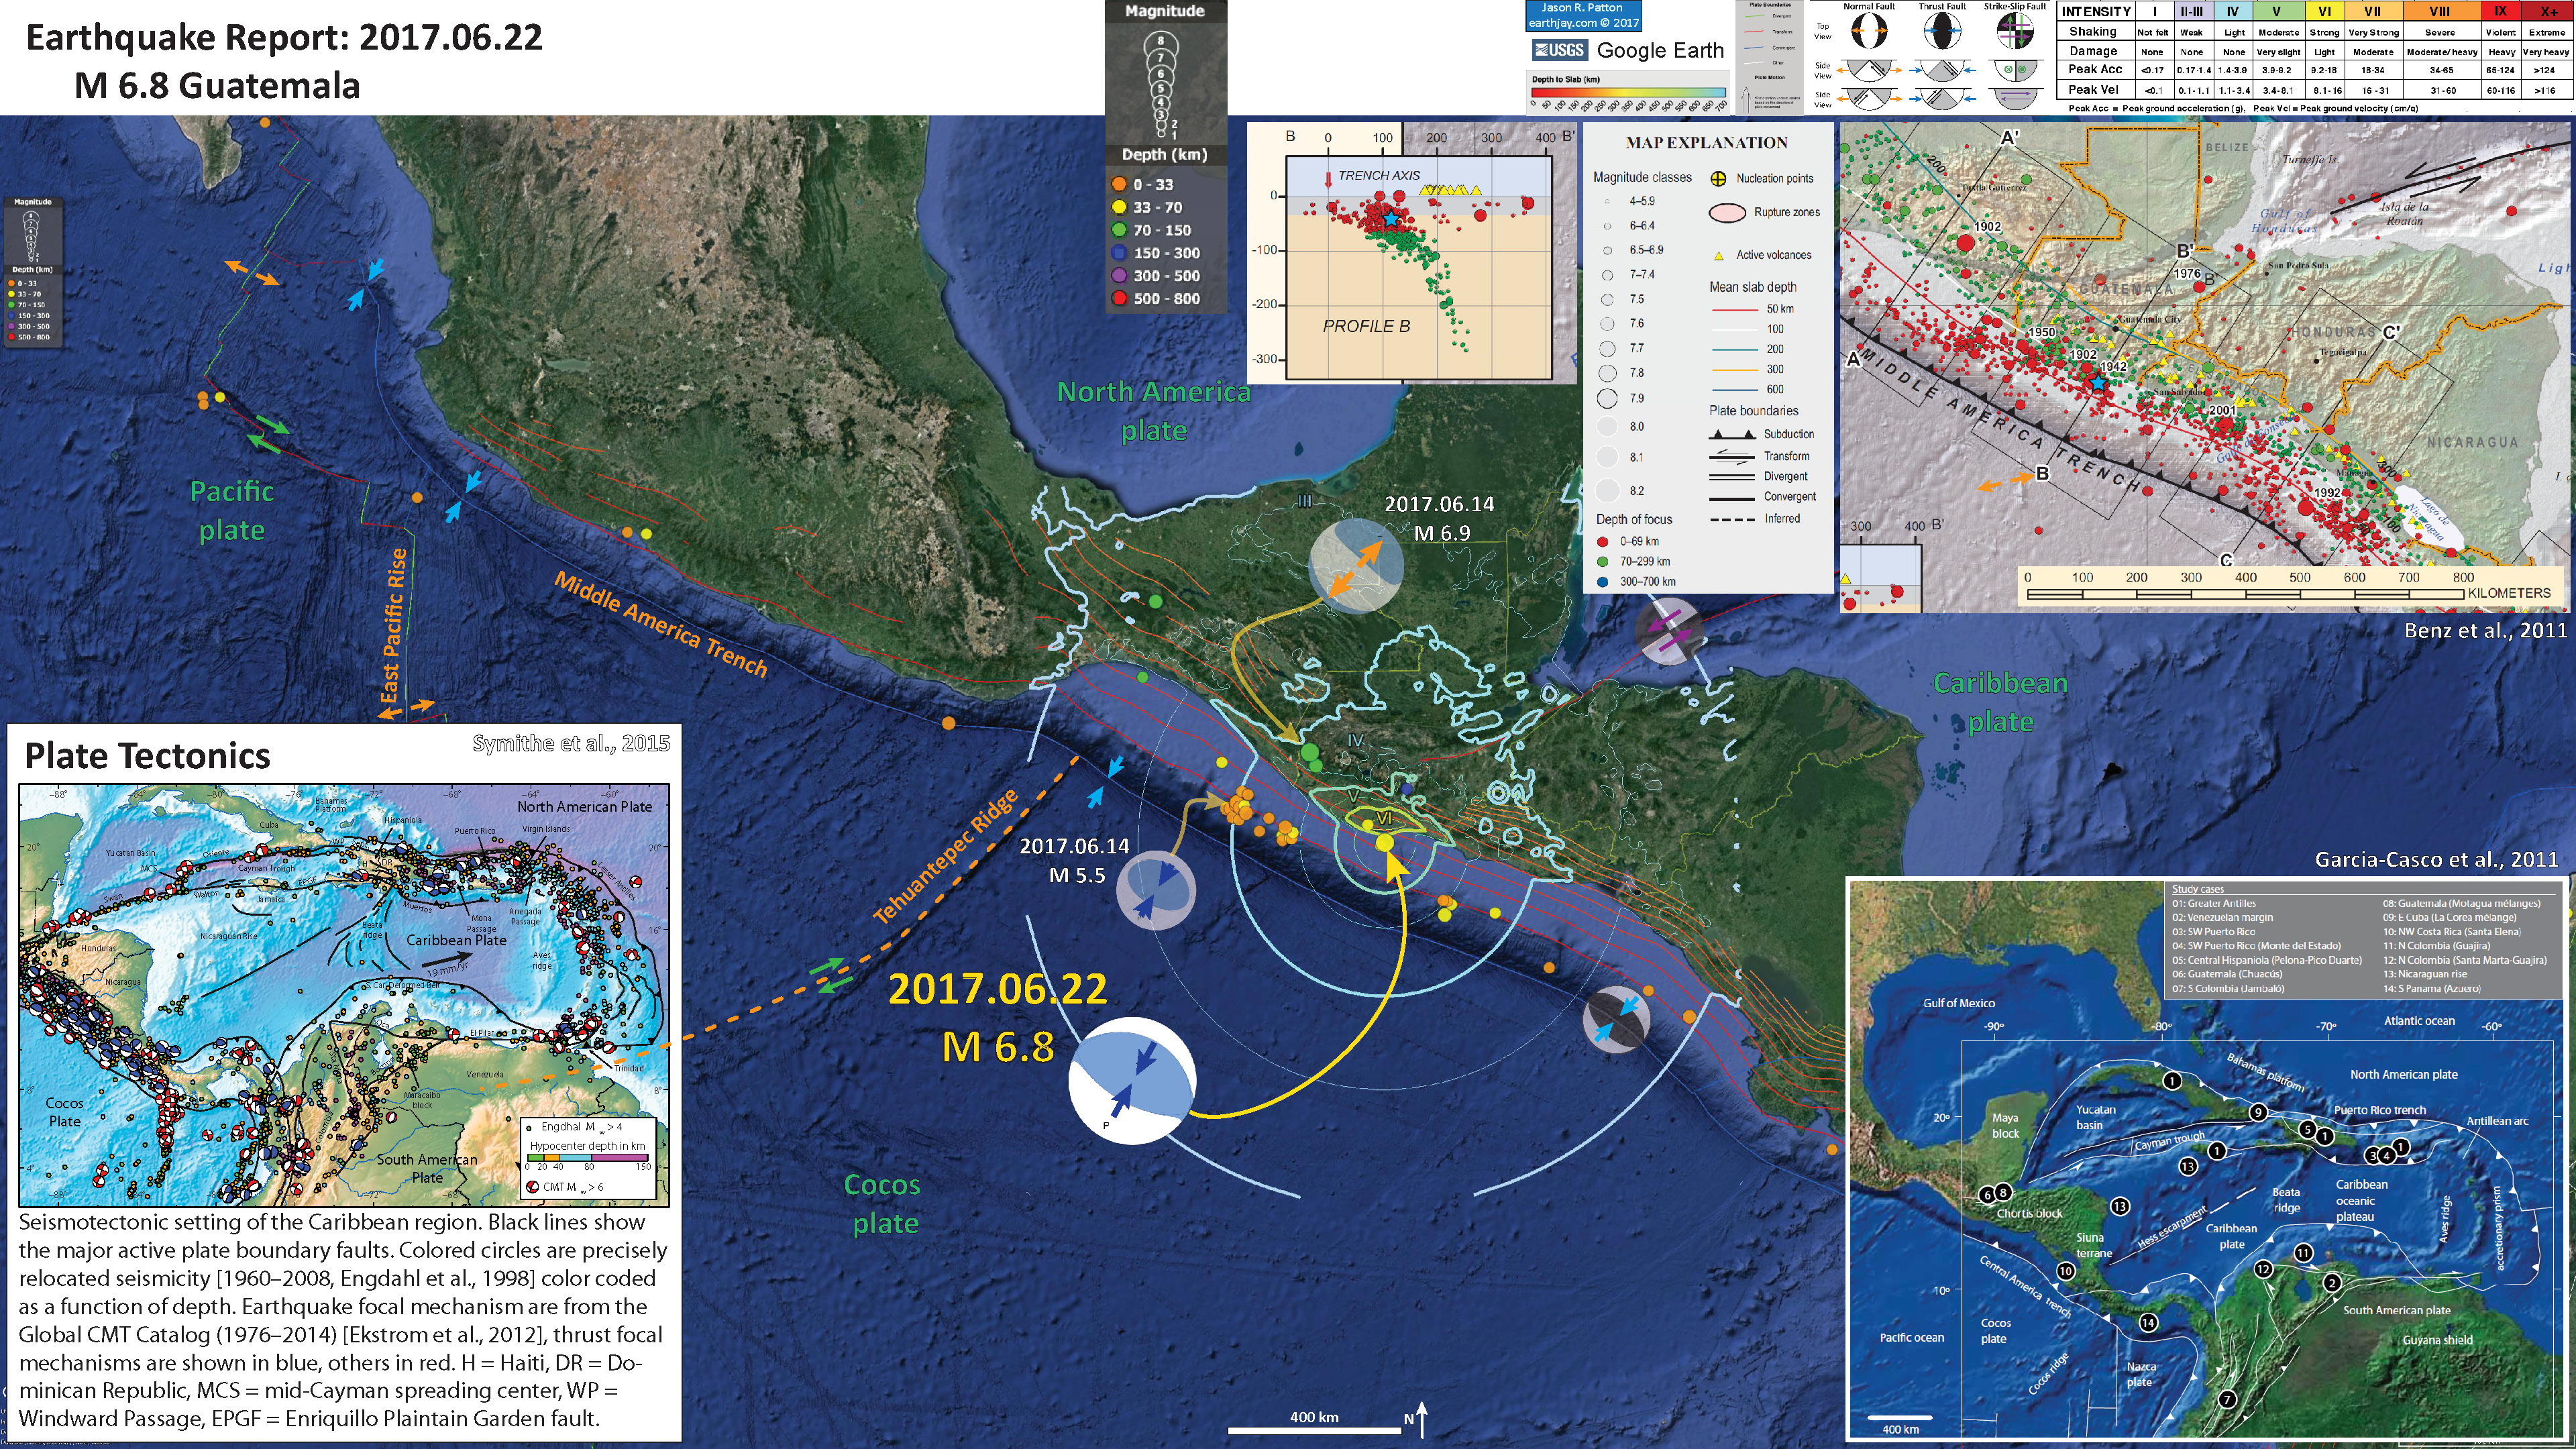
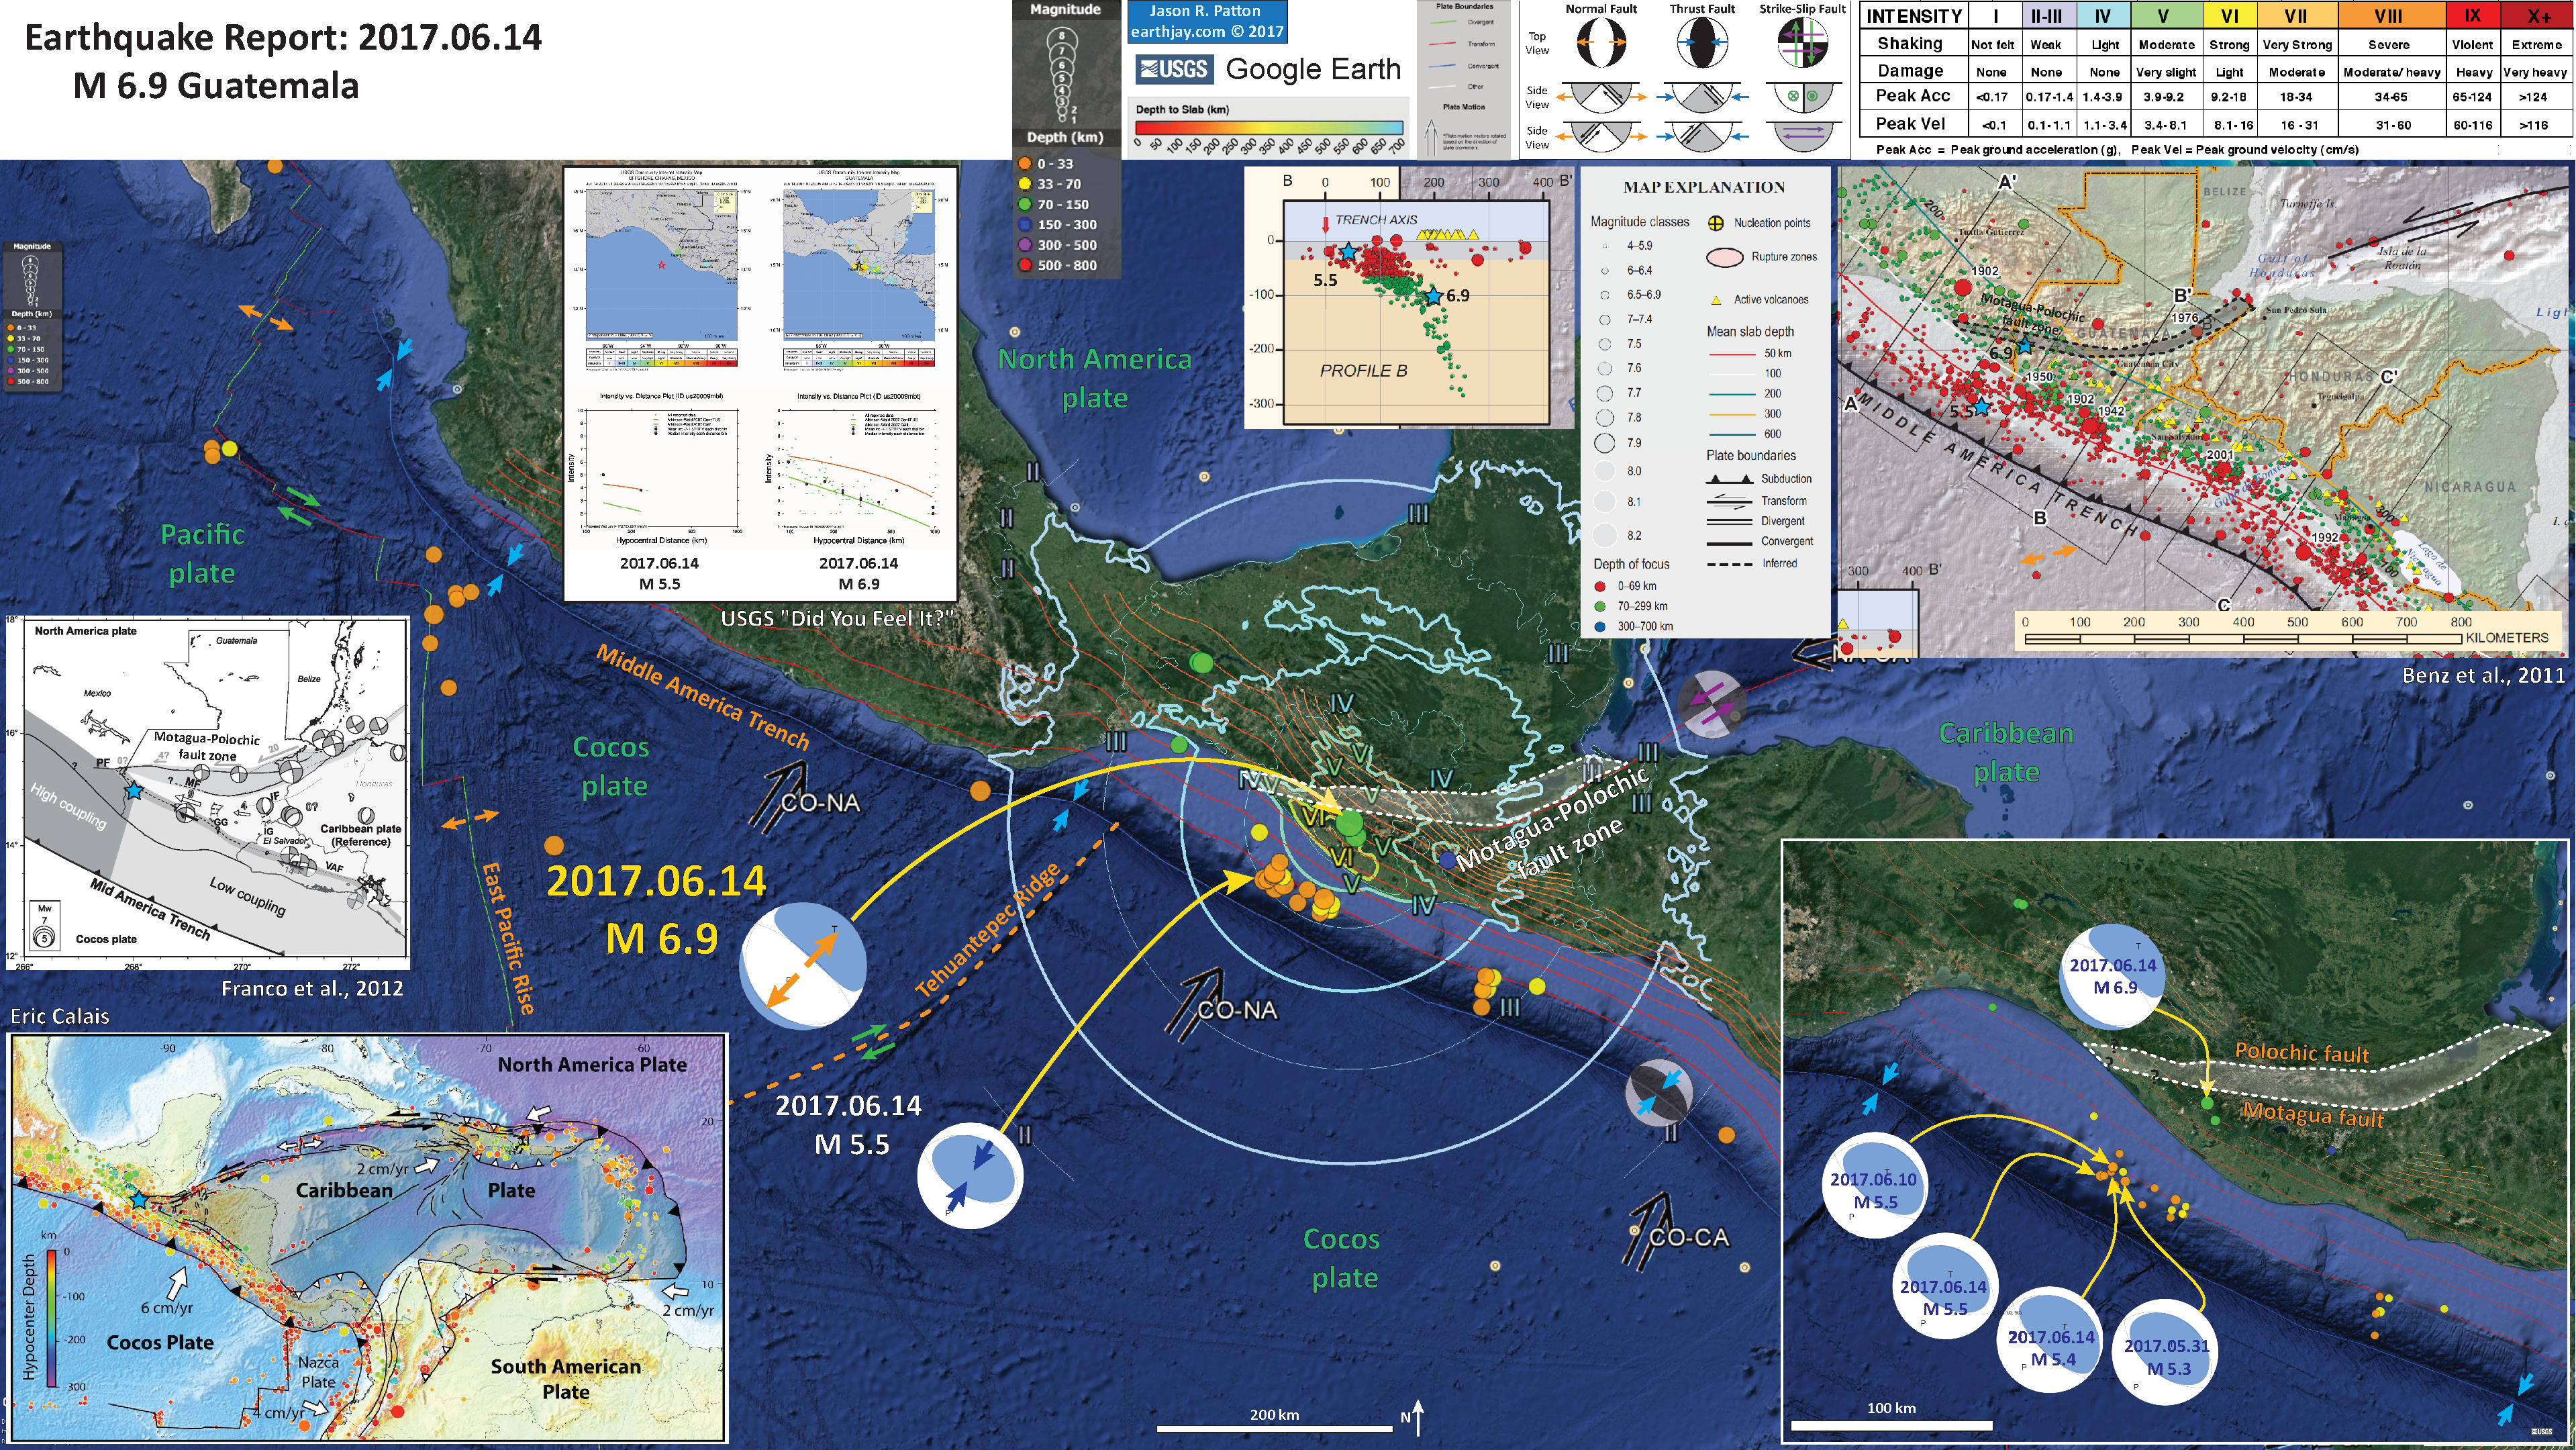
Below is my interpretive poster for this earthquake.
I plot the seismicity from the past month, with color representing depth and diameter representing magnitude (see legend).
- I placed a moment tensor / focal mechanism legend on the poster. There is more material from the USGS web sites about moment tensors and focal mechanisms (the beach ball symbols). Both moment tensors and focal mechanisms are solutions to seismologic data that reveal two possible interpretations for fault orientation and sense of motion. One must use other information, like the regional tectonics, to interpret which of the two possibilities is more likely.
- I also include the shaking intensity contours on the map. These use the Modified Mercalli Intensity Scale (MMI; see the legend on the map). This is based upon a computer model estimate of ground motions, different from the “Did You Feel It?” estimate of ground motions that is actually based on real observations. The MMI is a qualitative measure of shaking intensity. More on the MMI scale can be found here and here. This is based upon a computer model estimate of ground motions, different from the “Did You Feel It?” estimate of ground motions that is actually based on real observations.
- I include the slab contours plotted (Hayes et al., 2012), which are contours that represent the depth to the subduction zone fault. These are mostly based upon seismicity. The depths of the earthquakes have considerable error and do not all occur along the subduction zone faults, so these slab contours are simply the best estimate for the location of the fault. The hypocentral depth of the M 6.8 plots this close to the location of the fault as mapped by Hayes et al. (2012).
- In the upper right corner, I include a subset of figures from Benz et al. (2011). There is a map that shows USGS epicenters with dots colored by depth and magnitude represented by circle diameter. There is also plotted a cross section that is adjacent (southeast) to this earthquake sequence. Cross section B-B’ shows the earthquake hypocenters along a profile displayed on the map. Note how the subduction zone dip steepens to the northeast. On the map and the cross section, I place a blue stars in the location for the M 6.9 and the 6/14 M 5.5 earthquakes.
- In the lower right corner is a tectonic map showing the regional tectonics highlighting various study sites from sedimentary, magmatic, metamorphic and ore deposit studies of the subduction zones here (Garcia-Casco et al., 2011).
- In the lower left corner is a map that shows the plate tectonic setting for this region of Middle America (Symithe et al., 2015). Earthquake epicenters are plotted as circles with color representing depth. Earthquake focal mechanisms are plotted with thrust earthquakes plotted in blue and other mechanisms plotted in red. Today’s earthquake happened just off this map on the left.
I include some inset figures in the poster.
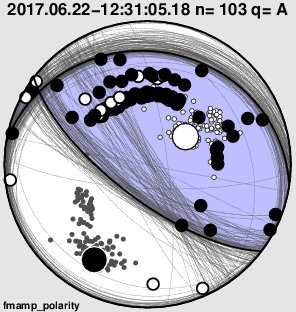
- Here is Anthony Lomax’s first motion mechanism.
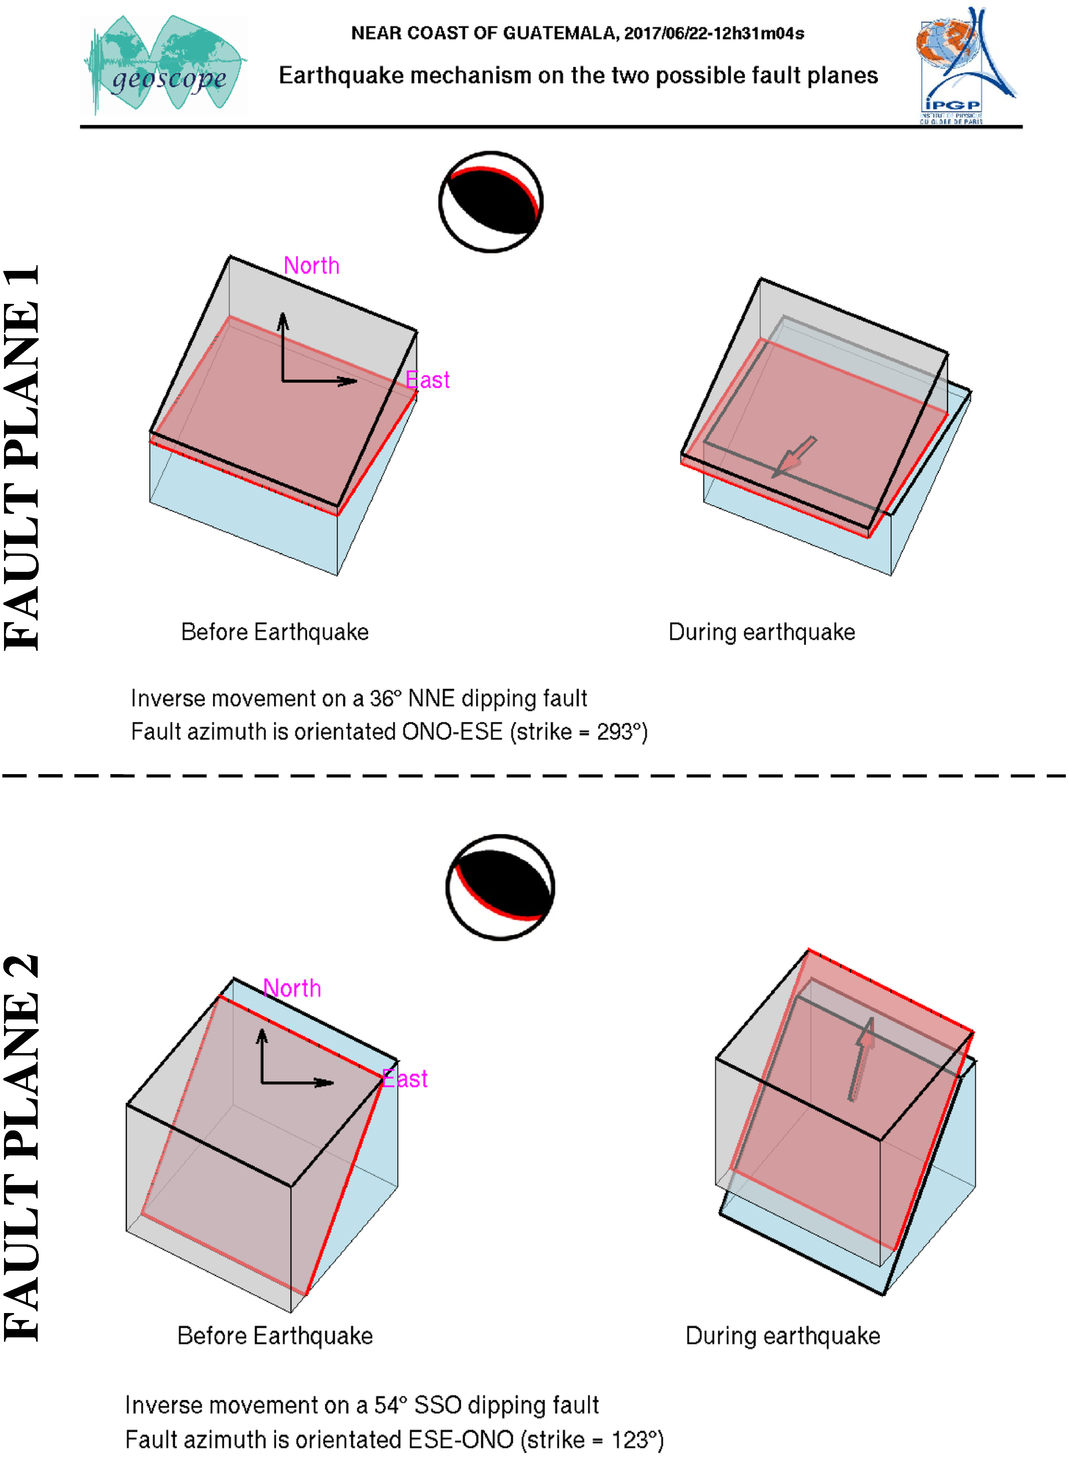
- Here is an explanation from IPGP that helps us visualize the two potential fault planes (the principal and the auxiliary). I interpret this earthquake to have occurred on fault plane 1, the subduction zone.
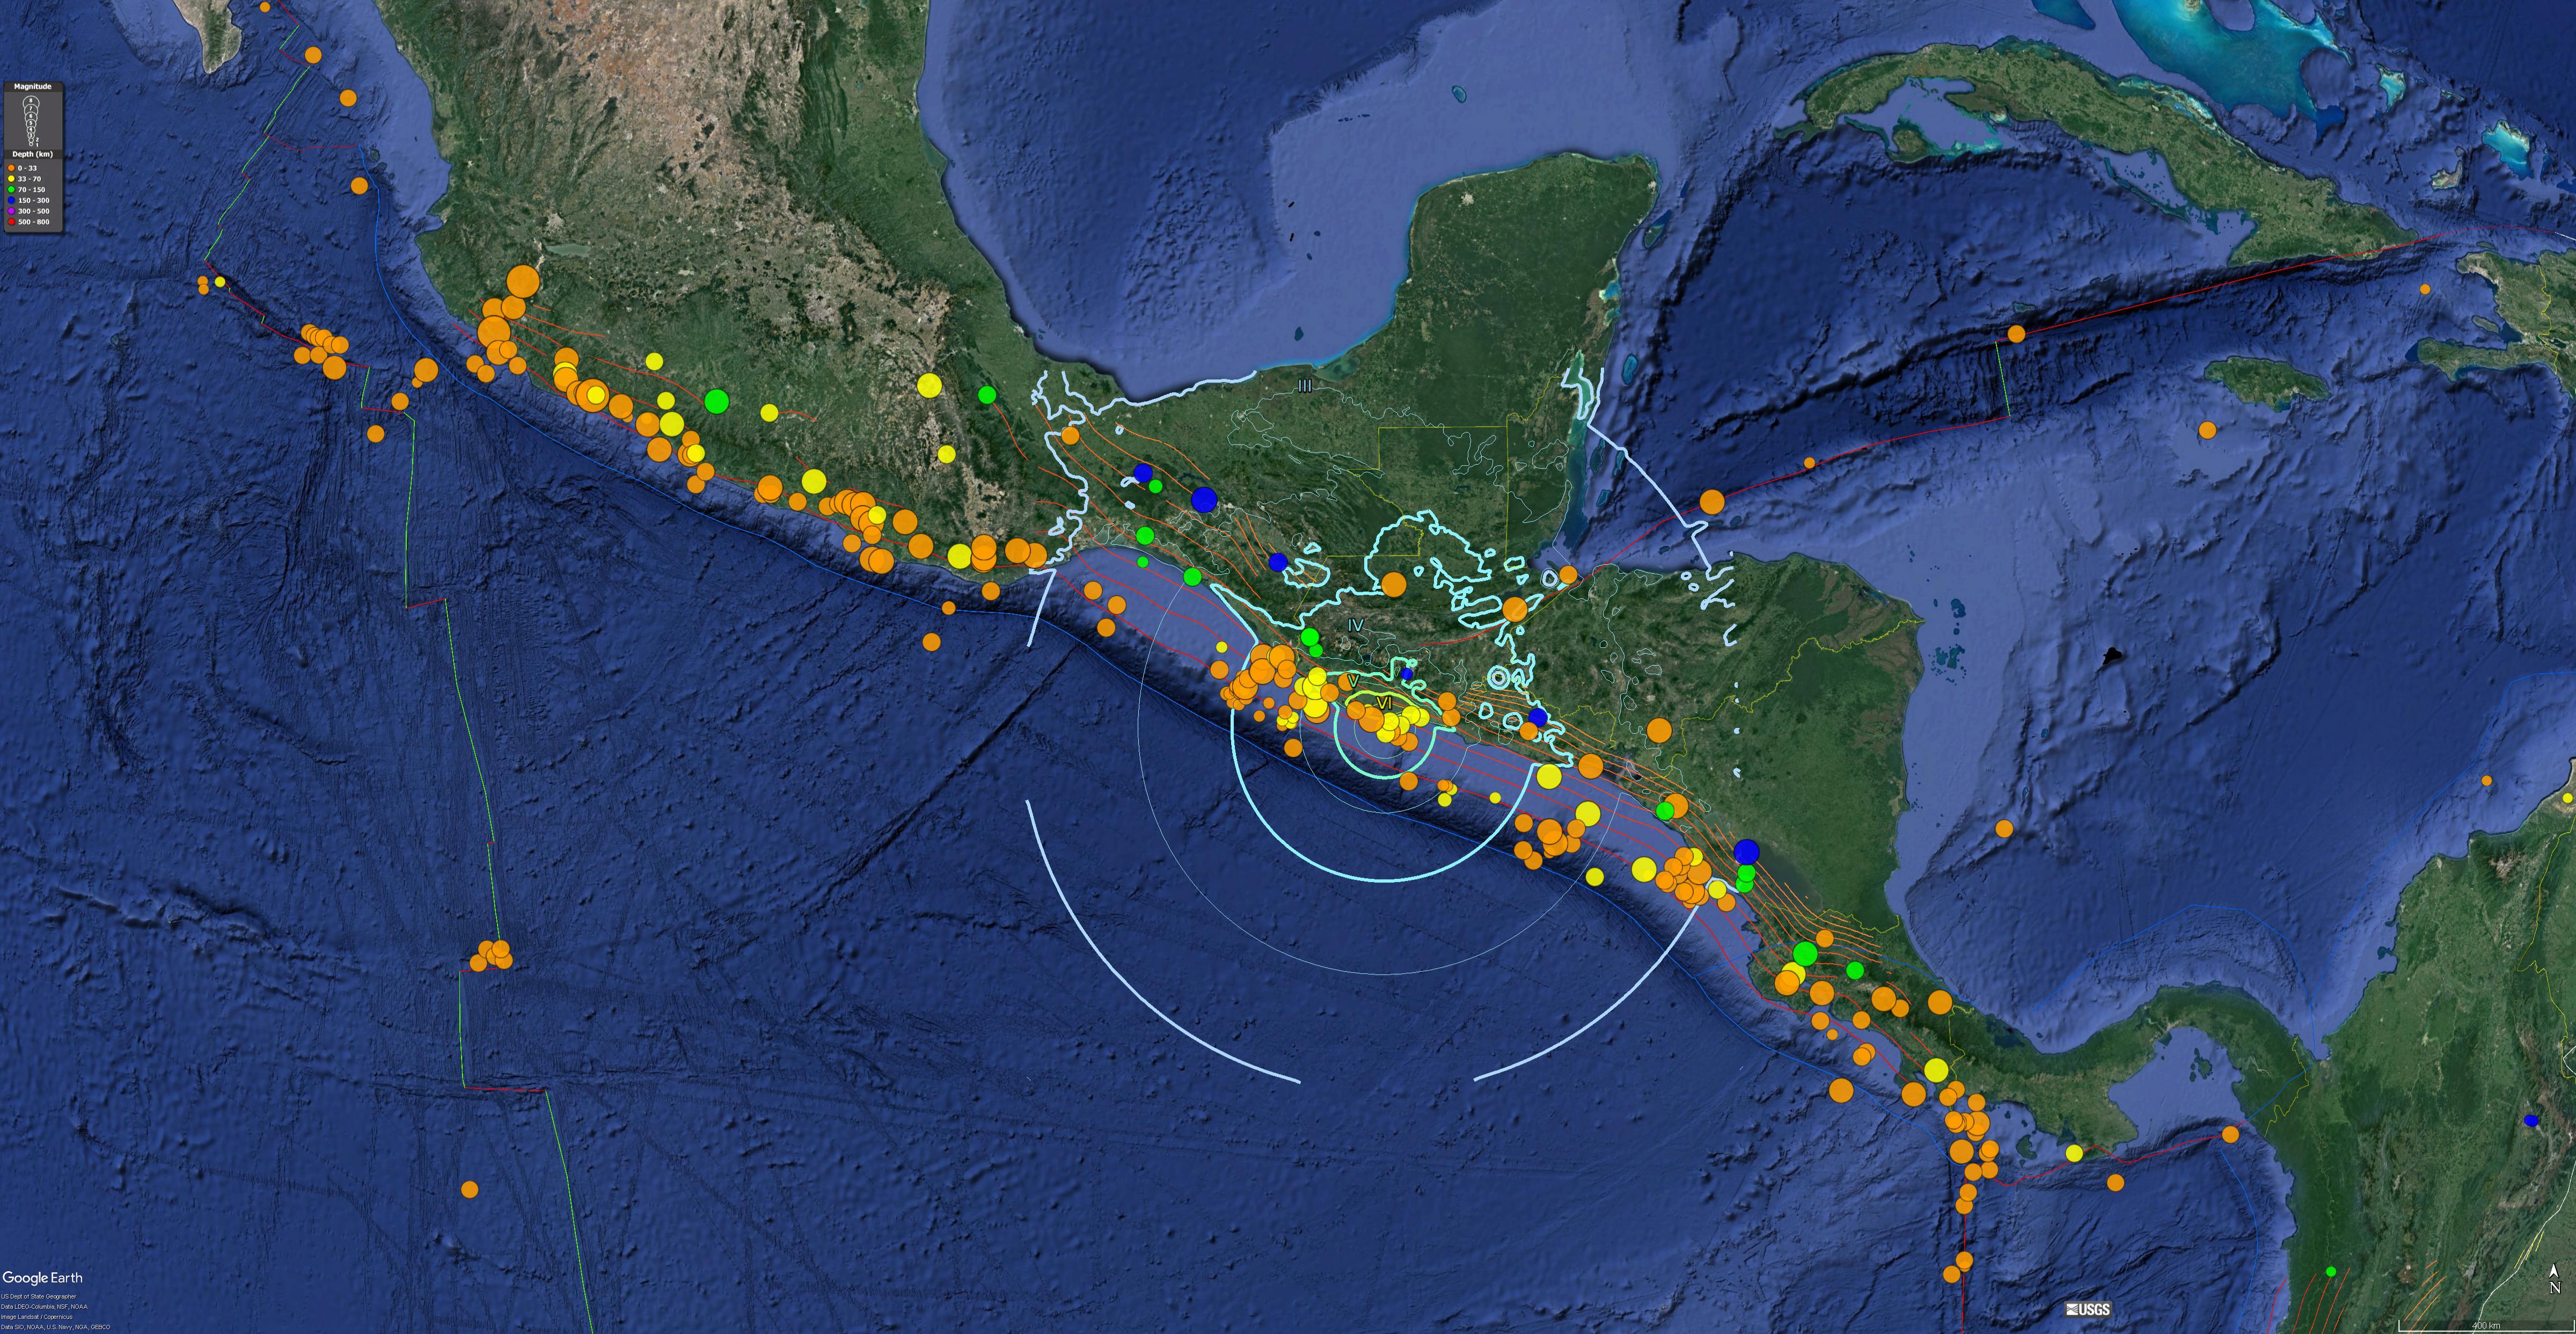
- Here is a map that shows today’s earthquake (with MMI contours) in the context of the seismicity from the past 100 years. I plot earthquakes from 1917-2017 for magnitudes M > 6.5.
- Here is my poster for the earthquake sequence from last week.
- Here is the tectonic map from Symithe et al. (2015). I include their figure caption below in blockquote.
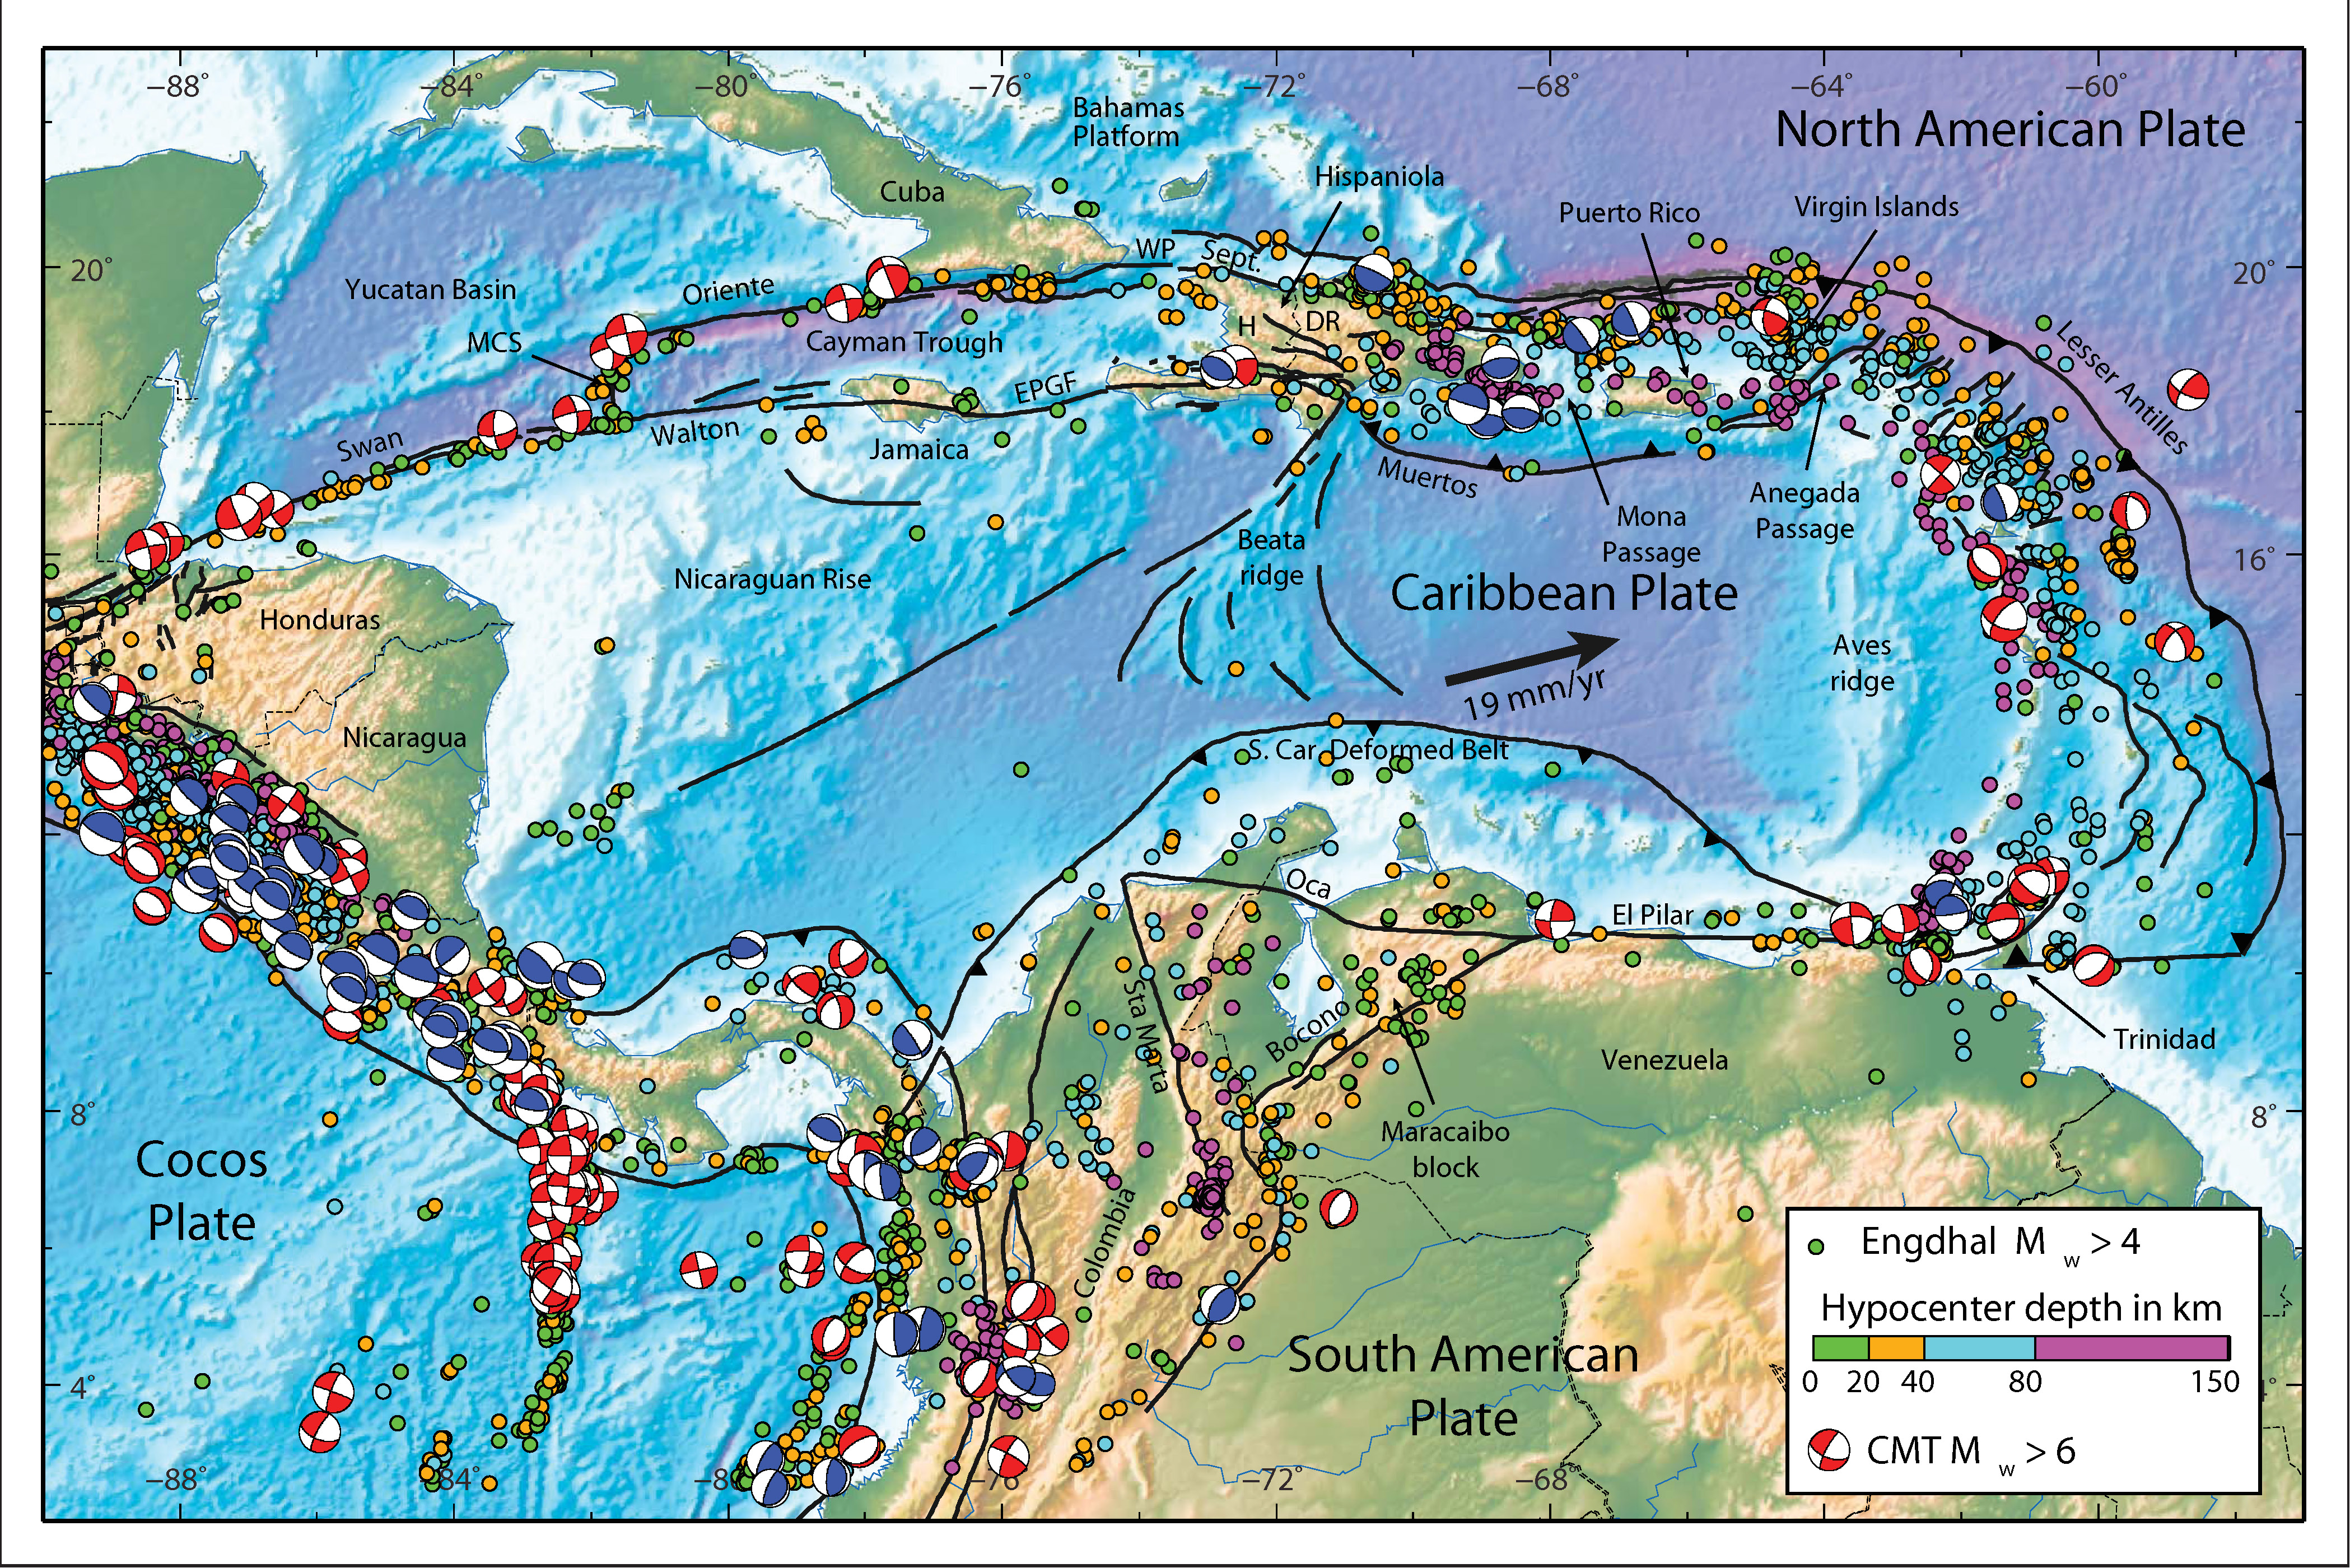
Seismotectonic setting of the Caribbean region. Black lines show the major active plate boundary faults. Colored circles are precisely relocated seismicity [1960–2008, Engdahl et al., 1998] color coded as a function of depth. Earthquake focal mechanism are from the Global CMT Catalog (1976–2014) [Ekstrom et al., 2012], thrust focal mechanisms are shown in blue, others in red. H = Haiti, DR = Dominican Republic, MCS = mid-Cayman spreading center, WP = Windward Passage, EPGF = Enriquillo Plaintain Garden fault.
- Here is the tectonic map from Garcia-Casco et al. (2011). I include their figure caption below in blockquote.

Plate tectonic configuration of the Caribbean region showing the location of the study cases presented in this issue (numbers refer to papers, arranged as in the issue), and other important geological features of the region (compiled from several sources).
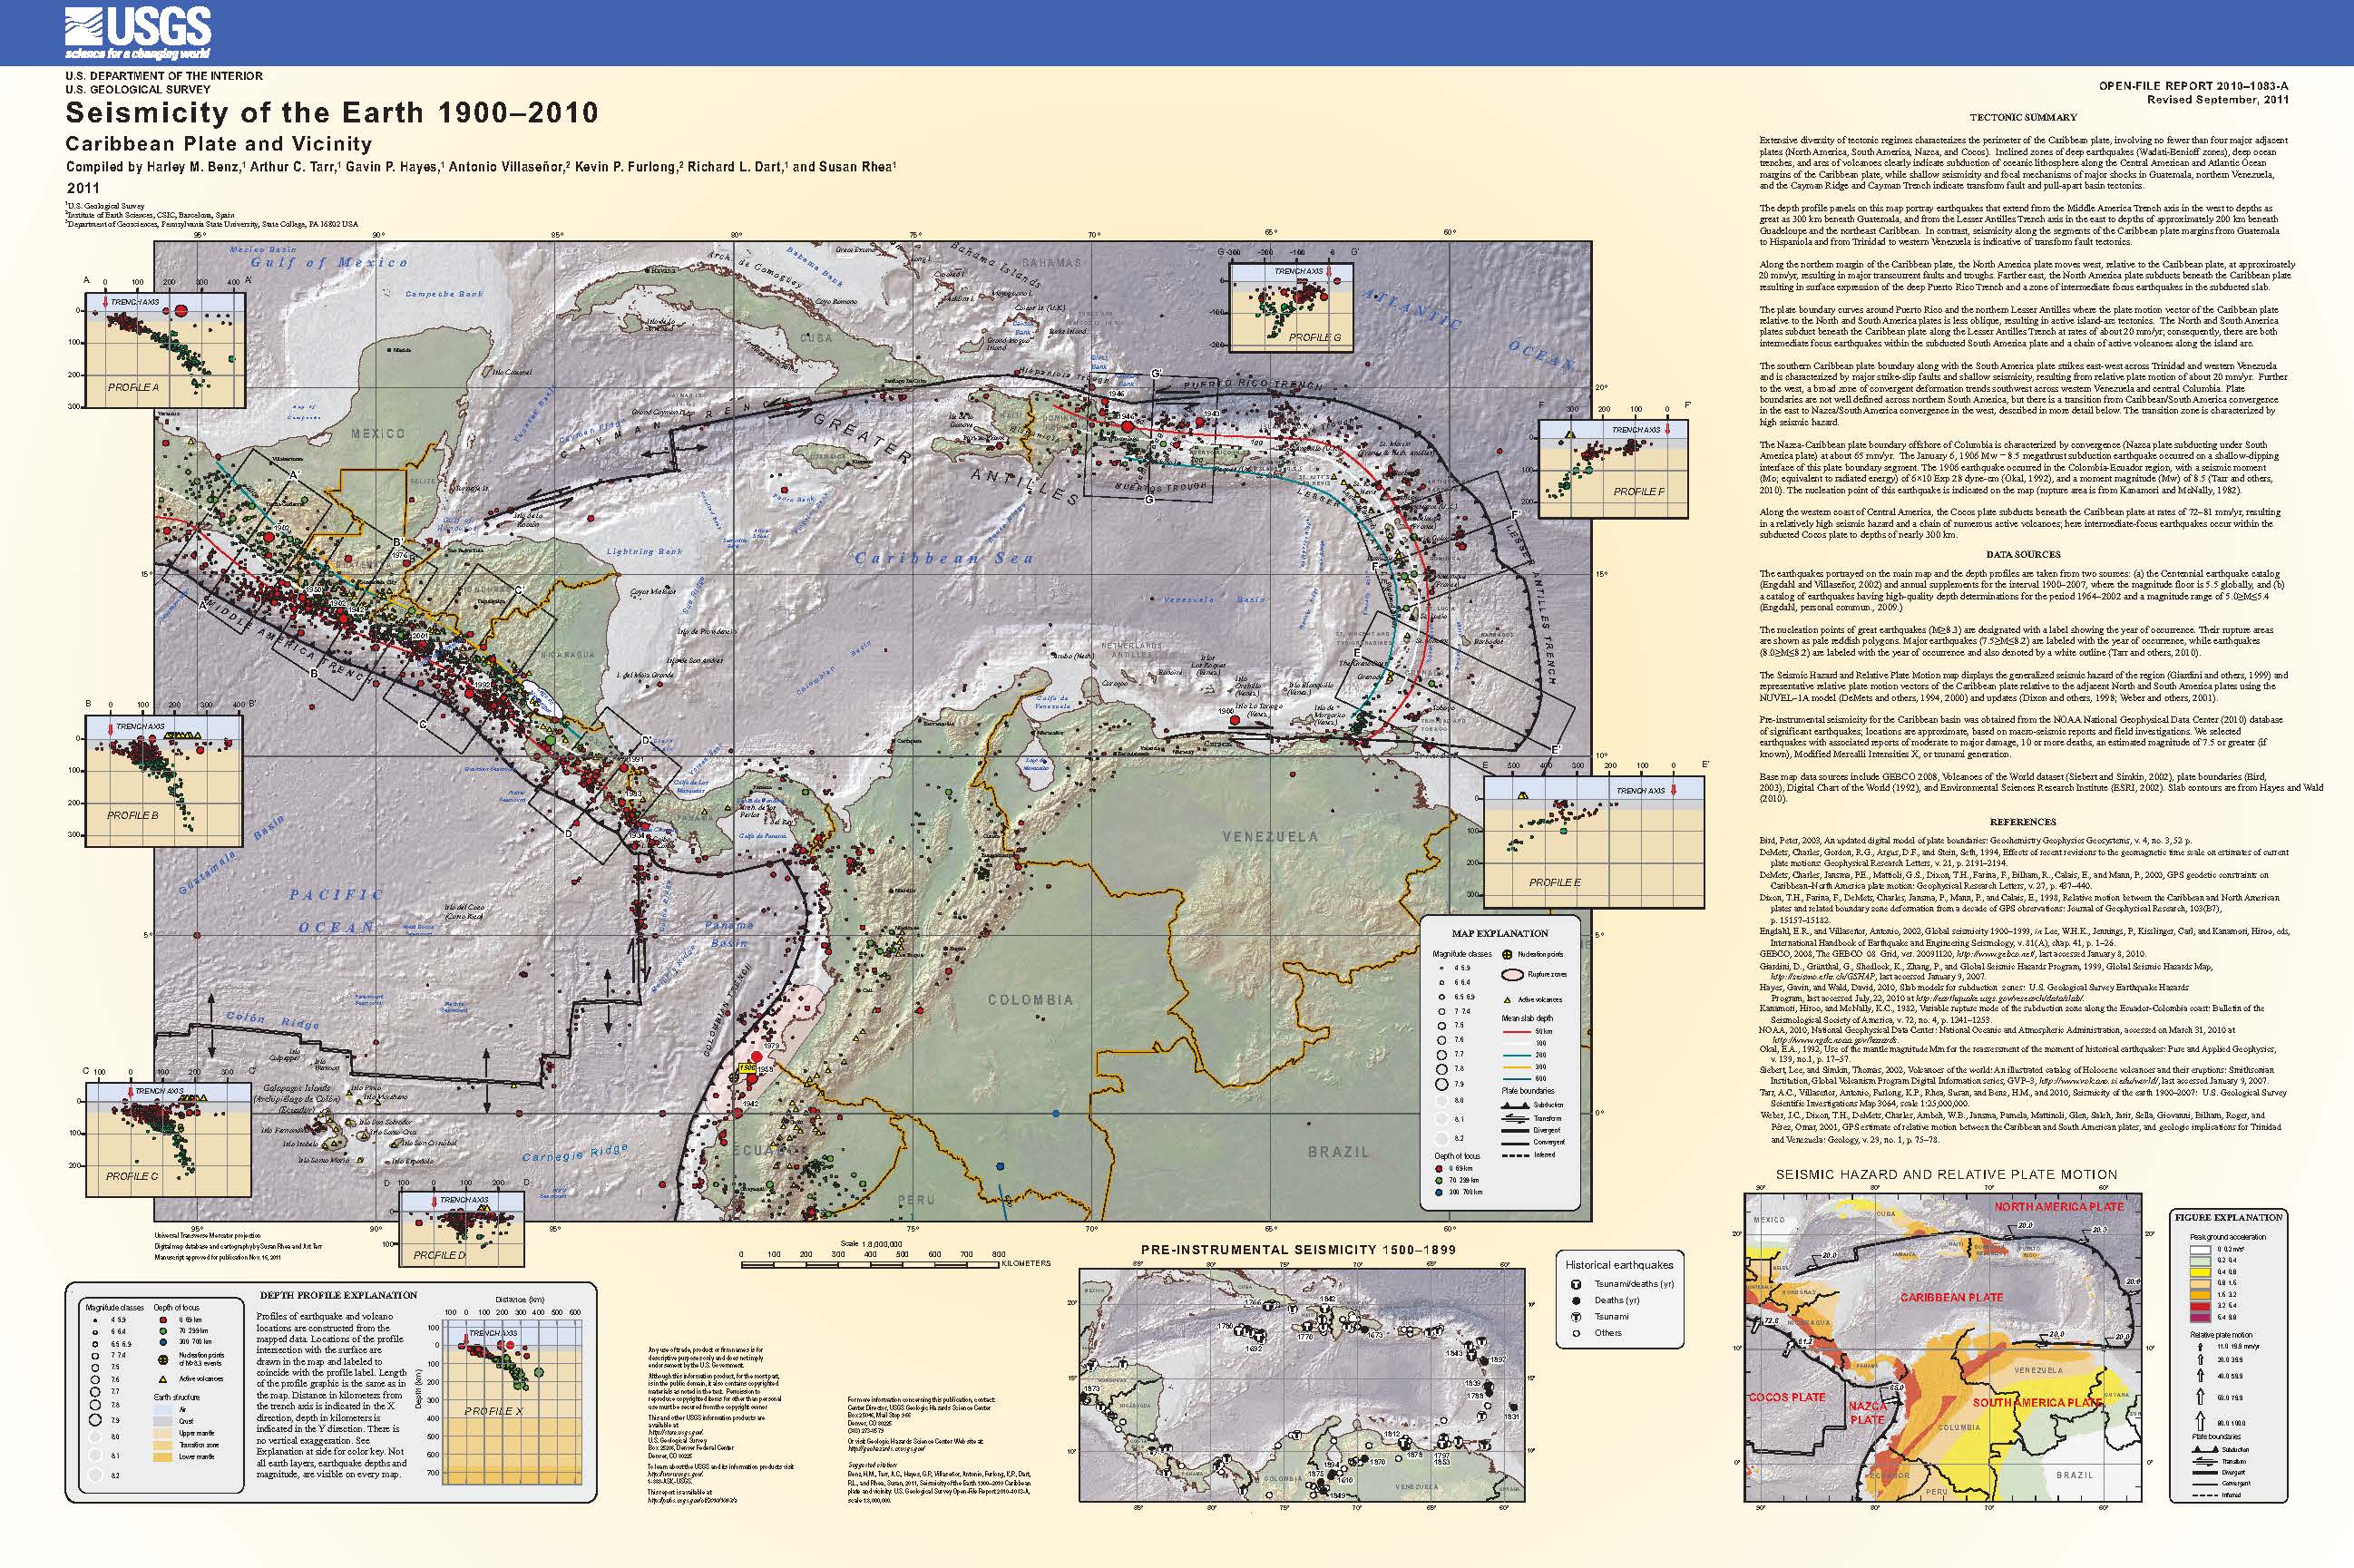
- Here is the Benz et al. (2011) Seismicity of the Earth poster for this region.
- 2017.06.22 M 6.8 Guatemala
- 2017.06.14 M 6.9 Guatemala
- 2017.05.12 M 6.2 El Salvador
- 2017.03.29 M 5.7 Gulf of California
- 2016.11.24 M 7.0 El Salvador
- 2016.04.29 M 6.6 East Pacific Rise / MAT
- 2016.01.21 M 6.6 Mexico
- 2015.09.13 M 6.6 Gulf California
- 2015.09.13 M 6.6 Gulf California Update #1
- 2014.10.14 M 7.3 El Salvador
- 2013.10.20 M 6.4 Gulf California
Mexico | Central America
Earthquake Reports
References
- Benz, H.M., Tarr, A.C., Hayes, G.P., Villaseñor, Antonio, Furlong, K.P., Dart, R.L., and Rhea, Susan, 2011. Seismicity of the Earth 1900–2010 Caribbean plate and vicinity: U.S. Geological Survey Open-File Report 2010–1083-A, scale 1:8,000,000.
- Franco, A., C. Lasserre H. Lyon-Caen V. Kostoglodov E. Molina M. Guzman-Speziale D. Monterosso V. Robles C. Figueroa W. Amaya E. Barrier L. Chiquin S. Moran O. Flores J. Romero J. A. Santiago M. Manea V. C. Manea, 2012. Fault kinematics in northern Central America and coupling along the subduction interface of the Cocos Plate, from GPS data in Chiapas (Mexico), Guatemala and El Salvador in Geophysical Journal International., v. 189, no. 3, p. 1223-1236. DOI: https://doi.org/10.1111/j.1365-246X.2012.05390.x
- Garcia-Casco, A., Projenza, J.A., Iturralde-Vinent, M.A., 2011. Subduction Zones of the Caribbean: the sedimentary, magmatic, metamorphic and ore-deposit records UNESCO/iugs igcp Project 546 Subduction Zones of the Caribbean in Geologica Acta, v. 9, no., 3-4, p. 217-224
- Hayes, G. P., D. J. Wald, and R. L. Johnson, 2012. Slab1.0: A three-dimensional model of global subduction zone geometries, J. Geophys. Res., 117, B01302, doi:10.1029/2011JB008524.
- Symithe, S., E. Calais, J. B. de Chabalier, R. Robertson, and M. Higgins, 2015. Current block motions and strain accumulation on active faults in the Caribbean in J. Geophys. Res. Solid Earth, v. 120, p. 3748–3774, doi:10.1002/2014JB011779.
This site was a hidden treasure to me. Every aspect of an earthquake is being treated. Have of course mentioned your great report in my website. I hope many of our readers will follow the link to your site.