
Well, based upon a comment on twitter, I thought it prudent to review the seismicity of this region at the westernmost part of the western Aleutian Islands. For many years I considered this region part of the subduction zone that forms the Aleutian Trench. In the past couple of years, there have been a number of earthquakes that reveal this to not be the case. Rather, the Pacific-North America plate boundary in this region is in the form of a shear zone, distributed across several reactivated fracture zones. I noticed a plot from Jascha Polet and found another article that evaluates this plate boundary (Davaille and Lees, 2004).
Here is my initial #EarthquakeReport on this M 7.7 strike-slip earthquake.
Here is a report from the University of Alaska Fairbanks, Alaska Earthquake Center.
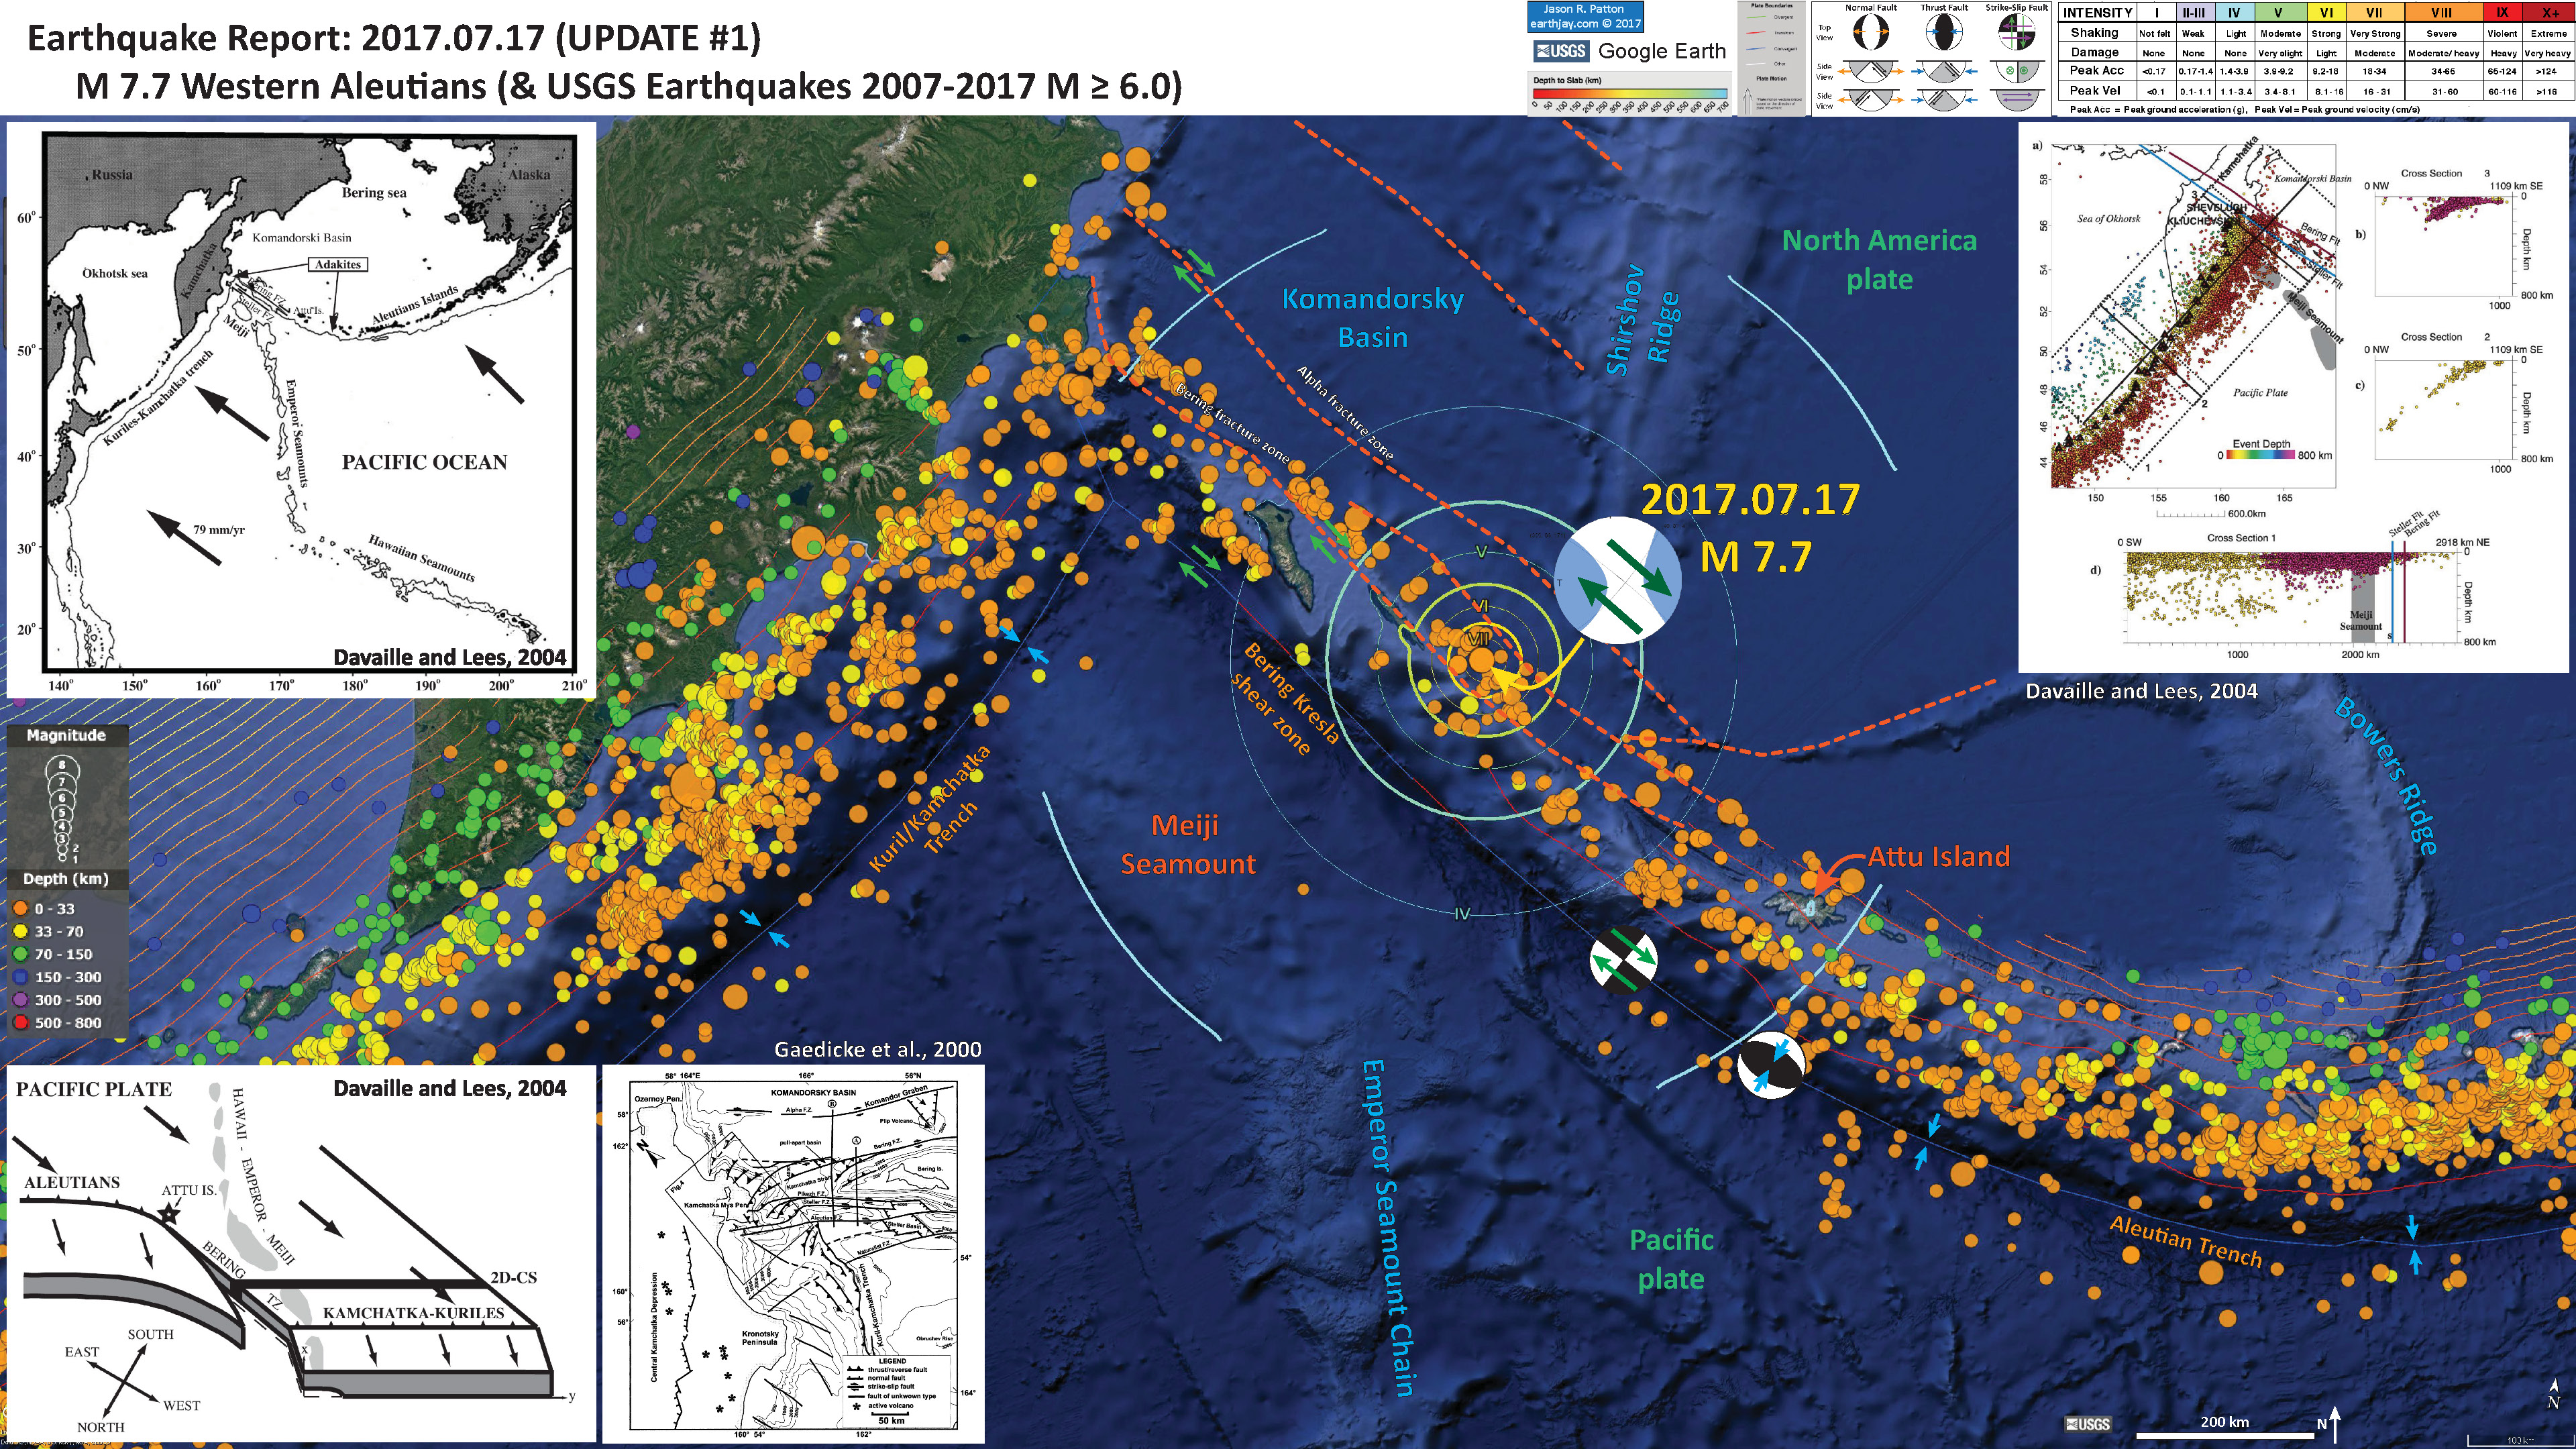
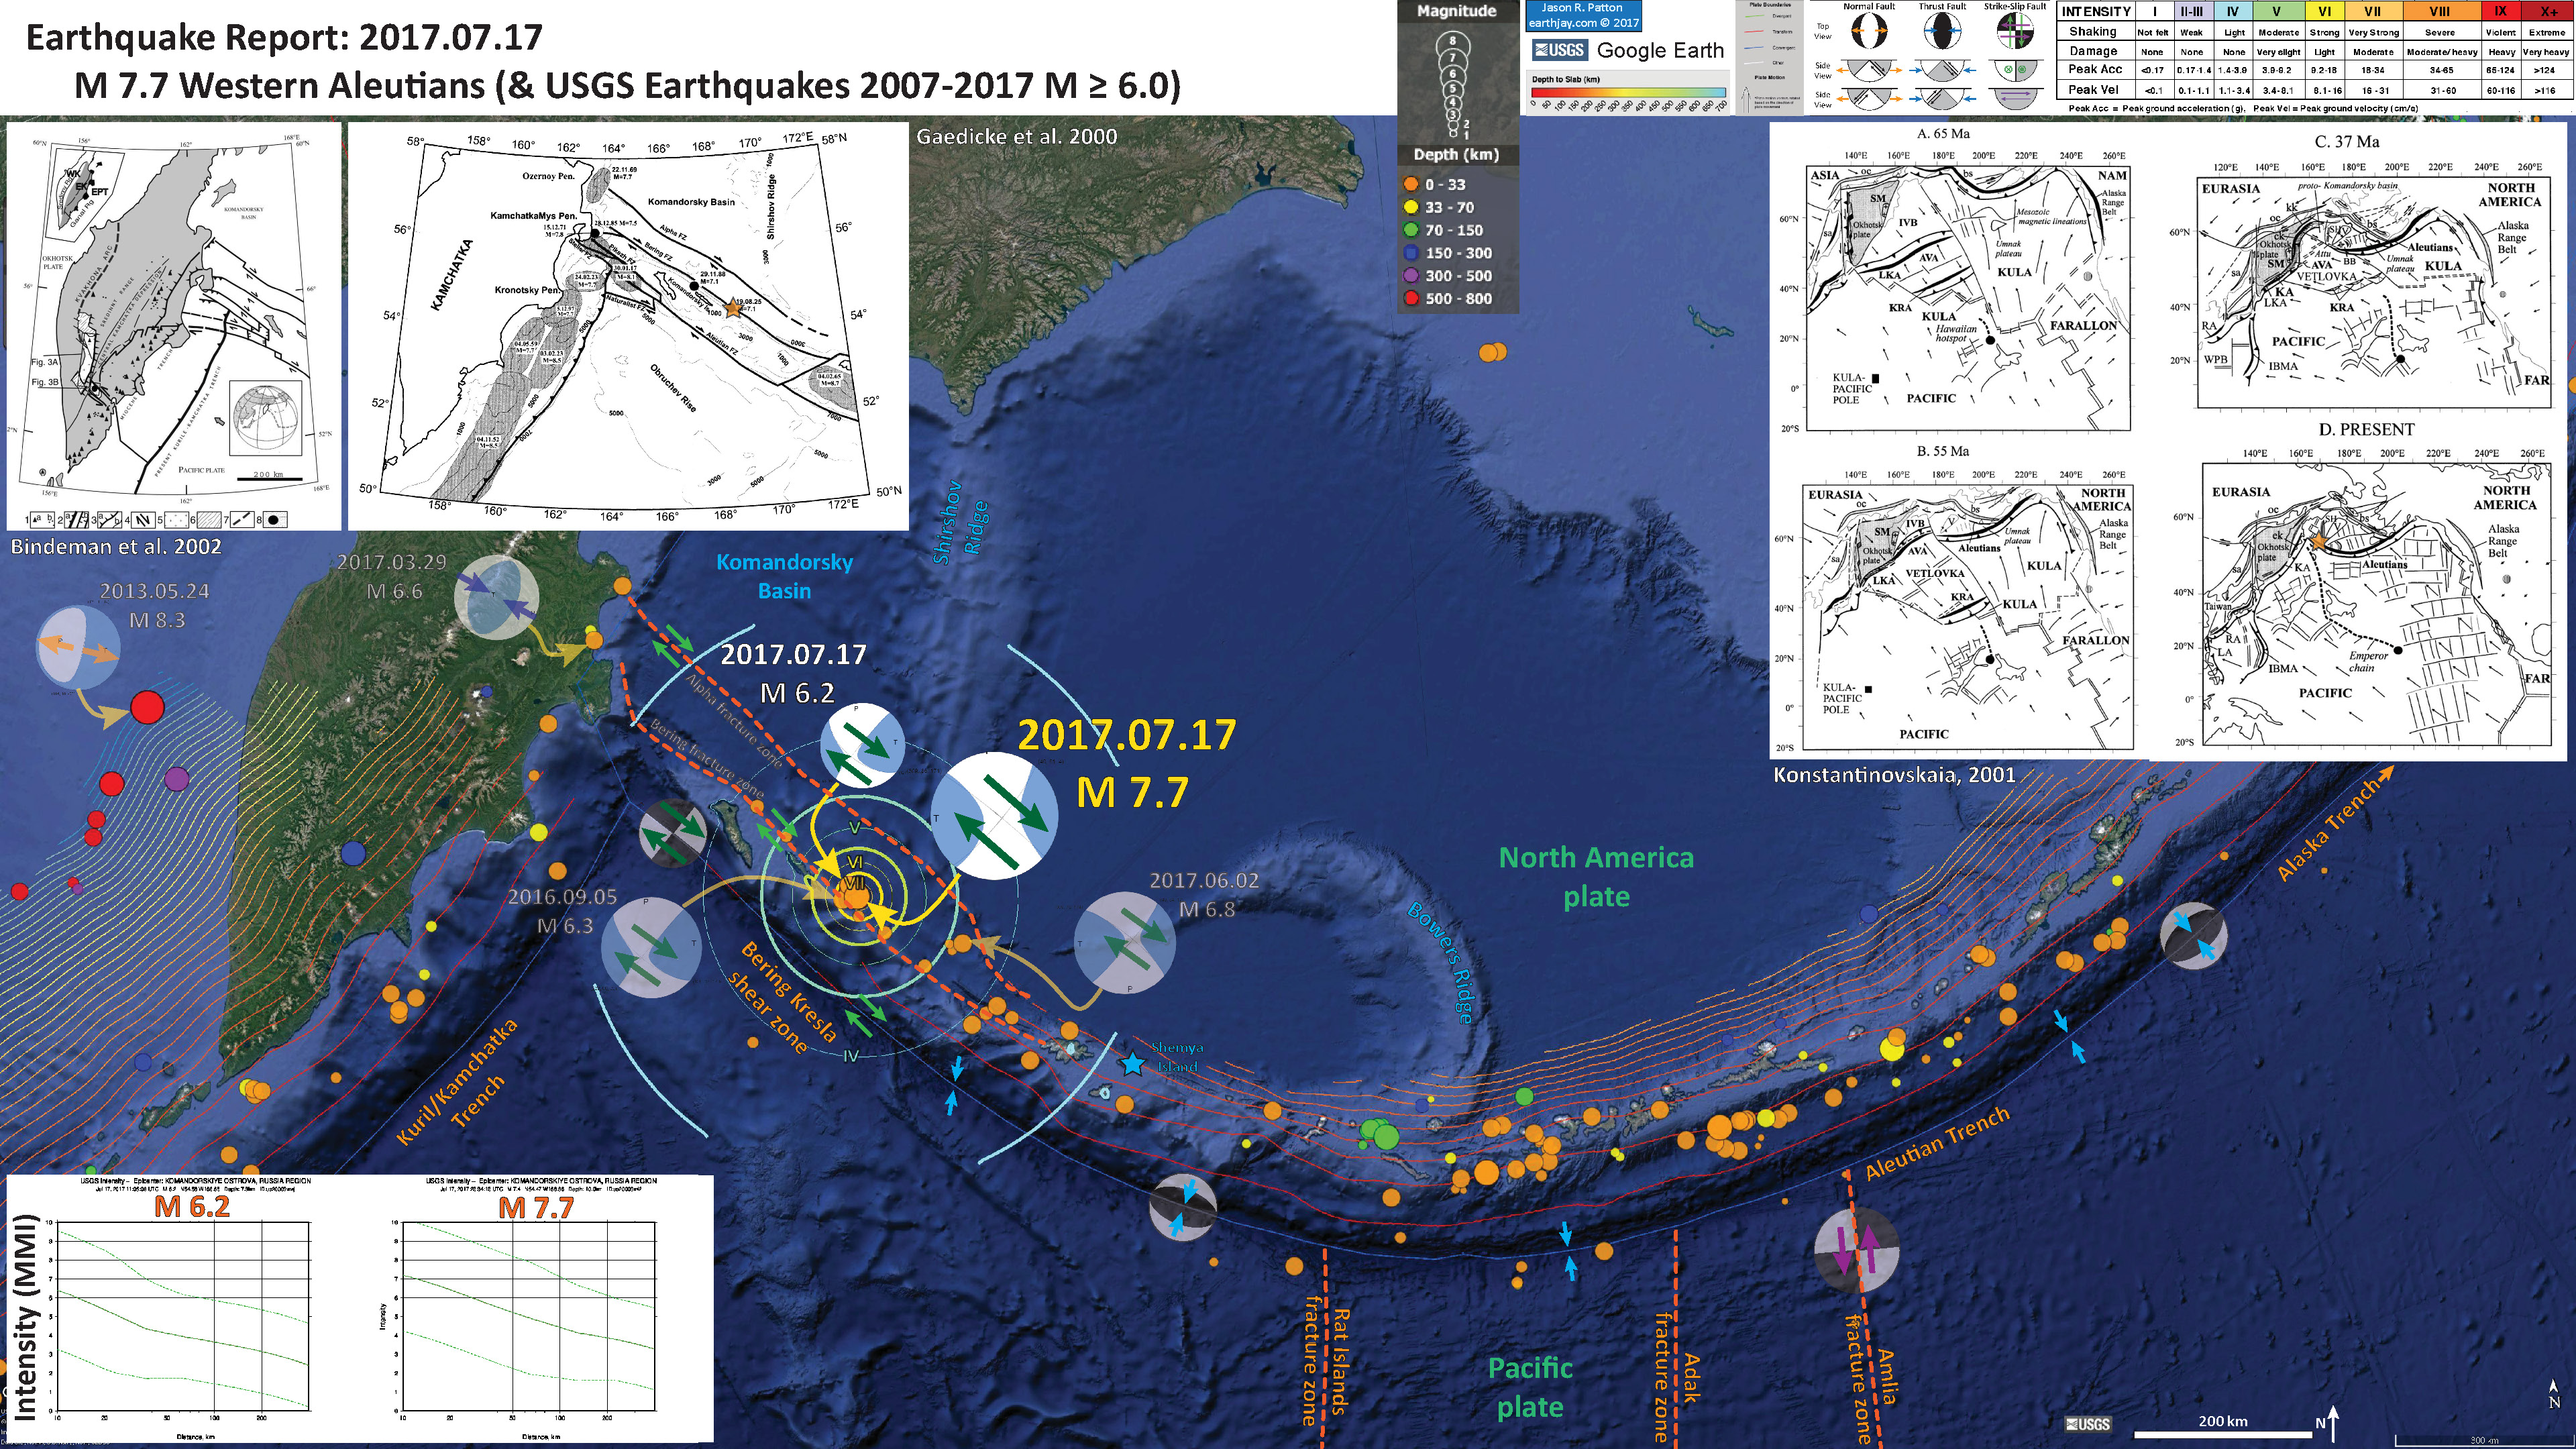
Below is my interpretive poster for this earthquake.
- I placed a moment tensor / focal mechanism legend on the poster. There is more material from the USGS web sites about moment tensors and focal mechanisms (the beach ball symbols). Both moment tensors and focal mechanisms are solutions to seismologic data that reveal two possible interpretations for fault orientation and sense of motion. One must use other information, like the regional tectonics, to interpret which of the two possibilities is more likely. I plot moment tensors for the M 7.7 earthquake. Based upon the series of earthquakes and the mapped faults, I interpret this M 7.7 earthquake as a right-lateral strike-slip earthquake related to slip associated with the Bering fracture zone.
- I also include the shaking intensity contours on the map. These use the Modified Mercalli Intensity Scale (MMI; see the legend on the map). This is based upon a computer model estimate of ground motions, different from the “Did You Feel It?” estimate of ground motions that is actually based on real observations. The MMI is a qualitative measure of shaking intensity. More on the MMI scale can be found here and here. This is based upon a computer model estimate of ground motions, different from the “Did You Feel It?” estimate of ground motions that is actually based on real observations.
- I include the slab contours plotted (Hayes et al., 2012), which are contours that represent the depth to the subduction zone fault. These are mostly based upon seismicity. The depths of the earthquakes have considerable error and do not all occur along the subduction zone faults, so these slab contours are simply the best estimate for the location of the fault.
- I plot the seismicity from the past month, with color representing depth and diameter representing magnitude (see legend). I also include USGS earthquake epicenters from 1917-2017 for magnitudes M ≥ 5.0. The depths for these earthquakes is represented by color. This is quite revealing when considering whether subduction is occurring in this part of the plate boundary. Note how earthquakes east of Attu Island have hypocentral depths (3-dimensional location of the earthquake focus) that extend to over 150 km. These represent earthquakes in the downgoing Pacific plate. We also observe earthquakes even deeper along the Kamchatka Trench on the west. Also note that the slab contours (Hayes et al., 2012) have decreasing maximum depths from east to west between Bowers Ridge and Attu Island. The same is true for the subduction zone beneath Kamchatka, though the cut-off of these depth contours is more abrupt (due to the tear in the Pacific plate, which marks the edge of the subduction zone beneath Kamchatka). Finally, note how the earthquake depths in the region between Attu Island and Kamchatka are largely less than 33 km.
- In the upper left corner I include a regional tectonic map showing Kamchatka and the westernmost tip of the westernmost Aleutian Islands (Davaille and Lees, 2004).
- In the lower right corner I show a schematic illustration that depicts how the subduction transitions to strike-slip in the region of the Attu Island (Davaille and Lees, 2004).
- To the right is a large scale map of this region showing the complicated intersection of strike slip and compressional tectonics as the tip of the Aleutians intersects with Kamchatka (Gaedicke et al., 2000).
- In the upper right corner is a figure showing seismicity in this region (Davaille and Lees, 2004). There is a map (with earthquakes plotted vs. depth in color) and several cross sections (one parallel to the Kamchatka trench and two normal/perpendicular to the trench). Note how the depths for the earthquakes shallow to the north of the Meiji Seamount, and particularly shallower to the north of the Stellar fault (a.k.a. Bering Kresla Shear zone) and the Bering fault (a.k.a. Bering fracture zone).
I include some inset figures in the poster.
- Here is my original #EarthquakeReport Interpretive Poster and report.
- Here is the seismicity plot from Davaille and Lees (2000). They suspect that the tear in the Pacific plate is related to the interaction of a mantle plume hotspot and the oceanic lithosphere as it is formed near this hotspot. I include their figure caption below in blockquote.
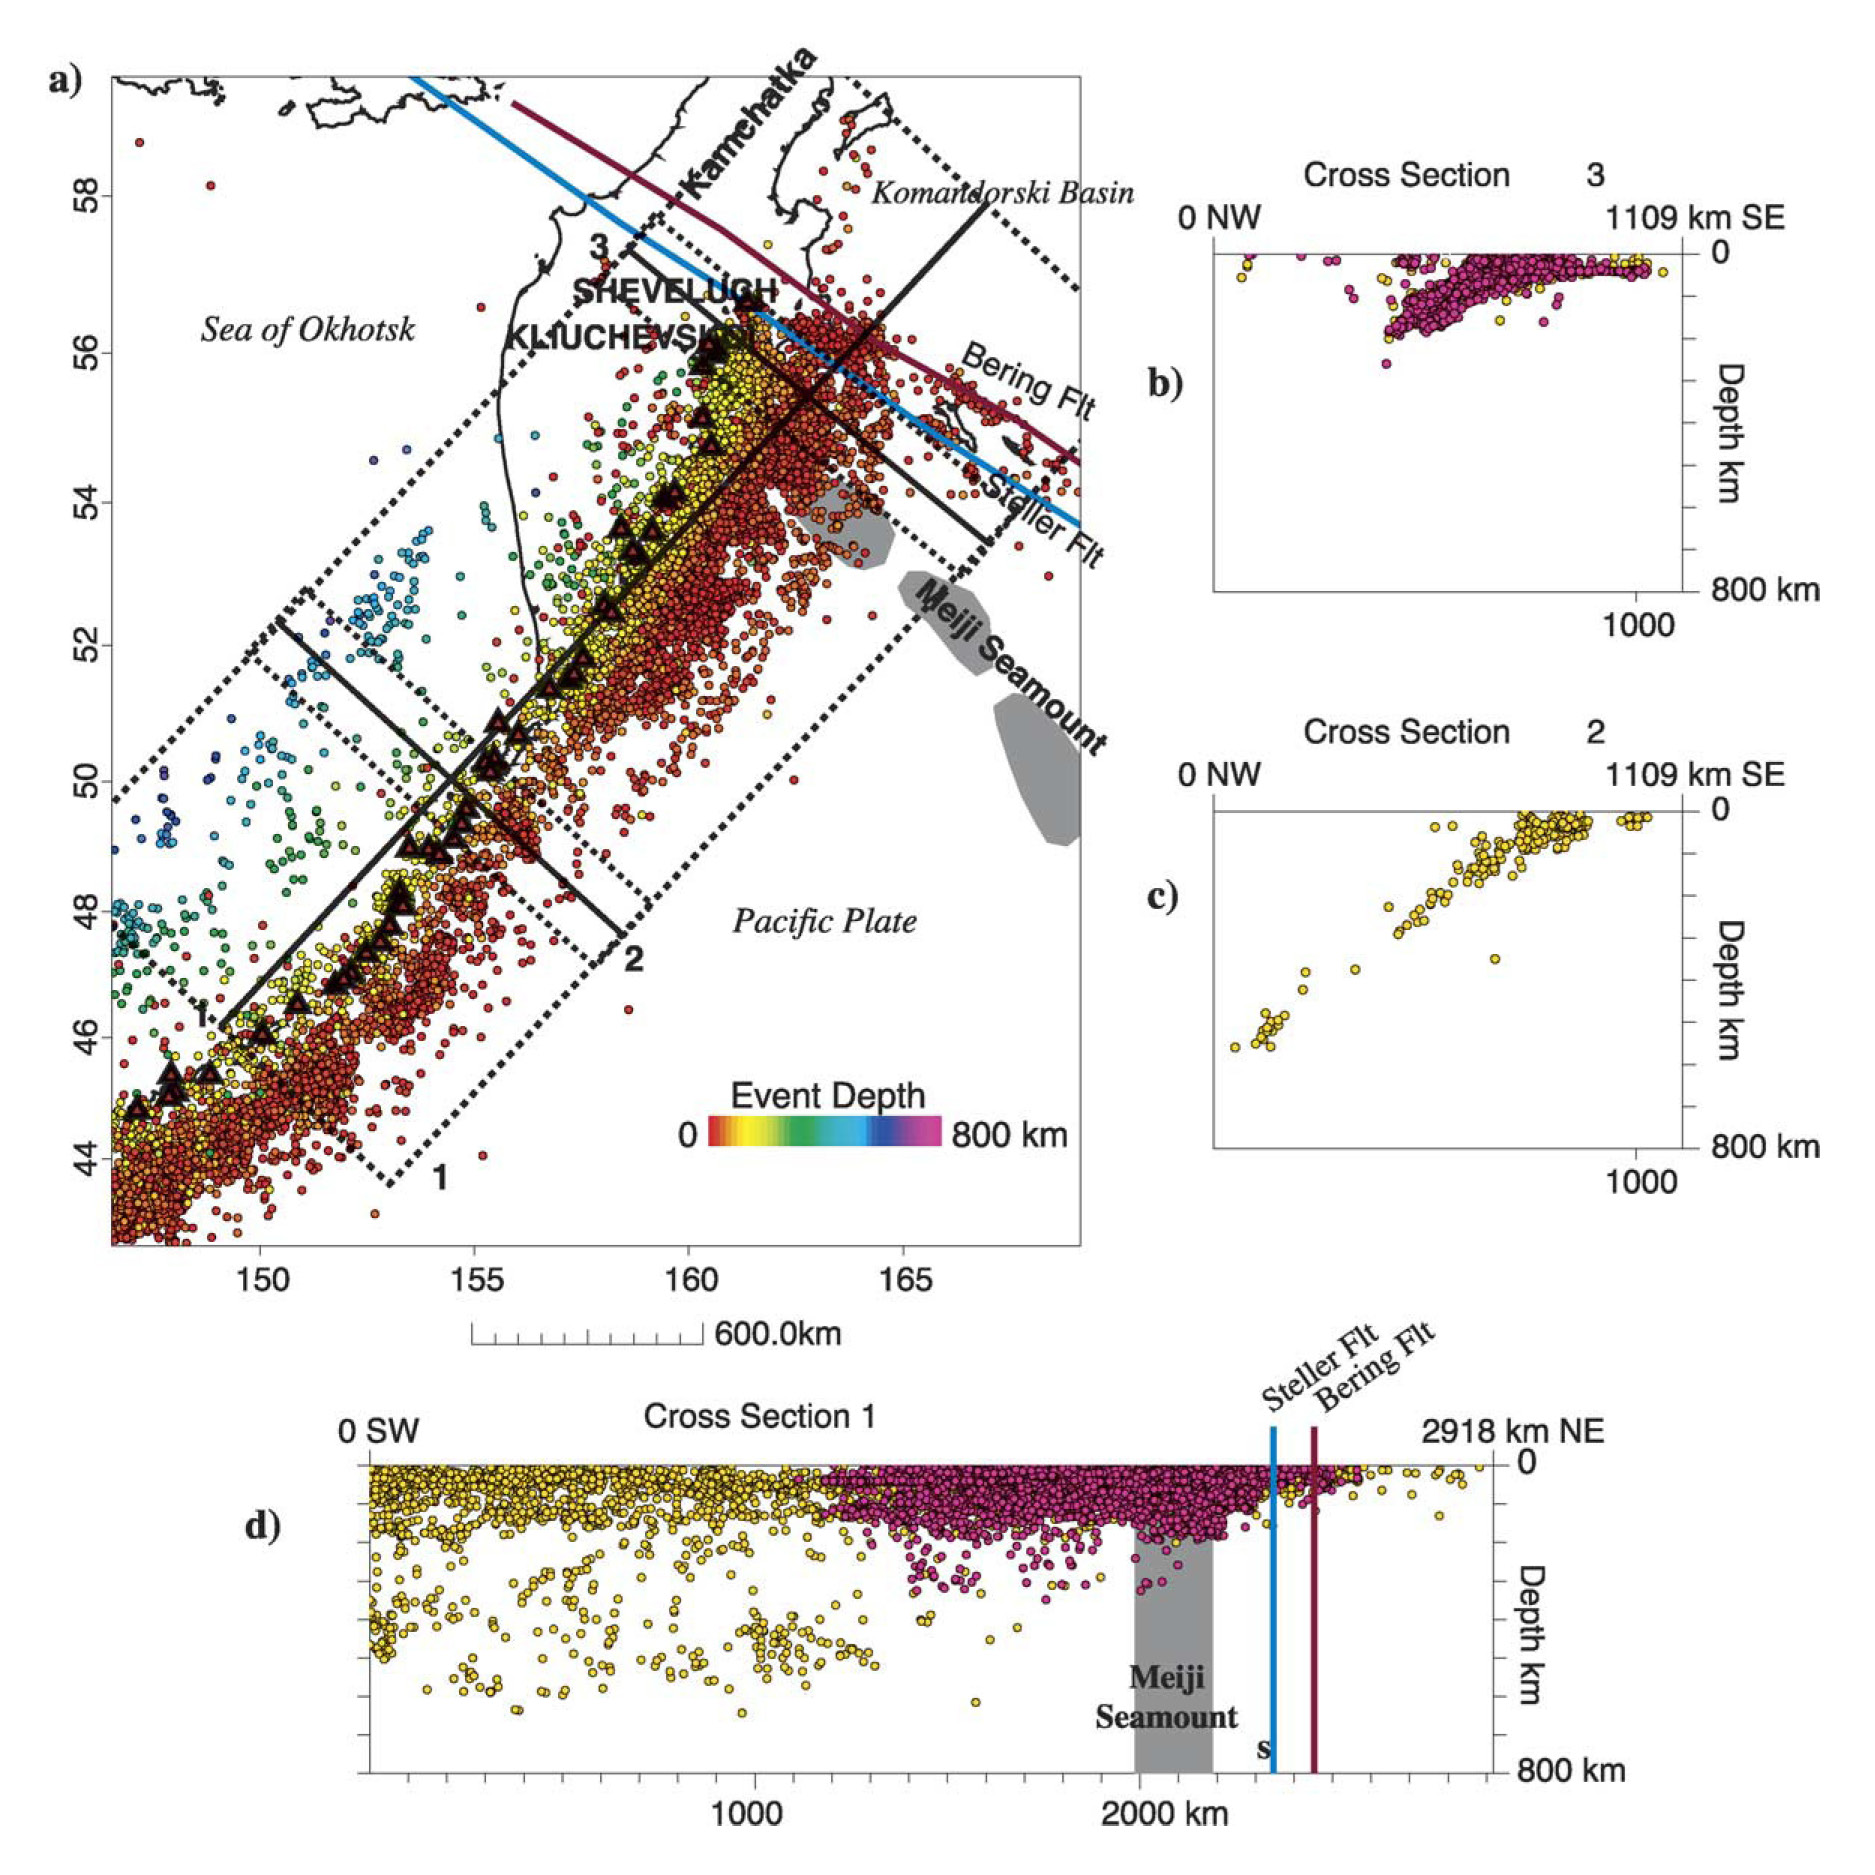
Seismicity in Kamchatka. (a) Mapview showing earthquakes plotted with colors corresponding to depth. Projections of the Bering and Steller faults onto Kamchatka are presented for clarity and reference. (b–d) Vertical cross-sections of seismicity in Kamchatka. Magenta circles are from the Gorbatov et al. [3] catalog and yellow events are from the Engdahl et al. [52] catalog. The projection of the subducting Meiji seamounts is shaded gray.
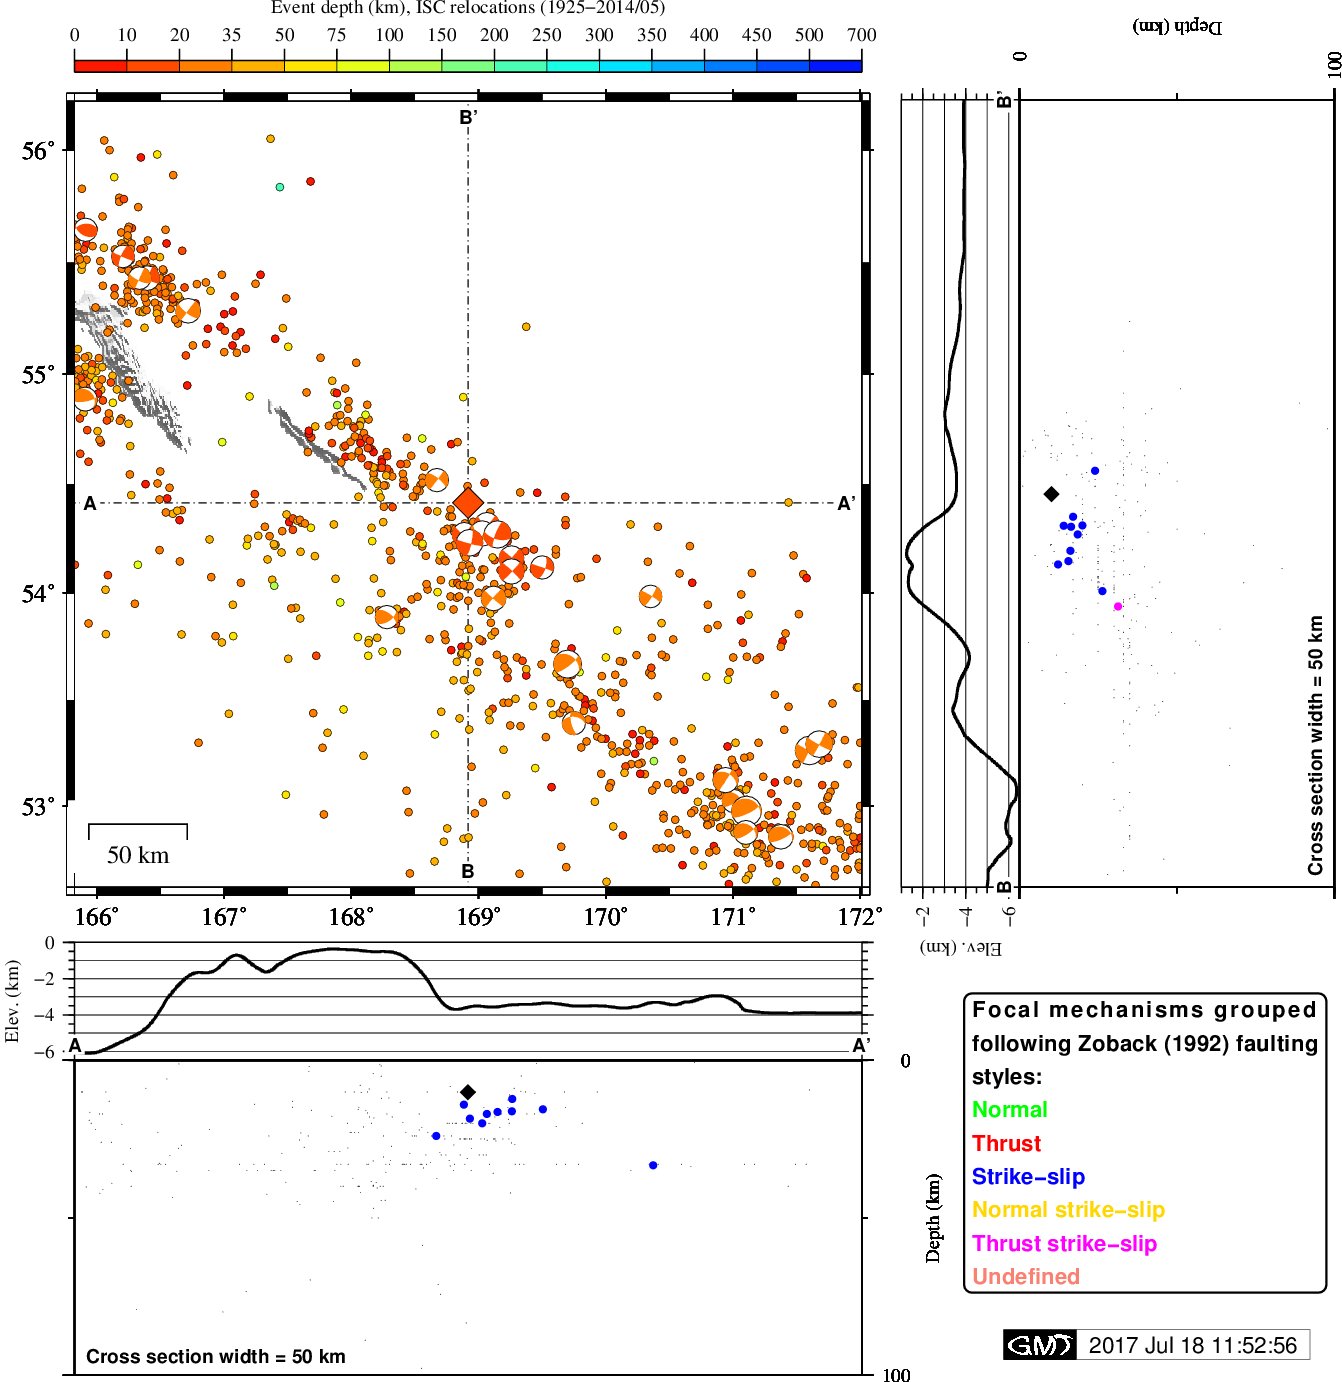
- Here is a plot from Jascha Polet, seismologist at Cal Poly Pomona. These data are consistent with the Davaille and Lees (2000) plot, showing shallow seismicity in this region of the plate boundary.
- Here is the low-angle oblique map from Portnyagin and Manea (2008). This was in my original report, but is a great visualization for this interpretation of the Pacific plate tear (the edge of subduction in Kamchatka). While this is not evidence for the lack of subduction in the region of the Bering Kresla Shear zone, it does suggest that there is no active subduction beneath Kamchatka to the north. If this is the case (and I have no reason to think that it is not the case), there is little evidence for subduction west of Attu Island and east of Kamchatka. I include the figure caption as a blockquote below.
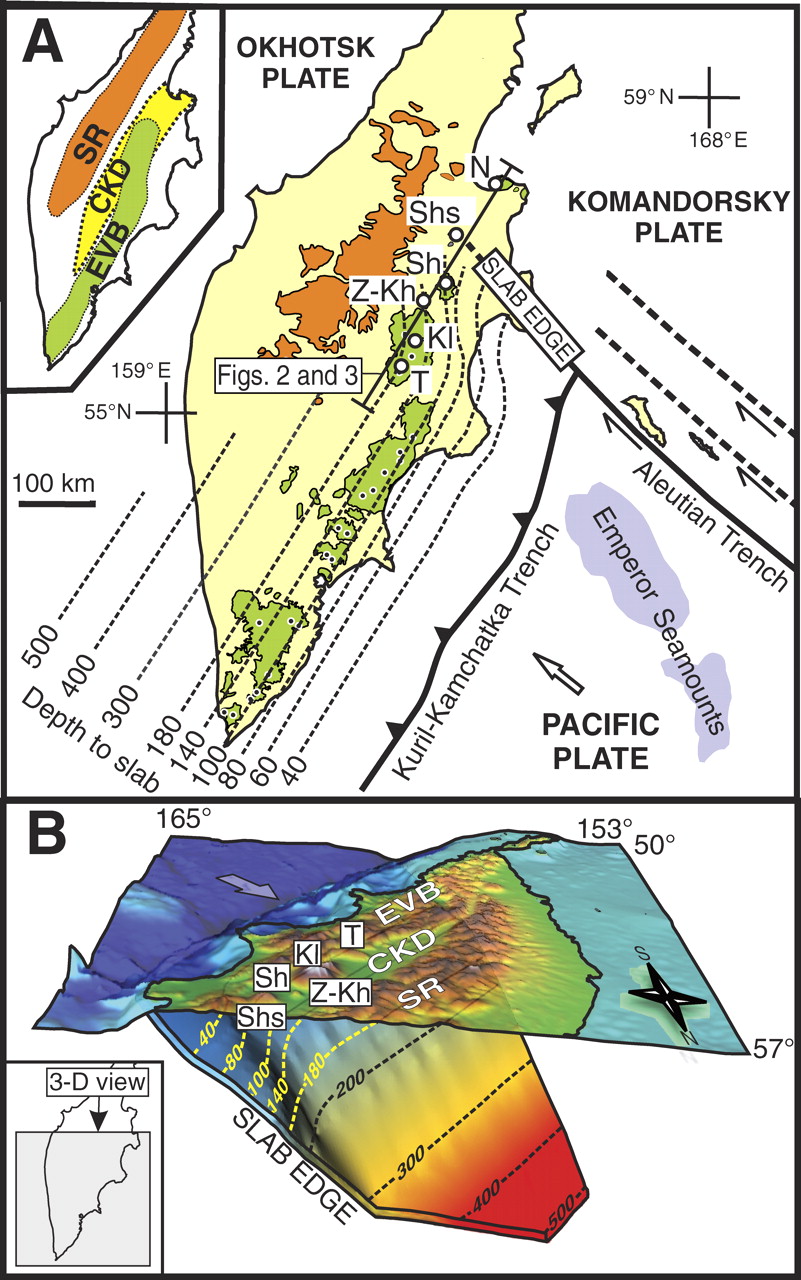
Kamchatka subduction zone. A: Major geologic structures at the Kamchatka–Aleutian Arc junction. Thin dashed lines show isodepths to subducting Pacific plate (Gorbatov et al., 1997). Inset illustrates major volcanic zones in Kamchatka: EVB—Eastern Volcanic Belt; CKD—Central Kamchatka Depression (rift-like tectonic structure, which accommodates the northern end of EVB); SR—Sredinny Range. Distribution of Quaternary volcanic rocks in EVB and SR is shown in orange and green, respectively. Small dots are active vol canoes. Large circles denote CKD volcanoes: T—Tolbachik; K l — K l y u c h e v s k o y ; Z—Zarechny; Kh—Kharchinsky; Sh—Shiveluch; Shs—Shisheisky Complex; N—Nachikinsky. Location of profiles shown in Figures 2 and 3 is indicated. B: Three dimensional visualization of the Kamchatka subduction zone from the north. Surface relief is shown as semi-transparent layer. Labeled dashed lines and color (blue to red) gradation of subducting plate denote depths to the plate from the earth surface (in km). Bold arrow shows direction of Pacific Plate movement.
- Here is another great visualization of the subducting slabs in this region, prepared by Lees et al. (2007). This figure shows isosurfaces (surfaces of equal value of some parameter, like seismic velocity, or Vp:Vs ratios; Vp = P-Wave velocity, Vs = S-Wave velocity). These isosurfaces were created using seismic tomography, which is basically just like a CT scan of the earth. CT stands for “computed tomography” of X-Rays. The mathematical solutions used in these methods are the same, even though the source of the data are different (X-Rays vs. seismic waves). Coastlines are in grey outline. Kamchatka is labelled M. The lower panel may be easier to look at first because north is up. Basically, blue is old and cold and red is young and hot. So, the downgoing Pacific plate is in blue and the surrounding mantle is in red. Note how the blue blobs end in the area of interest.

Tomographic image of the Kamchatka Subduction zone rendered in three-dimensions. The cut-off perturbation level is 3% with blue regions being high velocity and red lower velocity perturbations. The slab is a clear high velocity zone approximately 100 km thick plunging into the upper mantle at an angle of ~50. The green plane represents the top of the subduction zone seismicity, contoured and rendered along with the tomographic images. Gold cones are active volcanoes along the Kamchatka arc and white squares are stations included for reference to the map in Figure 1. The bars represent length scales of 100 km. Points of interest discussed in the text are marked with letters (I–M).
- This is a great visualization from IRIS that shows the seismic waves propagating through seismometers operated in the US. First is a screenshot and below is the embedded video. Here is a link to the video file (7 MN mp4). The seismic wave at the bottom of the animation is for the seismometer located in the center of the green circle on the map.

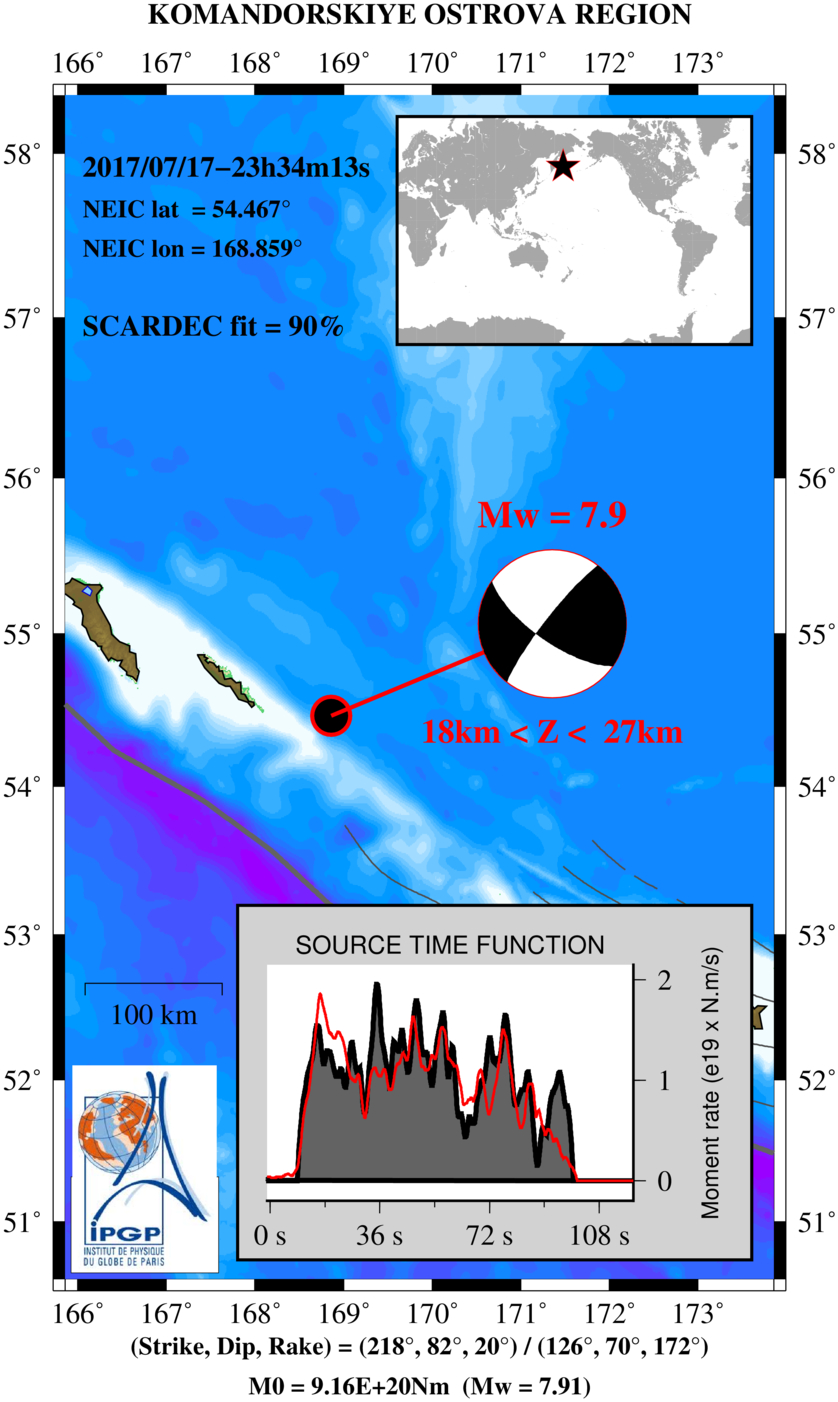
- Finally of note (unrelated to the previous discussion) is that this M 7.7 had a really long duration (Dr. Polet pointed this out in a tweet). This plot is from IPGP here. The source time function represents how much energy is released over time. Time is on the horizontal axis.
- Bassett and Watts, 2015. Gravity anomalies, crustal structure, and seismicity at subduction zones: 1. Seafloor roughness and subducting relief in Geochemistry, Geophysics, Geosystems, v. 16, doi:10.1002/2014GC005684.
- Davaille, A. and Lees, J.M., 2004. Thermal modeling of subducted plates: tear and hotspot at the Kamchatka corner in EPSL, v. 226, p. 293-304.
- Gaedicke, C., Baranov, B., Seliverstov, N., Alexeiev, D., Tsukanov, N., Freitag, R., 2000. Structure of an active arc-continent collision area: the Aleutian-Kamchatka junction. Tectonophysics 325, 63–85
- Hayes, G. P., D. J. Wald, and R. L. Johnson (2012), Slab1.0: A three-dimensional model of global subduction zone geometries, J. Geophys. Res., 117, B01302, doi:10.1029/2011JB008524.
- Ikuta, R., Mitsui, Y., Kurokawa, Y., and Ando, M., 2015. Evaluation of strain accumulation in global subduction zones from seismicity data in Earth, Planets and Space, v. 67, DOI 10.1186/s40623-015-0361-5
- Konstantnovskaia, 2001. Arc-continent collision and subduction reversal in the Cenozoic evolution of the Northwest Pacific: an example from Kamchatka (NE Russia) in Tectonophysics, v. 333, p. 75-94.
- Koulakov, I.Y., Dobretsov, N.L., Bushenkova, N.A., and Yakovlev, A.V., 2011. Slab shape in subduction zones beneath the Kurile–Kamchatka and Aleutian arcs based on regional tomography results in Russian Geology and Geophysics, v. 52, p. 650-667.
- Krutikov, L., et al., 2008. Active Tectonics and Seismic Potential of Alaska, Geophysical Monograph Series 179, doi:10.1029/179GM07
- Lees, J.M., VanDecar, J., Gordeev, E., Ozerov, A., Brandon, M., Park, J., and Levvin, V, 2007. Three Dimensional Images of the Kamchatka-Pacific Plate Cusp in Volcanism and Subduction: The Kamchatka Region Geophysical Monograph Series 172, DOI: 10.1029/172GM06
- Portnyagin, M. and Manea, V.C., 2008. Mantle temperature control on composition of arc magmas along the Central Kamchatka Depression in Geology, v. 36, no. 7, p. 519-522.
- Rhea, S., Tarr, A.C., Hayes, G., Villaseñor, A., Furlong, K.P., and Benz, H.M., 2010. Seismicity of the Earth 1900-2007, Kuril-Kamchatka arc and vicinity: U.S. Geological Survey Open-File Report 2010-1083-C, 1 map sheet, scale 1:5,000,000.
I’m a 75-year-old geohobbyist, grew up in San Diego. Thanks very much for making this info available to the non-scientific community. 30 years ago it was very difficult getting current explanations.
Thanks!