This is an interesting earthquake for a number of reasons. The epicenters of the largest earthquakes in this series (M 6.2 and M 6.3) align just off-strike from the Dalton section of the Denali fault (DF) which was mapped as having offset Holocene features by Plafker et al (1977), though there were no numerical ages to support their interpretation. This is just north of the Chilkat River section of the DF and just north of the Chatham Strait section of the DF. These sections of the Denali fault have not been found to be active (though they may be and today’s earthquake sequence suggests that they are!). There are many faults mapped in this region based upon the British Columbia data catalogue.
The moment tensor for the M 6.3 is also slightly misaligned to the orientation (strike) of the Denali fault here. Also interesting because the USGS has been putting forth significant effort on an investigation of the Quuen Charlotte (QCF)/Fairweather fault to the south of these earthquakes. The Chatham Strait fault splinters eastwards from the QCF and connects to the Denali fault just south of this sequence. The Chatham Strait fault was recognized to have dextral slip (right-lateral strike-slip) by Hudson et al. (1982; and references therein) using offsets of geologic units. These and earlier authors found up to 150 km of separation (offset) of these post-middle Cretaceous rocks.
UPDATE: Dr. Rick Koehler (UNR) informs me that the Chilkat section is now included in the Dalton section of the Denali fault.
- Here are some local news posts.
- Yukon News
- Alaska News
- CBC News
- Here are the USGS websites for the two largest earthquakes.
- 2017.05.01 12:31 M 6.2
- 2017.05.01 14:18 M 6.3
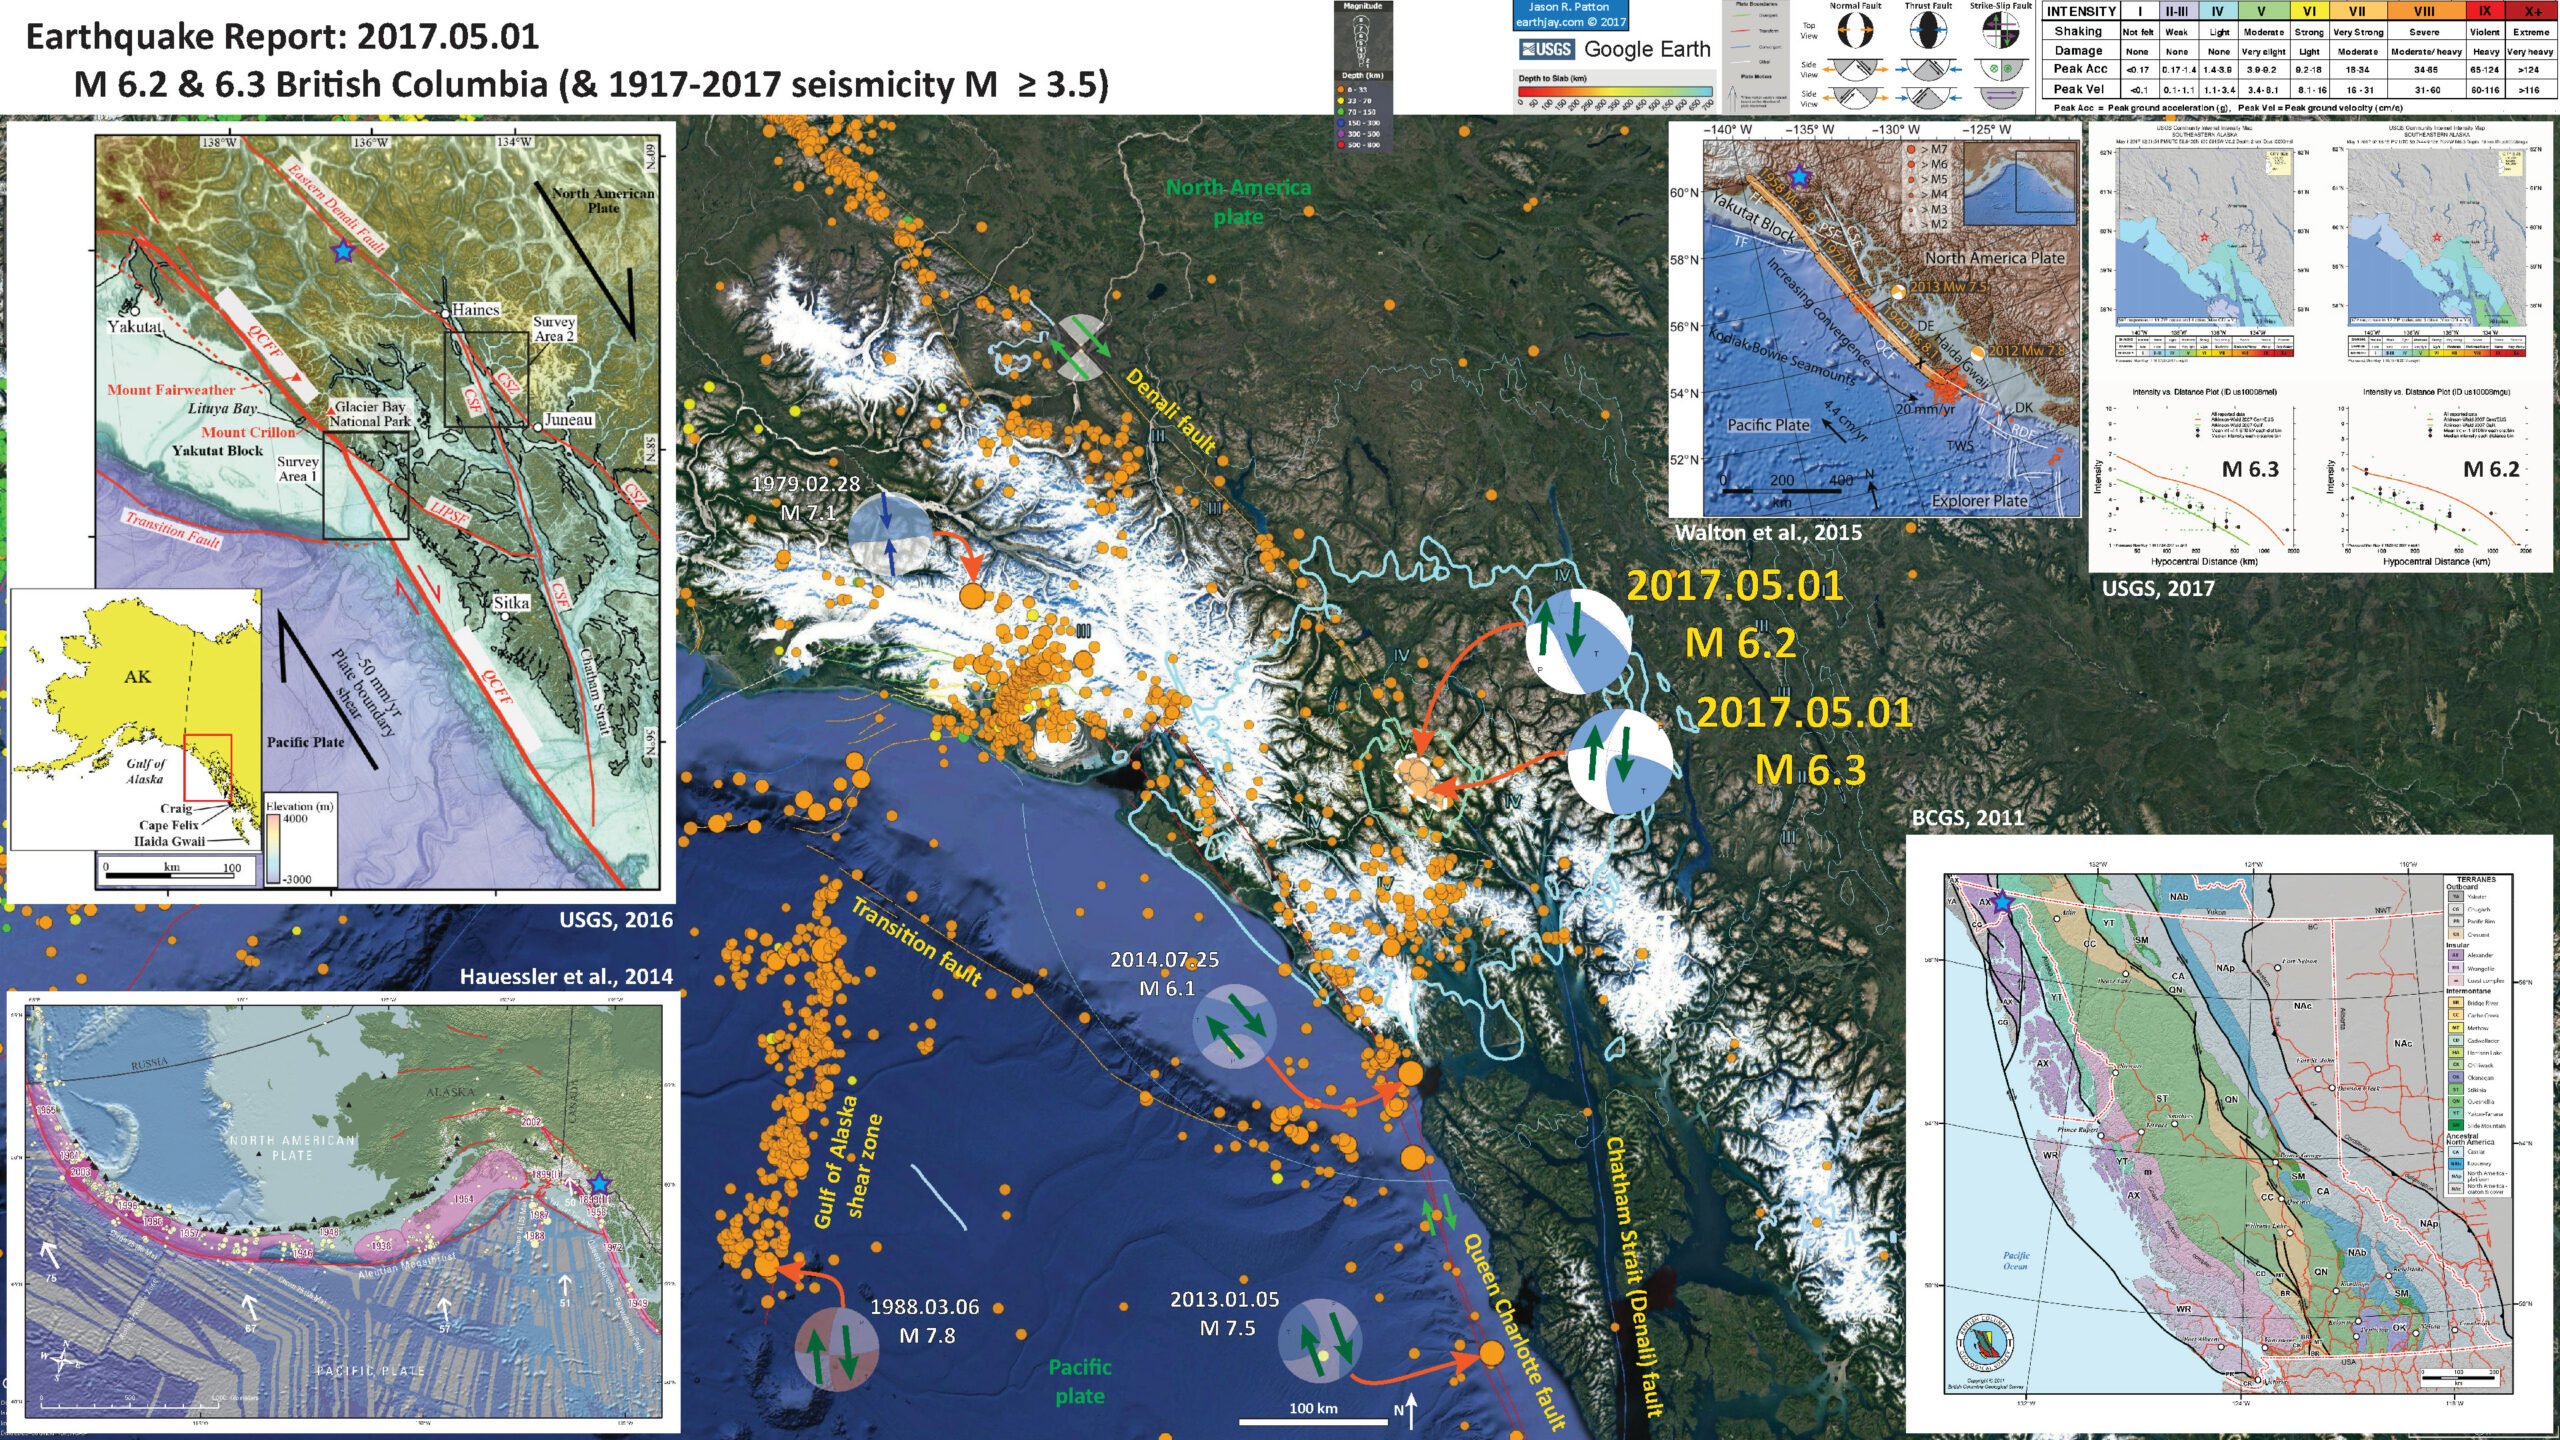
Below is my interpretive poster for this earthquake.
I plot the seismicity from the past month, with color representing depth and diameter representing magnitude (see legend). I also plot USGS epicenters from 1917-2017 for magnitudes M ≥ 3.5. For some of the larger magnitude earthquakes, I include moment tensors (blue) and a focal mechanism (orange) that shows the sense of motion on the faults. I outline the aftershock region of this current sequence in dashed white lines. Here is the USGS kml query file that I used to create this map. Here is a USGS kml file that only includes the earthquakes M ≥ 5.5.
- I placed a moment tensor / focal mechanism legend on the poster. There is more material from the USGS web sites about moment tensors and focal mechanisms (the beach ball symbols). Both moment tensors and focal mechanisms are solutions to seismologic data that reveal two possible interpretations for fault orientation and sense of motion. One must use other information, like the regional tectonics, to interpret which of the two possibilities is more likely. Based upon the alignment of the two mainshocks and the regionally mapped faults, I interpret these to be right-lateral strike-slip faults.
- I also include the shaking intensity contours on the map. These use the Modified Mercalli Intensity Scale (MMI; see the legend on the map). This is based upon a computer model estimate of ground motions, different from the “Did You Feel It?” estimate of ground motions that is actually based on real observations. The MMI is a qualitative measure of shaking intensity. More on the MMI scale can be found here and here. This is based upon a computer model estimate of ground motions, different from the “Did You Feel It?” estimate of ground motions that is actually based on real observations.
- In the lower left corner is a map produced by Dr. Peter Haeussler from the USGS Alaska Science Center (pheuslr at usgs.gov) that shows the historic earthquakes along the Aleutian-Alaska subduction zone. I place a blue star in the general location of today’s earthquake sequence.
- In the upper left corner is a map from the USGS that shows the regional tectonic boundary fault system. The USGS has been working on the onshore and offshore segments of the Queen Charlotte fault for the past few years. For the region of the QCF that is in Canada waters, the Canada Geological Survey has been studying there.
- In the upper right corner are the MMI intensity maps for the two earthquakes listed above: 2017 M 6.3 & 6.2. Below each map are plotted the reports from the Did You Feel It? USGS website for each earthquake. These reports are plotted as green dots with intensity on the vertical axes and distance on the horizontal axes. There are comparisons with Ground Motion Prediction Equation (attenuation relations) results (the orange model uses empirical data from central and eastern US earthquakes; the green model uses empirical data from earthquakes in California). The data seem to fit slightly better to the California empirical relations, which makes sense because this region of Canada/USA is a series of accreted terranes (sequences of subduction zone and oceanic crust material that has been accreted to the North America plate during subduction zone convergence).
- To the left of these DYFI maps is a map from Walton et al. (2015) that shows extents of some of the large earthquakes along the QCF. They also plot the seismicity and focal mechanism from the 2012 Haida Gwaii earthquake and 2013 QCF sequences.
- In the lower right corner is a map showing these accreted terranes (British Columbia Geological Survey, 2011).
I include some inset figures in the poster.

- Here is the map from Hauessler et al., 2014.

- Here is the USGS fault map. I include their figure text below as blockquote.

Study region along the Queen Charlotte-Fairweather fault offshore southeastern Alaska. Rectangles show locations of the two USGS-led marine geophysical surveys in May and August 2015. The third cruise was offshore Haida Gwaii, British Columbia, and southern Alaska in September 2015 (see inset map). CSF, Chatham Strait fault; CSZ, Coastal shear zone; LIPSF, Lisianski Inlet-Peril Strait fault; QCFF, Queen Charlotte-Fairweather fault.
- This is the figure from Walton et al. (2015) showing the extent of some historical ruptures along the QCF.

Regional tectonic setting of the Queen Charlotte fault (QCF), including major fault traces. The inset shows regional location. Because of the angle of the Pacific plate vector and the geometry of the QCF, convergence along the fault increases to the south. The bold X on the QCF marks a 10° change in strike of the QCF at 53.2° N, south of which is an obliquely convergent segment of the QCF undergoing convergence rates up to ∼20 mm=yr. The QCF is bounded to the north by the Yakutat block and to the south by the Explorer triple junction. Rupture zones defined by aftershocks for major historic earthquakes along the margin are indicated by dashed black outlines (Plafker et al., 1994). Aftershocks
circles) and focal mechanisms for the 2013 Mw 7.5 Craig earthquake and the 2012 Mw 7.8 Haida Gwaii earthquake are also included, along with a magnitude scale for aftershocks (derived from the Global Centroid Moment Tensor catalog; Ekström et al., 2012; see Data and Resources). DE, Dixon Entrance; TWS, Tuzo Wilson seamounts; DK, Dellwood Knolls; TF, Transition fault; FF, Fairweather fault; PSF, Peril Strait fault; CSF, Chatham Strait fault.
- Here is a figure from some of the early work on the Chatham Strait fault (Lathram, 1964).

Map showing geologic features displaced by the Chatham Strait fault.
- Here is a great map showing the Denali fault system and some of the paleoseismologic sites on the eastern sections of this fault system (Redfield and Fitzgerald, 1993).
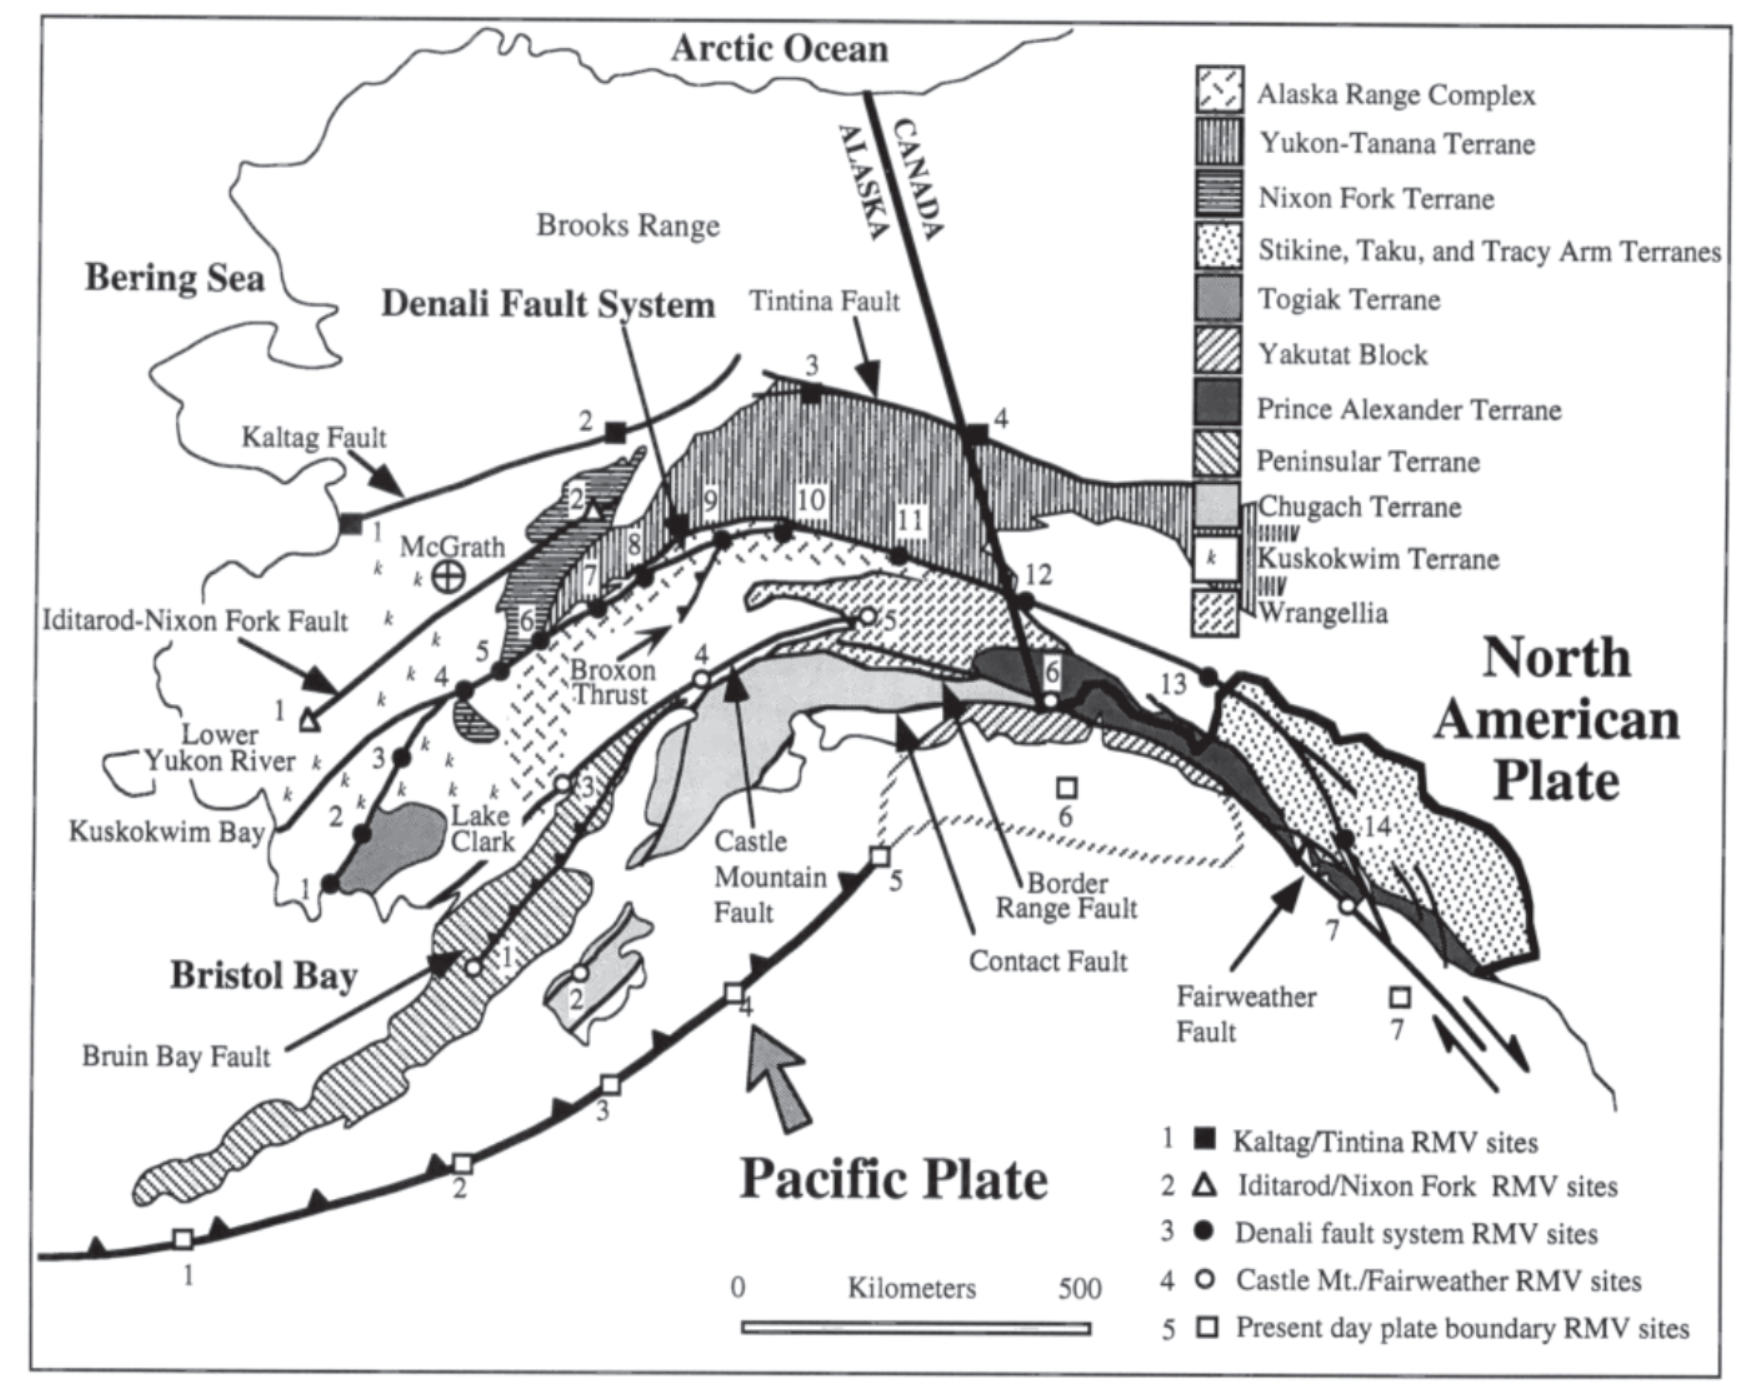
Simplified schematic terrane map of Alaska after Coe et. al. [1985] and Howell et al. [1985], showing the locations of major tectonostratigraphic terranes, structures, relative motion vector(RMV) analysis sites, and other localities mentioned in the text. Note that the Yakutat terrane extends offshore. RMV sites on the DFS are marked with a solid dot. Site 1 of the DFS is on the Togiak/Tikchik fault. Sites 2 and 3 of the DFS are on the Holitna fault. Sites 4-7 of the DFS are on the Farewell fault. Sites 8-10 of the DFS are on the McKinley strand of the Denali fault. Sites 11 and 12 of the DFS is on the Shakwak fault. Site 13 of the DFS is on the faiton Fault. Site 14 of the DFS is on the Chatham Strait fault.
- Here is the map showing the Terranes in British Columbia. This map shows a more regional view than the one on the interpretive poster above.

The framework of the Cordilleran orogen of northwestern North America is commonly depicted as a ‘collage’ of terranes – crustal blocks containing records of a variety of geodynamic environments including continental fragments, pieces of island arc crust and oceanic crust. The series of maps available here are derived from a GIS compilation of terranes based on the map published by Colpron et al. (2007) and Nelson and Colpron (2007), and include modifications from recent regional mapping. These maps are presented in a variety of digital formats including ArcGIS file geodatabase (.gdb), shapefiles (.shp and related files) and Map Packages (.mpk), as well as in a number of graphic formats (Adobe Illustrator CS3, CorelDraw X3, PDF and JPEG). The GIS data include individual terrane layers for British Columbia, Yukon and Alaska, as well as a layer showing selected major Late Cretaceous and Tertiary strike-slip faults. Graphic files derived from the GIS compilation were prepared for the Northern Cordillera (Alaska, Yukon and BC), the Canadian Cordillera (BC and Yukon), Yukon, and British Columbia. These maps are intended for page-size display (~1:5,000,000 and smaller). Polygons are accurate to ~1 km for Yukon and BC, and ~5 km for Alaska. More detailed geological data are available from both BC Geological Survey and Yukon Geological Survey websites. Descriptions of the terranes, their tectonic evolution and metallogeny can be found in Colpron et al. (2007), Nelson and Colpron (2007), Colpron and Nelson (2009).
- Here is a map showing all the mapped faults in this region. I drew a dashed blue line connecting the M 6.3 and M 6.2 epicenters. Note (if one clicks on the map to see a larger version) that the orientation of this alignment is oblique to the fault orientations (which are generally aligned sub parallel to the Denali fault). This map comes from the British Columbia data catalogue.

- UPDATE: Dr. Sean Bemis posted this model on Sketchfab. Dr. Bemis used 1948 aerial imagery, in Agisoft Photoscan software, to create this 3-D model using the method called “Structure For Motion” (SFM). He then exported the model to Sketchfab. Agisoft has academic pricing for their software. However, there is also free software available that does the stuff the Photoscan does (though one may need to use multiple apps).
- There is a north-south lineation that aligns nicely with the strike-line formed between the M 6.3 & M 6.2 epicenters (not shown on the 3-D model).
References:
- Benz, H.M., Tarr, A.C., Hayes, G.P., Villaseñor, Antonio, Hayes, G.P., Furlong, K.P., Dart, R.L., and Rhea, Susan, 2010. Seismicity of the Earth 1900–2010 Aleutian arc and vicinity: U.S. Geological Survey Open-File Report 2010–1083-B, scale 1:5,000,000.
- Haeussler, P., Leith, W., Wald, D., Filson, J., Wolfe, C., and Applegate, D., 2014. Geophysical Advances Triggered by the 1964 Great Alaska Earthquake in EOS, Transactions, American Geophysical Union, v. 95, no. 17, p. 141-142.
- Hudson, Travis, Plafker, George, and Dixon, Kirk, 1982, Horizontal offset history of the Chatham Strait fault, in Coonrad, W.L., ed., The United States Geological Survey in Alaska, Accomplishments during 1980, Geological Survey Circular 844, p. 128-131
- Lathram, E.H., 1964. Apparent Right-Lateral Separation on Chatham Strait Fault, Southeastern Alaska in GSA Bulletin, v. 75, p. 249-252.
- Plafker, G., 1969. Tectonics of the March 27, 1964 Alaska earthquake: U.S. Geological Survey Professional Paper 543–I, 74 p., 2 sheets, scales 1:2,000,000 and 1:500,000, http://pubs.usgs.gov/pp/0543i/.
- Redfield, T.F. and Fitzgerald, P.G., 1993. Denali Fault System of Southern Alaska: An Interior Strike_slip Structure Responding to Dextral and Sinistral Shear Coupling in Tectonics, v. 12, no. 5, p. 1195-1208
- West, M.E., Haeussler, P.L., Ruppert, N.A., Freymueller, J.T., and the Alaska Seismic Hazards Safety Commission, 2014. Why the 1964 Great Alaska Earthquake Matters 50 Years Later in Seismological Research Letters, v. 85, no. 2, p. 1-7.