We just had a good shaker in western Turkey. At the moment, there are over 400 reports of ground shaking to the USGS “Did you Feel It?” web page. The USGS PAGER report estimates that there may be some casualties (though a low number of them), but that the economic loss estimate is higher (35% chance of between 10 and 100 million USD).
This earthquake appears to have been along a normal fault named either the Bodum fault (NOA; Helenic Seismic Network) or the Ula-Oren fault (GreDASS; Greek Database of Seismogenic Sources). The inset map shows the faults and fault planes from the GreDASS database. A third name for this fault is the Gökova fault (Kurt et al., 1999).
Here is the USGS website for this earthquake.
There is lots of information on the European-Mediterranean Seismological Centre (EMSC) page here.
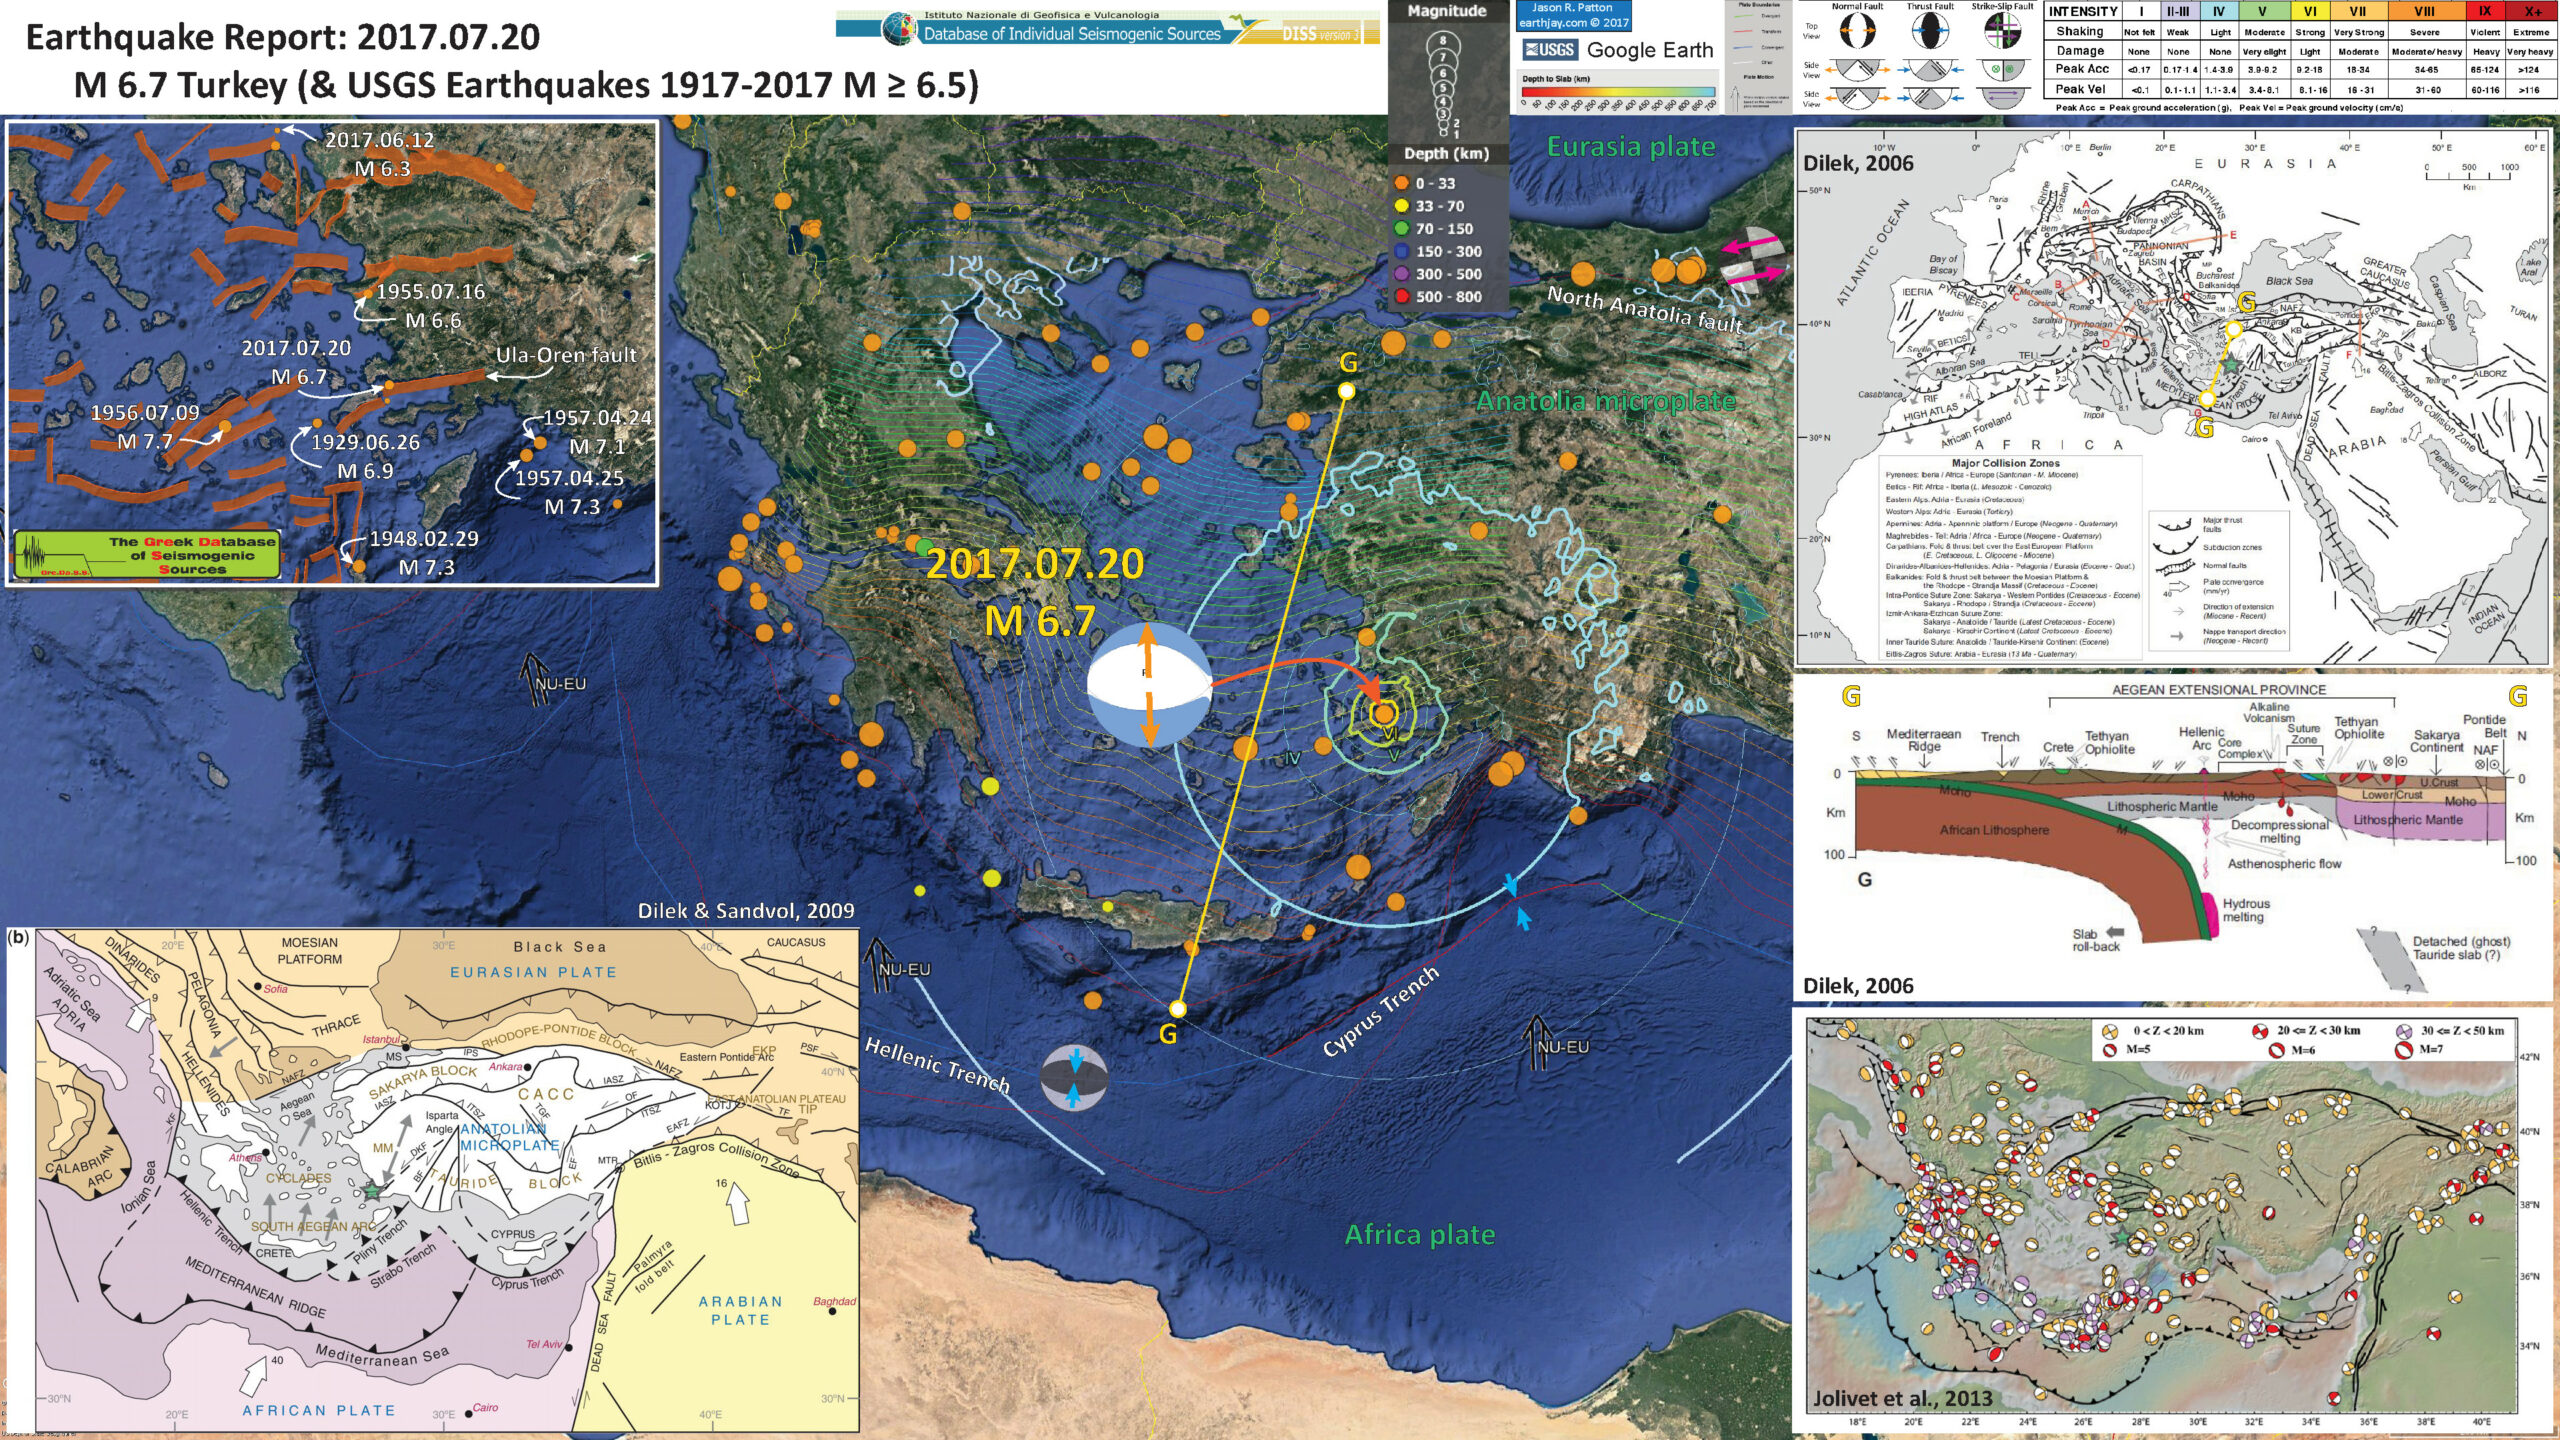
Below is my interpretive poster for this earthquake.
I plot the seismicity from the past month, with color representing depth and diameter representing magnitude (see legend). I also include USGS earthquake epicenters from 1917-2017 for magnitudes M ≥ 6.5. This is also the time and magnitude range of earthquakes in the inset map.
- I placed a moment tensor / focal mechanism legend on the poster. There is more material from the USGS web sites about moment tensors and focal mechanisms (the beach ball symbols). Both moment tensors and focal mechanisms are solutions to seismologic data that reveal two possible interpretations for fault orientation and sense of motion. One must use other information, like the regional tectonics, to interpret which of the two possibilities is more likely. I plot moment tensors for the M 6.3 earthquake. Based upon the series of earthquakes and the mapped faults, I interpret this M 6.7 earthquake to be a normal fault (extensional) earthquake.
- I also include the shaking intensity contours on the map. These use the Modified Mercalli Intensity Scale (MMI; see the legend on the map). This is based upon a computer model estimate of ground motions, different from the “Did You Feel It?” estimate of ground motions that is actually based on real observations. The MMI is a qualitative measure of shaking intensity. More on the MMI scale can be found here and here. This is based upon a computer model estimate of ground motions, different from the “Did You Feel It?” estimate of ground motions that is actually based on real observations.
- I include the slab contours plotted from the (Database of Individual Seismogenic Sources (DISS), Version 3.2.0), which are contours that represent the depth to the subduction zone fault. These are mostly based upon seismicity. The depths of the earthquakes have considerable error and do not all occur along the subduction zone faults, so these slab contours are simply the best estimate for the location of the fault.
- In the lower left corner I include a map of the regional tectonics (Dilek and Sandvol, 2009). I place a green star in the general location of today’s M 6.7 earthquake.
- In the lower right corner is a figure from Jolivet et al. (2013) that shows focal mechanisms for earthquakes across the Aegean-Anatolian region. Earthquakes plotted in the region of today’s M 6.7 (the green star) are all normal (extensional) earthquakes (with one extensional oblique).
- In the upper right corner is a tectonic map of western Eurasia and northern Africa (Dilek, 2006). Today’s earthquake lies near the cross section G-G (in yellow). I also show the general location of this cross-section on the main map.
- Below this map is a figure showing a north-south cross section through this region (Dilek, 2006), G-G on the above map. This shows the subduction zone in the south, the transform fault (North Anatolian fault) in the north, and the Aegean Extensional Province in the center. Today’s earthquake is along the southern boundary of the core complex, which is in the center of this extensional province.
- In the upper left corner is a larger scale map showing the same earthquakes as the main map. I also include the faults and fault planes from the GreDASS database. I also label the larger earthquakes in this region. Note the 2017 M 6.3 Lesbos earthquake in the north. Here is my earthquake report for that earthquake. Note the flare up of seismicity in the 1950s, possibly beginning in 1948.
I include some inset figures in the poster.
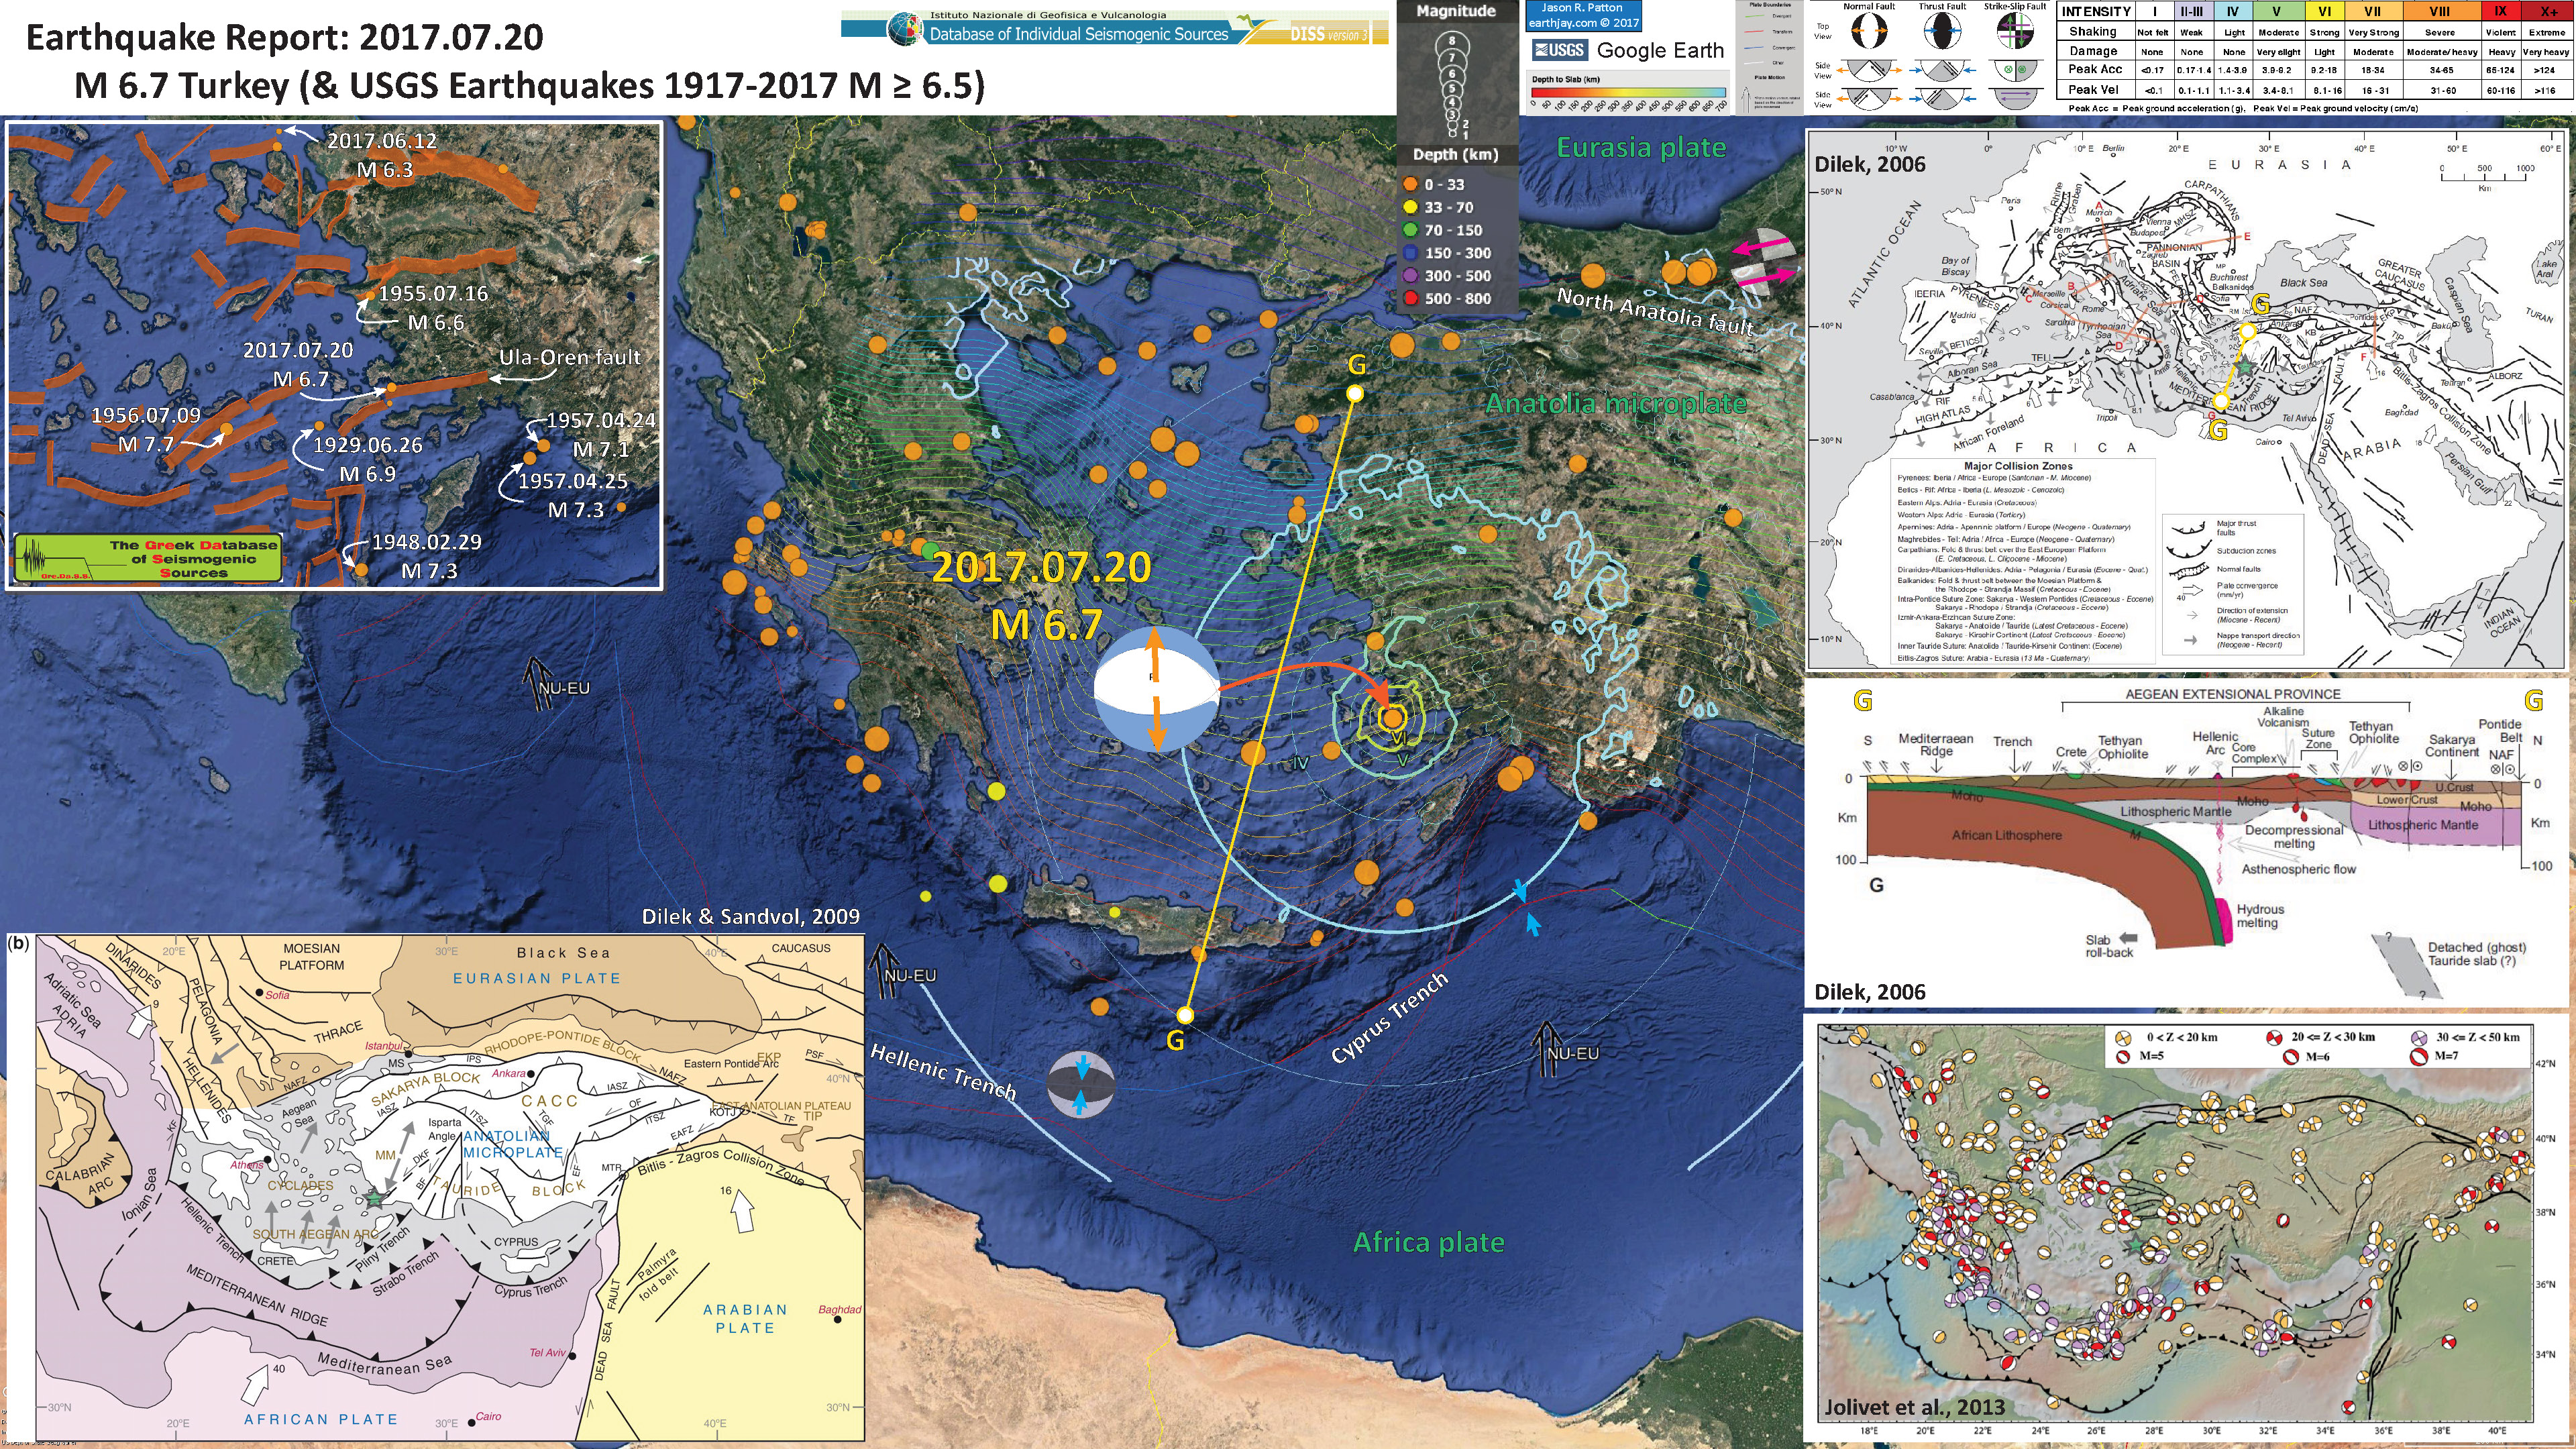
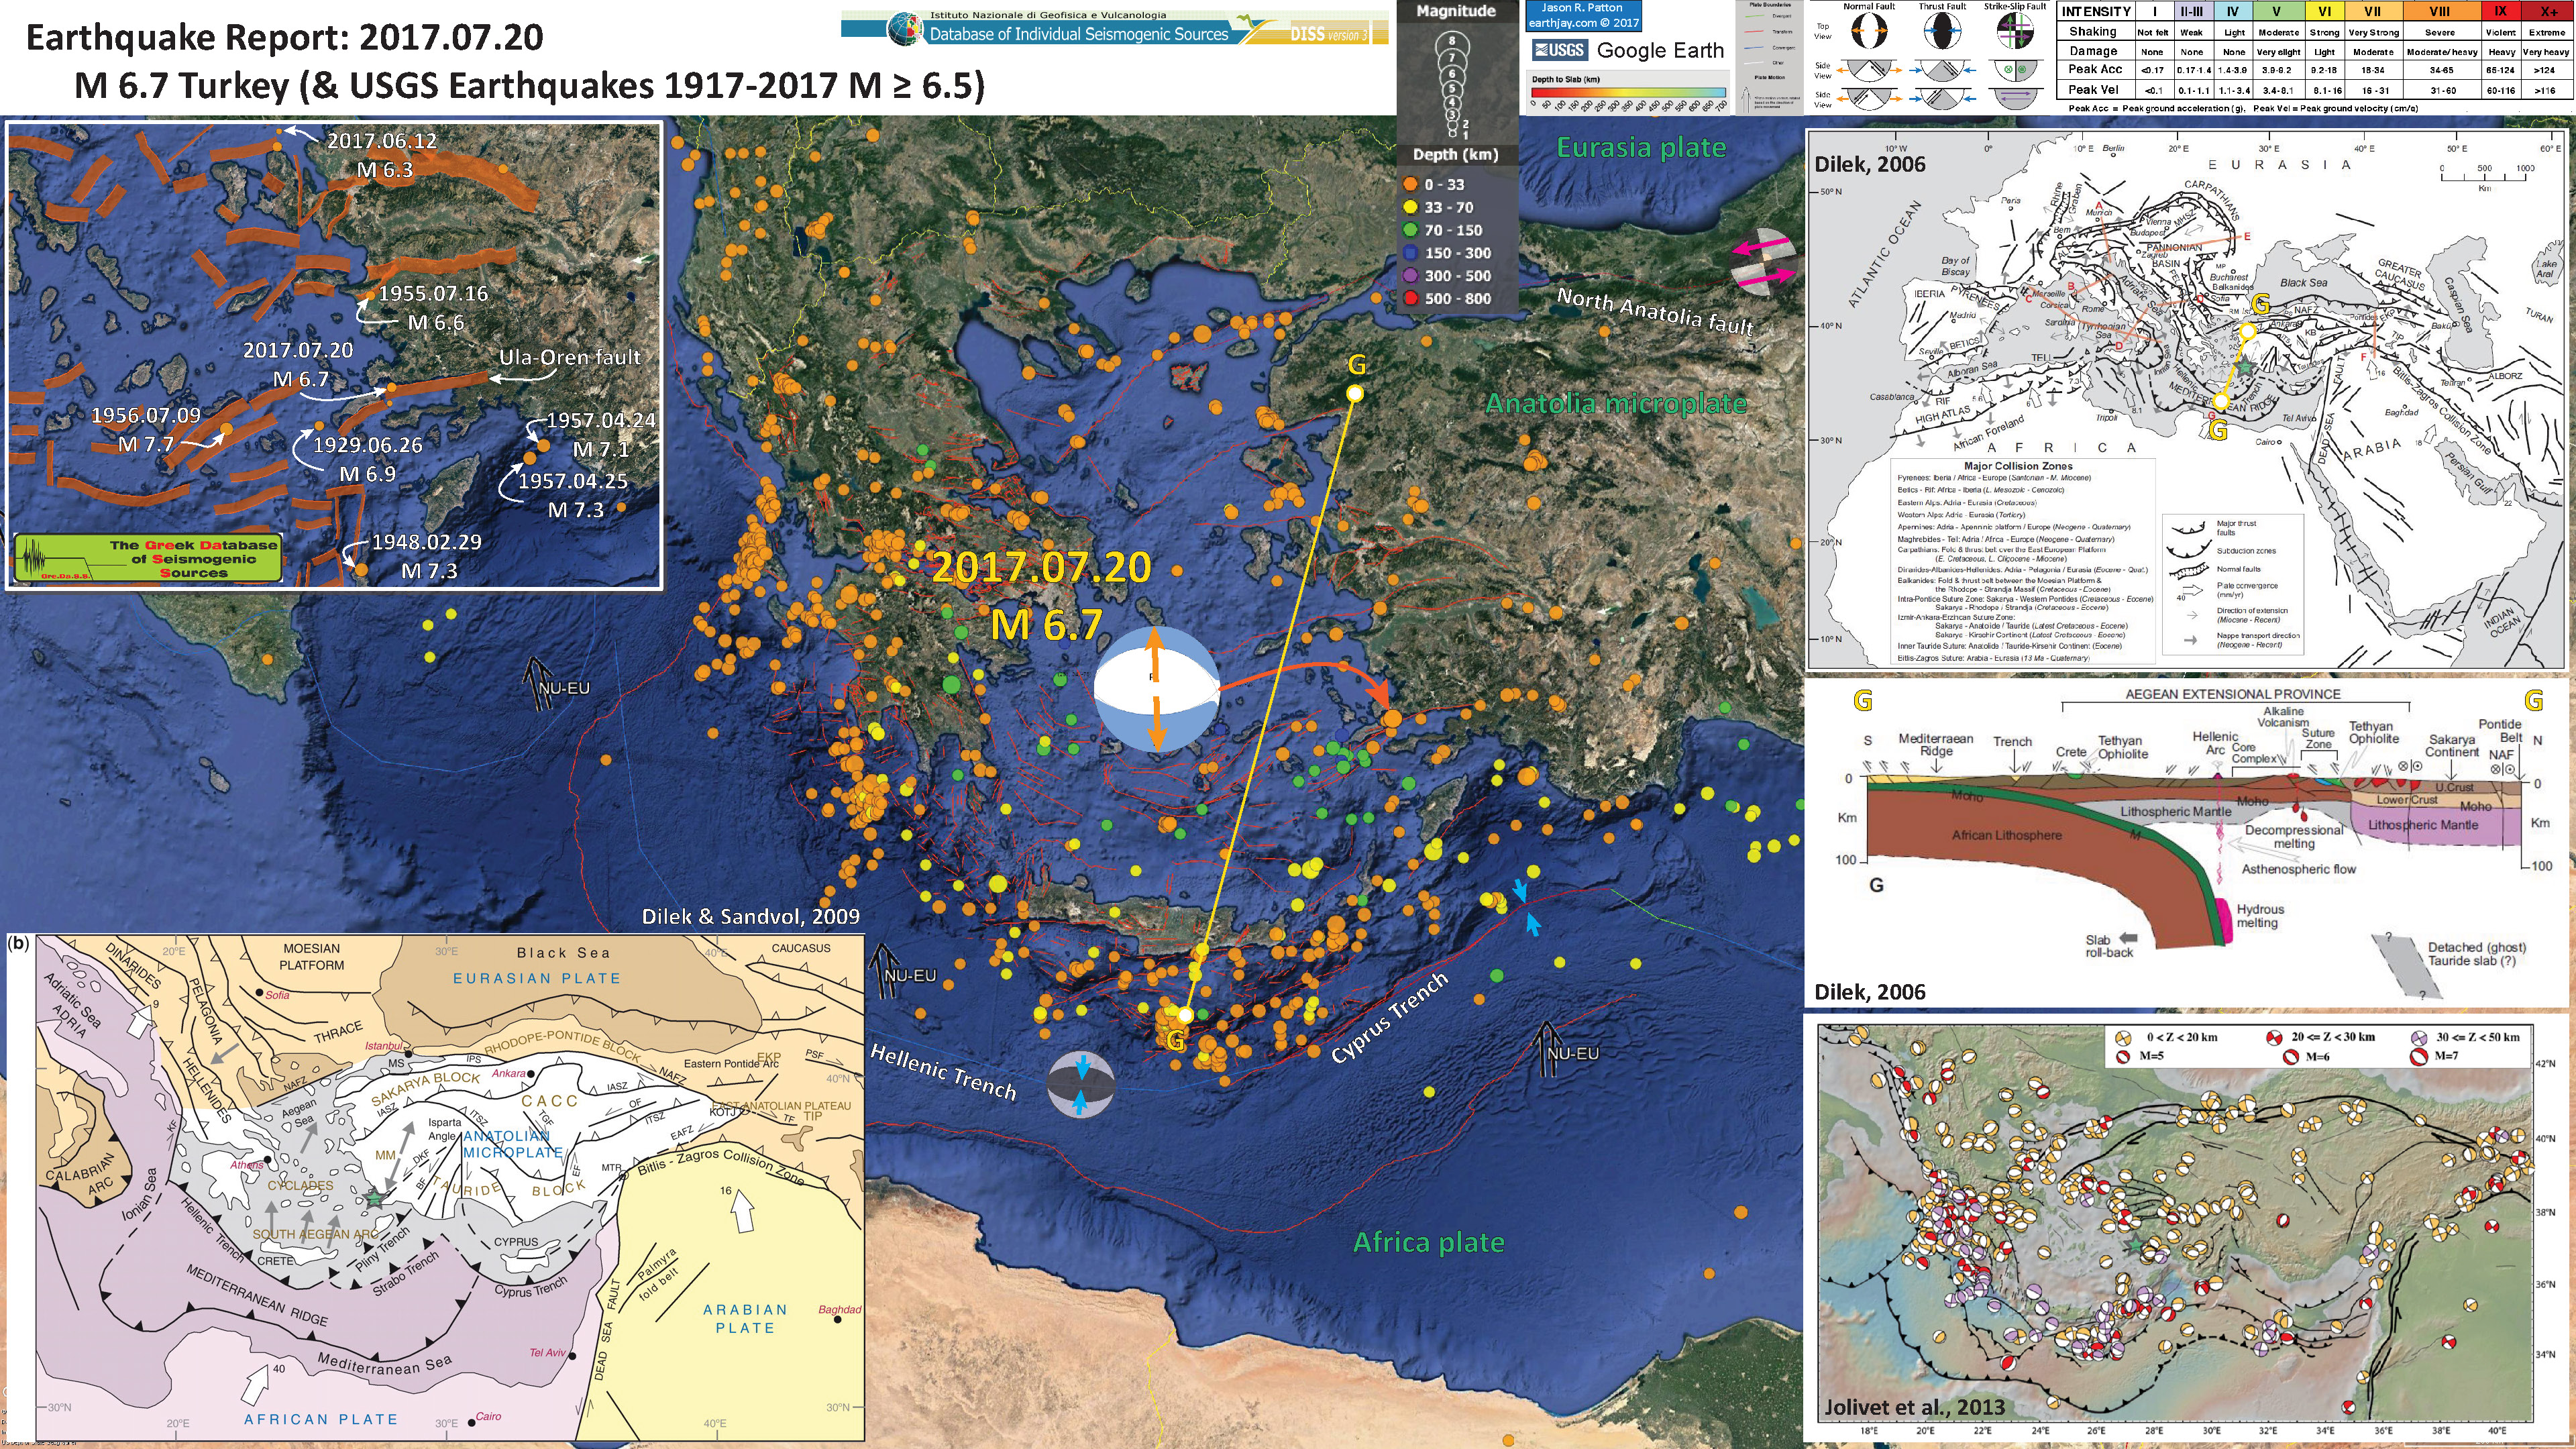
- Here is the same poster, but with USGS earthquake epicenters from 2007-2017 with magnitude M ≥ 4.5.
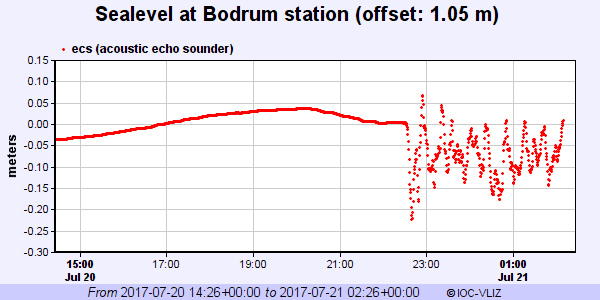
- There was a small tsunami recorded at the Bodum tide gage. Here is the source.
- Here is the tectonic map from Dilek and Sandvol (2009).
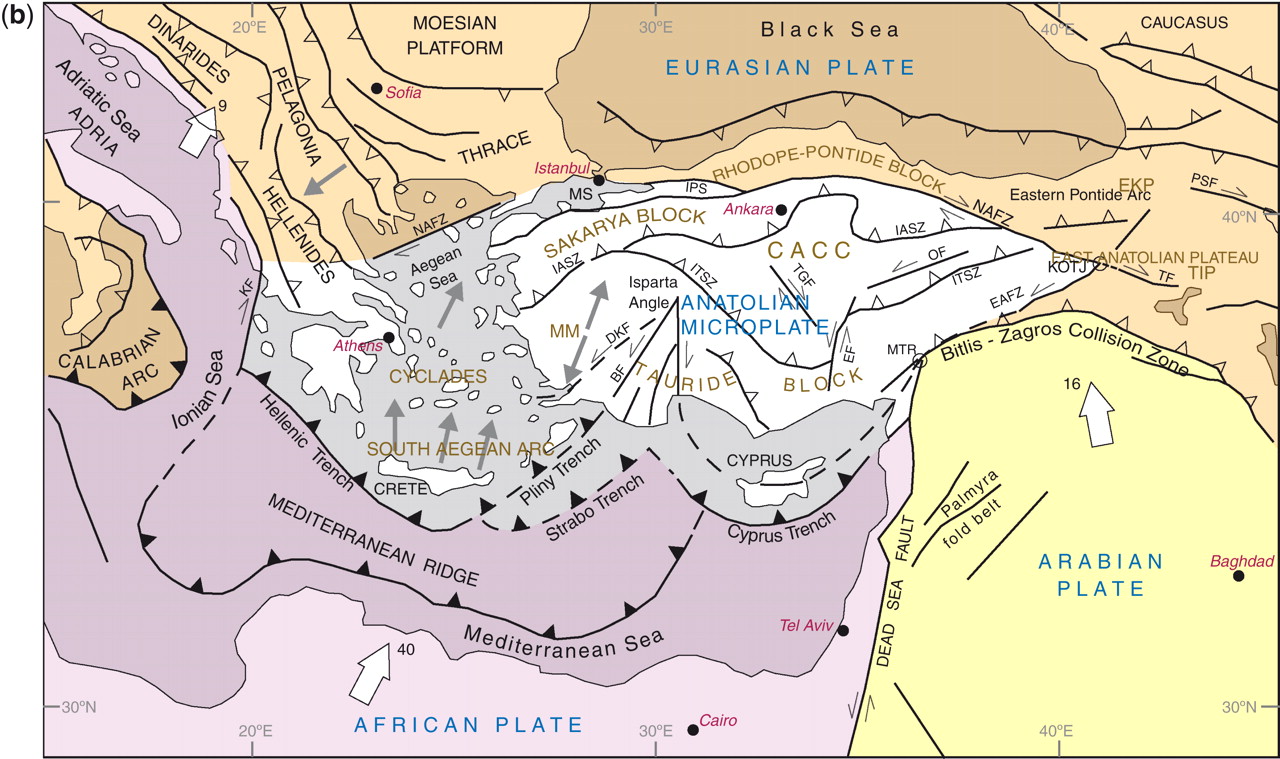
Tectonic map of the Aegean and eastern Mediterranean region showing the main plate boundaries, major suture zones, fault systems and tectonic units. Thick, white arrows depict the direction and magnitude (mm a21) of plate convergence; grey arrows mark the direction of extension (Miocene–Recent). Orange and purple delineate Eurasian and African plate affinities, respectively. Key to lettering: BF, Burdur fault; CACC, Central Anatolian Crystalline Complex; DKF, Datc¸a–Kale fault (part of the SW Anatolian Shear Zone); EAFZ, East Anatolian fault zone; EF, Ecemis fault; EKP, Erzurum–Kars Plateau; IASZ, Izmir–Ankara suture zone; IPS, Intra–Pontide suture zone; ITS, Inner–Tauride suture; KF, Kefalonia fault; KOTJ, Karliova triple junction; MM, Menderes massif; MS, Marmara Sea; MTR, Maras triple junction; NAFZ, North Anatolian fault zone; OF, Ovacik fault; PSF, Pampak–Sevan fault; TF, Tutak fault; TGF, Tuzgo¨lu¨ fault; TIP, Turkish–Iranian plateau (modified from Dilek 2006).
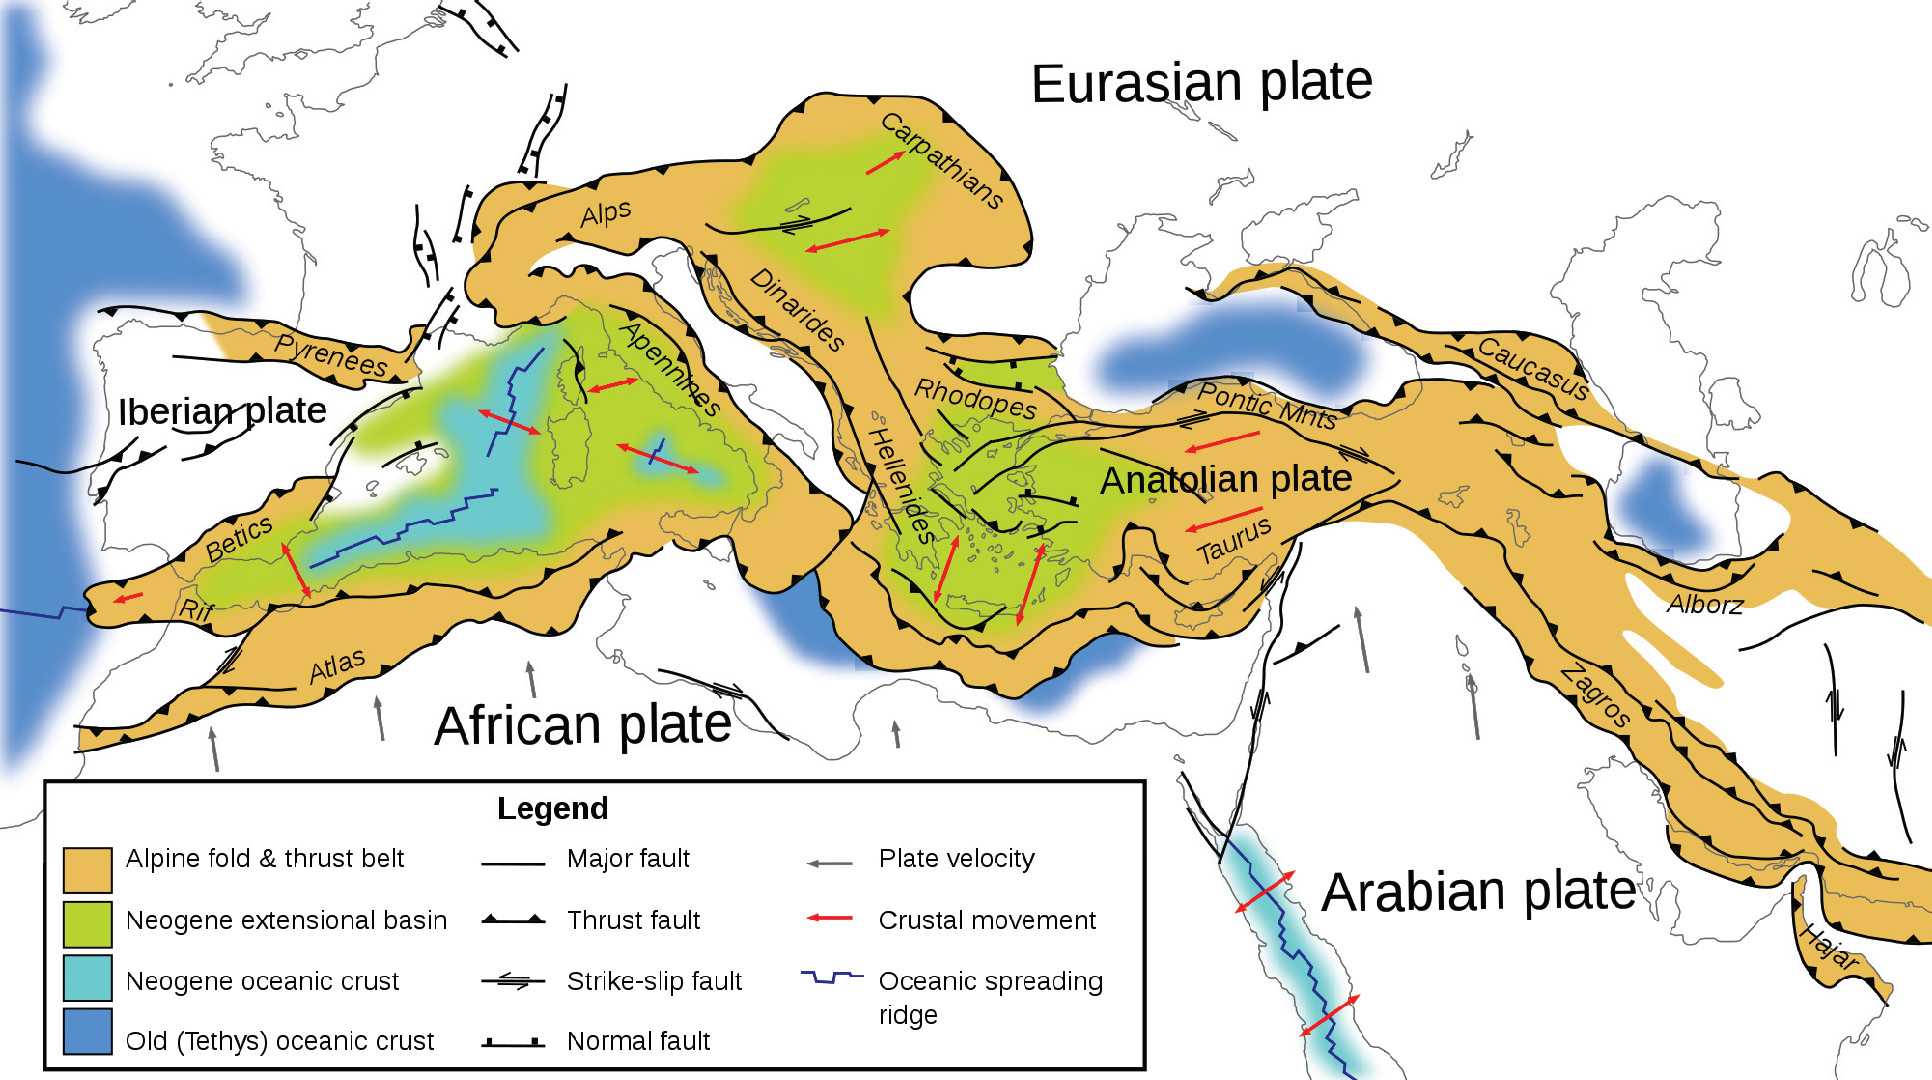
- This is the Wouldloper (2009) tectonic map of the Mediterranean Sea.
- Below is a series of figures from Jolivet et al. (2013). These show various data sets and analyses for Greece and Turkey.
- Upper Panel (A): This is a tectonic map showing the major faults and geologic terranes in the region. The fault possibly associated with today’s earthquake is labeled OU on the map, for the Ula-Oren fault.
- Lower Panel (B): This shows historic seismicity for the region. Note the general correlation with the faults in the upper panel.
- Upper Panel (C): These red arrows are Global Positioning System (GPS) velocity vectors. The velocity scale vector is in the lower left corner. The main geodetic (study of plate motions and deformation of the earth) signal here is the westward motion of the North Anatolian fault system as it rotates southward as it traverses Greece. The motion trends almost south near the island of Crete, which is perpendicular to the subduction zone.
- Lower Panel (D): This map shows the region of mid-Cenozoic (Oligo-Miocene) extension (shaded orange). It just happens that there is still extension going on in parts of this prehistoric extension.
- Upper Panel (E): This map shows where the downgoing slab may be located (in blue), along with the volcanic centers associated with the subduction zone in the past.
- Lower Panel (F): This map shows the orientation of how seismic waves orient themselves differently in different places (anisotropy). We think seismic waves travel in ways that reflects how tectonic strain is stored in the earth. The blue lines show the direction of extension in the asthenosphere, green lines in the lithospheric mantle, and red lines for the crust.
- Upper Panel (G): This is the map showing focal mechanisms in the poster above. Note the strike slip earthquakes associated with the North Anatolian fault and the thrust/reverse mechanisms associated with the thrust faults.
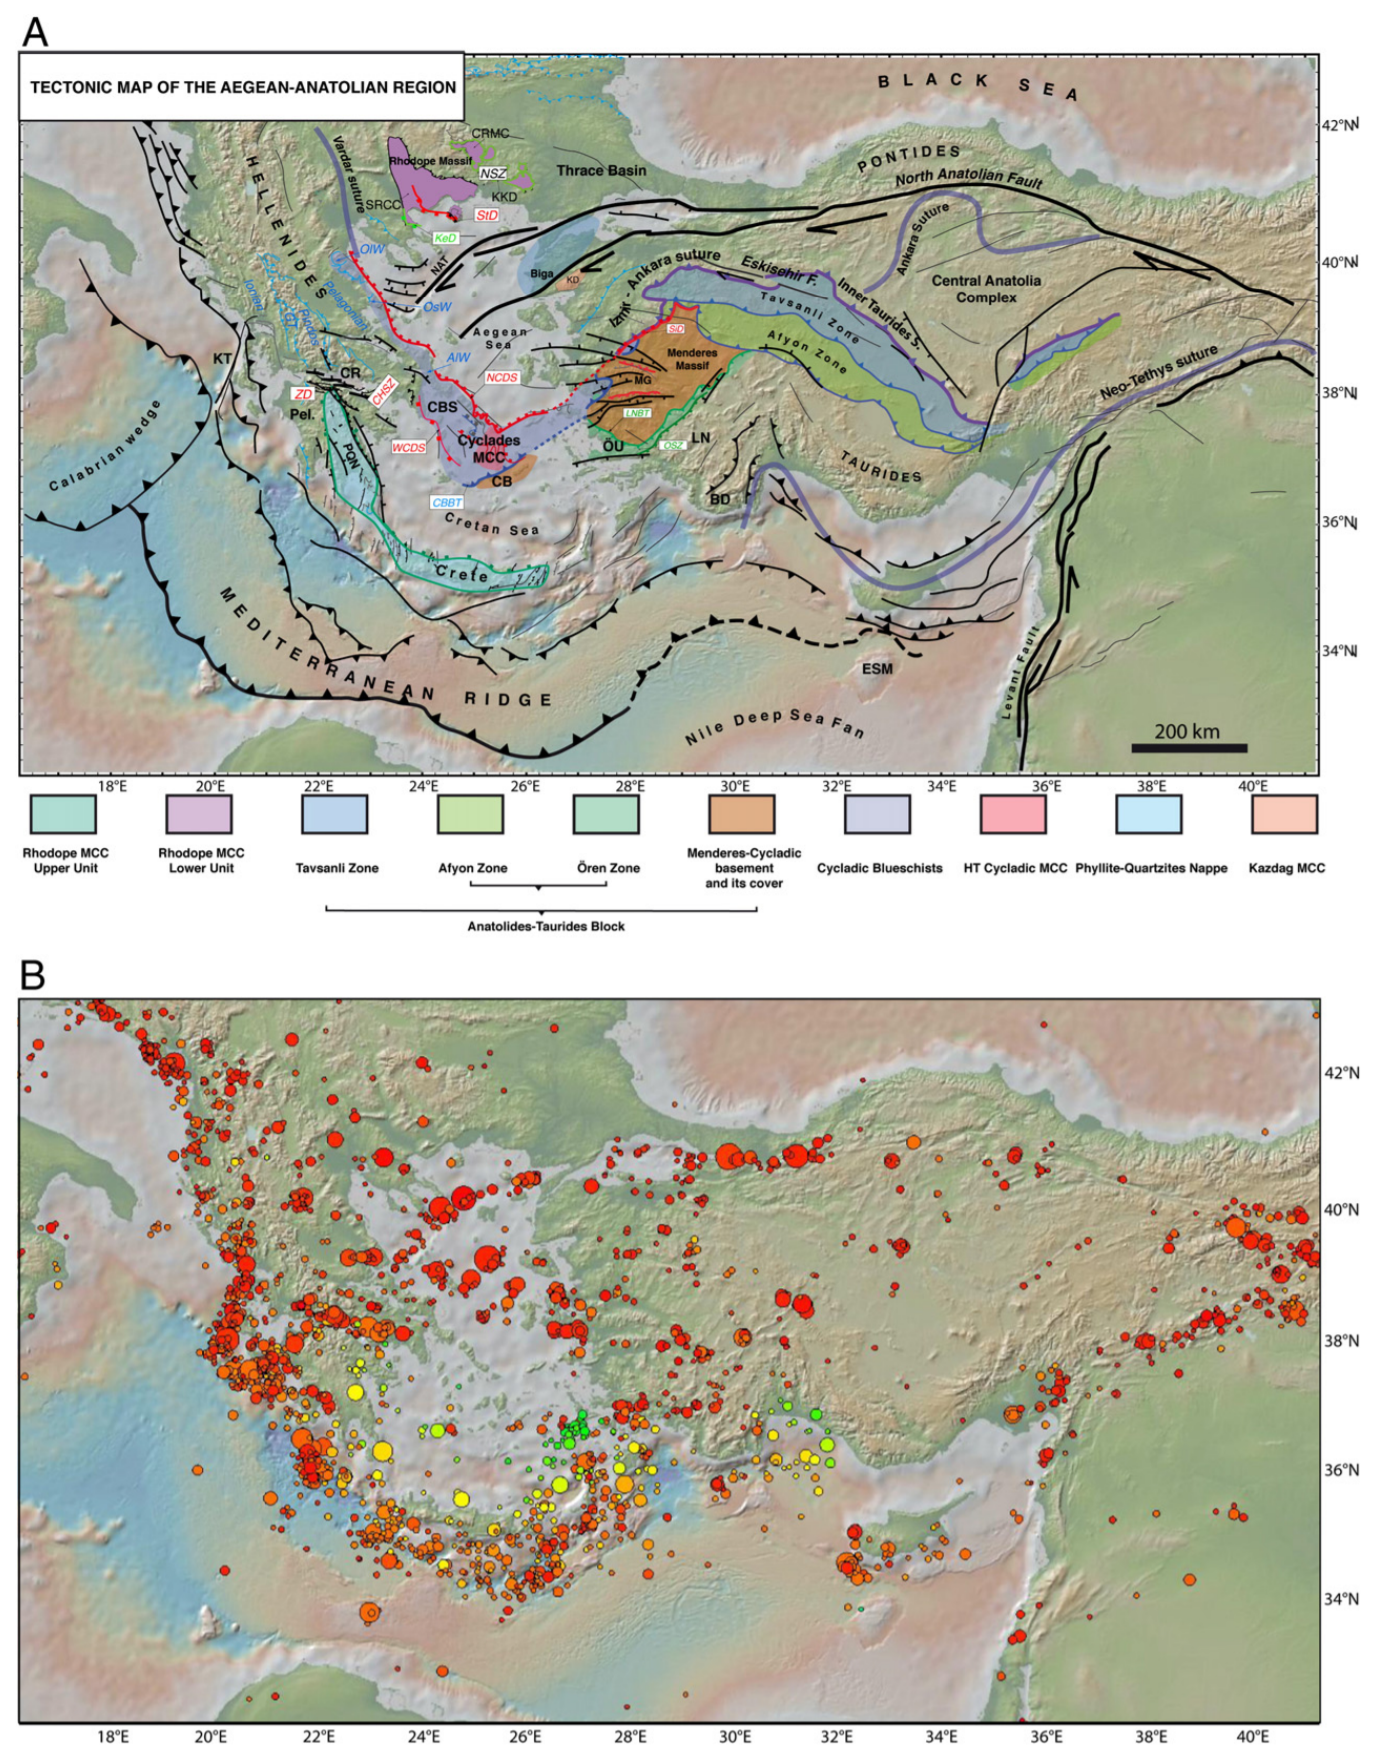
A: Tectonic map of the Aegean and Anatolian region showing the main active structures
(black lines), the main sutures zones (thick violet or blue lines), the main thrusts in the Hellenides where they have not been reworked by later extension (thin blue lines), the North Cycladic Detachment (NCDS, in red) and its extension in the Simav Detachment (SD), the main metamorphic units and their contacts; AlW: Almyropotamos window; BD: Bey Daglari; CB: Cycladic Basement; CBBT: Cycladic Basement basal thrust; CBS: Cycladic Blueschists; CHSZ: Central Hellenic Shear Zone; CR: Corinth Rift; CRMC: Central Rhodope Metamorphic Complex; GT: Gavrovo–Tripolitza Nappe; KD: Kazdag dome; KeD: Kerdylion Detachment; KKD: Kesebir–Kardamos dome; KT: Kephalonia Transform Fault; LN: Lycian Nappes; LNBT: Lycian Nappes Basal Thrust; MCC: Metamorphic Core Complex; MG: Menderes Grabens; NAT: North Aegean Trough; NCDS: North Cycladic Detachment System; NSZ: Nestos Shear Zone; OlW: Olympos Window; OsW: Ossa Window; OSZ: Ören Shear Zone; Pel.: Peloponnese; ÖU: Ören Unit; PQN: Phyllite–Quartzite Nappe; SiD: Simav Detachment; SRCC: South Rhodope Core Complex; StD: Strymon Detachment; WCDS: West Cycladic Detachment System; ZD: Zaroukla Detachment. B: Seismicity. Earthquakes are taken from the USGS-NEIC database. Colour of symbols gives the depth (blue for shallow depths) and size gives the magnitude (from 4.5 to 7.6).
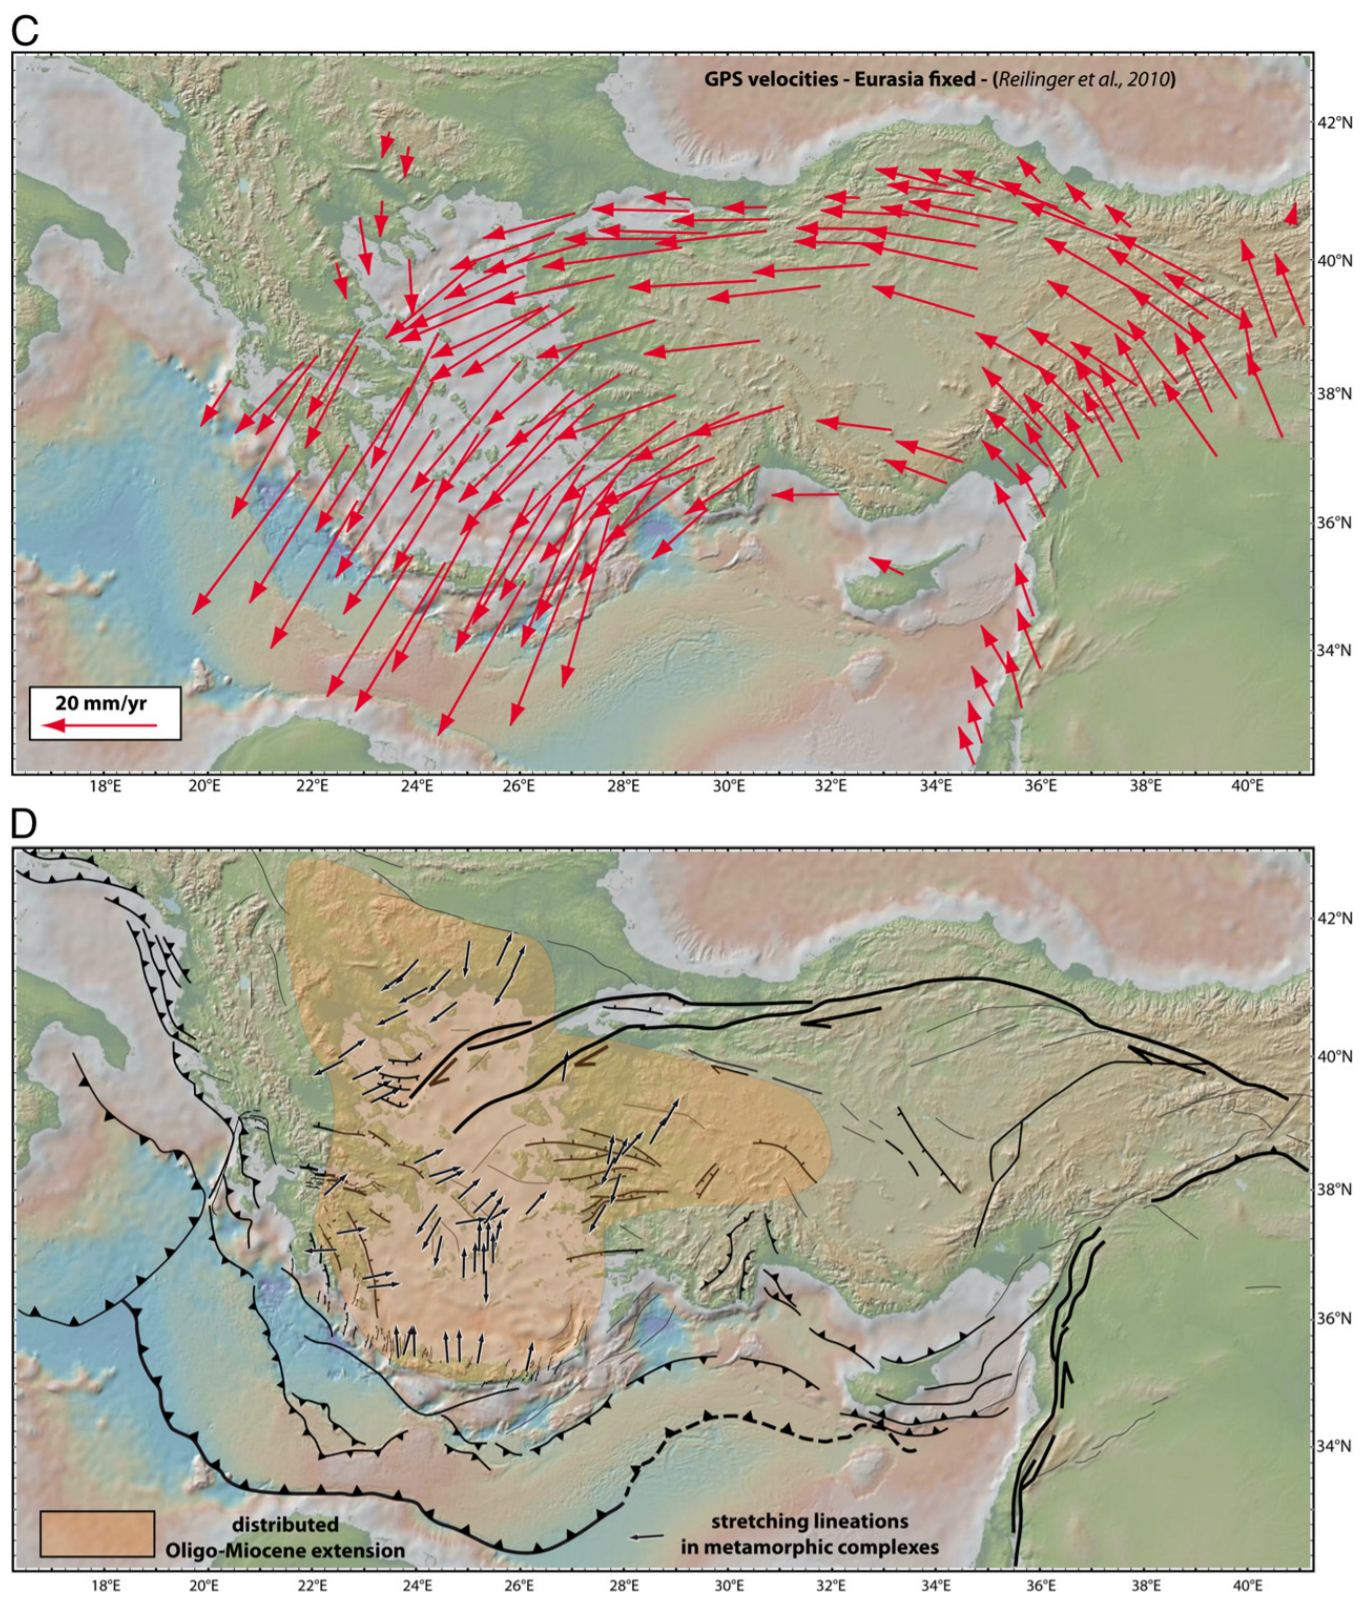
C: GPS velocity field with a fixed Eurasia after Reilinger et al. (2010) D: the domain affected by distributed post-orogenic extension in the Oligocene and the Miocene and the stretching lineations in the exhumed metamorphic complexes.
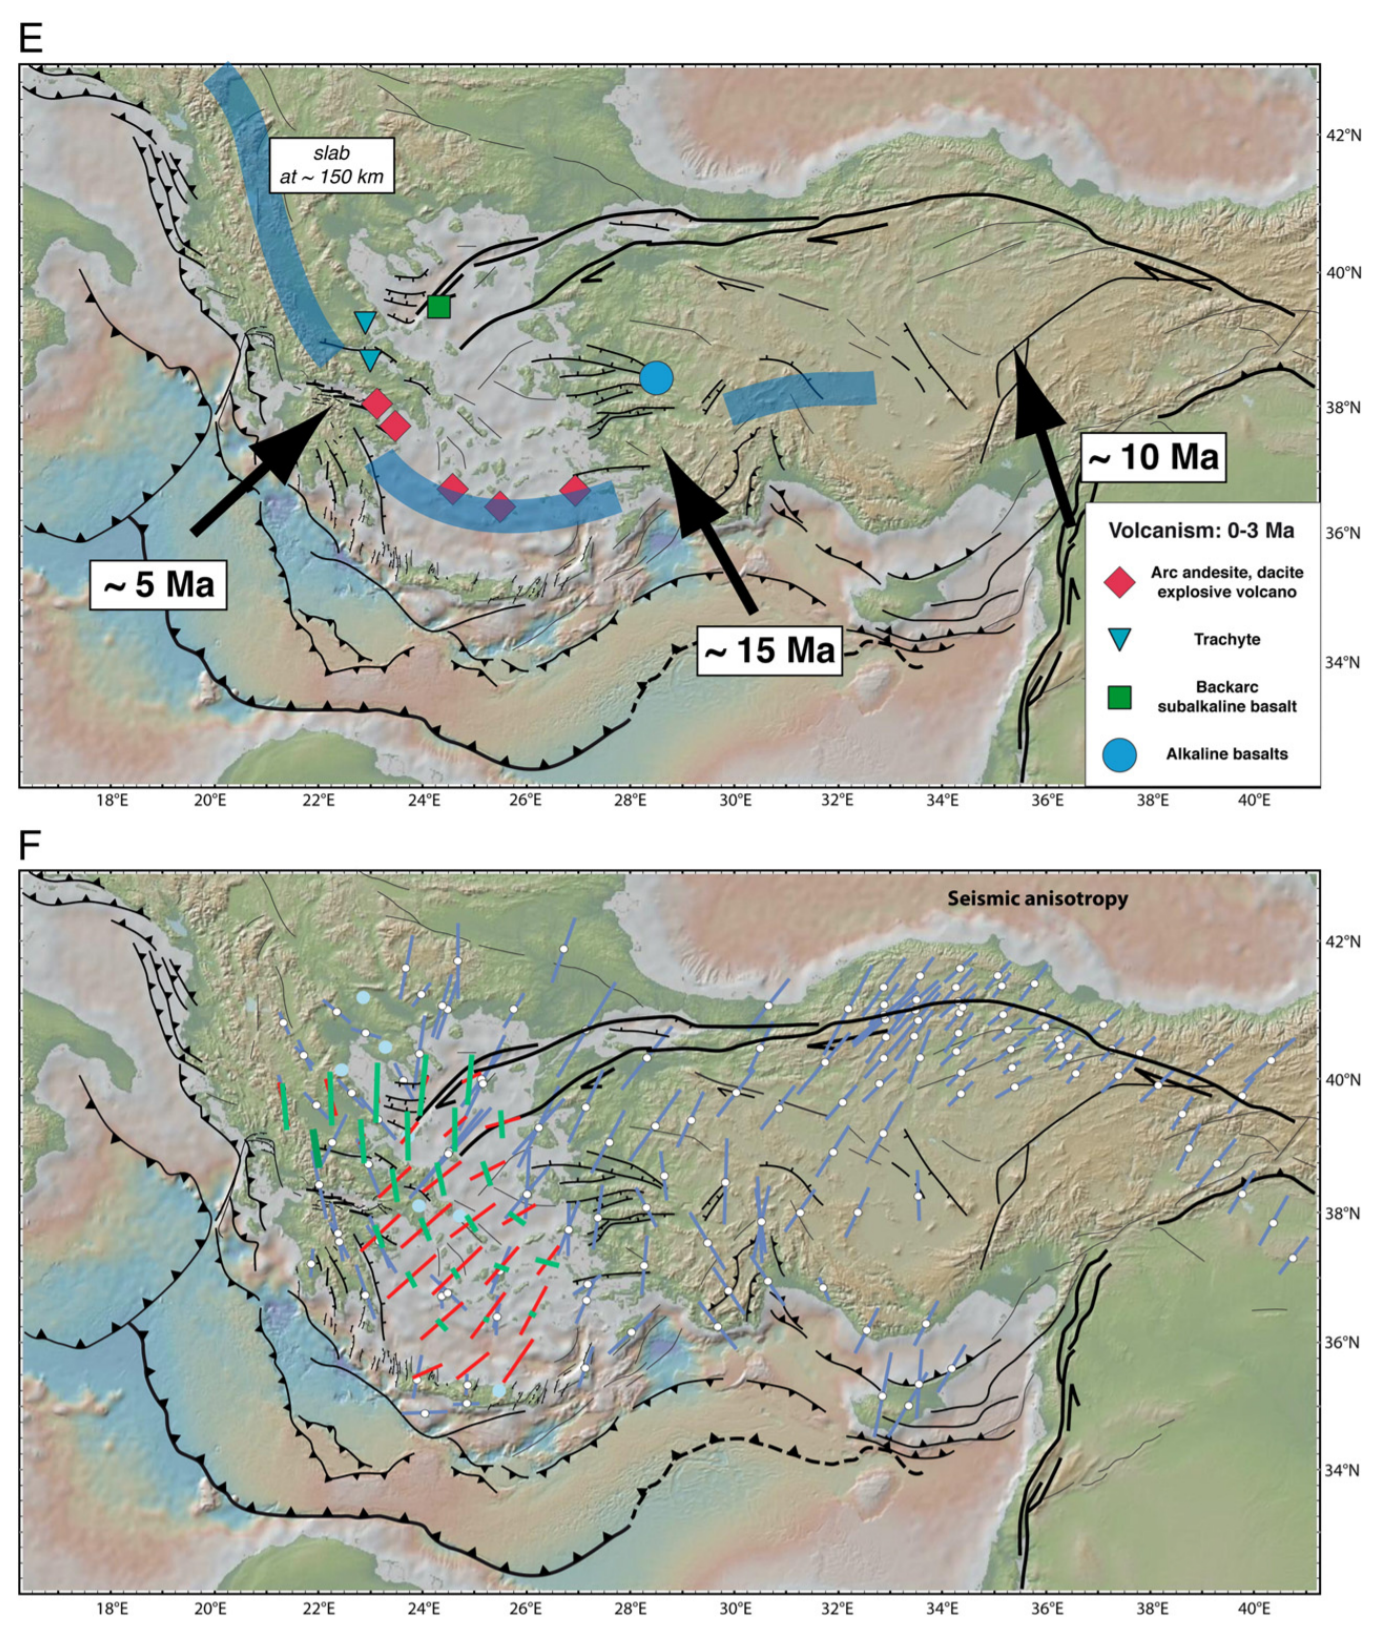
E: The thick blue lines illustrate the schematized position of the slab at ~150 km according to the tomographic model of Piromallo and Morelli (2003), and show the disruption of the slab at three positions and possible ages of these tears discussed in the text. Velocity anomalies are displayed in percentages with respect to the reference model sp6 (Morelli and Dziewonski, 1993). Coloured symbols represent the volcanic centres between 0 and 3 Ma after Pe-Piper and Piper (2006). F: Seismic anisotropy obtained from SKS waves (blue bars, Paul et al., 2010) and Rayleigh waves (green and orange bars, Endrun et al., 2011). See also Sandvol et al. (2003). Blue lines show the direction of stretching in the asthenosphere, green bars represent the stretching in the lithospheric mantle and orange bars in the lower crust.
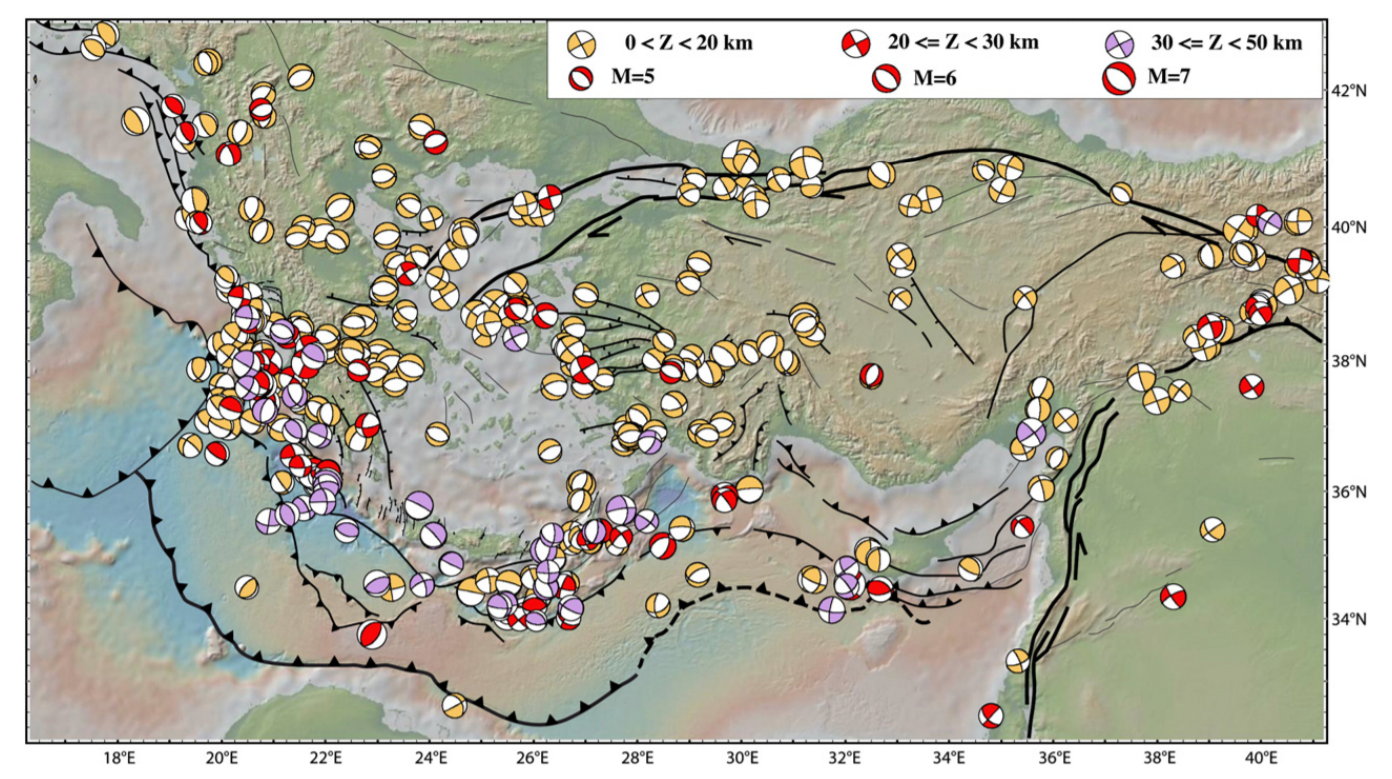
G: Focal mechanisms of earthquakes over the Aegean Anatolian region.
- Here is a figure showing a north-south cross section through this region, from ~95 million years ago until about 2 million years ago (Dilek and Sandvol, 2009). This figure shows how the regional tectonics have developed over time, with the modern subduction zone in the south, the North Anatolian transform fault in the north, and an extensional metamorphic core complex in the center (“Core Complex” on cross section). Today’s earthquake is along the southern boundary of this core complex.

Late Mesozoic–Cenozoic geodynamic evolution of the western Anatolian orogenic belt as a result of collisional and extensional processes in the upper plate of north-dipping subduction zone(s) within the Tethyan realm.
- This is a great figure showing another interpretation to explain the extension in this region (slab rollback and mantle flow) from Brun and Sokoutis (2012).
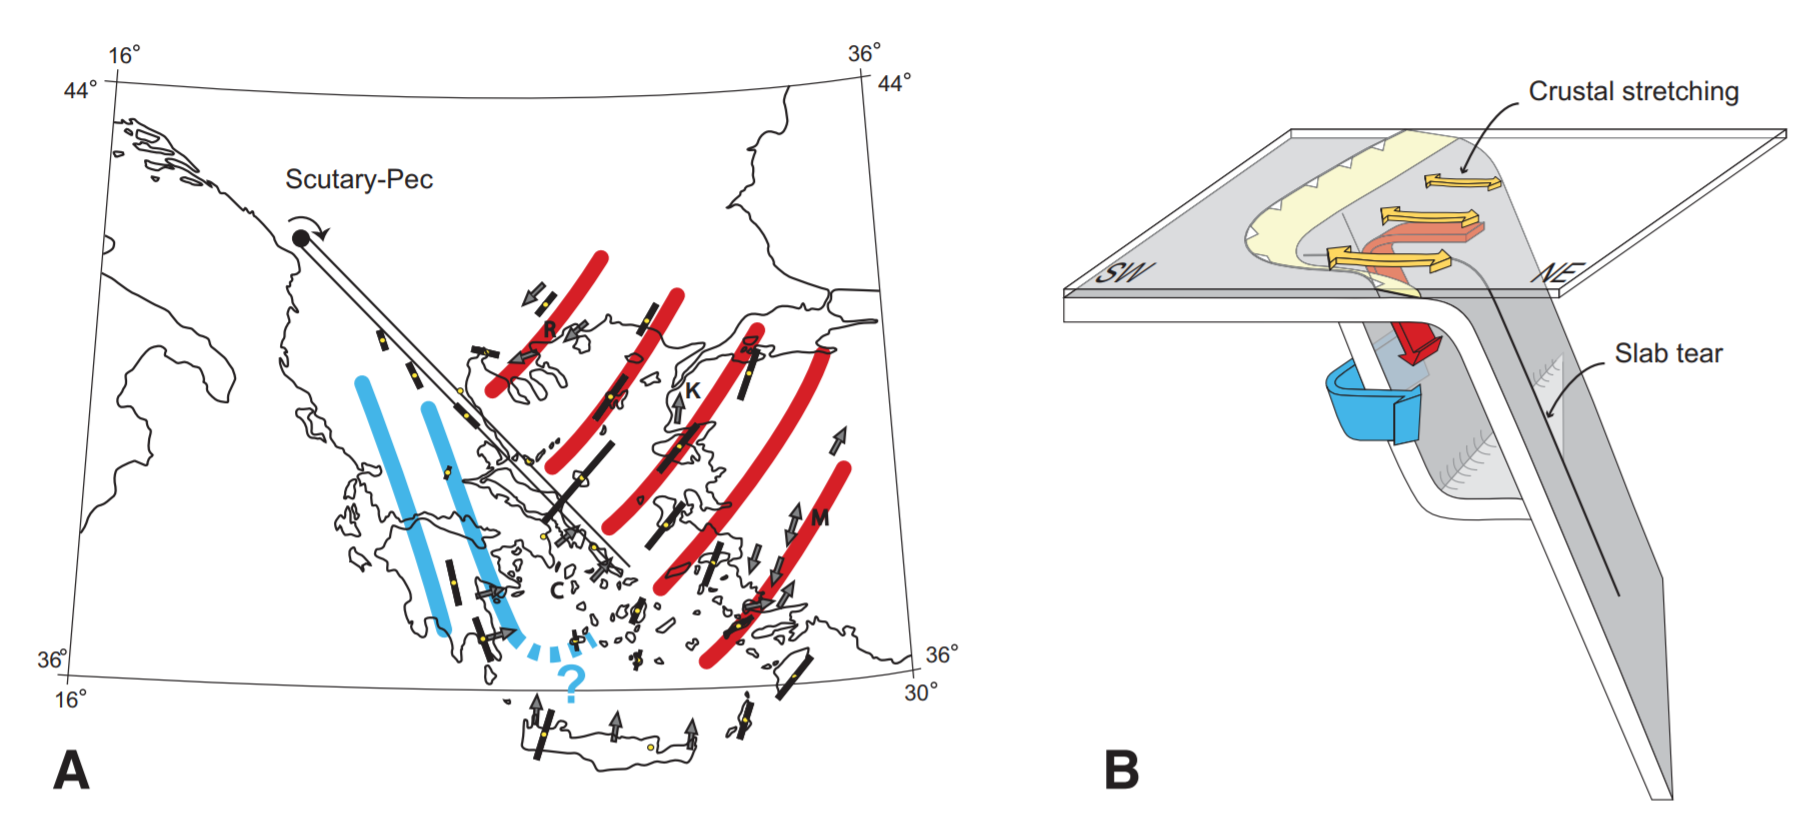
Mantle flow pattern at Aegean scale powered by slab rollback in rotation around vertical axis located at Scutary-Pec (Albania). A: Map view of flow lines above (red) and below (blue) slab. B: Three-dimensional sketch showing how slab tear may accommodate slab rotation. Mantle fl ow above and below slab in red and blue, respectively. Yellow arrows show crustal stretching.
- Finally, here is a map showing tectonic domains (Taymaz et al., 2007).

Schematic map of the principal tectonic settings in the Eastern Mediterranean. Hatching shows areas of coherent motion and zones of distributed deformation. Large arrows designate generalized regional motion (in mm a21) and errors (recompiled after McClusky et al. (2000, 2003). NAF, North Anatolian Fault; EAF, East Anatolian Fault; DSF, Dead Sea Fault; NEAF, North East Anatolian Fault; EPF, Ezinepazarı Fault; CTF, Cephalonia Transform Fault; PTF, Paphos Transform Fault.
- 2017.06.12 M 6.3 Turkey/Greece
- 2016.10.30 M 6.6 Italy
- 2016.10.30 M 6.6 Italy Update #1
- 2016.10.28 M 5.8 Tyrrhenian Sea
- 2016.10.26 M 6.1 Italy
- 2016.10.16 M 5.3 Greece/Albania
- 2016.08.23 M 6.2 Italy
- 2016.01.24 M 6.1 Mediterranean
- 2015.11.17 M 6.5 Greece
- 2015.04.16 M 6.0 Crete
Europe Seismicity
Earthquake Reports
References
- Basili R., G. Valensise, P. Vannoli, P. Burrato, U. Fracassi, S. Mariano, M.M. Tiberti, E. Boschi (2008), The Database of Individual Seismogenic Sources (DISS), version 3: summarizing 20 years of research on Italy’s earthquake geology, Tectonophysics, doi:10.1016/j.tecto.2007.04.014
- Brun, J.-P., Sokoutis, D., 2012. 45 m.y. of Aegean crust and mantle flow driven by trench retreat. Geol. Soc. Am., v. 38, p. 815–818.
- Caputo, R., Chatzipetros, A., Pavlides, S., and Sboras, S., 2012. The Greek Database of Seismogenic Sources (GreDaSS): state-of-the-art for northern Greece in Annals of Geophysics, v. 55, no. 5, doi: 10.4401/ag-5168
- Dilek, Y., 2006. Collision tectonics of the Mediterranean region: Causes and consequences in Dilek, Y., and Pavlides, S., eds., Postcollisional tectonics and magmatism in the Mediterranean region and Asia: Geological Society of America Special Paper 409, p. 1–13
- Dilek, Y. and Sandvol, E., 2006. Collision tectonics of the Mediterranean region: Causes and consequences in Dilek, Y., and Pavlides, S., eds., Postcollisional tectonics and magmatism in the Mediterranean region and Asia: Geological Society of America Special Paper 409, p. 1–13
- DISS Working Group (2015). Database of Individual Seismogenic Sources (DISS), Version 3.2.0: A compilation of potential sources for earthquakes larger than M 5.5 in Italy and surrounding areas. http://diss.rm.ingv.it/diss/, Istituto Nazionale di Geofisica e Vulcanologia; DOI:10.6092/INGV.IT-DISS3.2.0.
- Ersoy, E.Y., Cemen, I., Helvaci, C., and Billor, Z., 2014. Tectono-stratigraphy of the Neogene basins in Western Turkey: Implications for tectonic evolution of the Aegean Extended Region in Tectonophysics v. 635, p. 33-58.
- Jolivet, L., et al., 2013. Aegean tectonics: Strain localisation, slab tearing and trench retreat in Tectonophysics, v. 597-598, p. 1-33
- Kokkalas, S., et al., 2006. Postcollisional contractional and extensional deformation in the Aegean region in GSA Special Papers, v. 409, p. 97-123.
- Kurt, H., Demirbag, E., and Kuscu, I., 1999. Investigation of the submarine active tectonism in the Gulf of Gokova, southwest Anatolia–southeast Aegean Sea, by multi-channel seismic reflection data in Tectonophysics, v. 305, p. 477-496
- Papazachos, B.C., Papadimitrious, E.E., Kiratzi, A.A., Papazachos, C.B., and Louvari, E.k., 1998. Fault Plane Solutions in the Aegean Sea and the Surrounding Area and their Tectonic Implication, in Bollettino Di Geofisica Terorica Ed Applicata, v. 39, no. 3, p. 199-218.
- Taymaz, T., Yilmaz, Y., and Dilek, Y., 2007. The geodynamics of the Aegean and Anatolia: introduction in Geological Society Special Publications, v. 291, p. 1-16.
- Wouldloper, 2009. Tectonic map of southern Europe and the Middle East, showing tectonic structures of the western Alpide mountain belt. Only Alpine (tertiary) structures are shown.
1 thought on “Earthquake Report: Turkey”