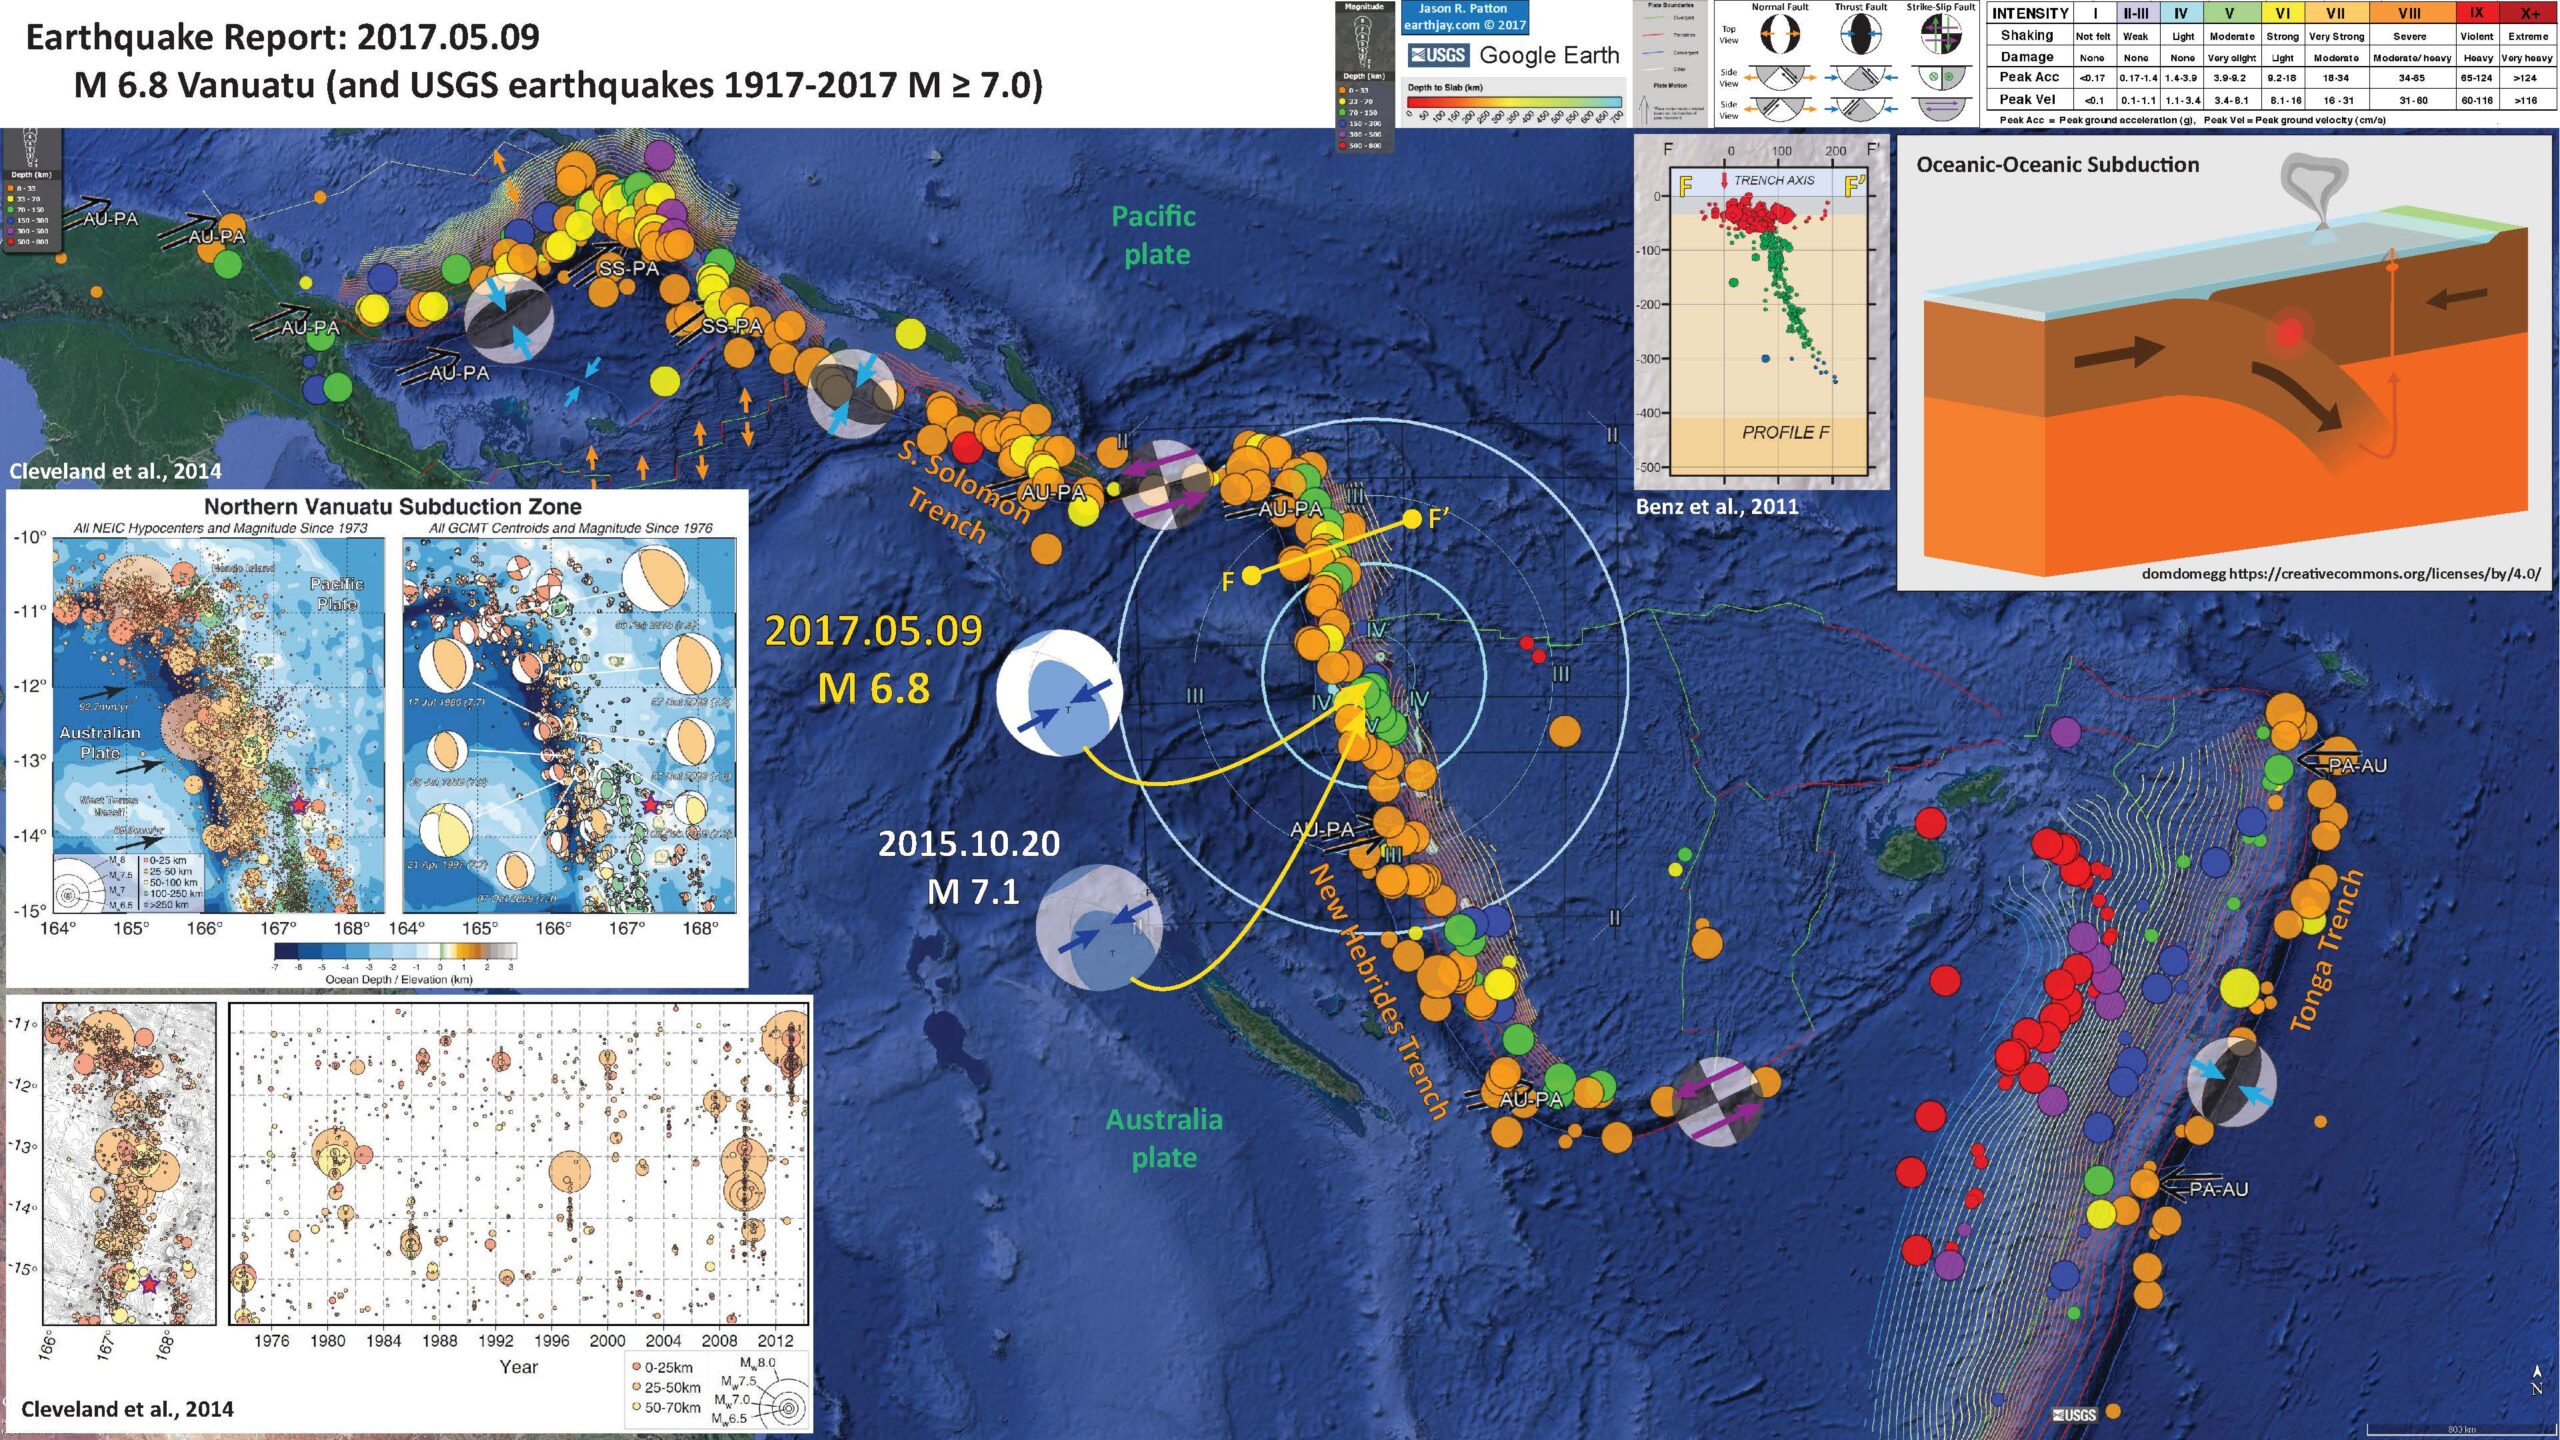
There was an earthquake along the New Hebrides Trench this morning (my time in northern California). This earthquake is located deep, possibly below the subduction zone megathrust (but probably is a subduction zone earthquake). The hypocentral depth is 169 km, while the subducting slab is mapped at between 100-120 km in this location. While the slab location has some inherent uncertainty, today’s earthquake is within the range. We probably will never really know, until there is a movie made about this earthquake (surely Hollywood will know).
There was an earthquake on 2015.10.20 that has a similar moment tensor with a slightly larger magnitude (M 7.1). There was also a sequence of earthquakes in this region in April 2016 (here is my report from 2016.04.28).
Below is my interpretive poster for this earthquake.
I plot the seismicity from the past month, with color representing depth and diameter representing magnitude (see legend). In the second poster, I include seismicity from the past century.
- I placed a moment tensor / focal mechanism legend on the poster. There is more material from the USGS web sites about moment tensors and focal mechanisms (the beach ball symbols). Both moment tensors and focal mechanisms are solutions to seismologic data that reveal two possible interpretations for fault orientation and sense of motion. One must use other information, like the regional tectonics, to interpret which of the two possibilities is more likely.
- I also include the shaking intensity contours on the map. These use the Modified Mercalli Intensity Scale (MMI; see the legend on the map). This is based upon a computer model estimate of ground motions, different from the “Did You Feel It?” estimate of ground motions that is actually based on real observations. The MMI is a qualitative measure of shaking intensity. More on the MMI scale can be found here and here. This is based upon a computer model estimate of ground motions, different from the “Did You Feel It?” estimate of ground motions that is actually based on real observations.
- I include the slab contours plotted (Hayes et al., 2012), which are contours that represent the depth to the subduction zone fault. These are mostly based upon seismicity. The depths of the earthquakes have considerable error and do not all occur along the subduction zone faults, so these slab contours are simply the best estimate for the location of the fault.
- In the upper right corner I include an illustration showing how Oceanic-Oceanic Subduction Zones are configured. One oceanic plate subducts beneath another oceanic plate. At some depth, the water dehydrated from the downgoing plate provides the flux for the mantle to melt. This molten mantle rises due to its decreased density, forming volcanoes. These volcanoes form a line subparallel to the subduction zone trench and we call this a magmatic arc, or an oceanic volcanic arc (or simply, the arc).
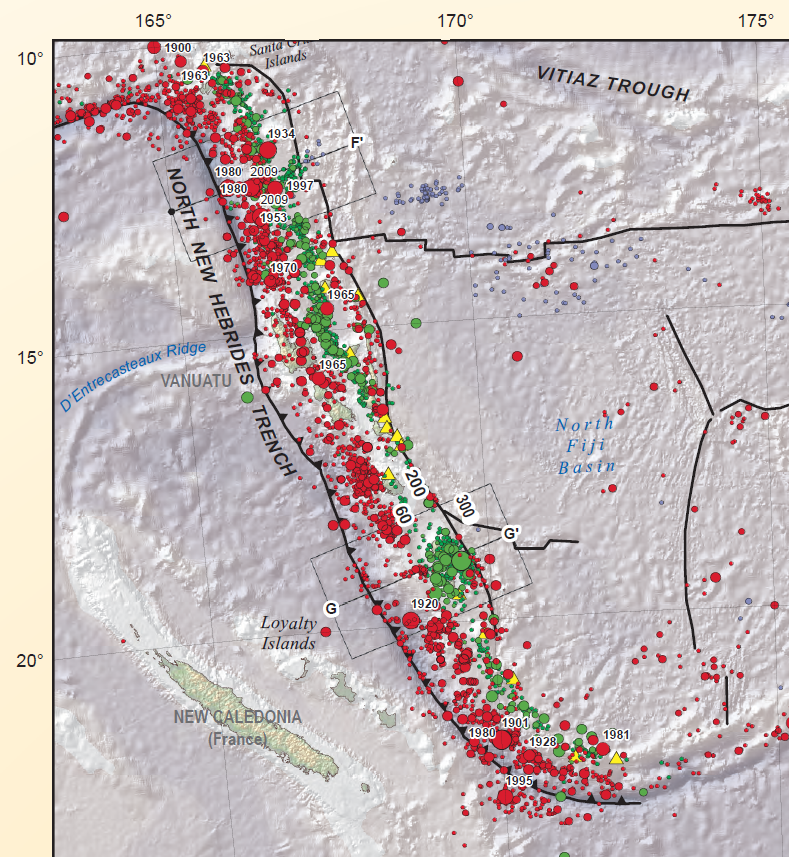
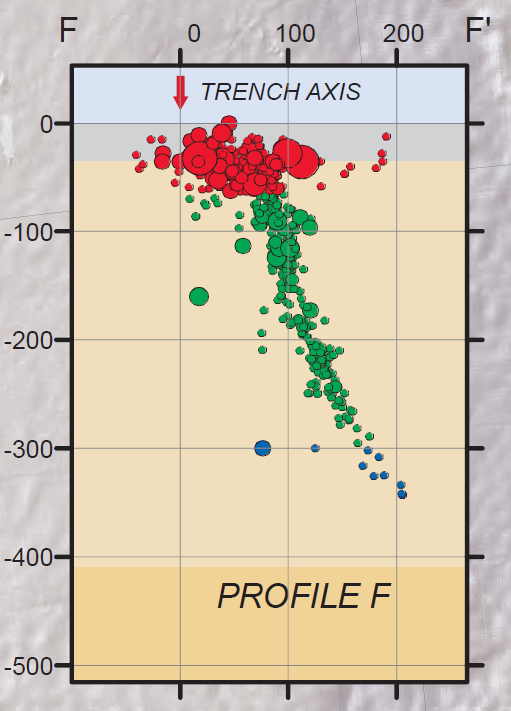
- To the left of this schematic illustration is a plot from Benz et al. (2011). This plot shows a cross section of earthquake hypocenters. Hypocenters are the 3-D locations of earthquakes as calculated from seismologic records. This profile F-F’ is shown on the map as a yellow line with dots at the end of the line.
- In the lower left corner I include two figures from Cleveland et al. (2014). The upper panel show USGS NEIC earthquake epicenters from 1973-2013 and GCMT moment tensors for earthquakes since 1976. There are some regions of this subduction zone that appear to have repeating earthquakes every decade or two (while other parts of the subduction zone do not). The lower panel shows these earthquakes plotted on a space-time diagram (on the right). This plot shows earthquakes with magnitudes represented by the circle diameter, plotted vs. latitude on the vertical axis and time on the horizontal axis. I place a red star in the approximate location of today’s M 6.8 earthquake.
I include some inset figures in the poster.

- Here is a version showing USGS seismicity from 1917-2017 for earthquakes with magnitudes M ≥ 7.0

- Here is an animation that shows the seismicity for this region from 1960 – 2016 for earthquakes with magnitudes greater than or equal to 7.0.
- I include some figures mentioned in my report from 2016.04.28 for a sequence of earthquakes in the same region as today’s earthquake (albeit shallower hypocentral depths), in addition to a plot from Cleveland et al. (2014). In the upper right corner, Cleveland et al. (2014) on the left plot a map showing earthquake epicenters for the time period listed below the plot on the right. On the right is a plot of earthquakes (diameter = magnitude) of earthquakes with latitude on the vertical axis and time on the horizontal axis. Cleveland et al (2014) discuss these short periods of seismicity that span a certain range of fault length along the New Hebrides Trench in this area. Above is a screen shot image and below is the video.
- Here is a link to the embedded video below (6 MB mp4)

- Here are the two figures from Cleveland et al. (2014).
- Figure 1. I include the figure caption below as a blockquote.
- Figure 17. I include the figure caption below as a blockquote.
- Figure 17. I include the figure caption below as a blockquote.
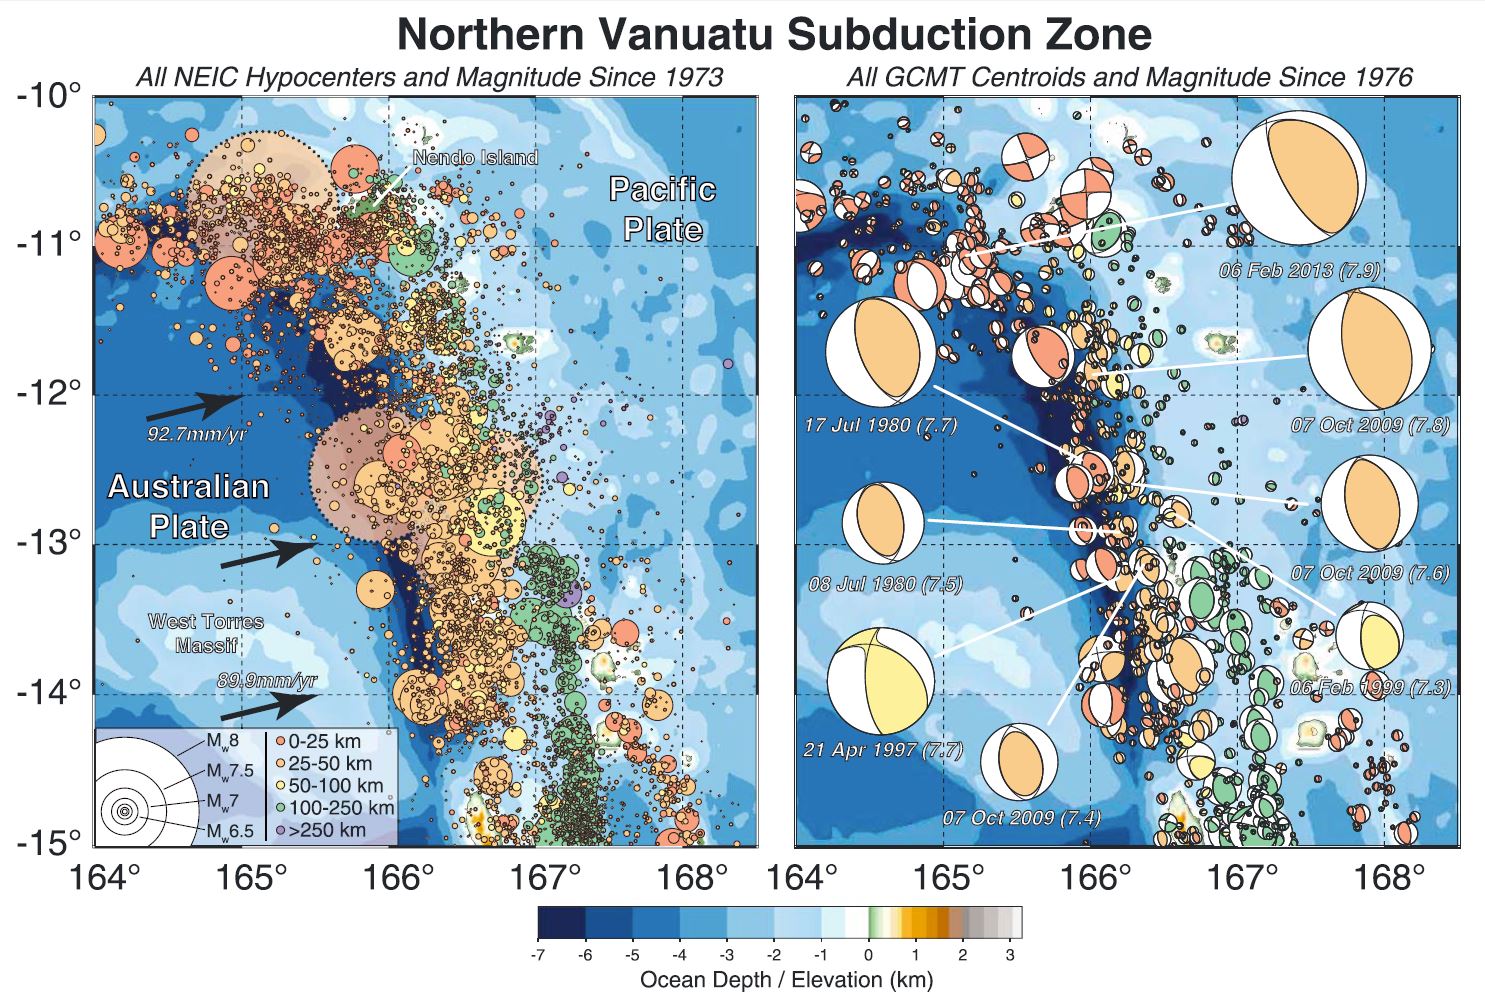
(left) Seismicity of the northern Vanuatu subduction zone, displaying all USGS-NEIC earthquake hypocenters since 1973. The Australian plate subducts beneath the Pacific in nearly trench-orthogonal convergence along the Vanuatu subduction zone. The largest events are displayed with dotted outlines of the magnitude-scaled circle. Convergence rates are calculated using the MORVEL model for Australia Plate relative to Pacific Plate [DeMets et al., 2010]. (right) All GCMT moment tensor solutions and centroids for Mw ≥ 5 since 1976, scaled with moment. This region experiences abundant moderate and large earthquakes but lacks any events with Mw >8 since at least 1900.
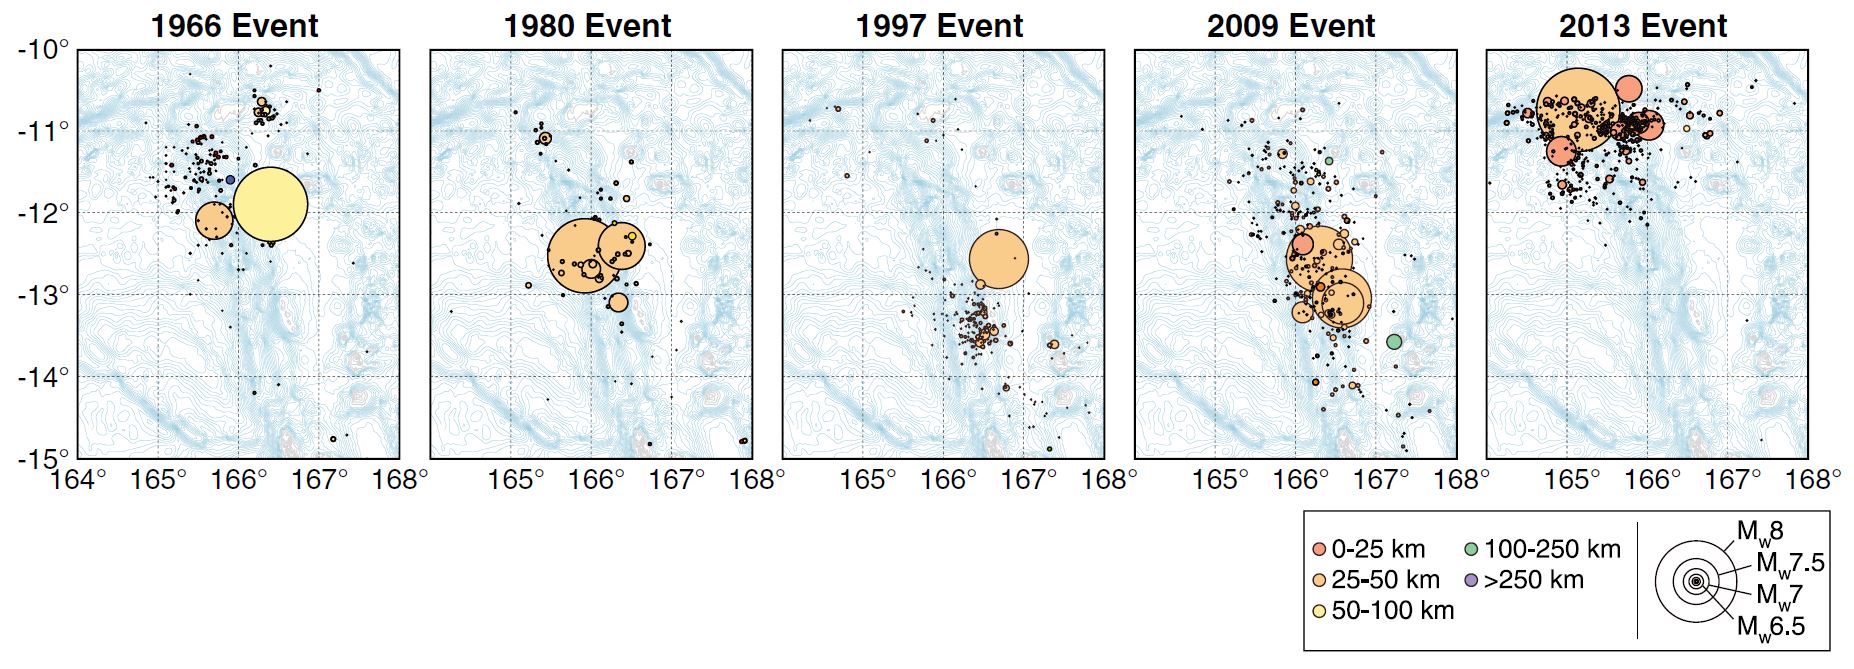
One hundred day aftershock distributions of all earthquakes listed in the ISC catalog for the 1966 sequence and in the USGS-NEIC catalog for the 1980, 1997, 2009, and 2013 sequences in northern Vanuatu. The 1966 main shocks are plotted at locations listed by Tajima et al. [1990]. Events of the 1997 and 2009 sequences were relocated using the double difference method [Waldhauser and Ellsworth, 2000] for P wave first arrivals based on EDR picks. The event symbol areas are scaled relative to the earthquake magnitudes based on a method developed by Utsu and Seki [1954]. Hypocenters of most aftershock events occurred at <50 km depth.
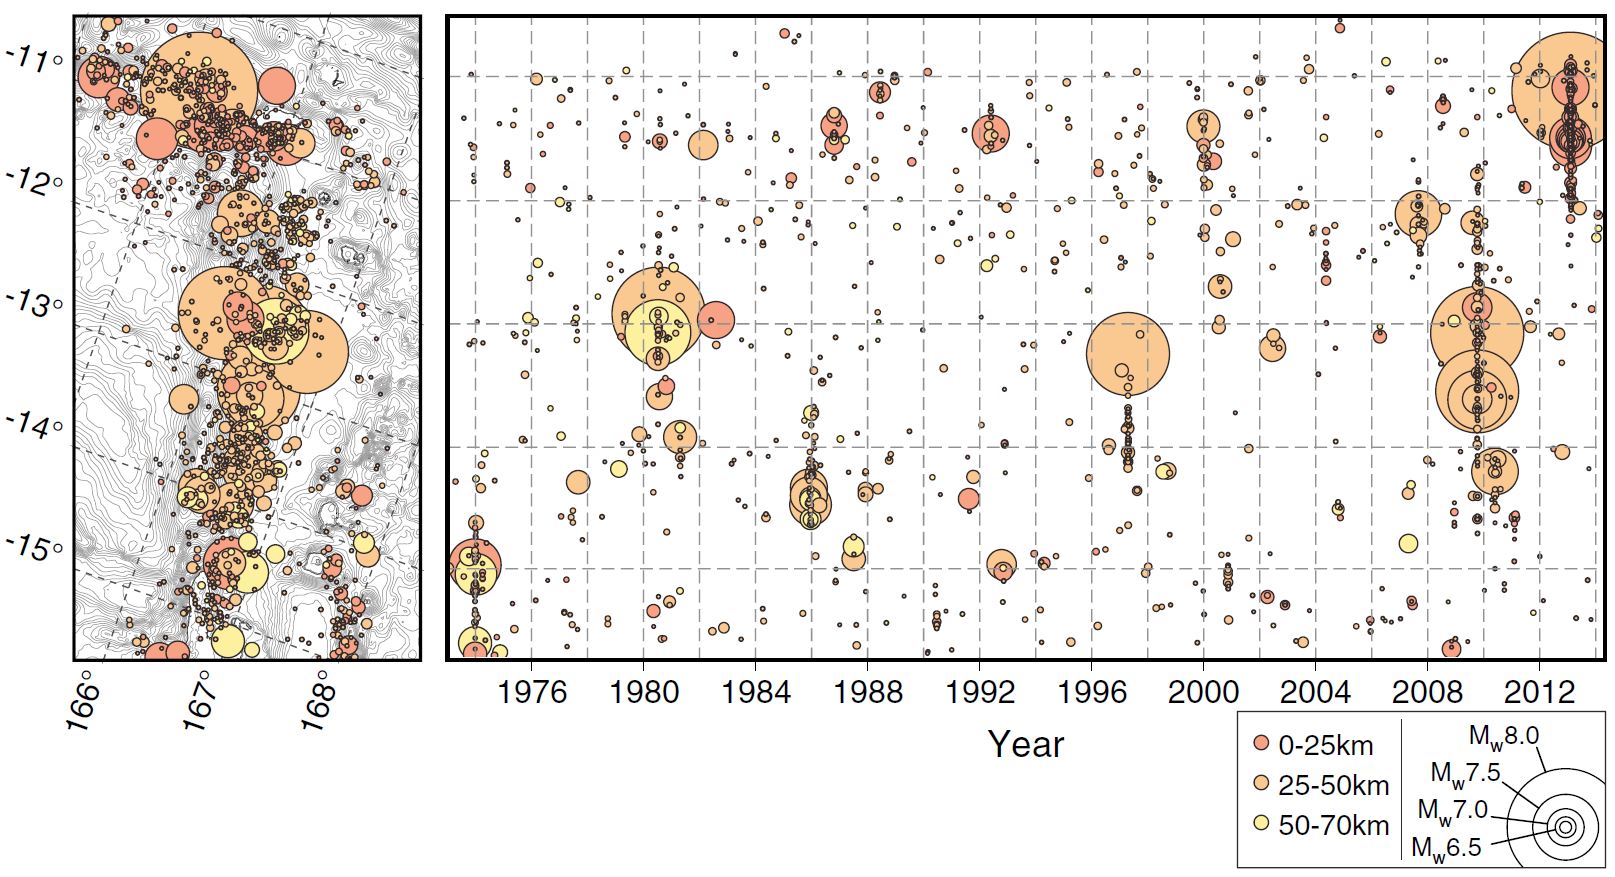
(right) Space-time plot of shallow (≤ 70 km) seismicity M ≥ 5.0 in northern Vanuatu recorded in the NEIC catalog as a function of distance south of ~10°N, 165.25°E. (left) The location of the seismicity on a map rotated to orient the trench vertically.
- Here is the USGS poster showing the seismicity for this region from 1900-2010 (Benz et al., 2011). Below I include the legend (not the correct scale; click on this link for the entire poster (65 MB pdf)). Note the cross section F-F’ which I plot on the poster above.
- Here is the cross section F-F’ again, with the legend below.
References
- Benz, H.M., Herman, Matthew, Tarr, A.C., Furlong, K.P., Hayes, G.P., Villaseñor, Antonio, Dart, R.L., and Rhea, Susan, 2011. Seismicity of the Earth 1900–2010 eastern margin of the Australia plate: U.S. Geological Survey Open-File Report 2010–1083-I, scale 1:8,000,000.
- Cleveland, K.M., Ammon, C.J., and Lay, T., 2014. Large earthquake processes in the northern Vanuatu subduction zone in Journal of Geophysical Research: Solid Earth, v. 119, p. 8866-8883, doi:10.1002/2014JB011289.
- Hayes, G. P., D. J. Wald, and R. L. Johnson, 2012. Slab1.0: A three-dimensional model of global subduction zone geometries, J. Geophys. Res., 117, B01302, doi:10.1029/2011JB008524.
- Richards, S., Holm., R., Barber, G., 2011. When slabs collide: A tectonic assessment of deep earthquakes in the Tonga-Vanuatu region, Geology, v. 39, pp. 787-790.
- Bumba Crossing Kevin MacLeod (incompetech.com) | Licensed under Creative Commons: By Attribution 3.0 License | http://creativecommons.org/licenses/by/3.0/
Oceanic-Oceanic Subduction Zone Figure
Music Reference (in 1900-2016 seismicity video)