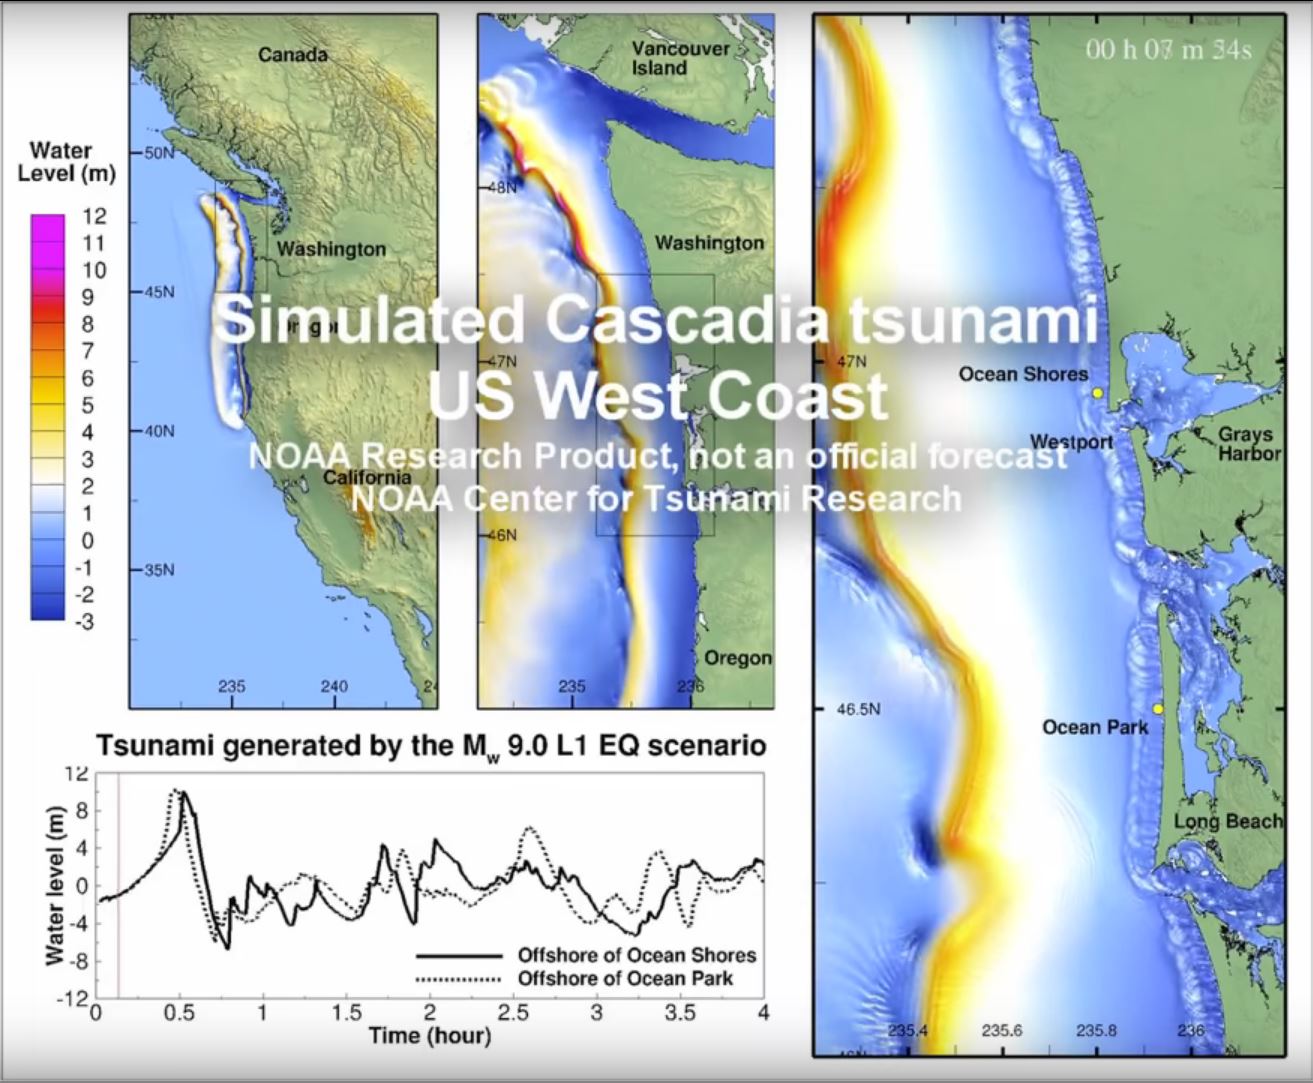
NOAA Center for Tsunami Research just released an animation that shows a numerical simulation of what a tsunami may appear like when the next Cascadia subduction zone earthquake occurs. I present a summary about the CSZ tectonics on a 316th year commemoration page here. I include a yt link and embedded video and an mp4 embedded video and download link.
Here is a screenshot from the video:
-
Here is the YT video:
- This is the yt link for the embedded video below
- This is the mp4 link for the embedded video below (15 MB mp4)
Here is the mp4 video (same video):
I want to watch this!
i guess you will need to wait until you go into town… ;-)
not sure if you can view youtube videos at home on dial up, but here is the link (my page might not load on dial up)… https://youtu.be/-hlvbpn4AEM
Nothing that moves or sings from home, and not all text sites either, now that my browser is getting so out-dated….
I read somewhere that everything west of I-5 would be toast. If it was a 9.0 +. PDX down to cape Mendo.
while the I5 is not a geological boundary, generally west of the 5 will be more damaged than east of the 5 because west of the 5 will be closer to the earthquake.
that quote is from a FEMA official who is preparing to respond to the disaster, so they are well informed.
some people overacted to the statement, even though they make similar simplifications for their work. for example, our tsunami evacuation maps are based on the same principle of using geographic features to convey hazards to the public. using the 5 as a geographic feature to explain relative hazard was a cogent and wise choice.
-
The work you do is really awesome!! I have turned many a folk on to your page instead of that fucktard Dutchass!!
-
Hilary Subhadra Anne Peterson Haha, well said.
-
I actually find it amazing how many people believe his racket.
-
So lucky I live 2 miles east of I-5….nevermind that I am on the slope of a giant volcano…..
-
LOL
