
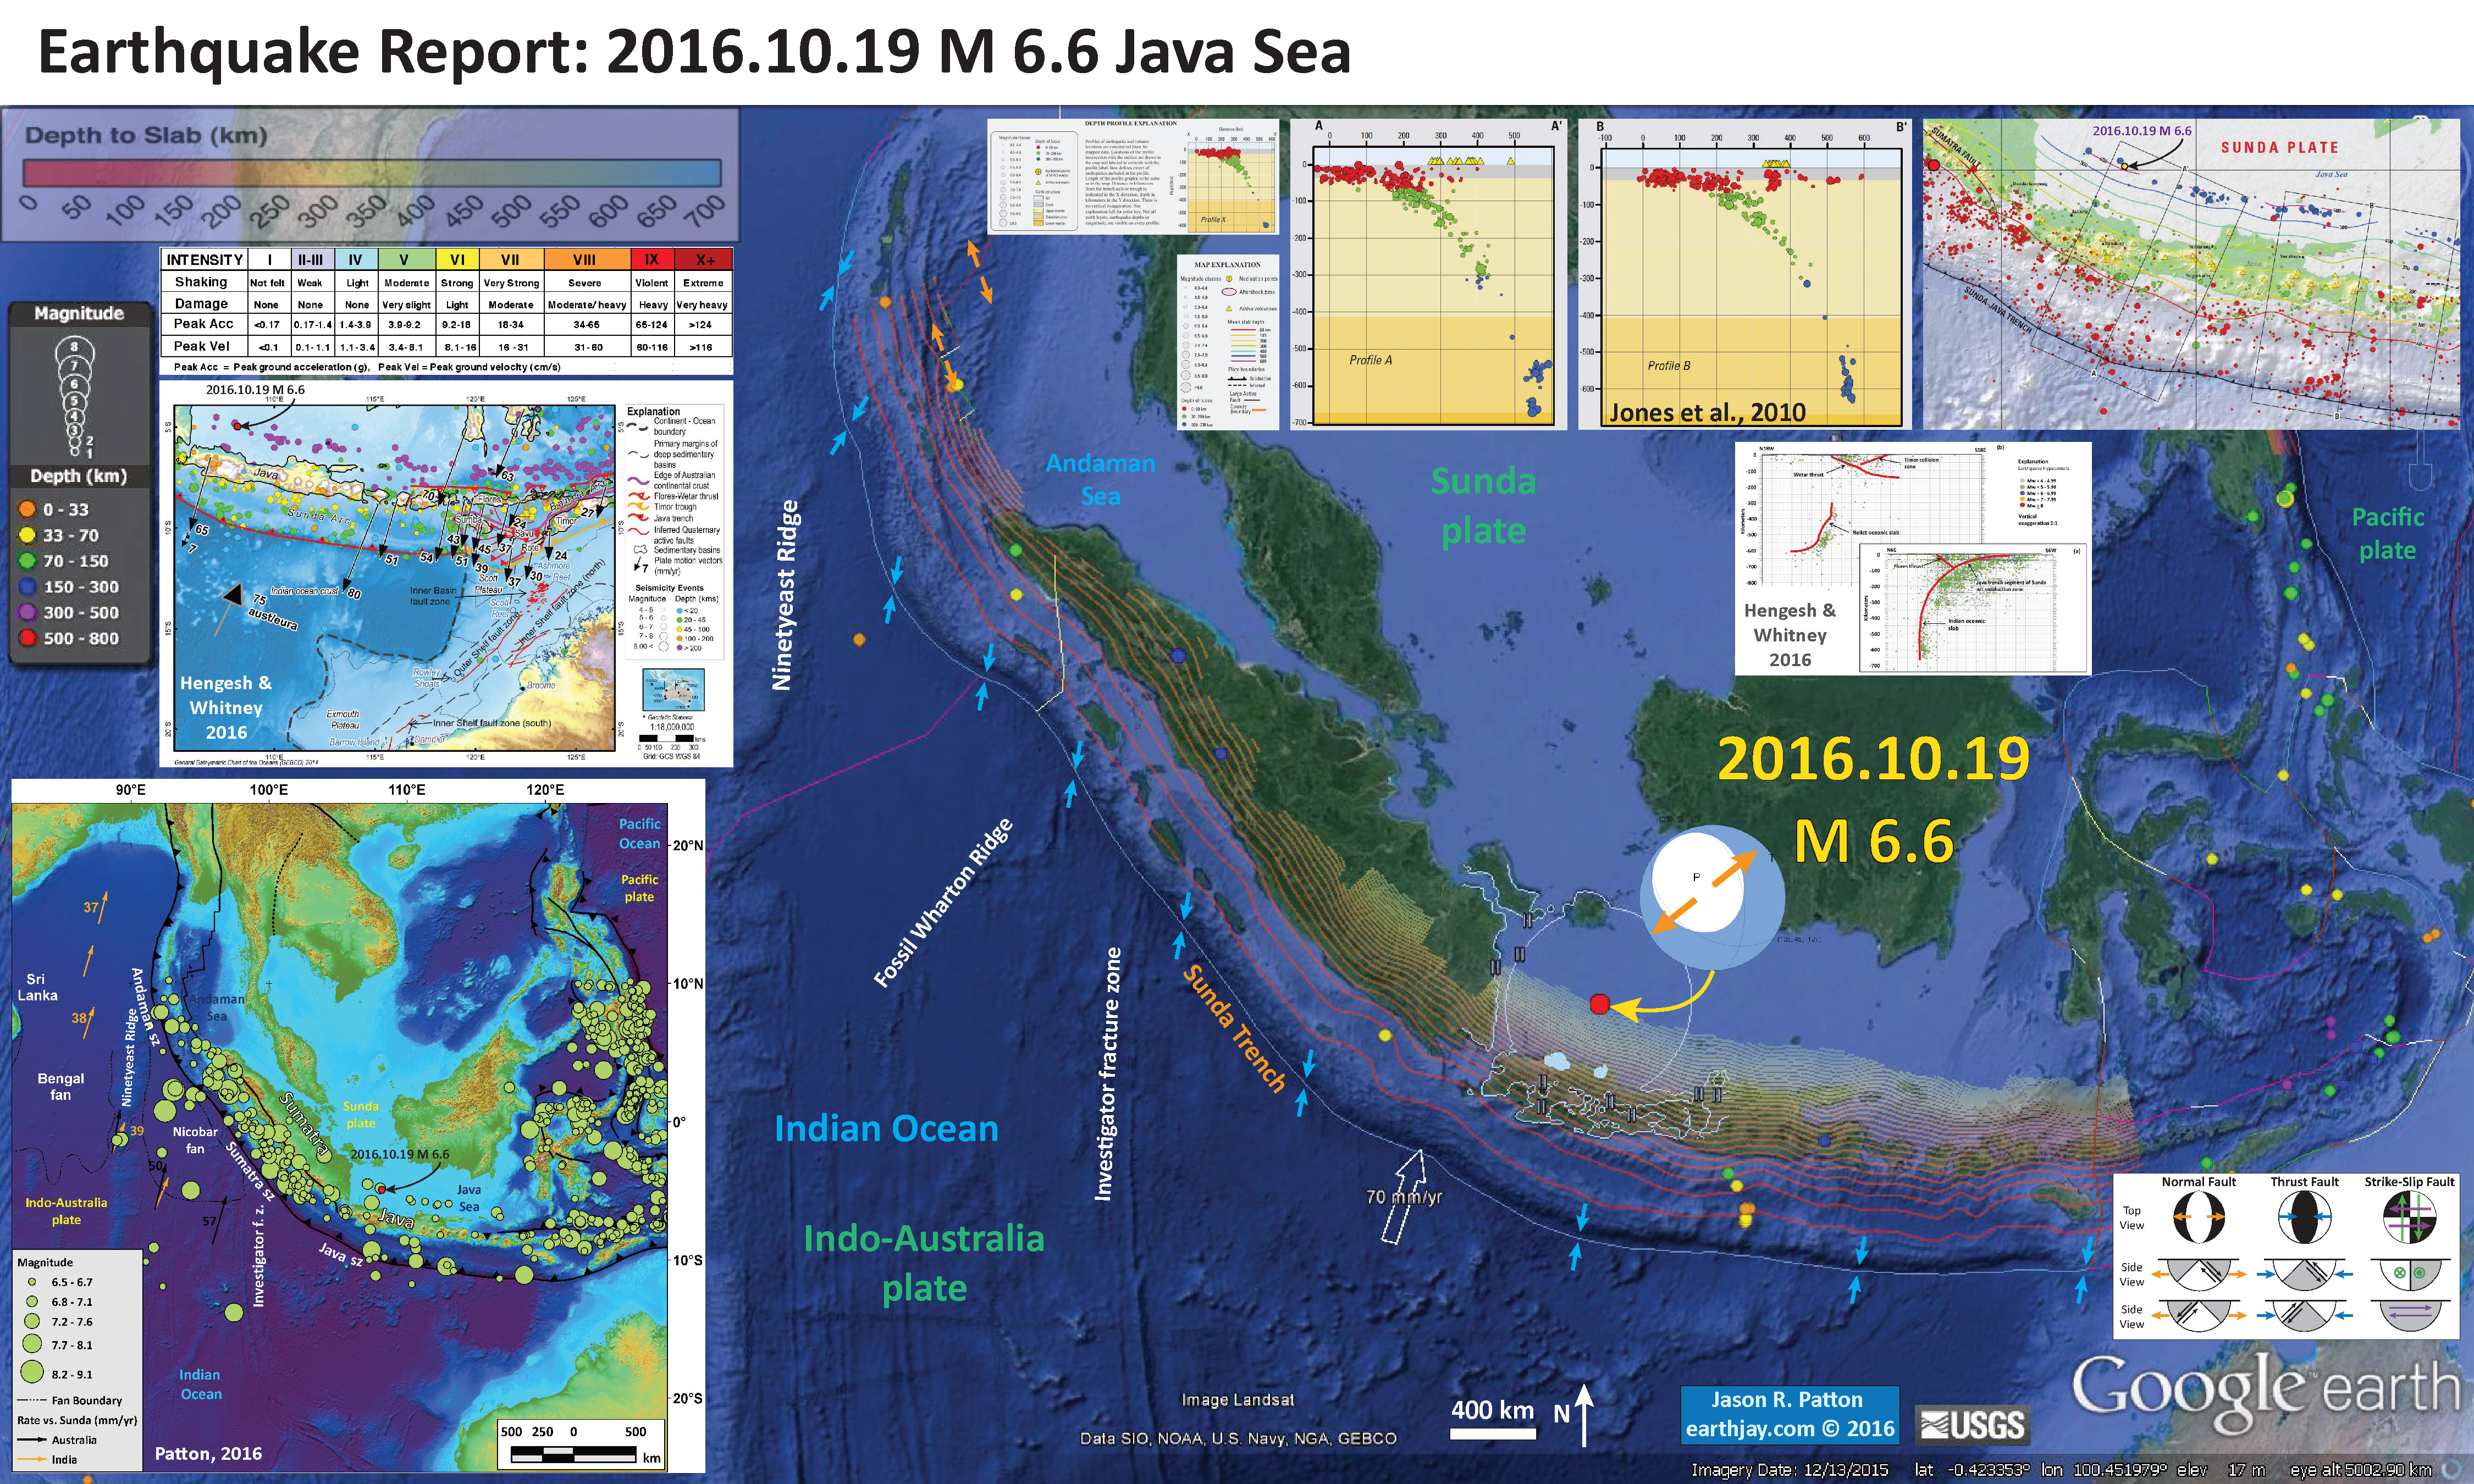
Last night as I was finishing work for the day, I noticed an earthquake in the Java Sea, just north of western Java. Here is the USGS website for this M 6.6 earthquake. This earthquake is extensional and plots very deep along the subduction zone beneath Java.
In the map below I plot the epicenters of earthquakes from the past 30 days of magnitude greater than M = 2.5. The epicenters have colors representing depth in km. The USGS plate boundaries are plotted vs color. The USGS modeled estimate for ground shaking is plotted with contours of equal ground shaking using the Modified Mercalli Intensity (MMI) scale. The MMI is a qualitative measure of shaking intensity. More on the MMI scale can be found here and here. This is based upon a computer model estimate of ground motions, different from the “Did You Feel It?” estimate of ground motions that is actually based on real observations.
I placed a moment tensor / focal mechanism legend in the lower left corner of the map. There is more material from the USGS web sites about moment tensors and focal mechanisms (the beach ball symbols). Both moment tensors and focal mechanisms are solutions to seismologic data that reveal two possible interpretations for fault orientation and sense of motion. One must use other information, like the regional tectonics, to interpret which of the two possibilities is more likely.
The subduction of the India-Australia plate, northwards beneath the Sunda plate, forms a subduction zone trench (labeled Sunda Trench in the map below). I include the slab contours plotted (Hayes et al., 2012), which are contours that represent the depth to the subduction zone fault. These are mostly based upon seismicity. The depths of the earthquakes have considerable error and do not all occur along the subduction zone faults, so these slab contours are simply the best estimate for the location of the fault. The hypocentral depth plots this close to the location of the fault as mapped by Hayes et al. (2012). So, the earthquake is either in the downgoing slab, or in the upper plate and a result of the seismogenic locked plate transferring the shear strain from a fracture zone in the downgoing plate to the upper plate.
Today’s earthquake has an hypocentral depth of 415 km, while the slab depth estimate from Hayes et al. (2013) is greater than 620 km. This is a pretty good match. The moment tensor shows northeast-southwest extension, so this earthquake is possibly in the down going slab where there is either down-slab tension (the subducting plate is pulling the plate down, causing extension) or due to “bending moment normal faults” (if the plate is bending downwards, this causes extension in the top of the plate and compression in the lower part of the plate). Based upon these observations, I suspect this earthquake is in the downgoing Indo-Australia plate.
-
I include some inset figures.
- In the upper right corner are some figure insets from Jones et al. (2010). This is a report on the regional seismicity. The panel on the right is a map showing seismicity vs. depth (color of circle) and magnitude (diameter of circle). There are two cross sections (A-A’ and B-B’) that sample seismicity limited to the rectangular boxes shown on the map. The seismicity cross sections show the general location of the India-Australia slab as it subducts beneath the Sunda plate. On the left are legends for the map and the cross sections. I place a yellow circle for the general location of the epicenter of this M 6.6 earthquake.
- Below Jones et al. (2010), I present two more cross sections of seismicity (Hengesh and Whitney, 2016). The lower right cross section is position in eastern Java.
- In the lower left corner is a figure I prepared using SRTM (Space Shuttle Radar Topography Mission) bathymetric and topographic data (Smith and Sandwell, 1997). I plot USGS earthquake epicenters for earthquakes with magnitudes greater than, or equal to, M = 6.5, for the period from 1916 to present. Circle diameter represents earthquake magnitude. Plate motion rates are from Bock et al. (2003). Outline of the Bengal and Nicobar fans is from Stow (1990). Relative plate motion along the subduction zone is increasingly oblique, south to north. I place a red circle for the general location of the epicenter of this M 6.6 earthquake.
- Above the seismicity map is a geodetic-tectonic fault map from Hengesh and Whitney (2016). Seismicity is plotted vs. magnitude (diameter of circle) and depth (color of circle). Relative plate motion and GPS geodetic plate motion rates are plotted as scaled and labeled vectors. I place a red circle for the general location of the epicenter of this M 6.6 earthquake.
- Here is a figure showing the regional geodetic motions (Bock et al., 2003). I include their figure caption below as a blockquote.

Topographic and tectonic map of the Indonesian archipelago and surrounding region. Labeled, shaded arrows show motion (NUVEL-1A model) of the first-named tectonic plate relative to the second. Solid arrows are velocity vectors derived from GPS surveys from 1991 through 2001, in ITRF2000. For clarity, only a few of the vectors for Sumatra are included. The detailed velocity field for Sumatra is shown in Figure 5. Velocity vector ellipses indicate 2-D 95% confidence levels based on the formal (white noise only) uncertainty estimates. NGT, New Guinea Trench; NST, North Sulawesi Trench; SF, Sumatran Fault; TAF, Tarera-Aiduna Fault. Bathymetry [Smith and Sandwell, 1997] in this and all subsequent figures contoured at 2 km intervals.
- In addition to the orientation of relative plate motion (that controls seismogenic zone and strain partitioning), the Indo Australia plate varies in crustal age (Lasitha et al., 2006). I include their figure caption below as a blockquote.

Tectonic sketch map of the Sumatra–Java trench-arc region in eastern Indian Ocean Benioff Zone configuration. Hatched line with numbers indicates depth to the top of the Benioff Zone (after Newcomb and McCann13). Magnetic anomaly identifications have been considered from Liu et al.14 and Krishna et al.15. Magnitude and direction of the plate motion is obtained from Sieh and Natawidjaja11. O indicates the location of the recent major earthquakes of 26 December 2004, i.e. the devastating tsunamigenic earthquake (Mw = 9.3) and the 28 March 2005 earthquake (Mw = 8.6).
- Here is a figure showing the regional gravity anomalies, supporting the interpretations of Hengesh and Whitney, 2016. I include their figure caption below as a blockquote.

Merged free-air and isostatic gravity anomalies and inferred Quaternary active faults along the western margin of Australia [Geoscience Australia, 2009]. Note the association of faults with areas of high gravity anomaly associated with former rift margin basins.
- Here is a figure showing the tectonic interpretations of Hengesh and Whitney, 2016. I include their figure caption below as a blockquote.

Illustration of major tectonic elements in triple junction geometry: tectonic features labeled per Figure 1; seismicity from ISC-GEM catalog [Storchak et al., 2013]; faults in Savu basin from Rigg and Hall [2011] and Harris et al. [2006]. Purple line is edge of Australian continental basement and fore arc [Rigg and Hall, 2011]. Abbreviations: AR = Ashmore Reef; SR = Scott Reef; RS = Rowley Shoals; TCZ = Timor Collision Zone; ST = Savu thrust; SB = Savu Basin; TT = Timor thrust; WT =Wetar thrust; WASZ = Western Australia Shear Zone. Open arrows indicate relative direction of motion; solid arrows direction of vergence.
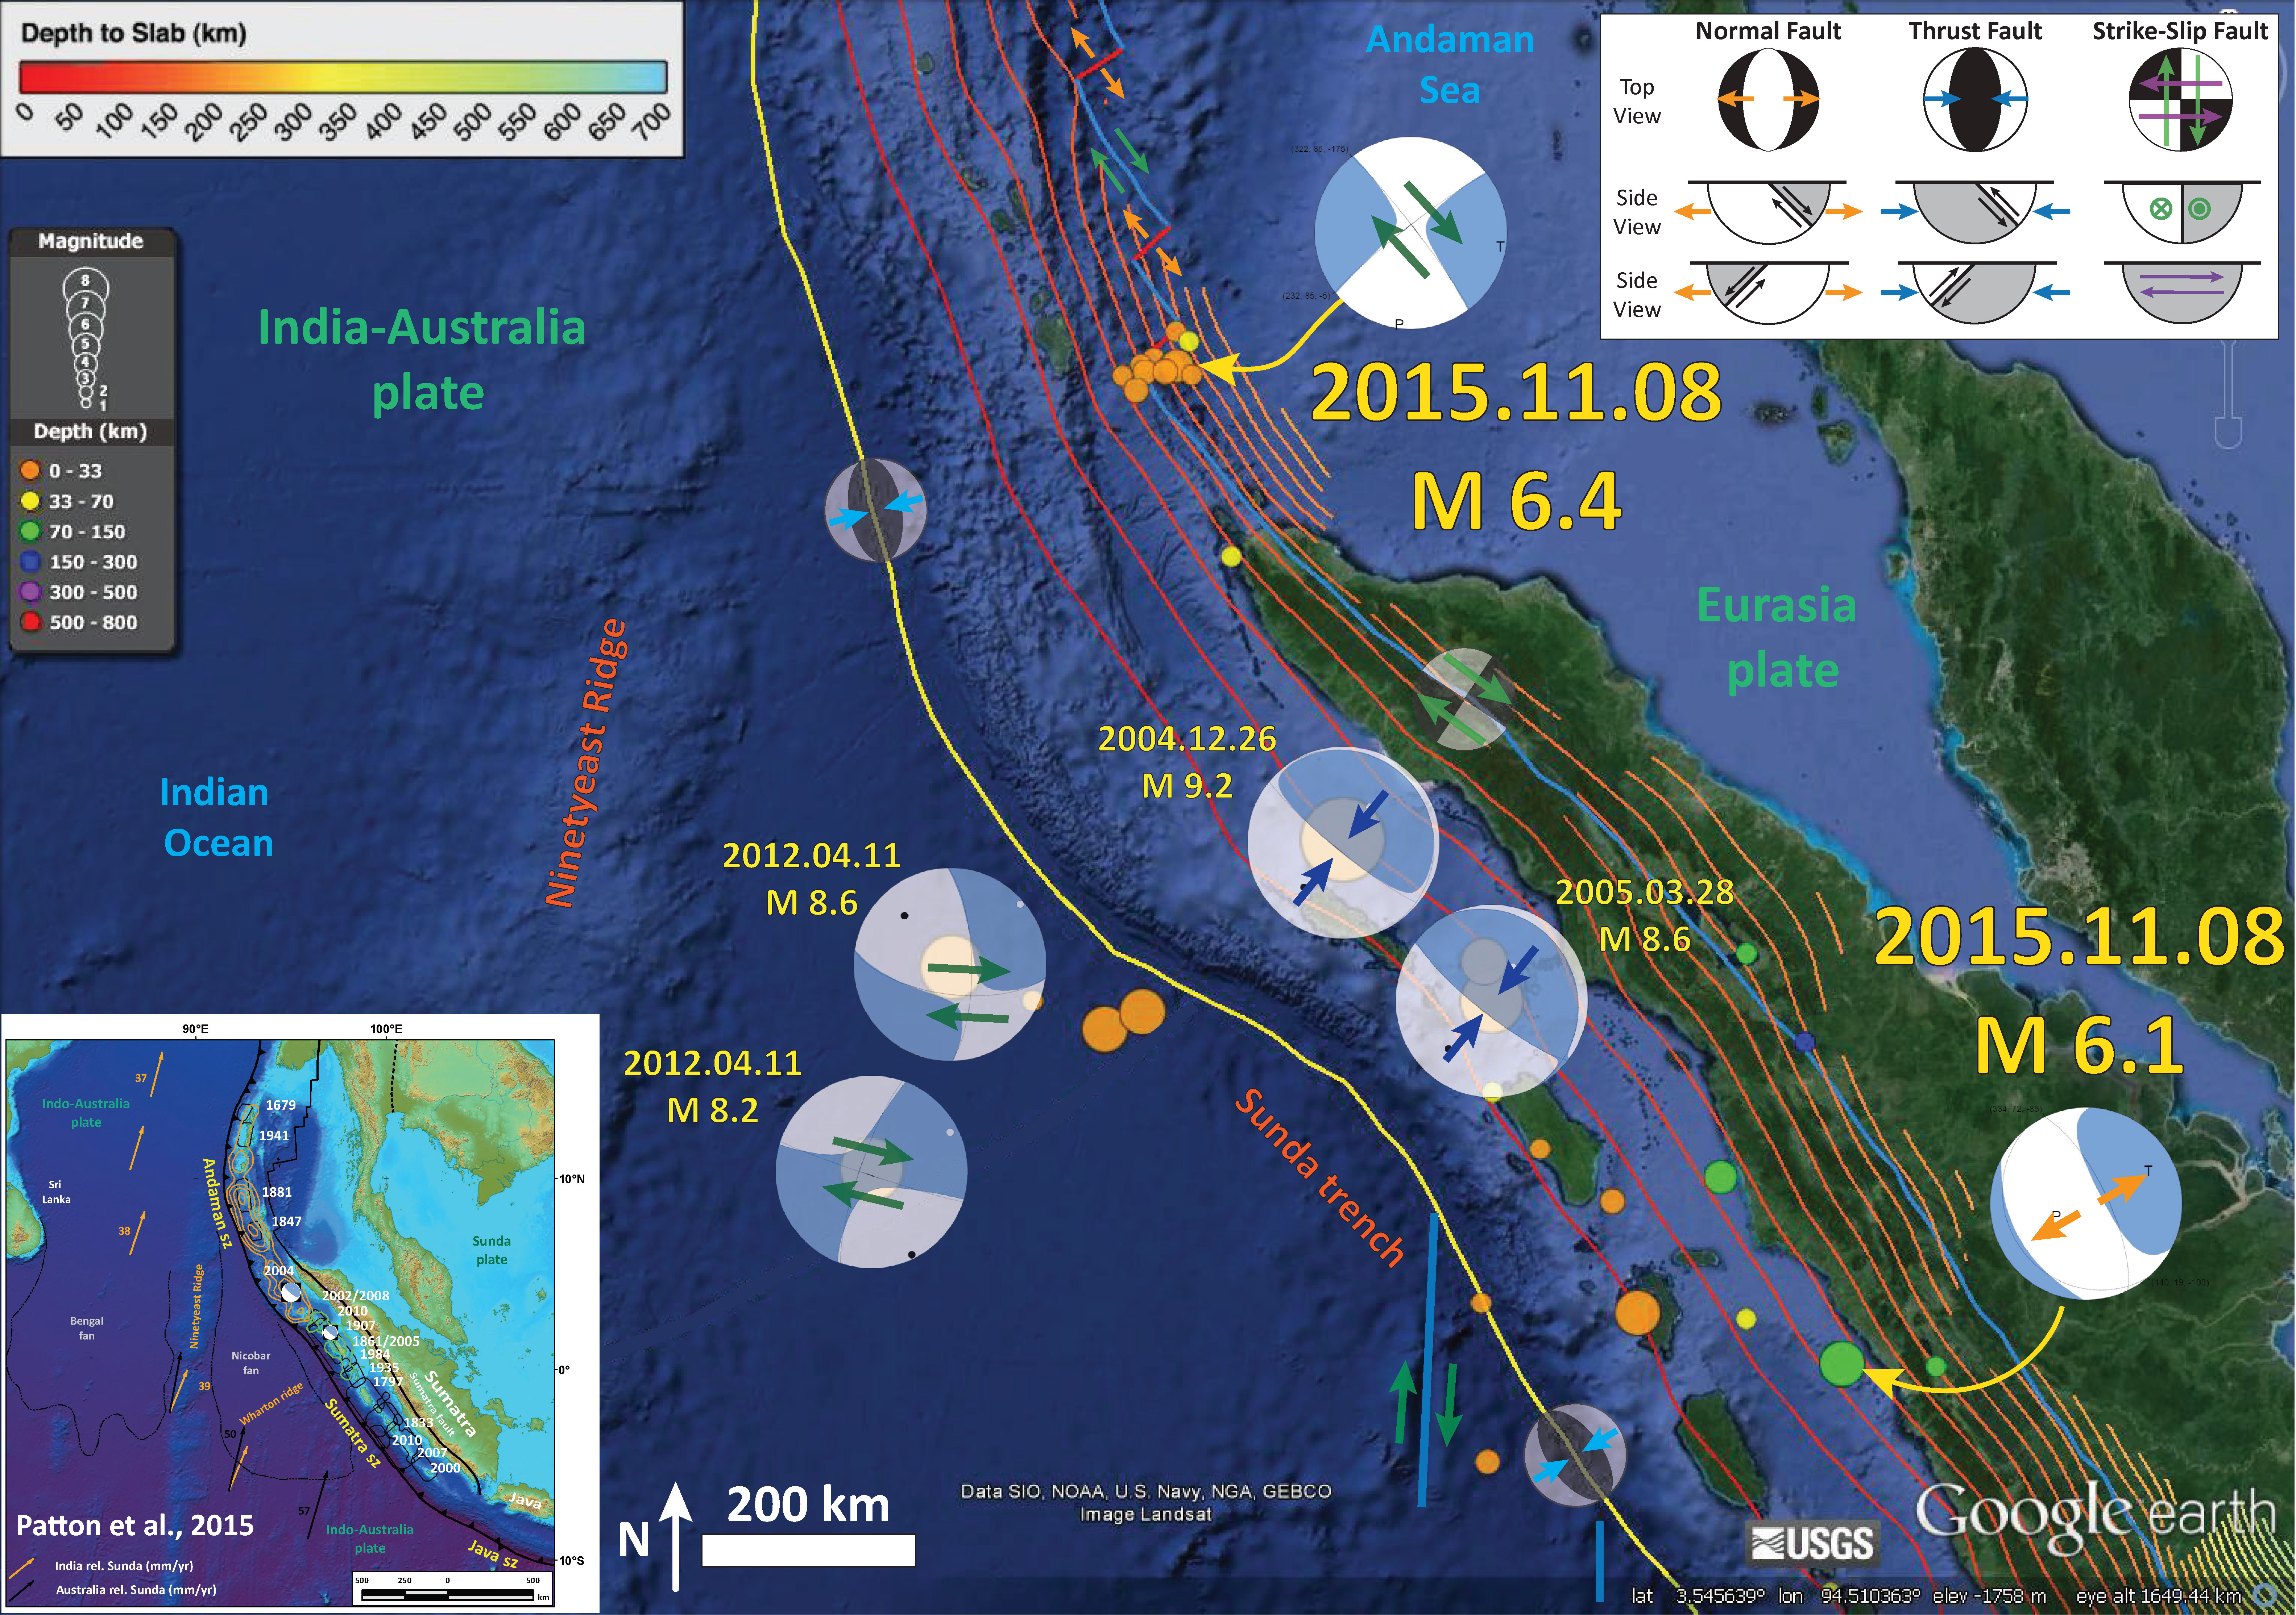
- 2015.11.08 M 6.1 and M 6.4 Earthquakes
- The interesting things about these two earthquakes is that they are not on the subduction zone fault interface. The M = 6.4 earthquake is shallow (USGS depth = 7.7 km). Note how the subduction zone is mapped to ~120-140 km depth near the M 6.4 earthquake. The Andaman Sea is a region of backarc spreading and forearc sliver faulting. Due to oblique convergence along the Sunda trench, the strain is partitioned between the subduction zone fault and the forearc sliver Sumatra fault. In the Andaman Sea, there is a series of en echelon strike-slip/spreading ridges. The M 6.4 earthquake appears to have slipped along one of these strike-slip faults. I interpret this earthquake to be a right lateral strike-slip earthquake, based upon the faults mapped in this region. The smaller earthquakes align in a west-southwest orientation. These may be earthquakes along the spreading center, or all of these earthquakes may be left lateral strike slip faults aligned with a spreading ridge. More analyses would need to be conducted to really know.
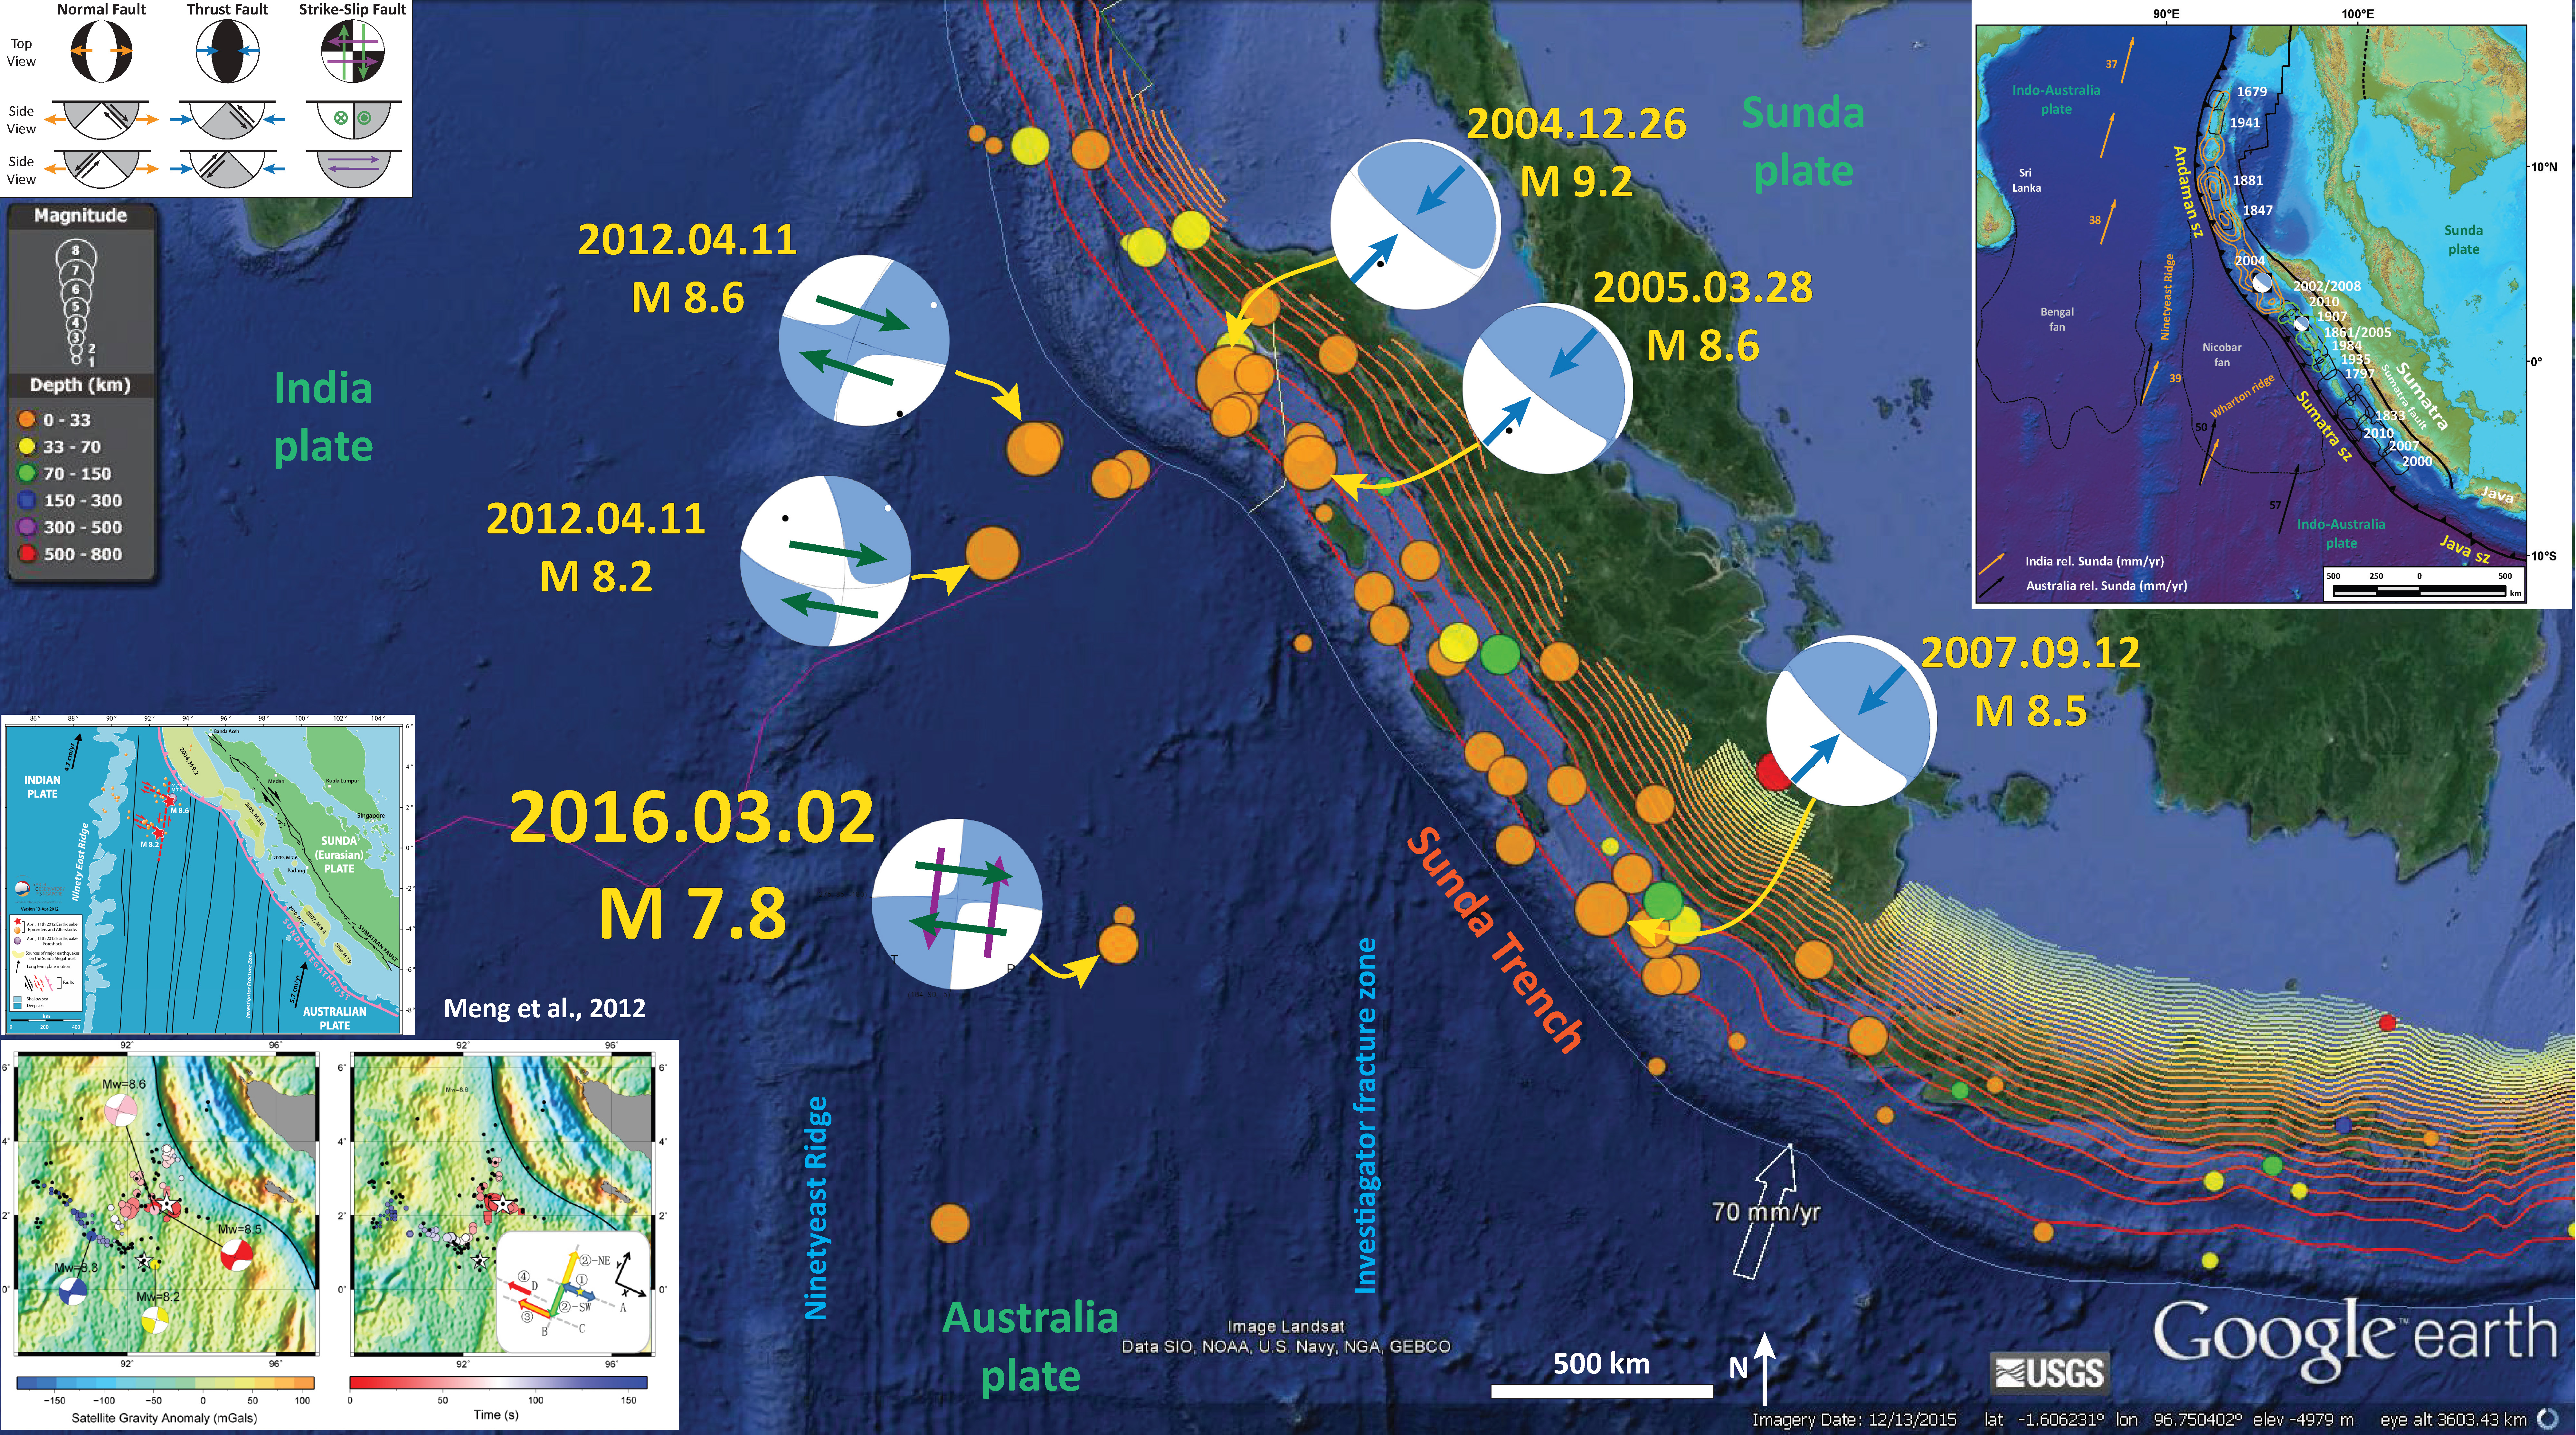
- 2016.03.02 M 7.8 Earthquake
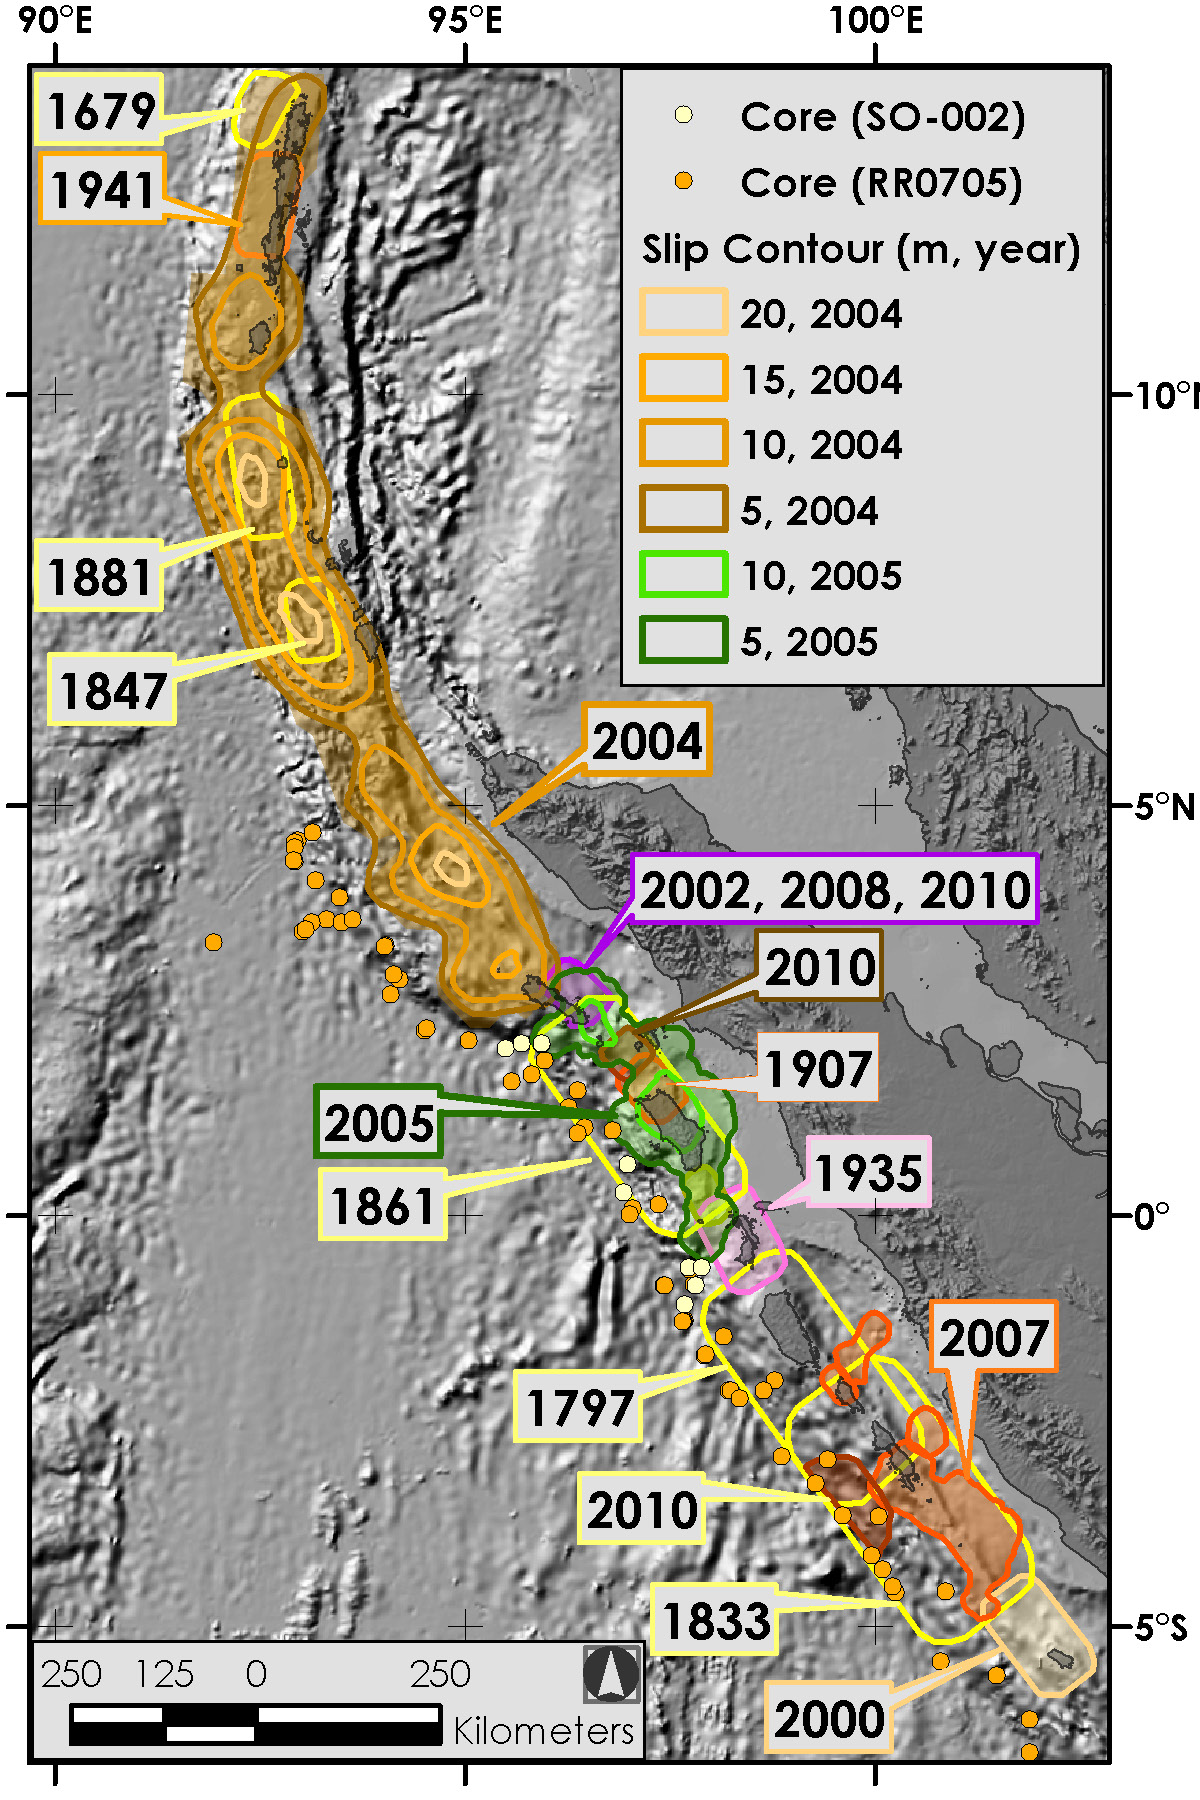
- Here is a map showing moment tensors for the largest earthquakes since the 26 December 2004 Mw = 9.15 Megathrust Great Sumatra-Andaman subduction zone (SASZ) earthquake. Below is a map showing the earthquake slip contours. The beginning of this series started with the Mw 9.15 and Mw = 8.7 Nias earthquakes. There were some other earthquakes along the Mentawaii patch to the south (Mw = 8.5, 7.9, and 7.0). These were also subduction zone earthquakes, but failed to release the strain that had accumulated since the last large magnitude earthquakes to have slipped in this region in 1797 and 1833. In 2012 we had two strike slip earthquakes in the outer rise, where the India-Australia plate flexes in response to the subduction. At first I interpreted these to be earthquakes on northeast striking faults since those the orientation of the predominant faulting in the region. The I-A plate has many of these N-S striking fracture zones, most notably the Investigator fracture zone (the most easterly faults shown in this map as a pair of strike slip faults that head directly for the epicenter of yesterday’s earthquake). However, considering the aftershocks and a large number of different analyses, these two earthquakes (the two largest strike slip earthquakes EVER recorded!) were deemed to have ruptured northwest striking faults. We called these off fault earthquakes, since the main structural grain is those N-S striking fracture zones. Also of note is the focal depth of these two large earthquakes (Mw 8.2 & 8.6). These earthquakes ruptured well into the mantle. Before the 2004 SASZ earthquake and the 2011 Tohoku-Oki earthquake (which also probably ruptured into the mantle), we would not have expected earthquakes in the mantle.
- 2004.12.26 Mw 9.15
- 2005.3.28 Mw 8.6
- 2007.9.12 Me 8.5
- 2007.9.12 Mw 7.9
- 2007.9.13 Mw 7.0
- 2012.4.11 Mw 8.2
- 2012.4.11 Mw 8.6
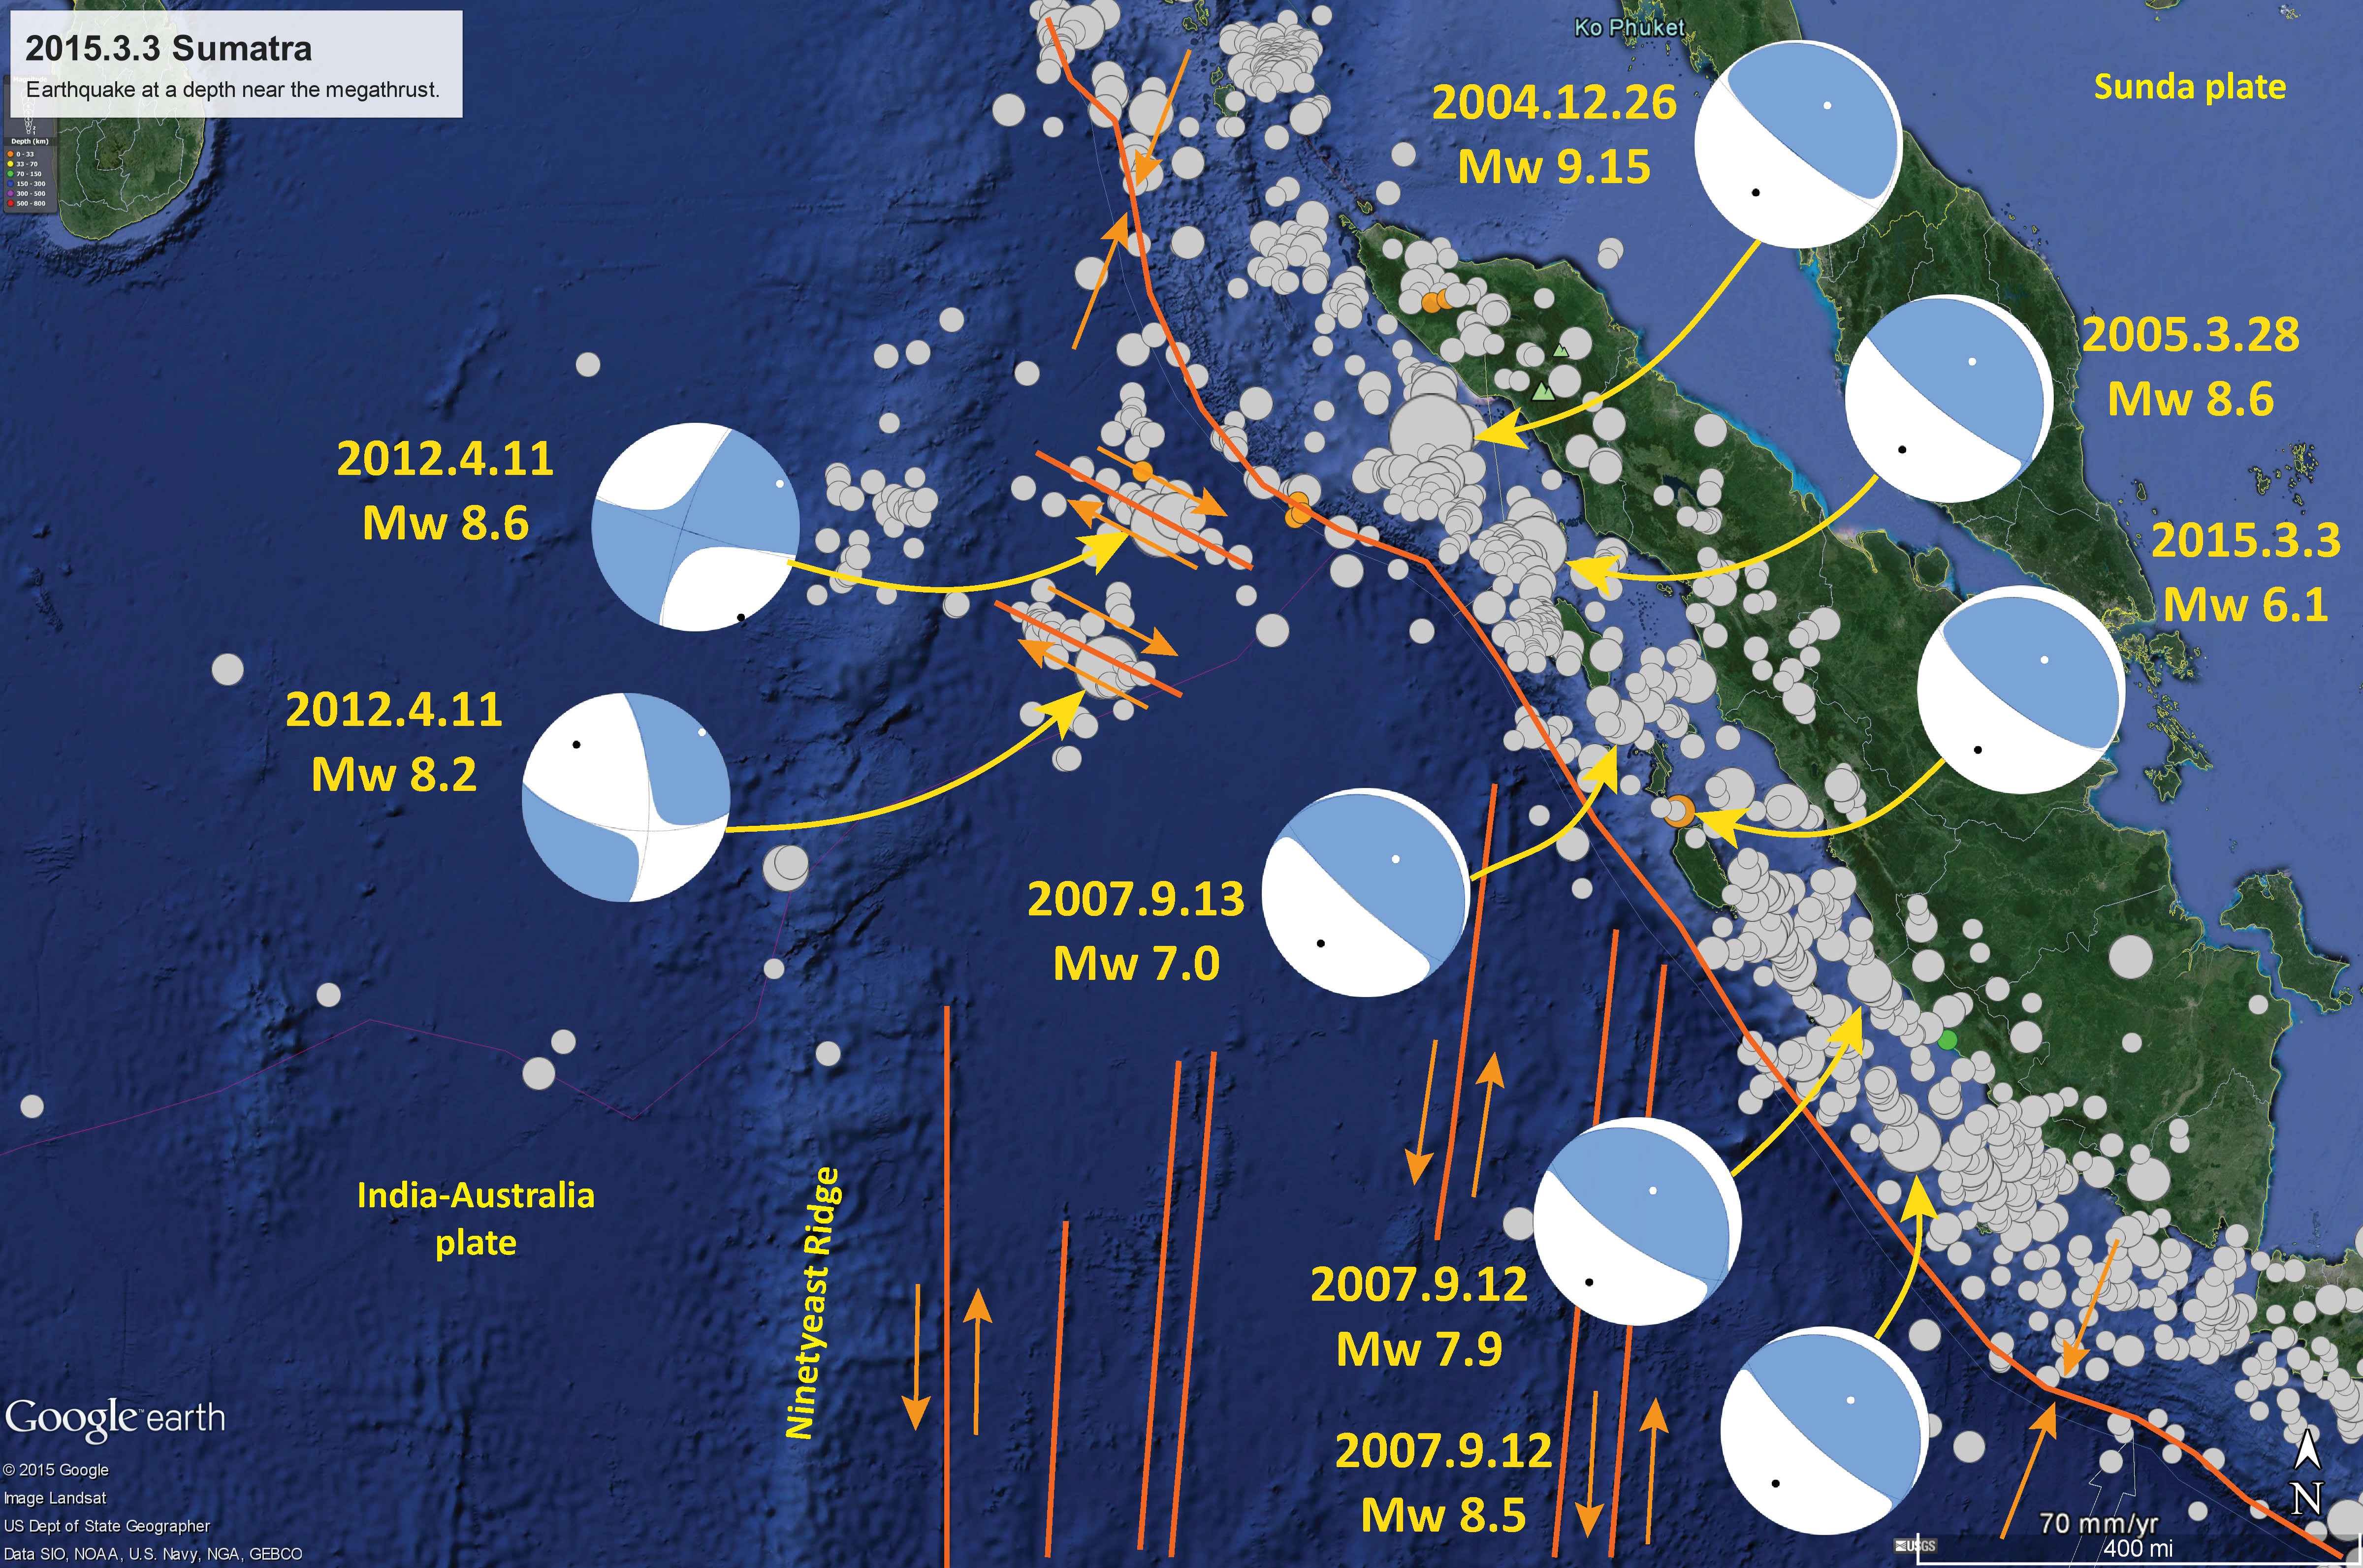
- 2015.3.3 Mw 6.1
Recent Seismicity
There have been several large magnitude earthquakes in this part of the Alpide belt in historic times, including some great earthquakes (
Here are the USGS web pages for the earthquakes I will discuss above:
-
While we were at sea offshore Sumatra, there was a CBC (Canada) film maker aboard recording material for a film on Cascadia subduction zone earthquakes. This is a dity that he made for us.
- link to the embedded video below. (45 mb mp4)
- YT link to the embedded video below.
- 2004 SASZ Earthquake Decadal Commemorative Review
- SASZ Fault Deformation
- 2016.03.02 M 7.8 Sumatra/Indian Ocean
- 2015.07.22 M 5.8 Andaman Sea
- 2015.11.08 M 6.4 Nicobar Isles
- 2012.04.11 M 8.6 Sumatra outer rise
- 2004.12.26 M 9.2 Andaman-Sumatra subduction zone
- Abercrombie, R.E., Antolik, M., Ekstrom, G., 2003. The June 2000 Mw 7.9 earthquakes south of Sumatra: Deformation in the India–Australia Plate. Journal of Geophysical Research 108, 16.
- Bothara, J., Beetham, R.D., Brunston, D., Stannard, M., Brown, R., Hyland, C., Lewis, W., Miller, S., Sanders, R., Sulistio, Y., 2010. General observations of effects of the 30th September 2009 Padang earthquake, Indonesia. Bulletin of the New Zealand Society for Earthquake Engineering 43, 143-173.
- Chlieh, M., Avouac, J.-P., Hjorleifsdottir, V., Song, T.-R.A., Ji, C., Sieh, K., Sladen, A., Hebert, H., Prawirodirdjo, L., Bock, Y., Galetzka, J., 2007. Coseismic Slip and Afterslip of the Great (Mw 9.15) Sumatra-Andaman Earthquake of 2004. Bulletin of the Seismological Society of America 97, S152-S173.
- Harris, R. A. (2006), Rise and fall of the Eastern Great Indonesian arc recorded by the assembly, dispersion and accretion of the Banda Terrane,
Timor, Gondwana Res., 10, 207–231. - Hayes, G. P., D. J. Wald, and R. L. Johnson (2012), Slab1.0: A three-dimensional model of global subduction zone geometries, J. Geophys. Res., 117, B01302, doi:10.1029/2011JB008524.
- Hengesh, J.V. and Whitney, B.B., 2016. Transcurrent reactivation of Australia’s western passive margin: An example of intraplate deformation from the central Indo-Australian plate in Tectonics, v. 35, doi:10.1002/2015TC004103.
- Jones, E.S., Hayes, G.P., Bernardino, Melissa, Dannemann, F.K., Furlong, K.P., Benz, H.M., and Villaseñor, Antonio, 2014, Seismicity of the Earth 1900–2012 Java and vicinity: U.S. Geological SurveyOpen-File Report 2010–1083-N, 1 sheet, scale 1:5,000,000,http://dx.doi.org/10.3133/ofr20101083N.
- Kanamori, H., Rivera, L., Lee, W.H.K., 2010. Historical seismograms for unravelling a mysterious earthquake: The 1907 Sumatra Earthquake. Geophysical Journal International 183, 358-374.
- Konca, A.O., Avouac, J., Sladen, A., Meltzner, A.J., Sieh, K., Fang, P., Li, Z., Galetzka, J., Genrich, J., Chlieh, M., Natawidjaja, D.H., Bock, Y., Fielding, E.J., Ji, C., Helmberger, D., 2008. Partial Rupture of a Locked Patch of the Sumatra Megathrust During the 2007 Earthquake Sequence. Nature 456, 631-635.
- Lasitha, S., Radhakrishna, M., Sanu, T.D., 2006. Seismically active deformation in the Sumatra–Java trench-arc region: geodynamic implications in Current Science, v. 90, p. 690-696.
- Natawidjaja, D.H., Sieh, K., Chlieh, M., Galetzka, J., Suwargadi, B., Cheng, H., Edwards, R.L., Avouac, J., Ward, S.N., 2006. Source parameters of the great Sumatran megathrust earthquakes of 1797 and 1833 inferred from coral microatolls. Journal of Geophysical Research 111, 37.
- Newcomb, K.R., McCann, W.R., 1987. Seismic History and Seismotectonics of the Sunda Arc. Journal of Geophysical Research 92, 421-439.
- Philibosian, B., Sieh, K., Natawidjaja, D.H., Chiang, H., Shen, C., Suwargadi, B., Hill, E.M., Edwards, R.L., 2012. An ancient shallow slip event on the Mentawai segment of the Sunda megathrust, Sumatra. Journal of Geophysical Research 117, 12.
- Rigg, J. W., and R. Hall (2011), Structural and stratigraphic evolution of the Savu Basin, Indonesia, Geol. Soc. London Spec. Publ., 355(1), 225–240.
- Rivera, L., Sieh, K., Helmberger, D., Natawidjaja, D.H., 2002. A Comparative Study of the Sumatran Subduction-Zone Earthquakes of 1935 and 1984. BSSA 92, 1721-1736.
- Sieh, K., Natawidjaja, D.H., Meltzner, A.J., Shen, C., Cheng, H., Li, K., Suwargadi, B.W., Galetzka, J., Philobosian, B., Edwards, R.L., 2008. Earthquake Supercycles Inferred from Sea-Level Changes Recorded in the Corals of West Sumatra. Science 322, 1674-1678.
- Smith, W.H.F., Sandwell, D.T., 1997. Global seafloor topography from satellite altimetry and ship depth soundings: Science, v. 277, p. 1,957-1,962.
- Storchak, D. A., D. Di Giacomo, I. Bondár, E. R. Engdahl, J. Harris, W. H. K. Lee, A. Villaseñor, and P. Bormann (2013), Public release of the ISC-GEM global instrumental earthquake catalogue (1900–2009), Seismol. Res. Lett., 84(5), 810–815, doi:10.1785/0220130034.
- Stow, D.A.V., et al., 1990. Sediment facies and processes on the distal Bengal Fan, Leg 116, ODP Texas & M University College Station; UK distributors IPOD Committee NERC Swindon, p. 377-396.
Sumatra
General Overview
Earthquake Reports
Here is a map showing the historic earthquake regions. Earthquake slip contours are shown for the 2004 and 2005 earthquakes. Some references for these earthquake sources include: Newcomb and McMann, 1987; Rivera et al., 2002; Abercrombie et al., 2003; Natawidjaja et al., 2006; Konca et al., 2008; Bothara, 2010; Kanamori et al., 2010; Philibosian et al., 2012.
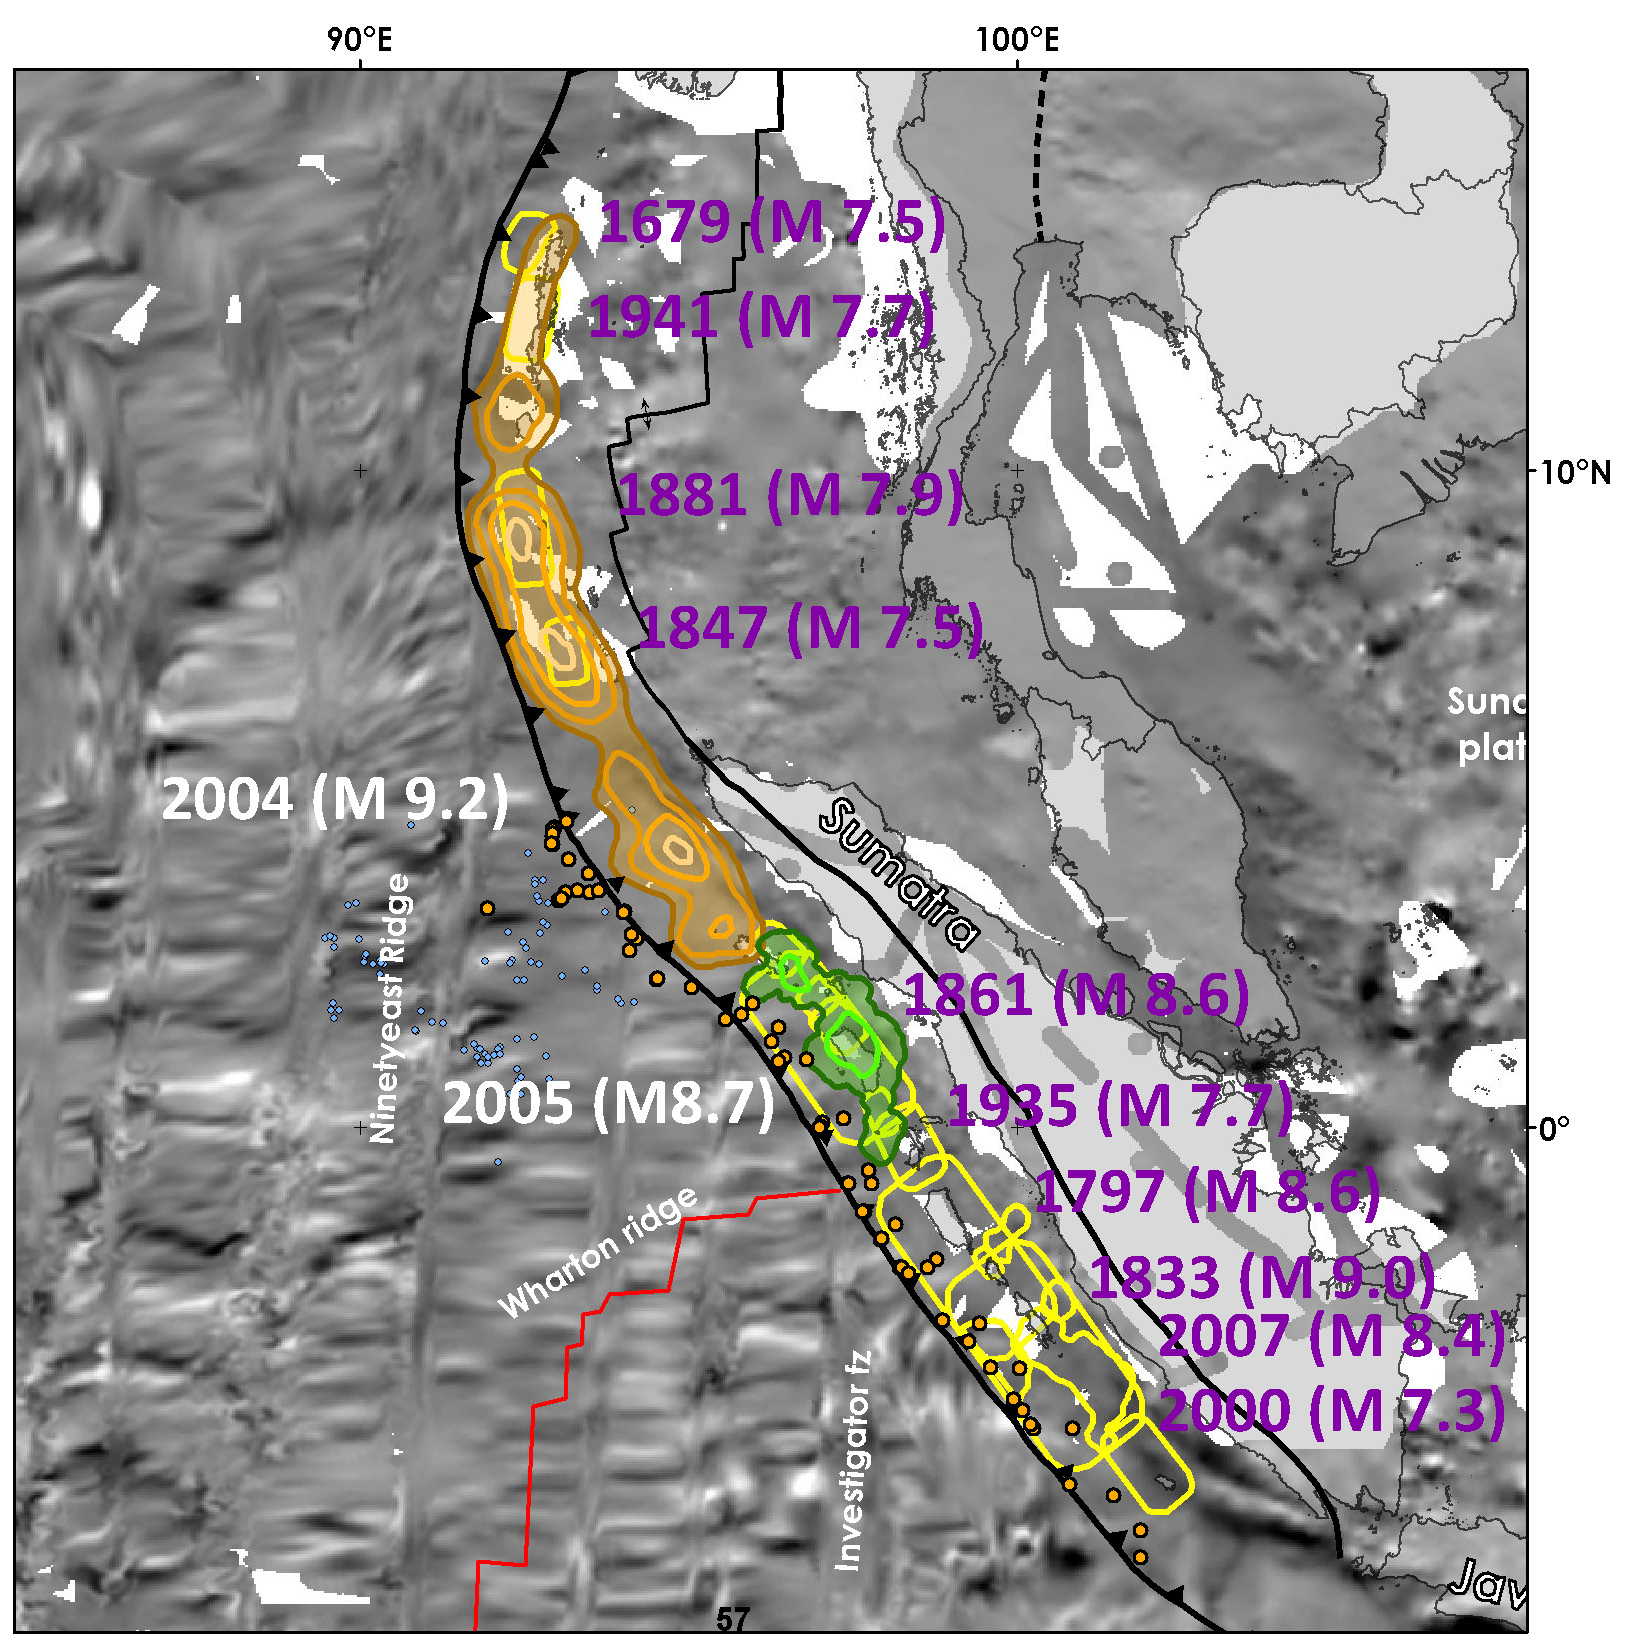
This map shows the magnitude of these historic earthquakes overlain upon a map showing the magnetic anomalies.
-
References:
1 thought on “Earthquake Report: Java Sea!”