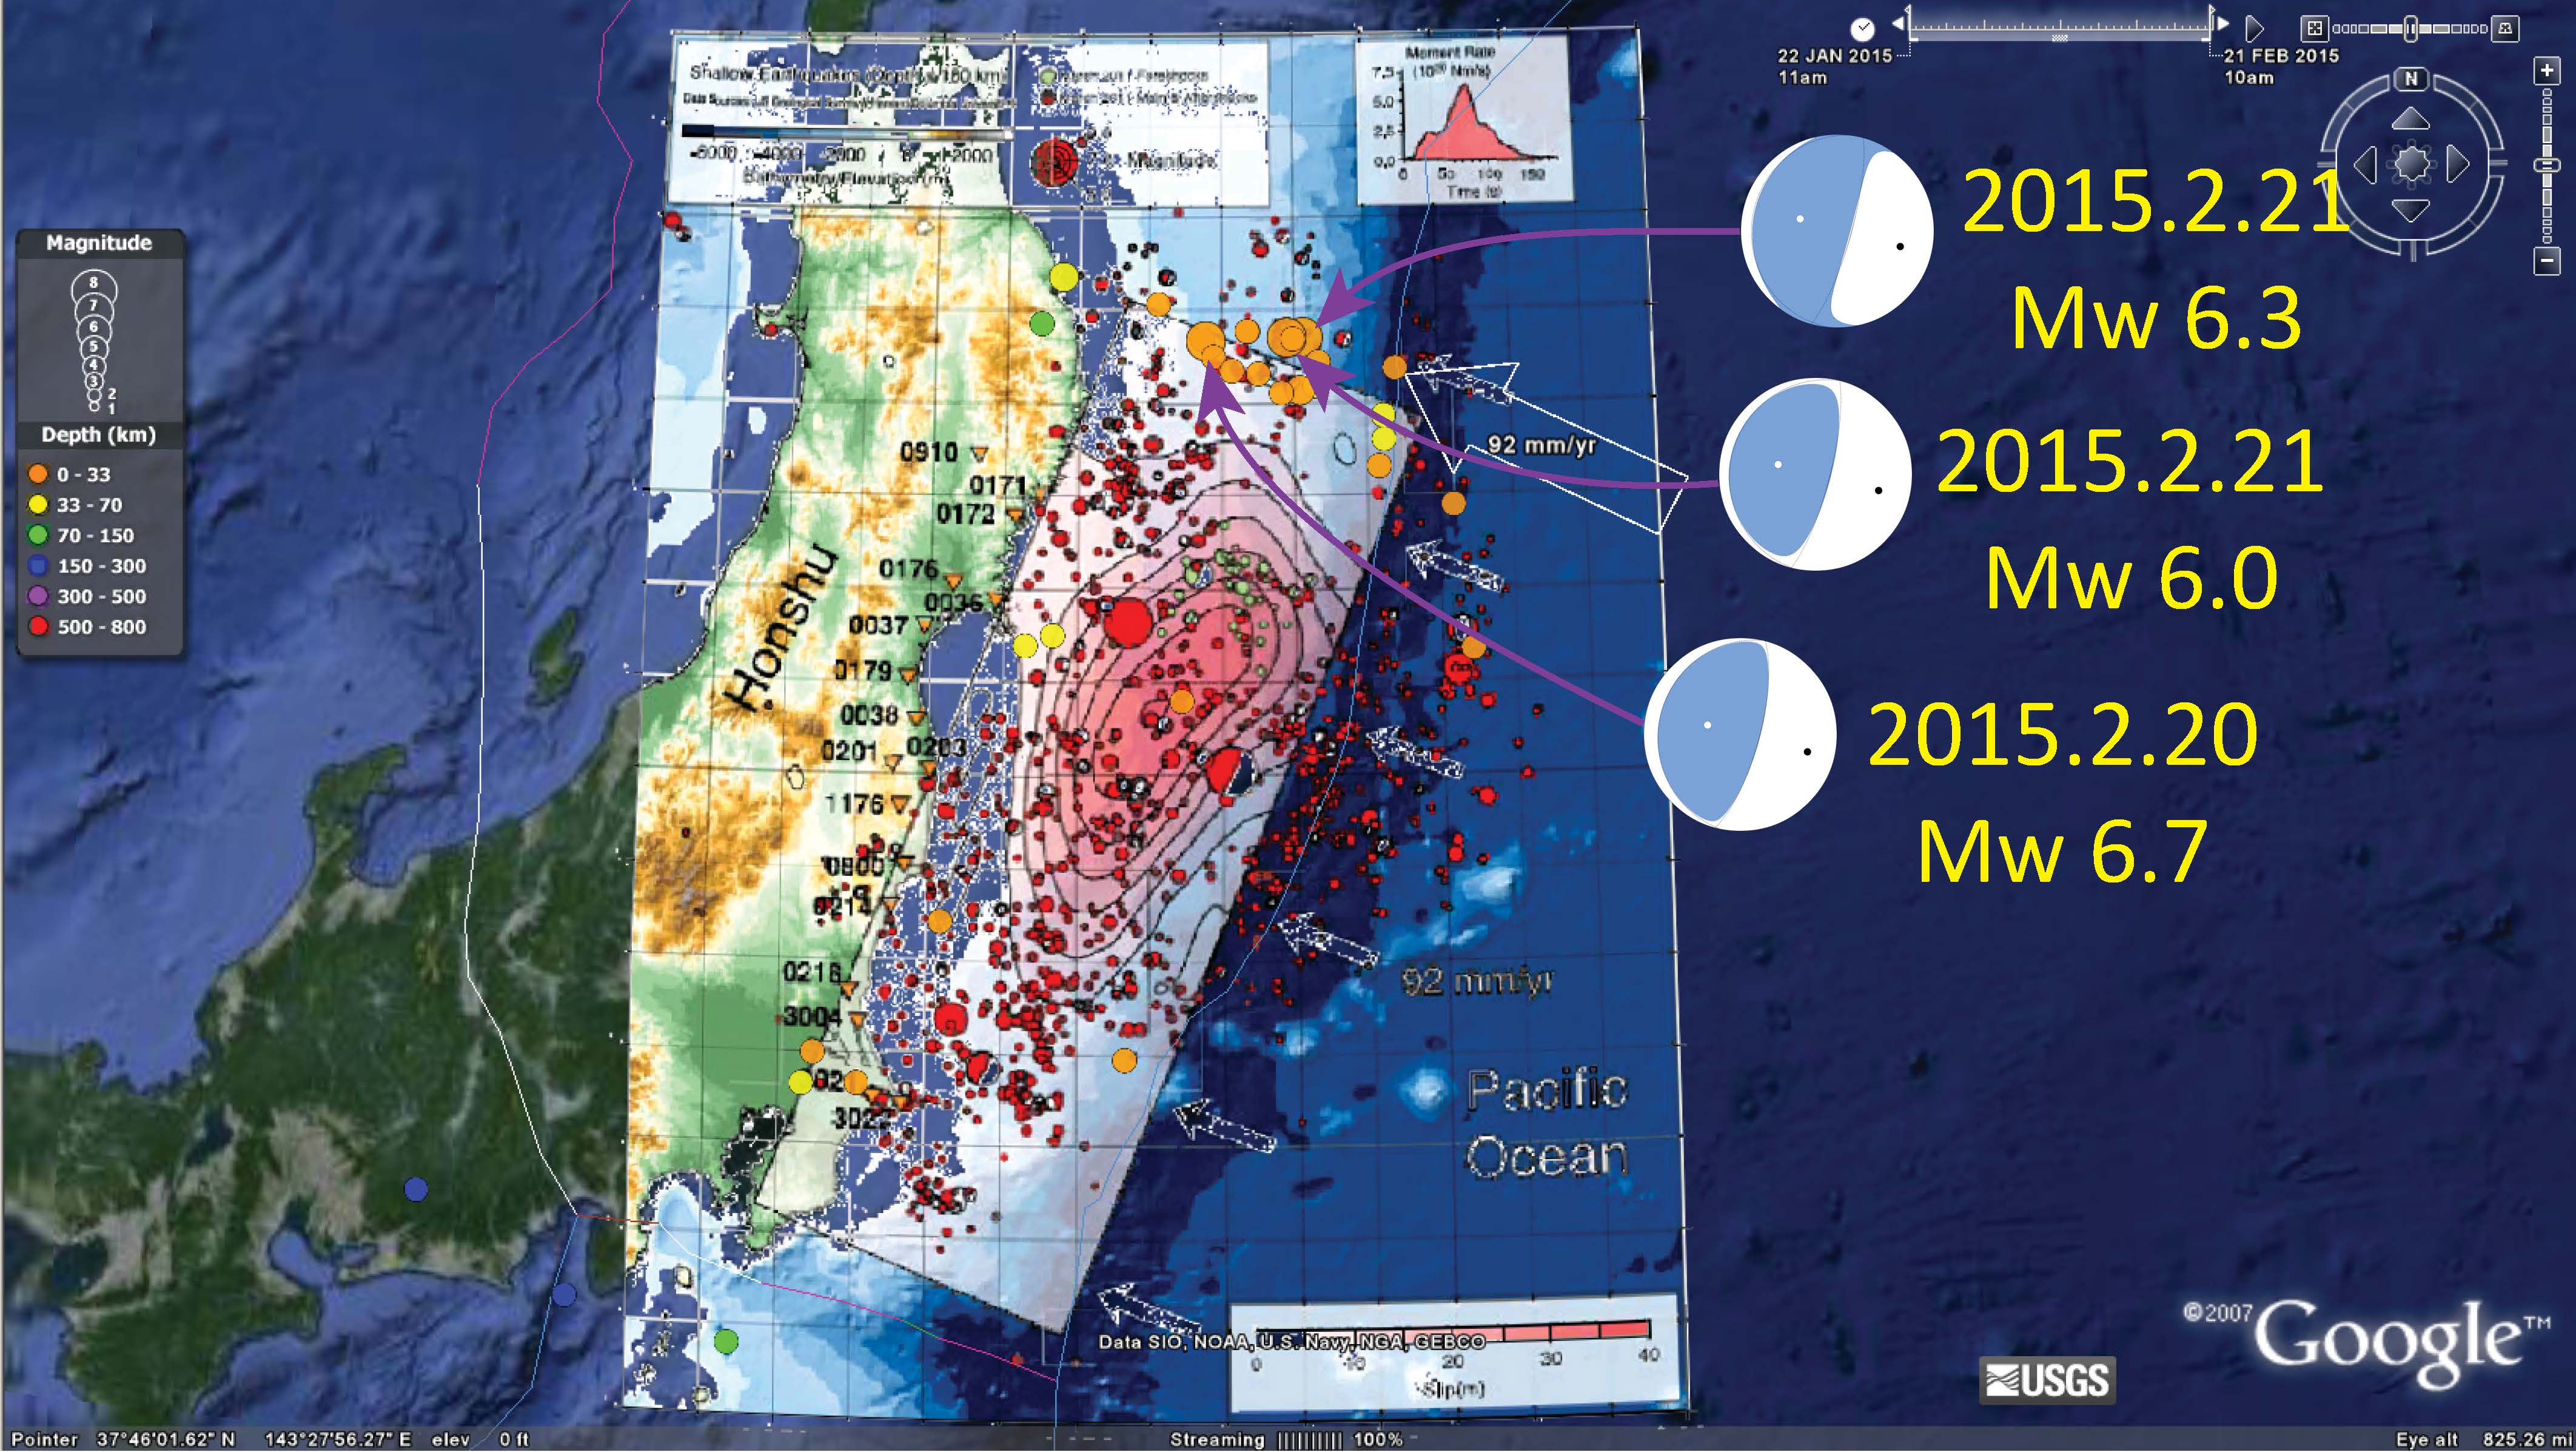
Here is what I was getting at in my last post. I have taken the Ammon et al. (2011) slip model and placed it into a real world reference frame (rubbersheeted it in ArcGIS). Then I exported it as a kml file and placed it into google Earth where I can also plot the recent seismicity.
There are several report updates, listed here:
- 2015.02.16 M 6.7 Japan Sanriku Coast – Main Report
- 2015.02.16 M 6.7 Japan Sanriku Coast Update #1
- 2015.02.16 M 6.7 Japan Sanriku Coast Update #2
- 2015.02.20 M 6.7 Japan Sanriku Coast Update #3
- 2015.02.21 M 6.7 Japan Sanriku Coast Update #4
- 2015.02.25 M 6.3 Japan Sanriku Coast Update #5
Here are the USGS web pages for the thrree largest magnitude earthquakes I plot in the map below:
Here is a map showing the three largest magnitude earthquakes in this recent seismic swarm. Check out my previous post here to see other slip models, estimates of stress change due to the 2011 March 11 Tohoku-Oki earthquake, and how these relate to historic slip models.
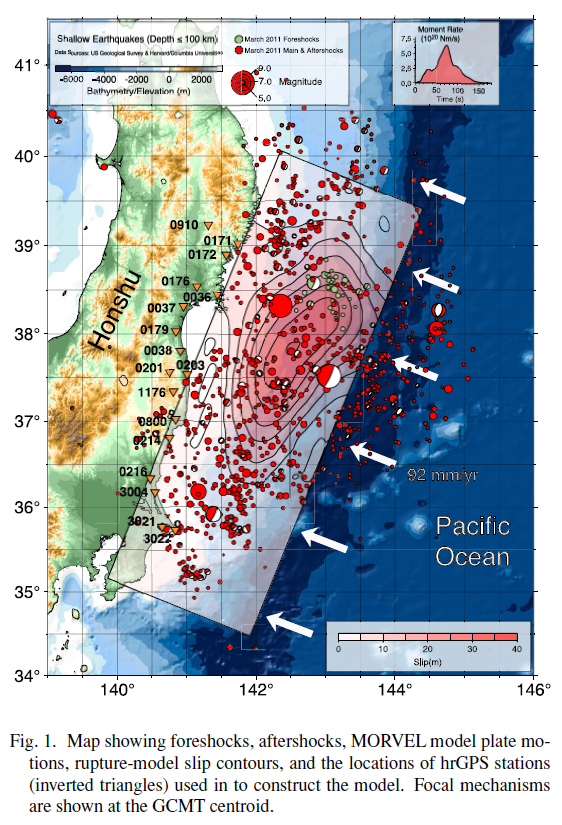
Here is the Ammon et al. (2011) figure.
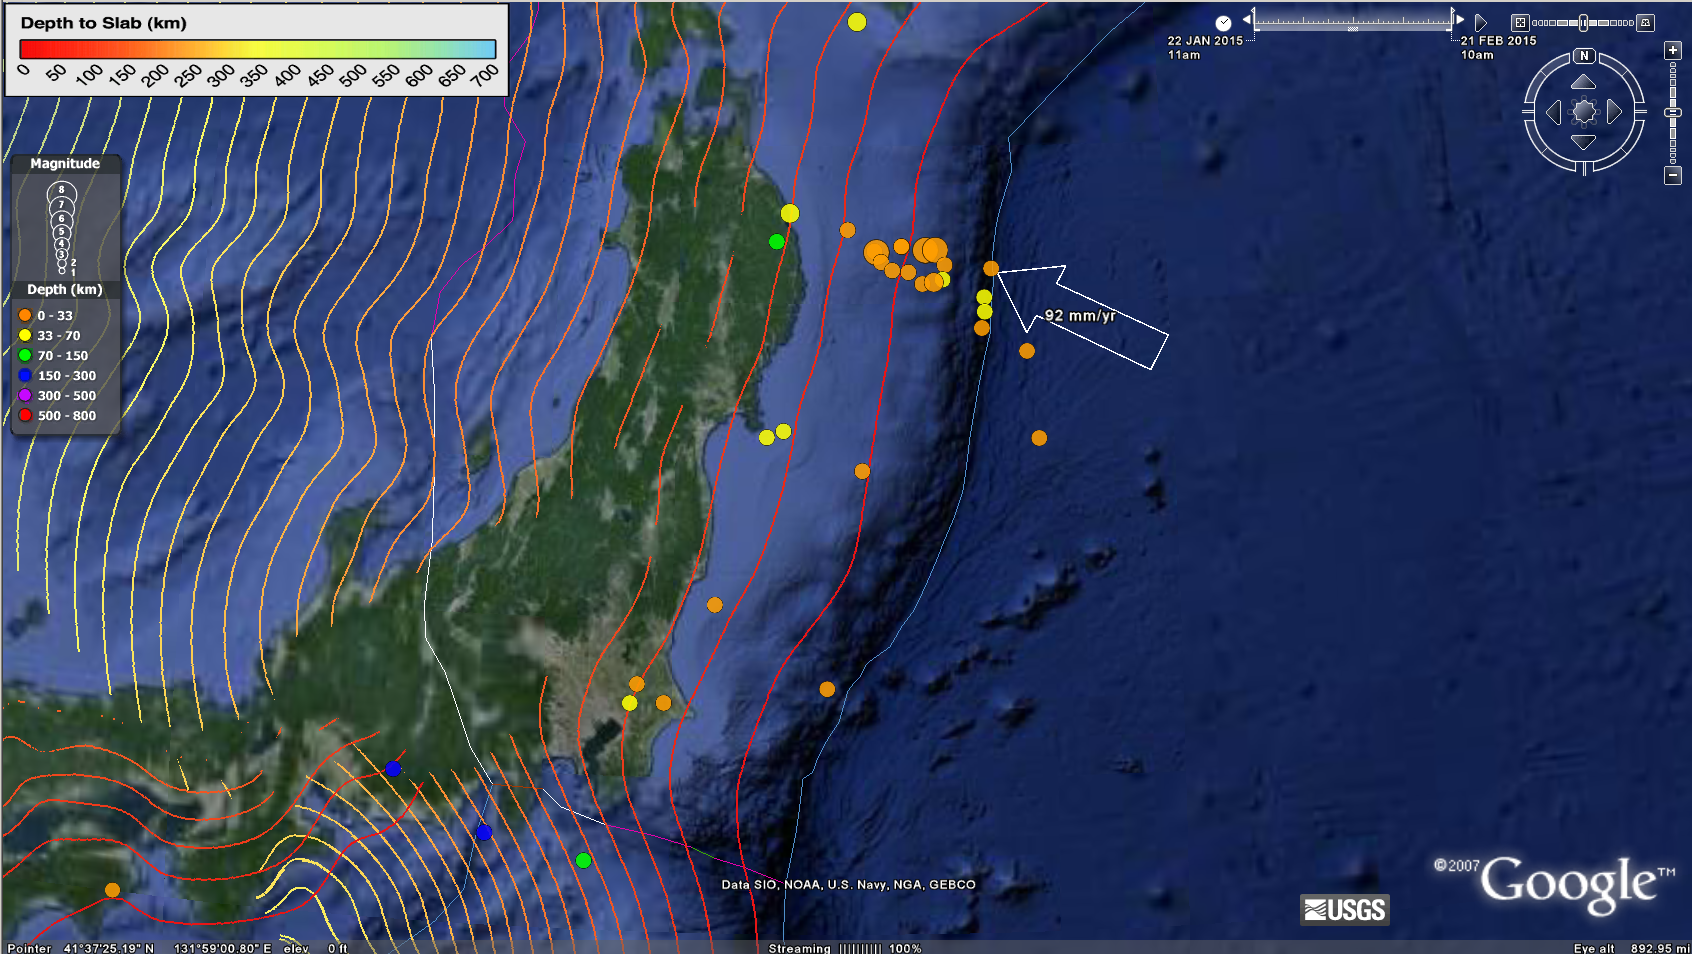
These hypocenters continue to align with the probable location of the subduction zone fault based on the Hayes slab model.
References:
- Ammon et al., 2011
- Hayes, G. P., D. J. Wald, and R. L. Johnson (2012), Slab1.0: A three-dimensional model of global subduction zone geometries, J. Geophys. Res., 117, B01302, doi:10.1029/2011JB008524.
1 thought on “Tohoku-Oki aftershocks are in a region of low slip during main events in 2011”