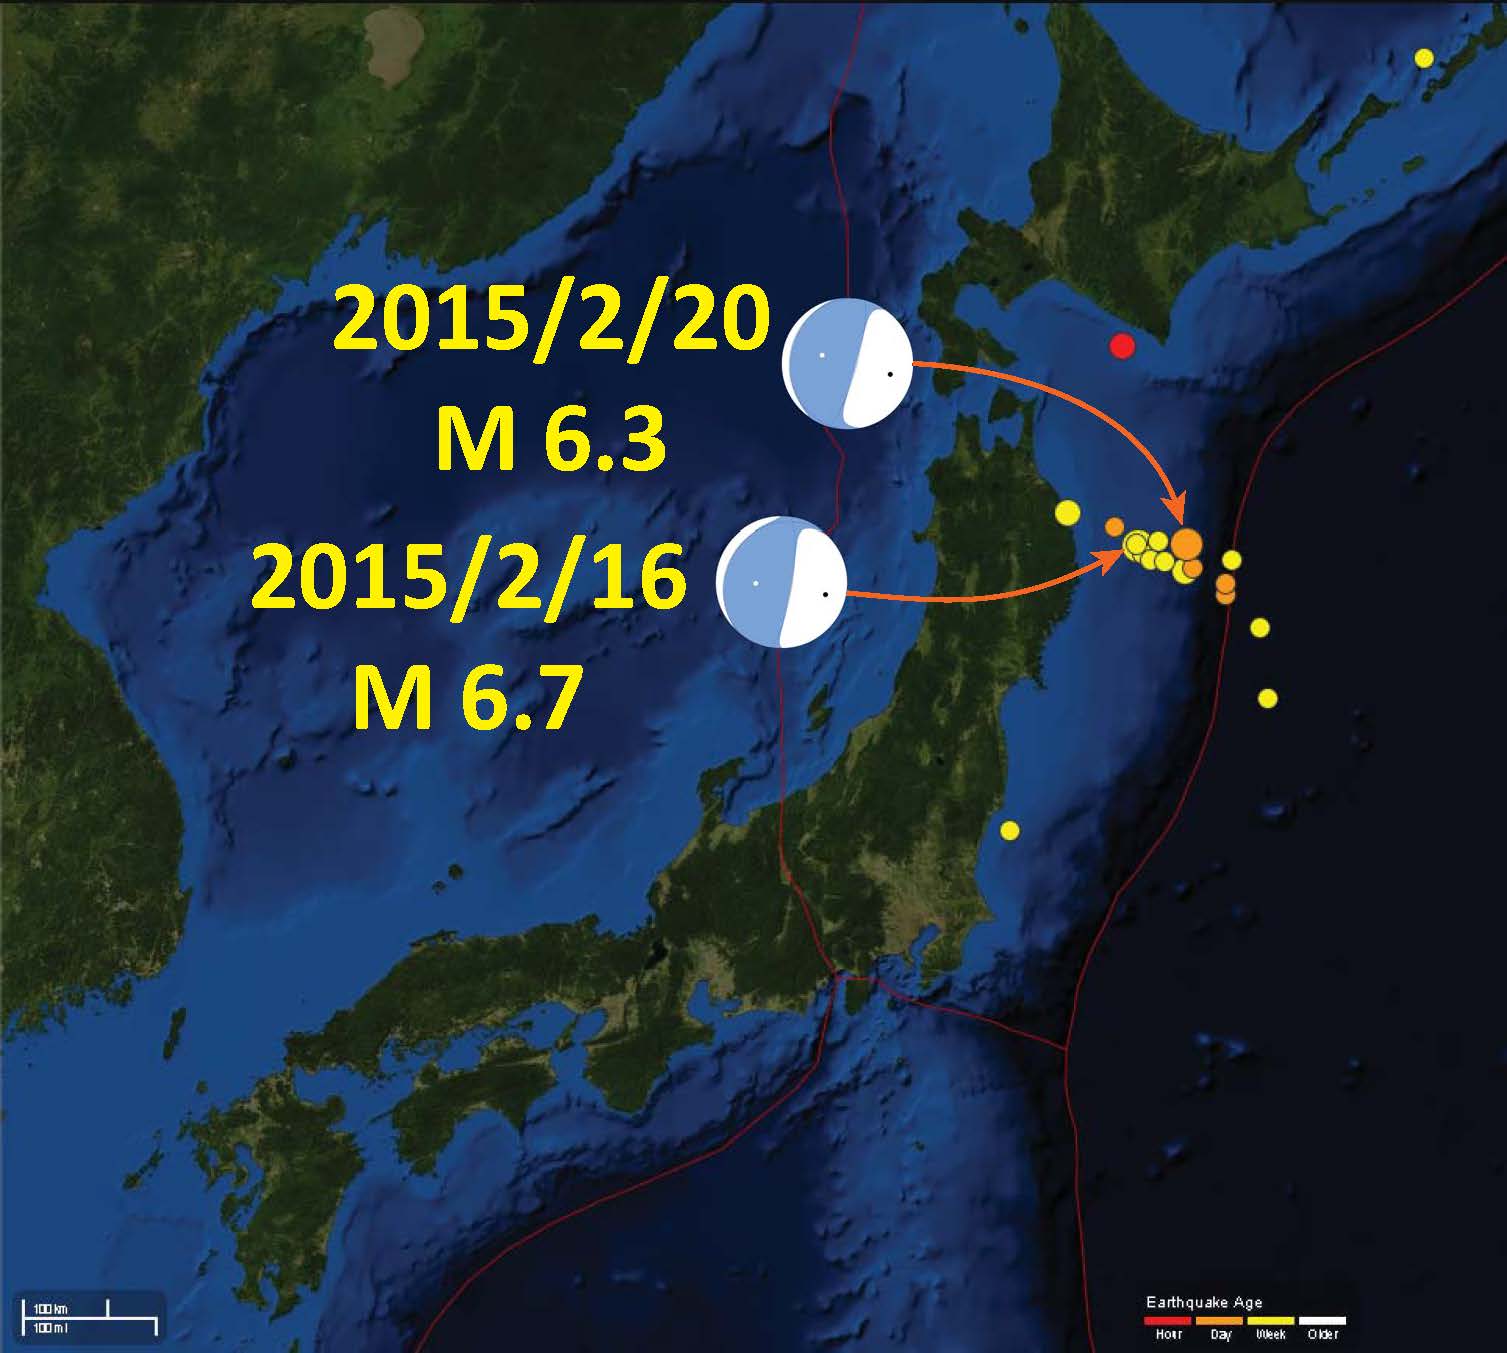
The aftershocks continue offshore northeast Japan. The recent swarm appear to align along a northwesterly strike (trend). Here is the USGS web page for the earthquake from today. This is the USGS web page for the largest magnitude earthquakes in this recent swarm. Here is my post from earlier in the week about this most recent swarm. Here are one and two follow up posts about this most recent swarm.
There are several report updates, listed here:
- 2015.02.16 M 6.7 Japan Sanriku Coast – Main Report
- 2015.02.16 M 6.7 Japan Sanriku Coast Update #1
- 2015.02.16 M 6.7 Japan Sanriku Coast Update #2
- 2015.02.20 M 6.7 Japan Sanriku Coast Update #3
- 2015.02.21 M 6.7 Japan Sanriku Coast Update #4
- 2015.02.25 M 6.3 Japan Sanriku Coast Update #5
One would wonder if there were some northwest striking structure to which these earthquakes were responding. The Cascadia subduction zone, as others like Sumatra, has strike slip faults in the downgoing plate that have sisters in the overlying accretionary prism. Due to the seismogenic coupling along the fault, when the downgoing plate deforms along these faults, the accretionary prism also deforms. Chris Goldfinger has published about these faults in Cascadia.
This is probably not the case here in Japan. These earthquakes have compressional moment tensors, not strike-slip solutions. It is more likely (?) that this swarm is simply the subduction zone fault slipping in an across-strike direction (these epicenters are up-dip and down-dip of each other, i.e. they are all in a narrow along-strike segment). I have some figures below that I will use to discuss this. But first, here is a map showing this recent swarm of seismic activity.
At first I thought that this swarm was in a location that did not slip in 2011 since the slip models did not cover this segment of the fault. However, looking at the aftershock maps, there were aftershocks in this along-strike segment of the fault.
Slip Models and Aftershock Maps
Gusman et al., 2013
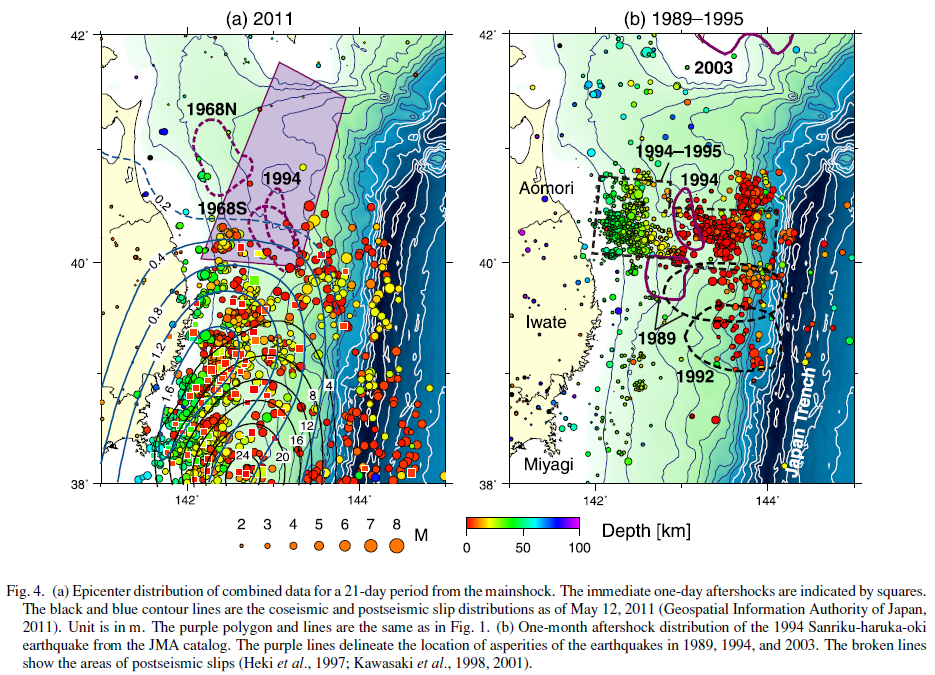
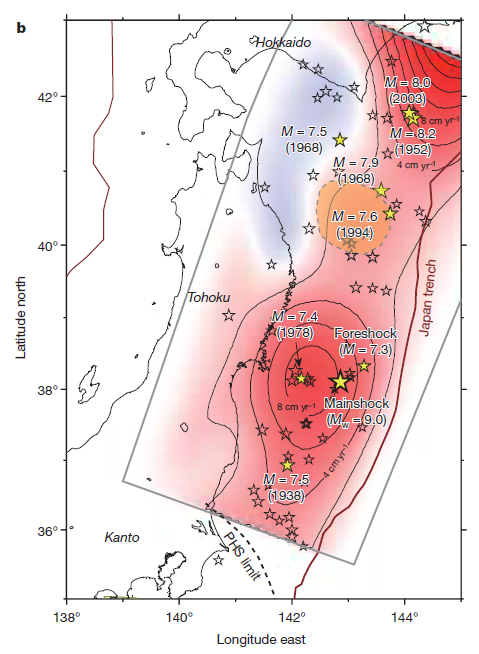
This one from Kosuga et al, 2011 show the aftershocks in 2011 as they relate to some historic earthquakes and their aftershocks. This most recent swarm appears to plot just to the south of the 1994 swarm.
This shows various mainshock and aftershock slip patches from Nishimura et al., 2011:
![]()
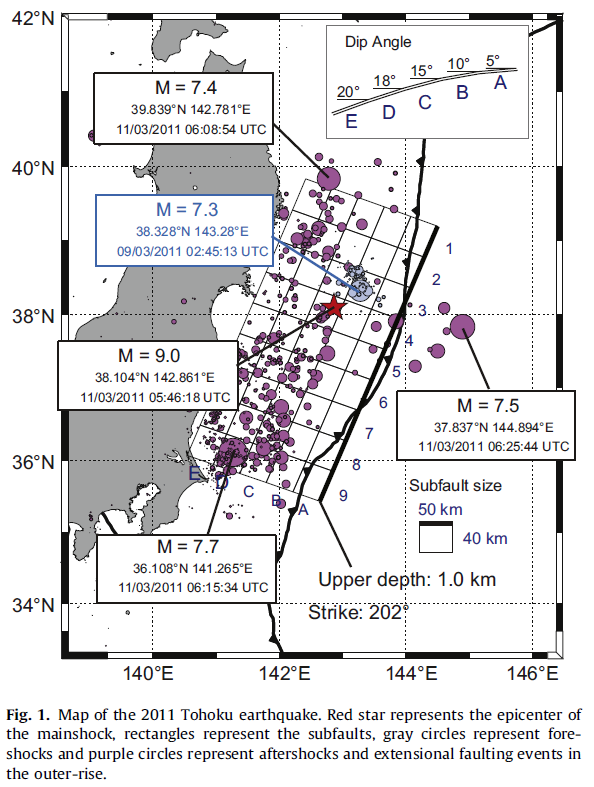
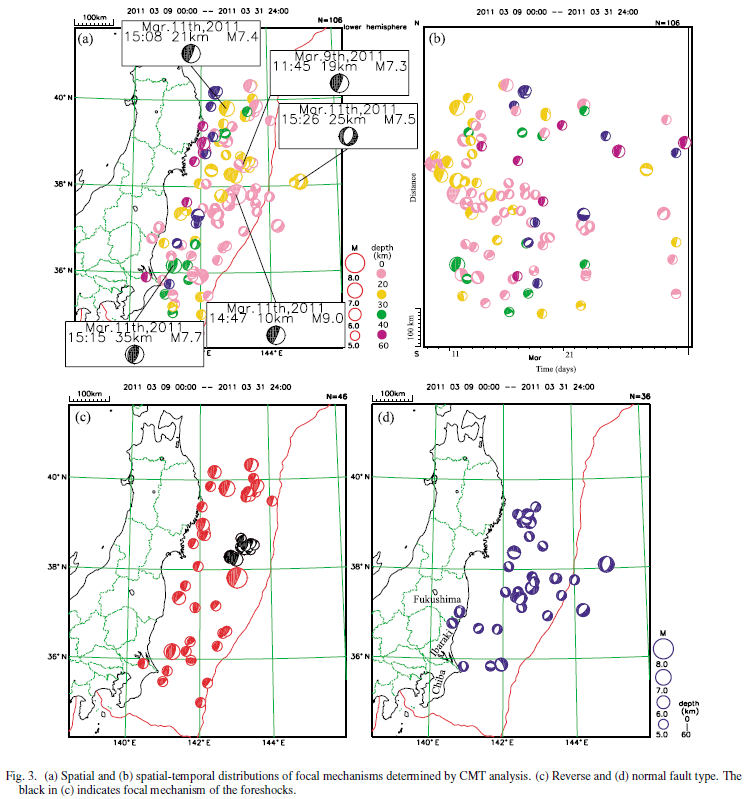
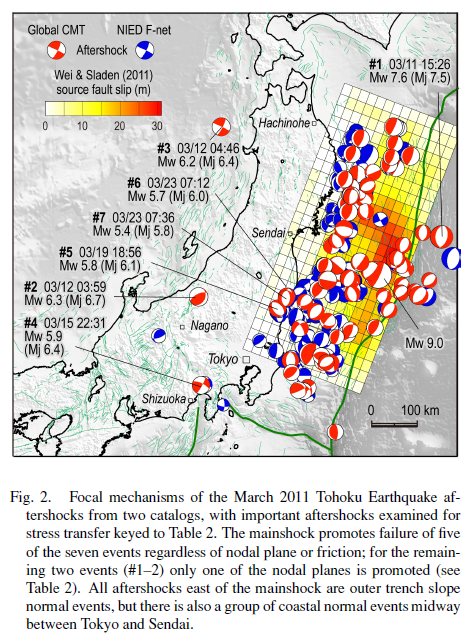
This Hirose et al. (2011) map shows focal mechanisms for select fore- and after-shocks, as well as the main shock. There were some large magnitude afteshocks in the segment that has swarmed in the past ~1 week.
This Toda et al. (2011) map also shows focal mechanisms for related earthquakes, along with their slip model.
Lets take a look at some of the earthquake slip models for the 2011 March 11 Tohoku-Oki M 9.1 subduction zone earthquake. There are dozens of them. Note where the slip was in 2011 and where this recent swarm is located. There are different sources of information that have been inverted for these source slip models. Some only use one type of data, others use multiple types of data (seismologic data, GPS data, tsunami wave form data, etc.). The best inversions include as many sources as possible. I posted these slip models first when I was reporting on some aftershocks on 2015/02/20 here.
Earthquake Slip Inversions
Ammon et a., 2011 show their slip inversion (GPS) along with the epicenters and their source time function plot.
Fujitsu et al., 2011, inverted from tsunami wave forms.
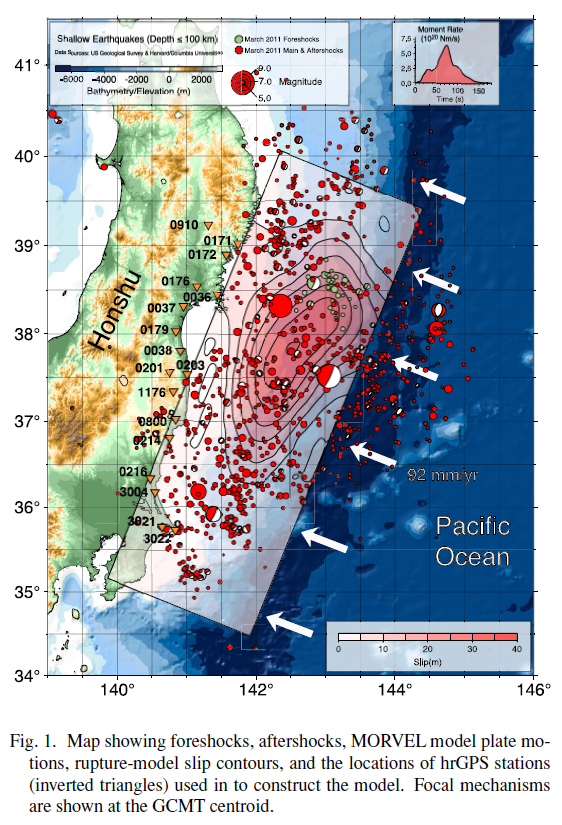
Gusman et al., 2013, inverted from tsunami wave forms.

Iinuma et al., 2012 shows the seafloor displacement used in their slip model.
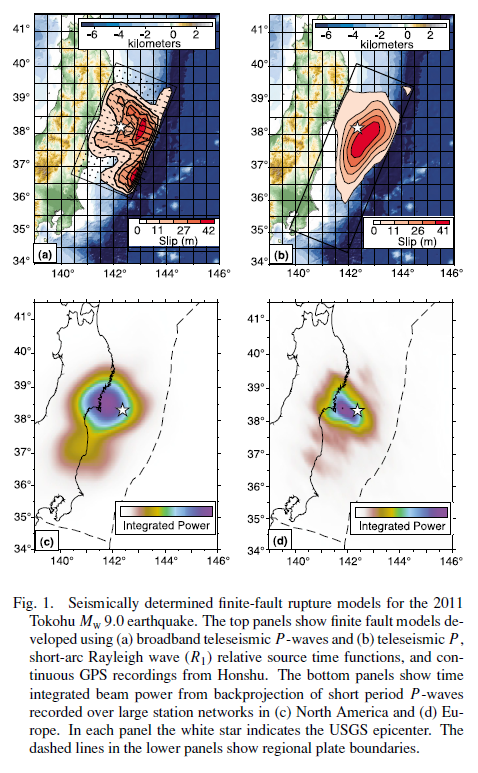
Koper et al., 2011 using seismic and GPS data:
Lay et al., 2011 b, showing their seafloor deformation using seismic data.
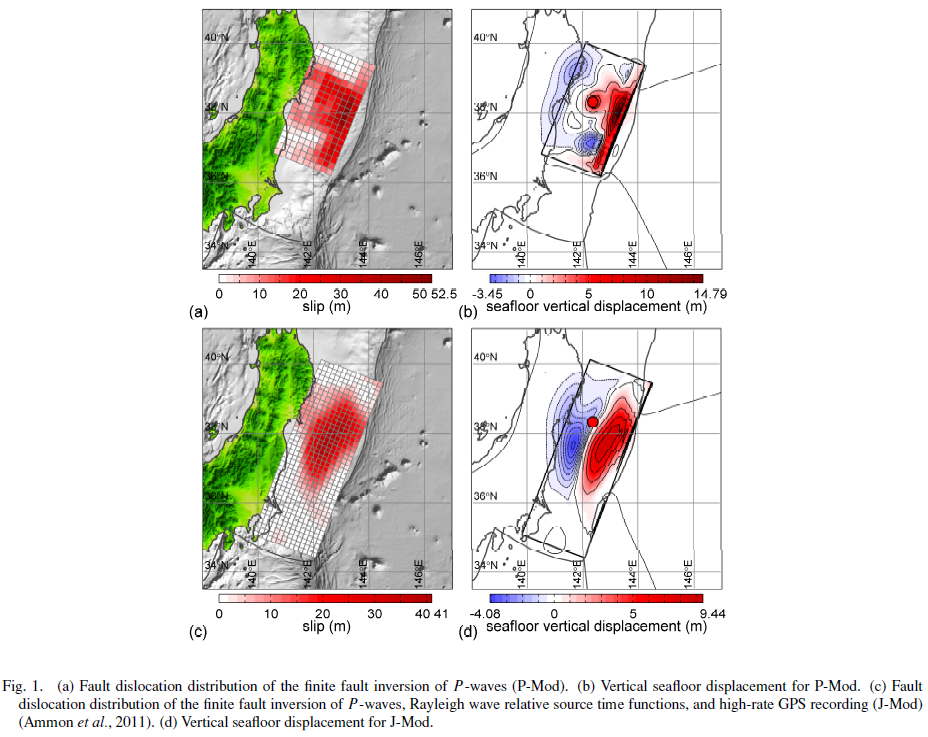
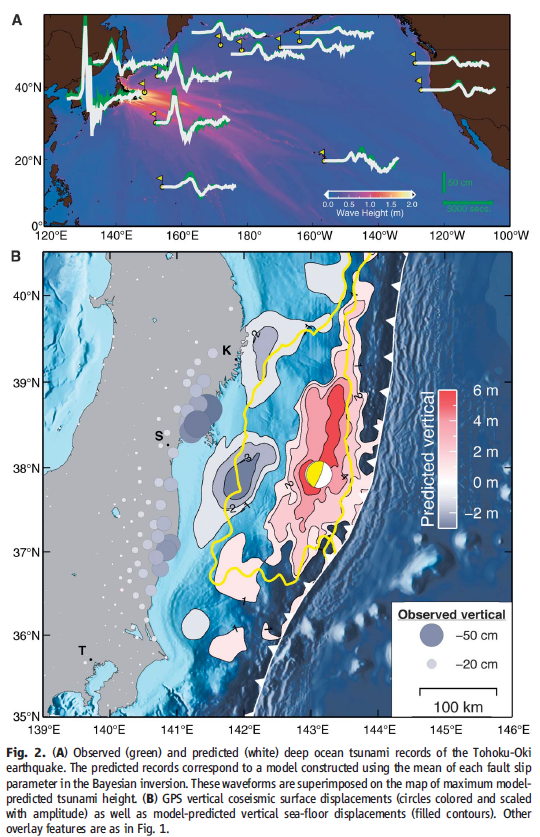
Lay et al., 2011 a, using seismic, GPS, and tsunami wave inversions.
Lay et al., 2011 c, joint inversions os seismic and GPS data:
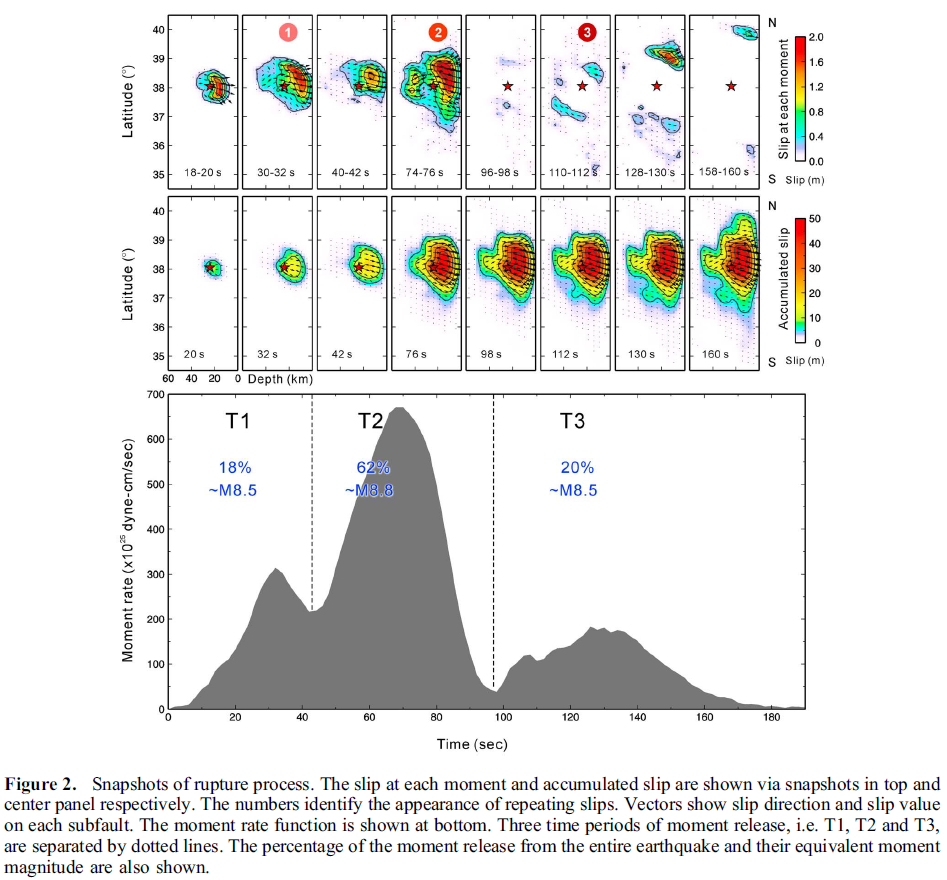
Lee et al., 2011:
This shows how the Lee et al. (2011) slip model incorporates the three main sub event slip patches through time (with the source time function plotted as well).
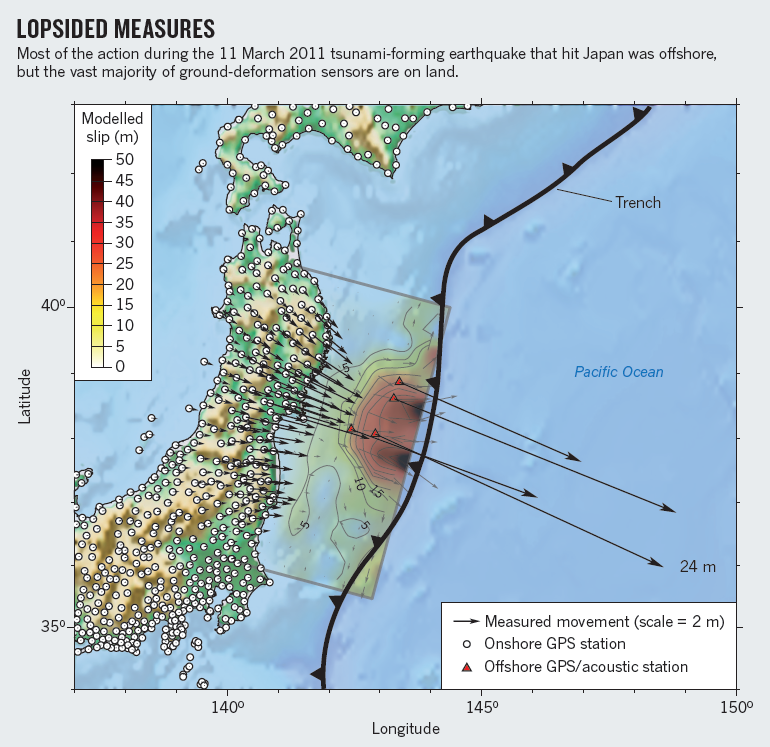
Newman et al., 2011, based on a GPS inversion:
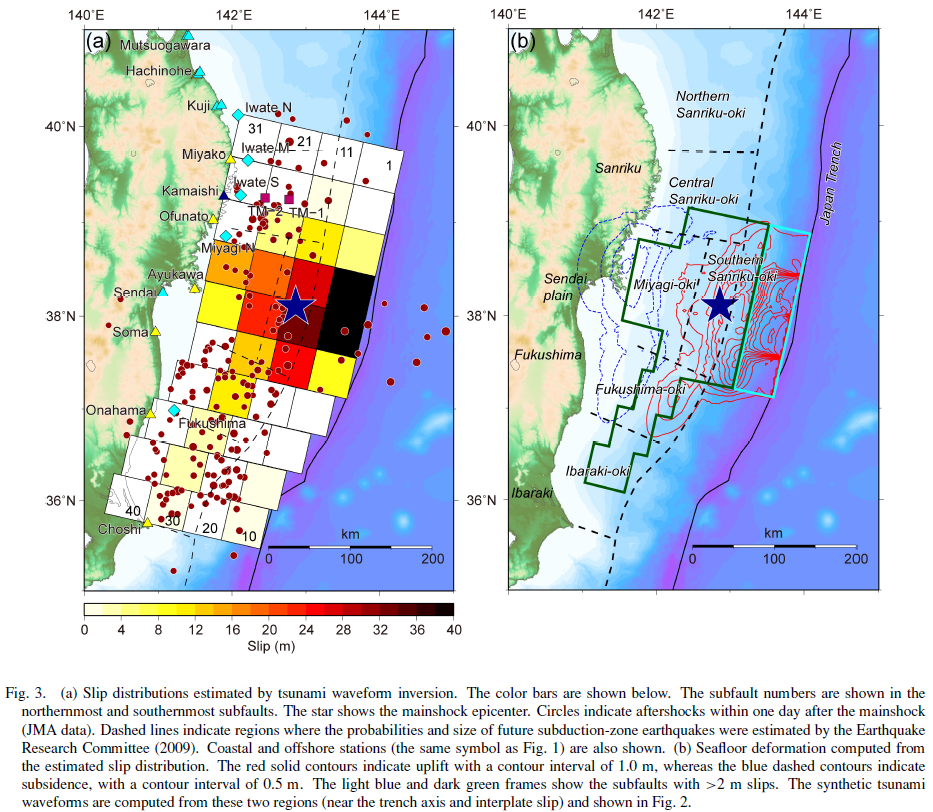
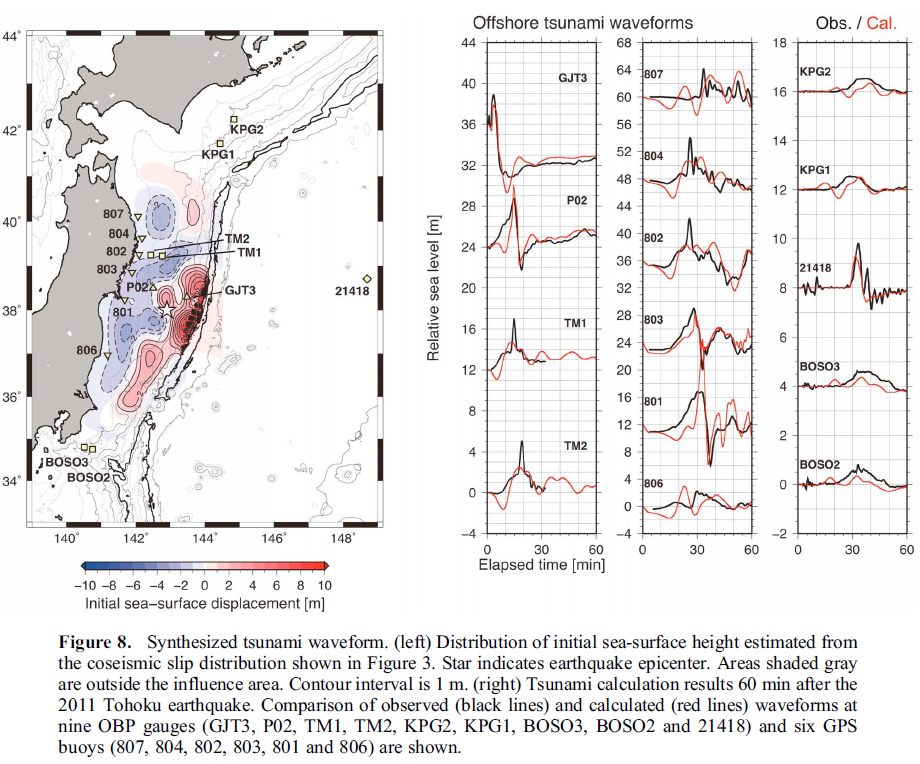
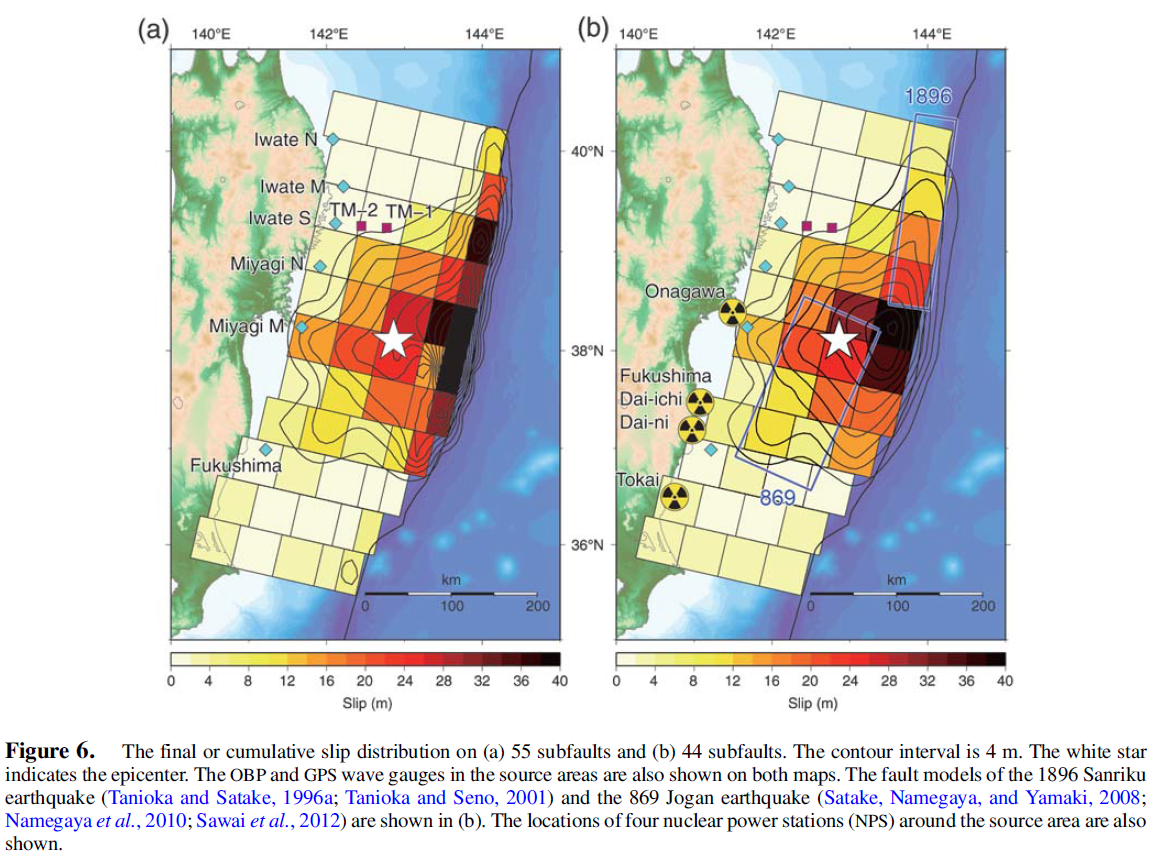
Satake et al., 2013, based on tsunami wave form inversion:
Simons et al., 2011 seafloor deformation for their tsunami wave inversions:
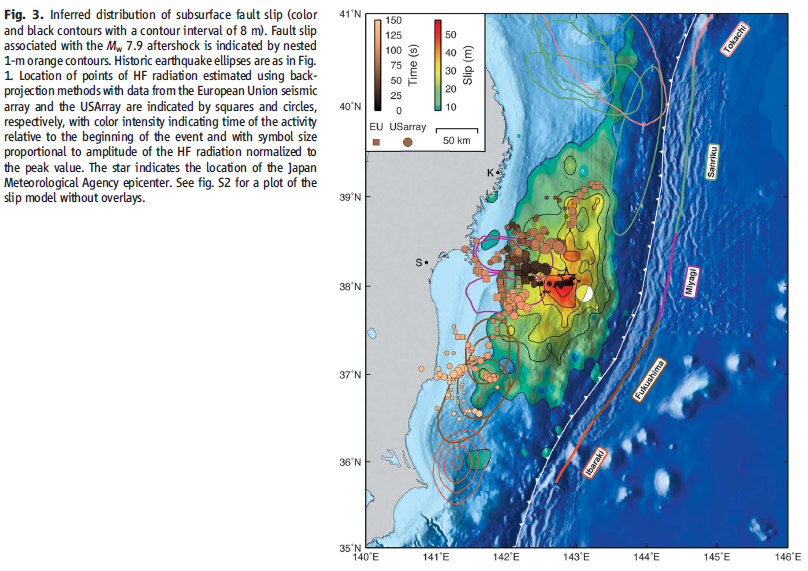
Simons et al., 2011 slip inversion from high frequency seismic data:
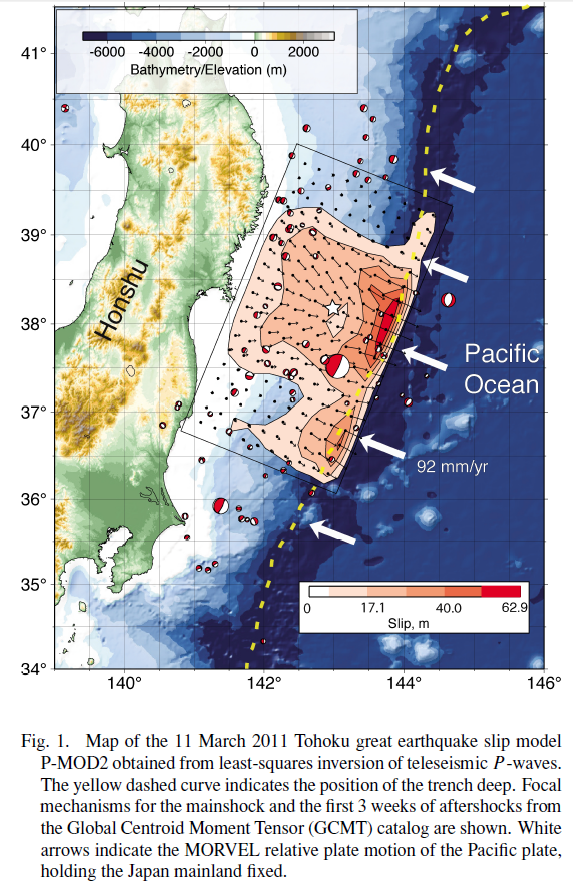
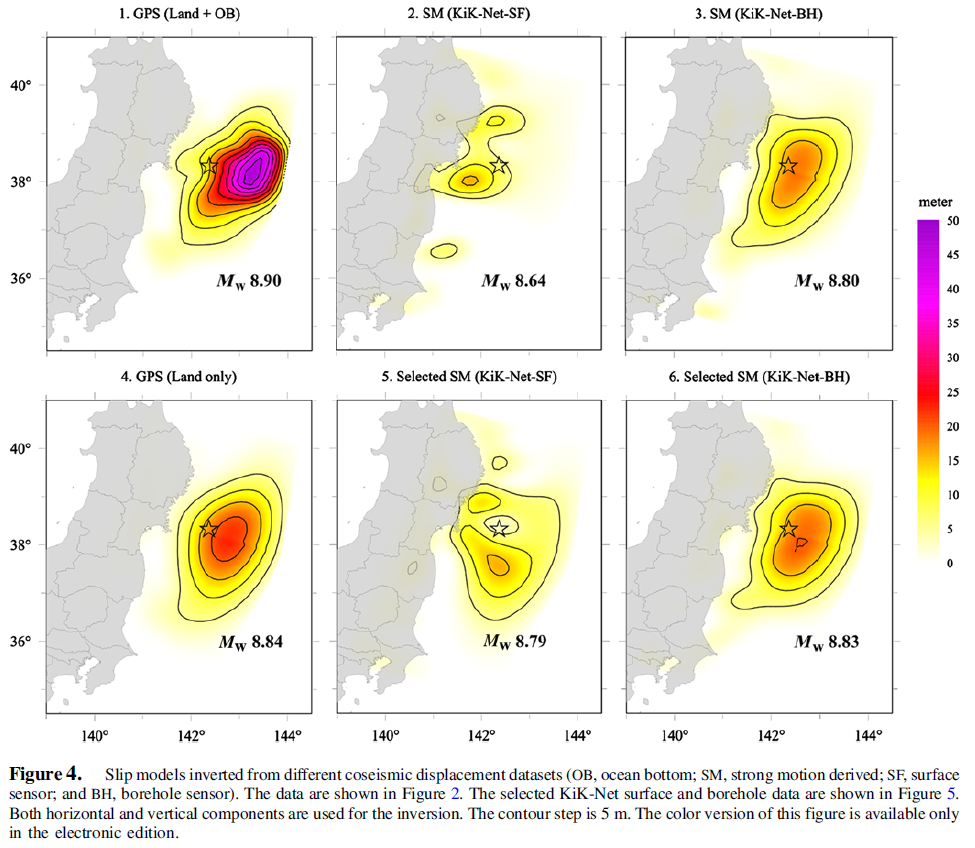
Wang et al., 2013 showing inversions from six different sources:
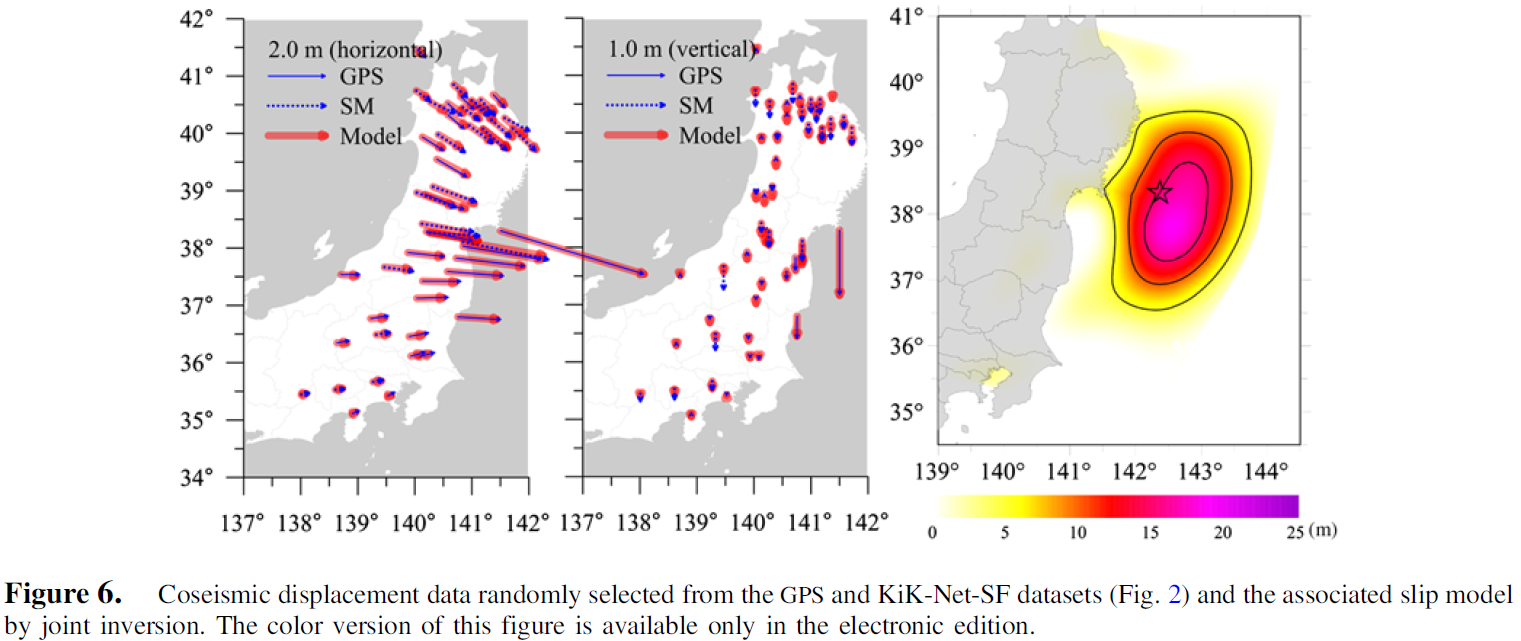
Wang et al., 2013 and their joint inversion:
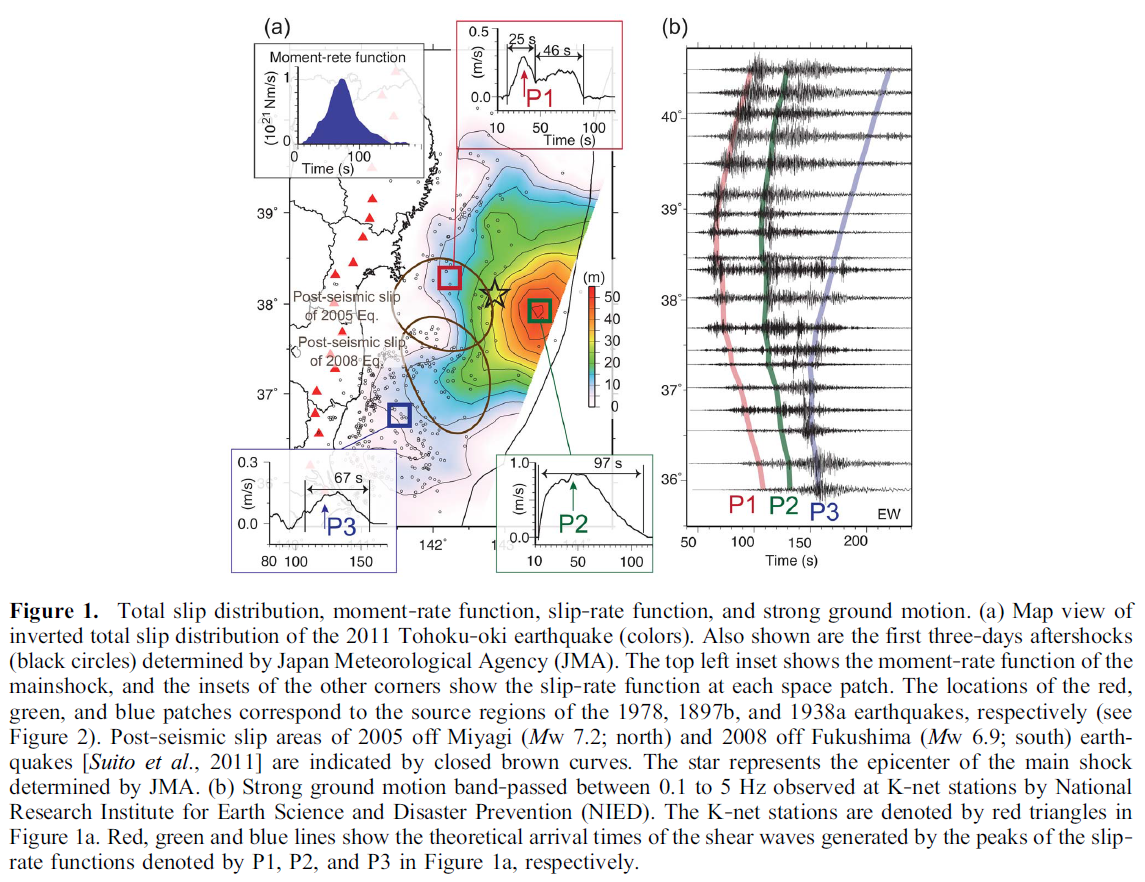
Here is one of the more comprehensive figures from Yagi et al., 2011. They plot their slip model (seismic data), historic slip patches, source time functions for the main sub-events, and the seismic waves, outlining the 3 main sub-events.
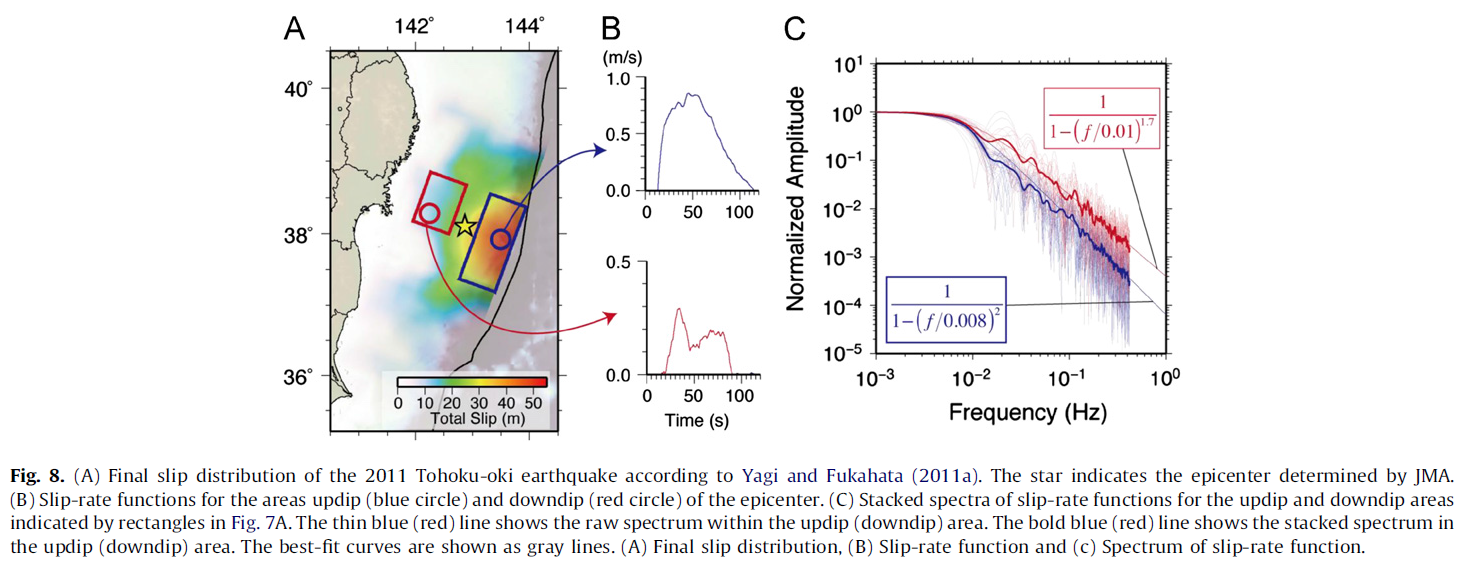
This is Yagi et al.’s (2012) final slip distribution, the source time function for two patches, and the spectra of the slip rate.
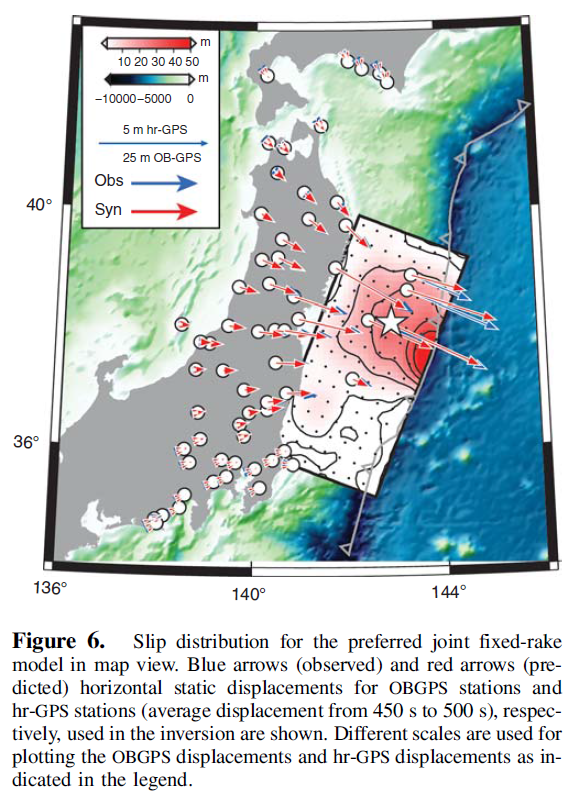
This is from Yamazaki et al., 2011 using GPS and tsunami wave inversions.
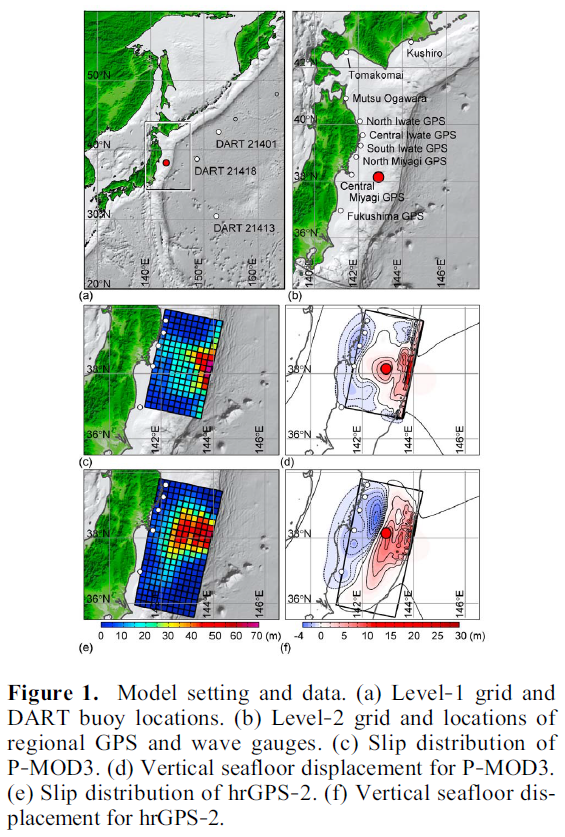
This is from Yamazaki et al., 2011 showing the sea floor deformation used for their inversion.
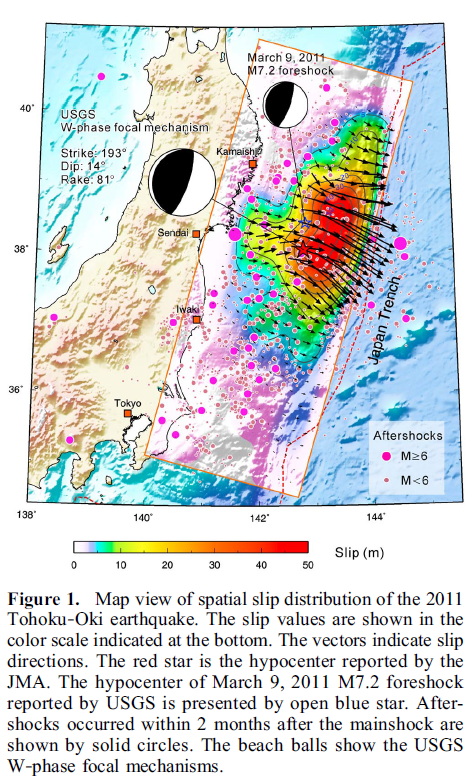
Yue and Lay, 2013 show their joint slip model (GPS):
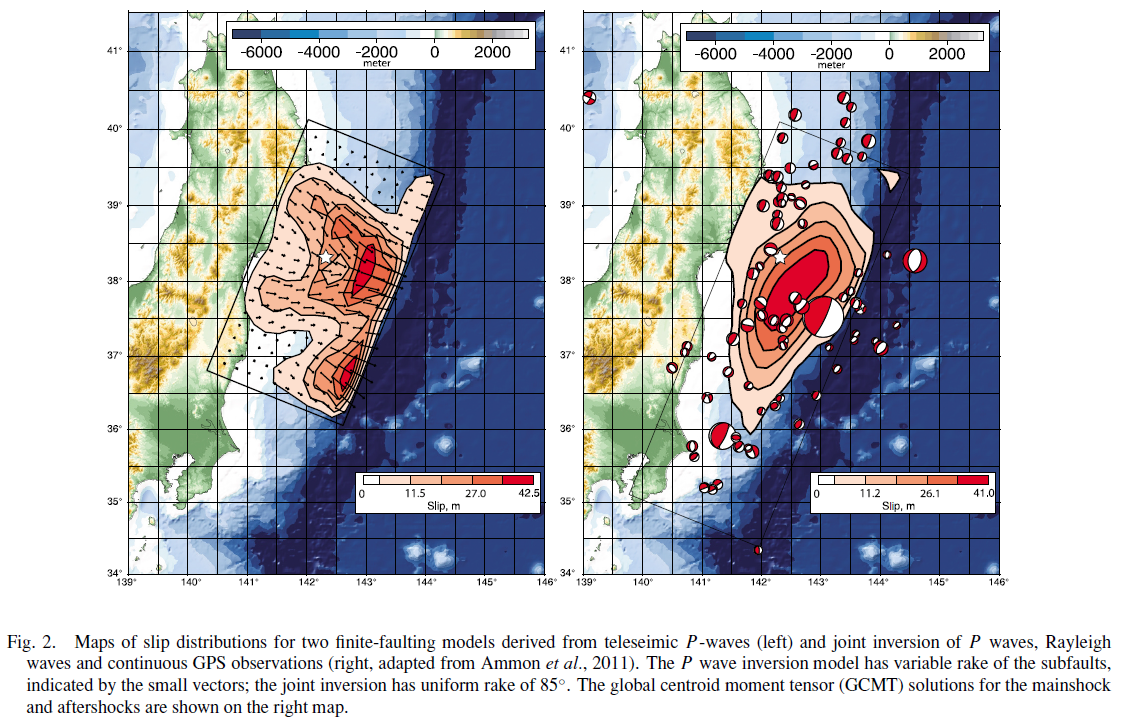
Shao et al., 2011. Slip models prepared by inverting teleseismic body and surface waves, followed by their figure caption as a blockquote.

Comparison of surface projections of slip model I, II, III by joint inverting teleseismic body and surface waves. Yellow line highlights the 5-m slip contour. Red star indicates the epicenter location and red dots are the aftershocks within first 6 days from JMA catalog. White arrow shows the Pacific plate motion relative to the North America plate (Demets et al., 1994). (a) Model I. (b) Model II. (c) Model III. (d) Comparison of moment rate functions of UCSB Model I, II, and III.
Lets now compare the 2011 earthquake with historic earthquake slip regions. Lets also look at the regional slip deficit and how this recent swarm may fit into the bigger picture of this part of this subduction zone.
Slip Compared to historic earthquakes and pre- and post-seismic slip, etc.
Ito et al., 2011 2011 slip compared to historic earthquake slip patches.
Ikuta et al., 2012, 2011 slip compared to historic slip estimates:
This Ikuta et al. (2012) plots shows the slip deficit for this part of the subduction zone. Basically, this is a way of viewing how much plate convergence might be expected to contribute to earthquake slip over time. In this case, we see how the smaller earthquakes took up some of the slip adjacent to the 2011 slip patch (think about where today’s swarm took place compared to the region that slipped in 2011).
What about how the 2011 earthquake changed the stress on the fault in regions adjacent to the 2011 earthquake?
Here are some plots showing the coulomb stress changes due to the 2011 earthquake.
Basically, this shows which locations on the fault where we might expect higher likelihoods of future earthquake slip.
Lay et al., 2011 b:
Lay et al., 2011 c, note how the segment to the north of the 2011 slip region experiences an increased stress:
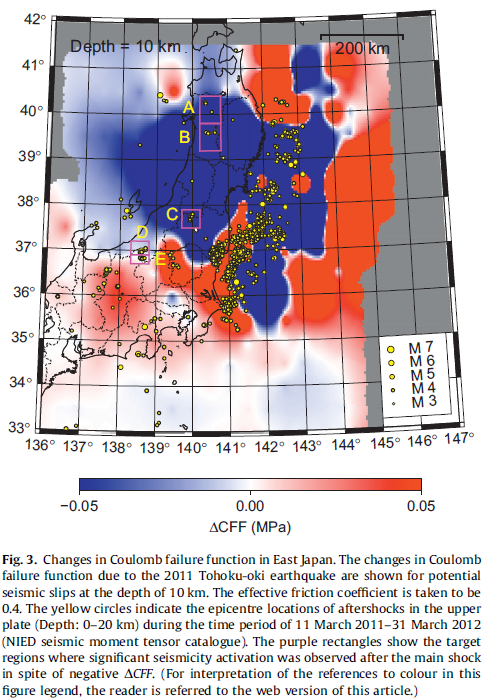
Terakawa et al., 2013, also note how the segment to the north of the 2011 slip region experiences an increased stress:
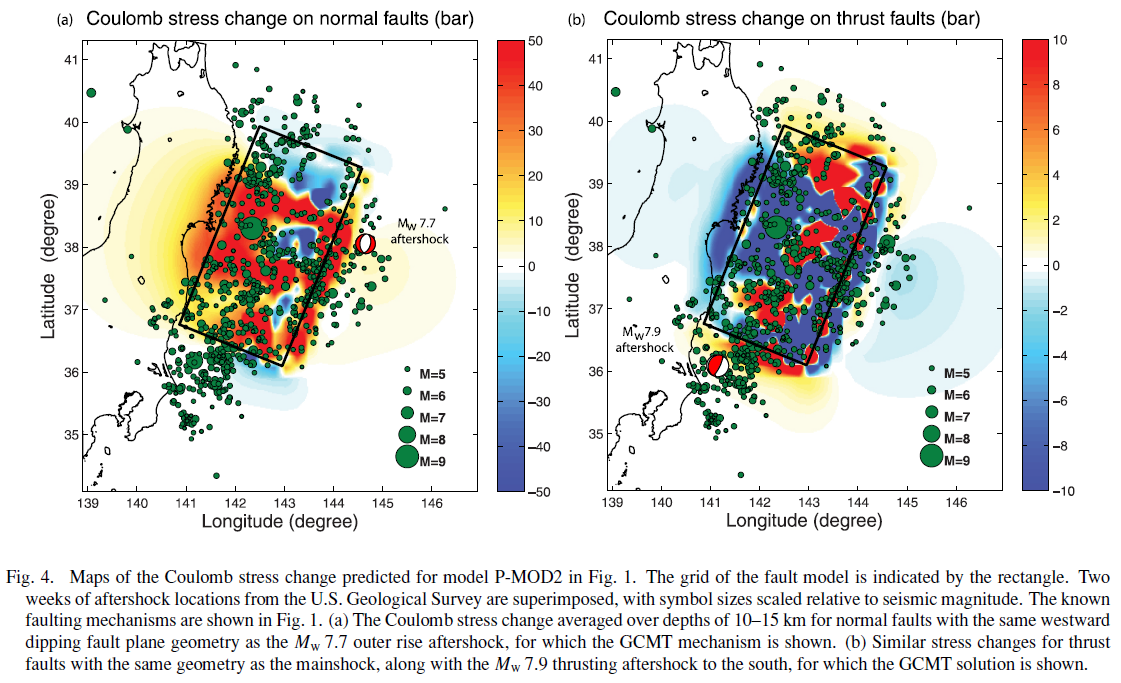
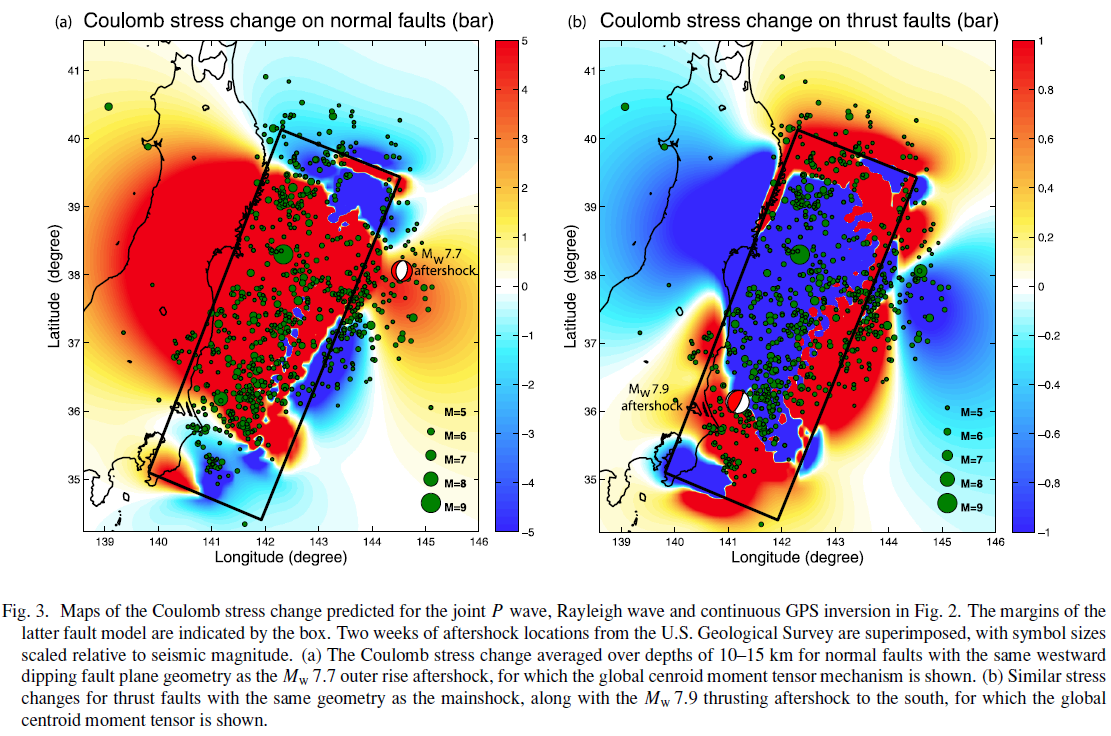
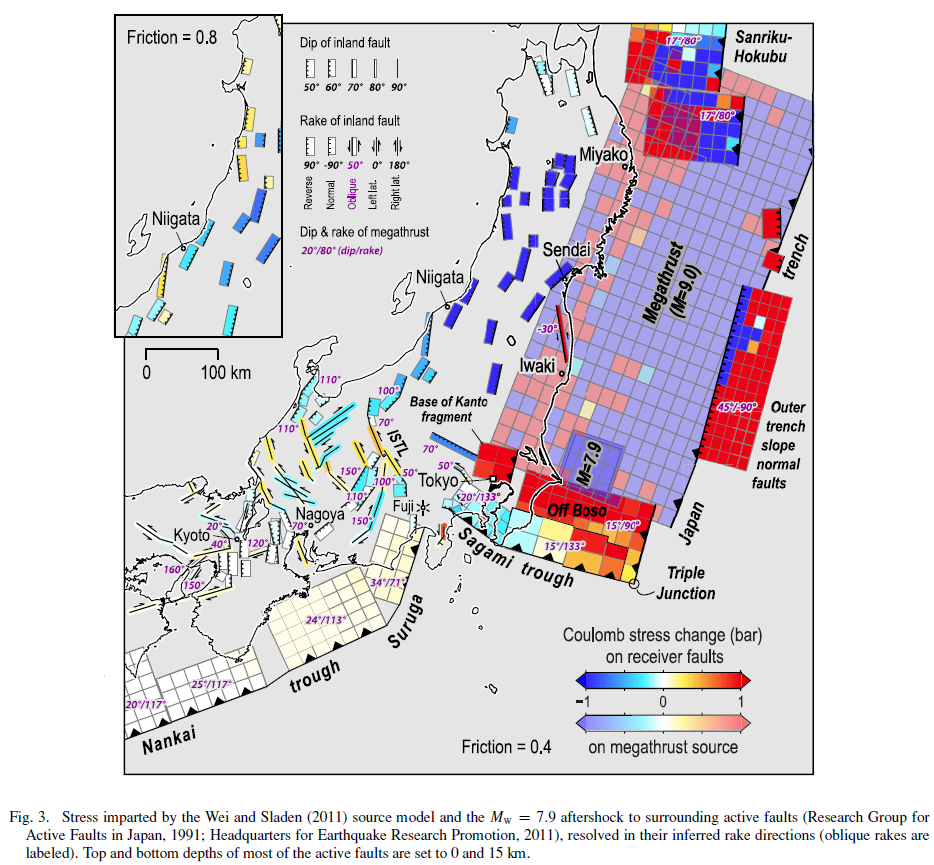
Toda et al., 2011 shows stress changes on certain receiver faults:
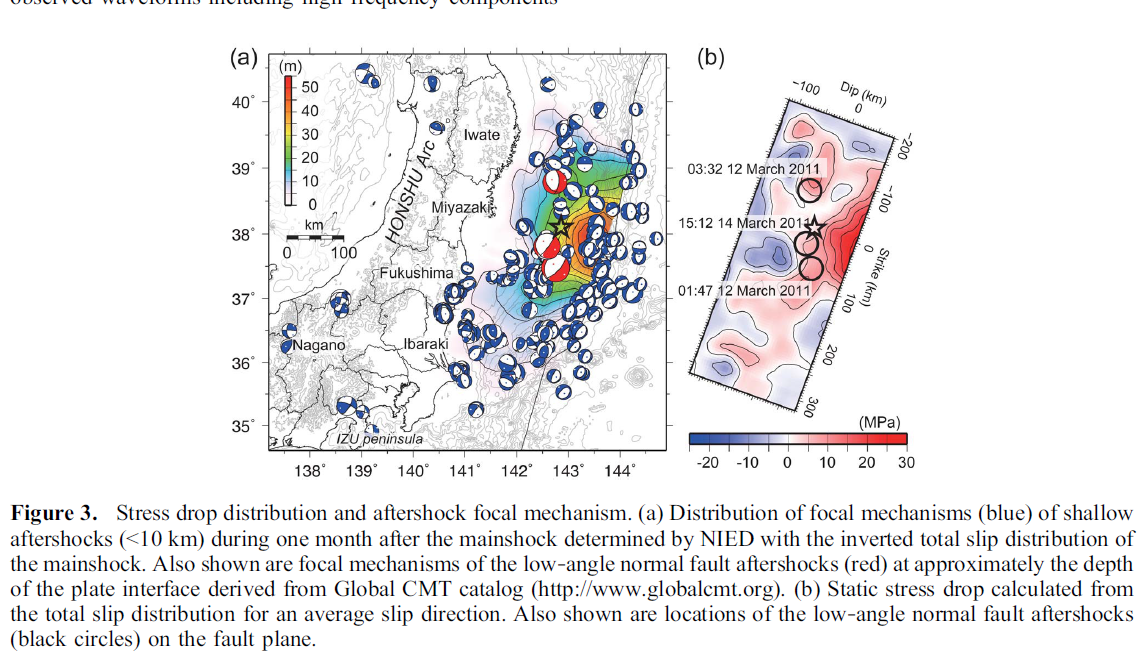
Yagi and Fukahata, 2011 shows the stress drop calculated from their slip distribution.
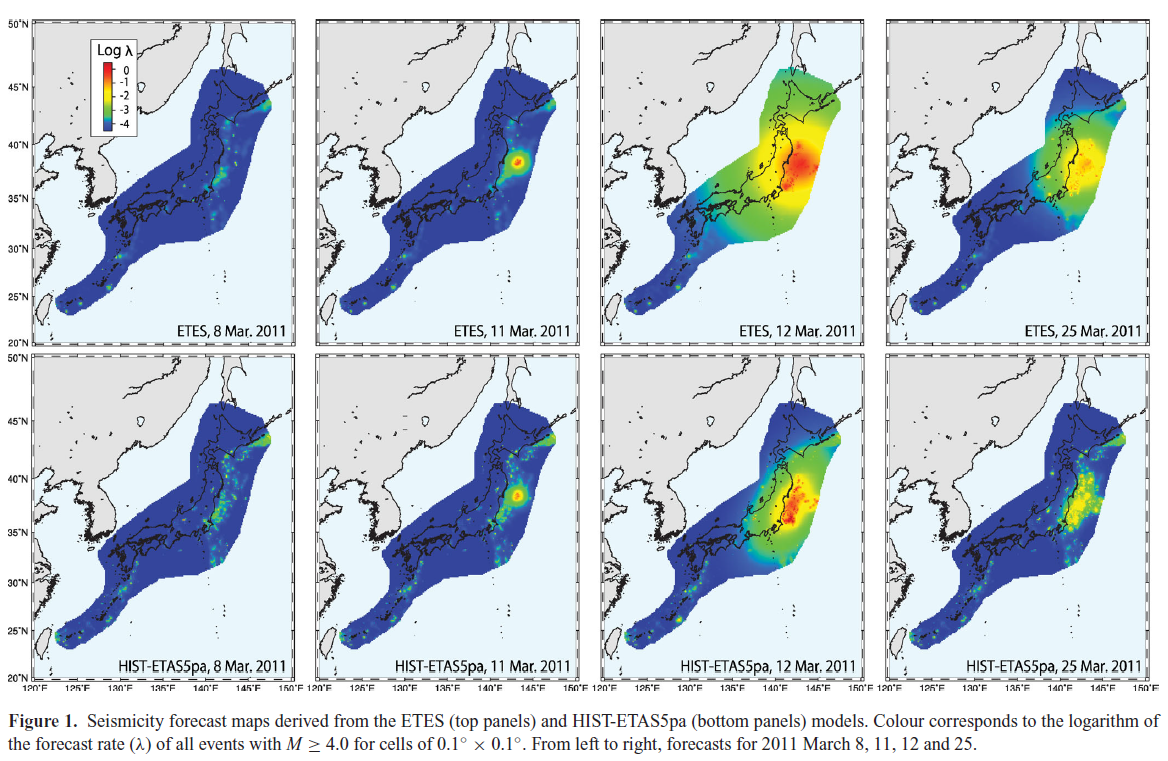
This is a series of seismicity forecast maps from Nanjo et al. (2012; another way of looking at how the stress changed following the 2011 earthquake).
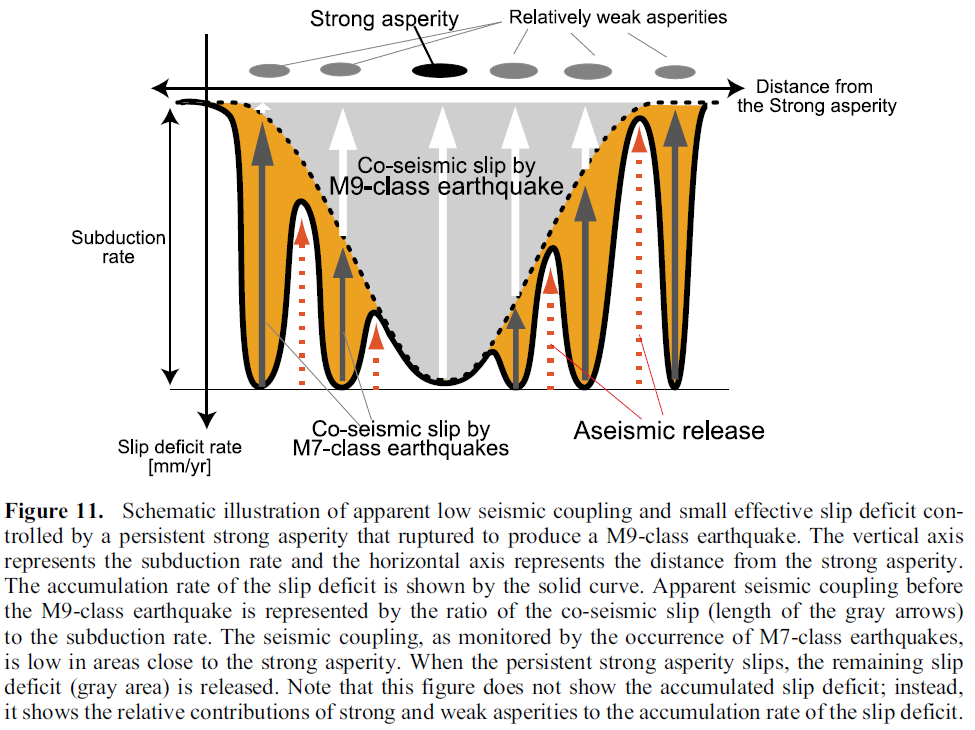
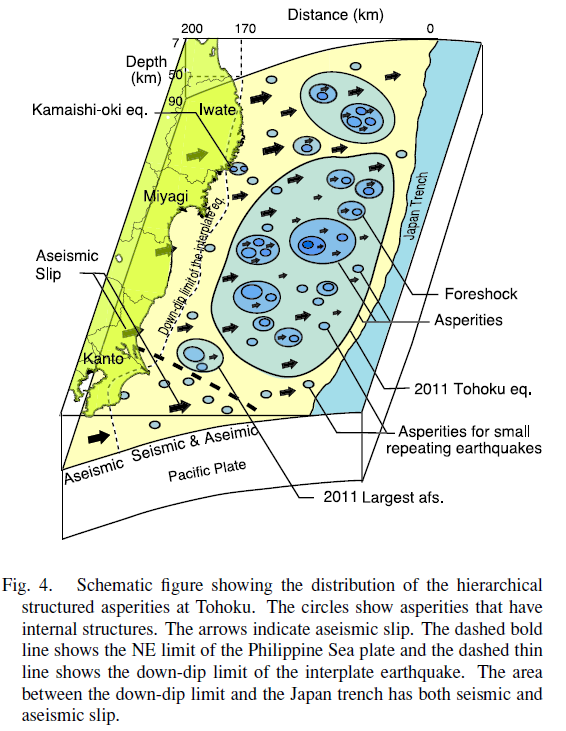
Here is a cool plot showing Uchida et al.’s (2011) view of where the asperities are in this part of the subduction zone. There are two definitions for asperity. (1) the regions of higher slip and (2) the regions of the fault that store strain (like sea mounts?). They are related, but defined differently (most people conflate the two). This figure refers to type 2. How does this most recent swarm fit into this view of subduction zone faults?
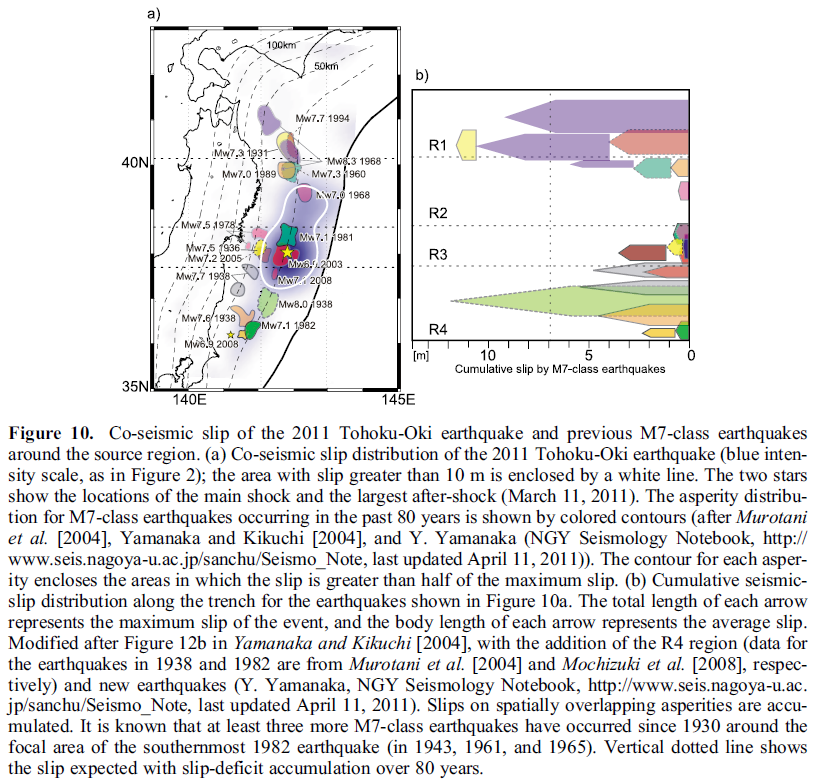
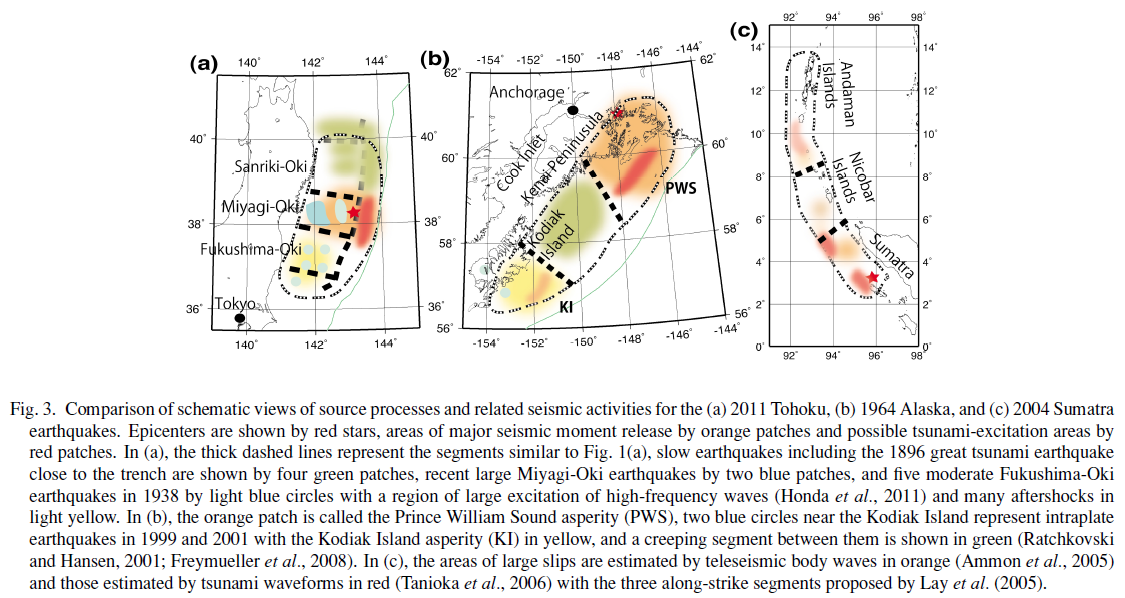
Here is the Yomogida et al. (2011) view of the segmentation of the subduction zone in 2011 Japan, 1964 Alaska, and 2004 Sumatra. Note how this recent swarm is in the northernmost segment (areas of lowest slip in 2011).
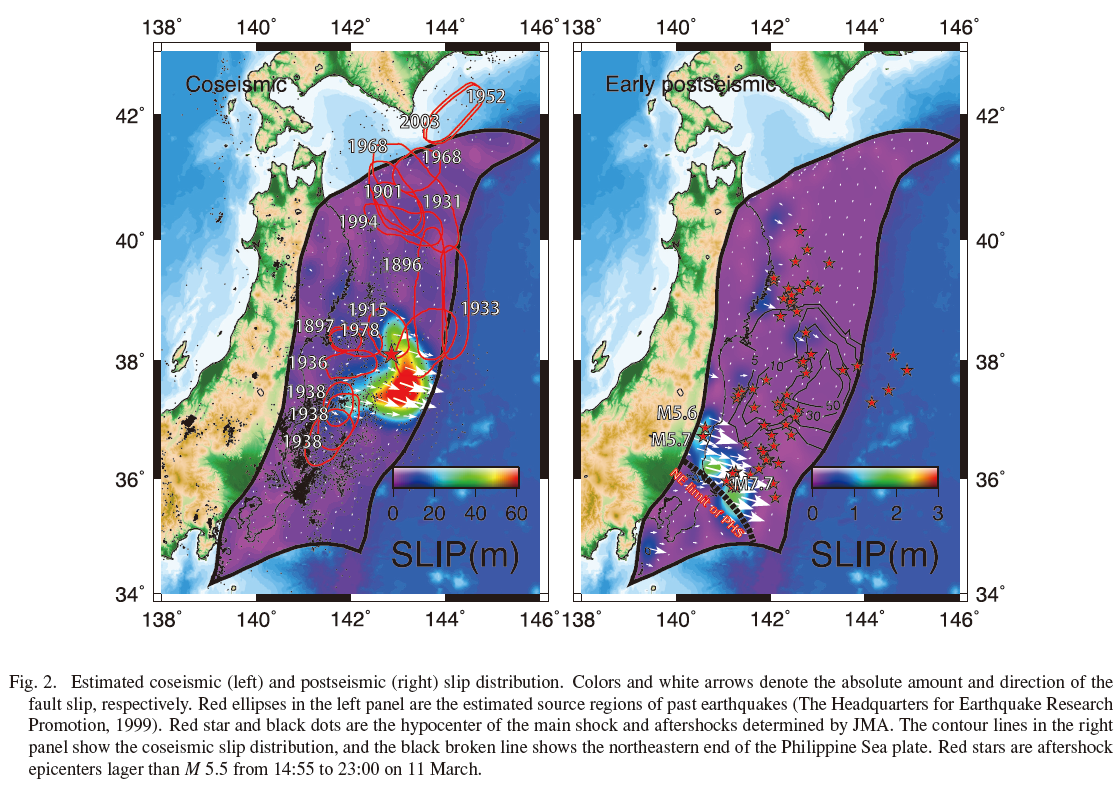
This Orzawa et al. (2011) map is exciting because it shows the slip distribution for several earthquakes in this region… The 2011 in the south and the 2003 in the north (along with the 1994 slip in the center). Where was this most recent swarm?
-
References:
- Ammon et al., 2011. A rupture model of the 2011 off the Pacific coast of the Tohoku Earthquake in Earth Planets Space, v. 63, p. 693-696.
- Fujitsu et al., 2011
- Gusman et al., 2012. Source model of the great 2011 Tohoku earthquake estimated from tsunami waveforms and crustal deformation data in Earth and Planetary Science Letters, v. 341-344, p. 234-242.
- Hirose et al., 2011. Outline of the 2011 off the Pacific coast of Tohoku Earthquake (Mw 9.0) Seismicity: foreshocks, mainshock, aftershocks, and induced activity in Earth Planets Space, v. 63, p. 655-658
- Iinuma et al., 2012. Coseismic slip distribution of the 2011 off the Pacific Coast of Tohoku Earthquake (M9.0) refined by means of seafloor geodetic data in Journal of Geophysical Research, v. 117, DOI: 10.1029/2012JB009186
- Ikuta et al., 2012. A small persistent locked area associated with the 2011 Mw9.0 Tohoku-Oki earthquake, deduced from GPS data in Journal of Geophysical Research, v. 117, DOI: 10.1029/2012JB009335
- Ito et al., 2011. Slip distribution of the 2011 off the Pacific coast of Tohoku Earthquake inferred from geodetic data in Earth Planets Space, v. 63, p. 627-630
- Koper et al., 2011. Frequency-dependent rupture process of the 2011 Mw 9.0 Tohoku Earthquake: Comparison of short-period P wave back projection images and broadband seismic rupture models in Earth Planets Space, v. 63, p. 599-602.
- Kosuga et al, 2011. Seismic activity around the northern neighbor of the 2011 off the Pacific coast of Tohoku Earthquake with emphasis on a potentially large aftershock in the area in Earth Planets Space, v. 63, p. 719-723.
- Lay et al., 2011 a. The 2011 Mw 9.0 off the Pacific coast of Tohoku Earthquake: Comparison of deep-water tsunami signals with finite-fault rupture model predictions in Earth Planets Space, v. 63, p. 797-801.
- Lay et al., 2011 b. Possible large near-trench slip during the 2011 Mw 9.0 off the Pacific coast of Tohoku Earthquake in Earth Planets Space, v. 63, p. 687-692.
- Lay et al., 2011 c. Outer trench-slope faulting and the 2011 Mw 9.0 off the Pacific coast of Tohoku Earthquake in Earth Planets Space, v. 63, p. 713-718.
- Lee et al., 2011. Evidence of large scale repeating slip during the 2011 Tohoku‐Oki earthquake in Geophysical Research Letters, v. 38, DOI: 10.1029/2011GL049580.
- Newman et al., 2011. Hidden depths in Nature, v. 474, p. 441-443.
- Nishimura et al., 2011. The 2011 off the Pacific coast of Tohoku Earthquake and its aftershocks observed by GEONET in Earth Planets Space, v. 63, p. 631-636.
- Orzawa et al., 2011. Coseismic and postseismic slip of the 2011 magnitude-9 Tohoku-Oki earthquake in Nature, v. 000, p. 1-4.
- Satake et al., 2013. Time and Space Distribution of Coseismic Slip of the 2011 Tohoku Earthquake as Inferred from Tsunami Waveform Data in Bulletin of the Seismological Society of America, v. 1032, p. 1473-1492.
- Shao et al., 2011. Focal mechanism and slip history of the 2011 Mw 9.1 off the Pacific coast of Tohoku Earthquake, constrained with teleseismic body and surface waves in Earth Planets Space, v. 63, p. 559-564.
- Simons et al., 2011. The 2011 Magnitude 9.0 Tohoku-Oki Earthquake: Mosaicking the Megathrust from Seconds to Centuries in Science, v. 332, p. 1421-1425.
- Terakawa et al., 2013. Changes in seismic activity following the 2011 Tohoku-oki earthquake: Effects of pore fluid pressure in Earth and Planetary Science Letters, v. 365, p. 17-24.
- Toda et al., 2011. Using the 2011 Mw 9.0 off the Pacific coast of Tohoku Earthquake to test the Coulomb stress triggering hypothesis and to calculate faults brought closer to failure in Earth Planets Space, v. 63, p. 725-730.
- Uchida and Matsuzawa, 2011. Coupling coefficient, hierarchical structure, and earthquake cycle for the source area of the 2011 off the Pacific coast of Tohoku earthquake inferred from small repeating earthquake data in Earth Planets Space, v. 63, p. 675-679.
- Wang et al., 2013. The 2011 Mw 9.0 Tohoku Earthquake: Comparison of GPS and Strong-Motion Data in Bulletin of the Seismological Society of America, v. 103, p. 1336-1347.
- Yagi and Fukahata, 2011. Rupture process of the 2011 Tohoku‐oki earthquake and absolute elastic strain release in Geophysical Research Letters, v. 38, DOI: 10.1029/2011GL048701
- Yamazaki et al., 2011. Modeling near‐field tsunami observations to improve finite‐fault slip models for the 11 March 2011 Tohoku earthquake in Geophysical Research Letter,s v. 38, DOI: 10.1029/2011GL049130
- Yomogida et al., 2011. Along-dip segmentation of the 2011 off the Pacific coast of Tohoku Earthquake and comparison with other megathrust earthquakes in Earth Planets Space, v. 63, p. 697-701.
- Yue and Lay, 2013. Source Rupture Models for the Mw 9.0 2011 Tohoku Earthquake from Joint Inversions of High-Rate Geodetic and Seismic Data in Bulletin of the Seismological Society of America, v. 103, p. 1242-1255.
3 thoughts on “Tohoku-Oki Aftershocks Continue”