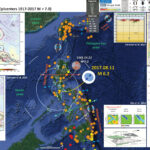
I don’t always have the time to write a proper Earthquake Report. However, I prepare interpretive posters for these events.
Because of this, I present Earthquake Report Lite. (but it is more than just water, like the adult beverage that claims otherwise). I will try to describe the figures included in the poster, but sometimes I will simply post the poster here.
There was a magnitude M 6.9 earthquake in Taiwan on 18 September 2022.
https://earthquake.usgs.gov/earthquakes/eventpage/us7000i90q/executive
Taiwan is an interesting place, from a tectonic perspective. There is an intersection of several plate boundary fault systems here. Along the western boundary of Taiwan the Eurasia plate subducts (dives beneath) the Philippine Sea plate forming the Manila trench. This megathrust subduction zone fault system terminates somewhere in central-northern Taiwan.
Intersecting central Taiwan from the east is another subduction zone where the Philippine Sea plate subducts beneath the Eurasia plate, forming the Ryukyu trench.
There was an earthquake in Taiwan in 1999 that has been commemorated by creating a park and museum that preserves some of the evidence of the earthquake. This Chi-Chi earthquake cause lots of damage and, sadly, lots of suffering. In addition, because of the dominance of the computer chip manufacturing industry in Taiwan at the time, the price of computer chips was greatly inflated. The global economy suffered following this earthquake.
This 18 September 2022 M 6.9 earthquake occurred on a crustal fault that strikes (trends) parallel to the coast. Because of the mapped faults, I interpret this to have been a left-lateral strike slip earthquake.
There was a foreshock, a mag M 6.5 earthquake, nearby, the day before.
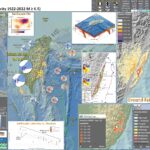
Below is my interpretive poster for this earthquake
- I plot the seismicity from the past month, with diameter representing magnitude (see legend). I include earthquake epicenters from 1921-2021 with magnitudes M ≥ 3.0 in one version.
- I plot the USGS fault plane solutions (moment tensors in blue and focal mechanisms in orange), possibly in addition to some relevant historic earthquakes.
- A review of the basic base map variations and data that I use for the interpretive posters can be found on the Earthquake Reports page. I have improved these posters over time and some of this background information applies to the older posters.
- Some basic fundamentals of earthquake geology and plate tectonics can be found on the Earthquake Plate Tectonic Fundamentals page.
- In the upper left corner is a map that shows the plates, their boundaries, and a century of seismicity.
- In the upper right are two maps that show models of how there may have been landslides or liquefaction because of the earthquake shaking and impacts. Read more about landslides and liquefaction here. I include both the USGS epicenter and the Central Weather Bureau Seismological Center epicenter (which is probably more accurate). However, these ground failure models are based on the USGS epicenter/location.
- To the left of those two maps is a low angle oblique view of the tectonic plates and how they are oriented relative to each other.
- Below that figure, in the center, is a map from Chen at al. (2020) that shows the earthquake fault mapping along eastern Taiwan. I place a yellow star in the location of the M 6.9 epicenter (the location of the earthquake on the ground surface).
- In the lower right corner is a map that shows the ground shaking from the earthquake, with color representing intensity using the Modified Mercalli Intensity (MMI) scale. The closer to the earthquake, the stronger the ground shaking. The colors on the map represent the USGS model of ground shaking. The colored circles represent reports from people who posted information on the USGS Did You Feel It? part of the website for this earthquake. There are things that affect the strength of ground shaking other than distance, which is why the reported intensities are different from the modeled intensities.
- To the left of the intensity map is a map that shows seismicity from the Central Weather Bureau Seismological Center. The locations of earthquakes from this center are better than those from the USGS since this organization runs a local seismic network (the USGS runs a global network). The local network uses more seismometers than the global network (so can detect more events, in this region).
- To the left of this seismicity map is a plot that shows how the shaking intensity models and reports relate to each other. The horizontal axis is distance from the earthquake and the vertical axis is shaking intensity (using the MMI scale, just like in the map to the right: these are the same datasets).
- In the upper left-center is a figure that shows the USGS earthquake slip model. This shows how much the fault slipped in different areas (based on their modeling, not observation). The model shows that there were places that may have slipped over 1.5 meters (5 feet).
I include some inset figures.
- I could not help myself. I am so excited to have this website back up and running, like a fully operational space station, that I include below some additional figures that help us understand the tectonic setting.
- Here is the low angle oblique view of the plate configuration in Taiwan.
- Here is the map from Chen at al. (2020) that shows the fault mapping in this area of eastern Taiwan.
- Here is an oblique view of the plate configuration in this region. This is from Chang (2001).
- Here is a great interpretation showing how the Island of Taiwan is being uplifted and exhumed. This is from Lin (2002).
- Needless to say, this is an excellent map showing the complicated faulting of this region. This is from Theunissen et al. (2012).
- Here is another tectonic interpretation map from here.
- Here is a great general overview of the tectonics of the region from Shyu et al. (2005). I include their figure caption below the image as a blockquote.
- This figure from Shyu et al. (2005) shows their interpretation of the different tectonic domains in Taiwan. This is a complicated region that includes collision zones in different orientations as the Okinawa Trough, Ryukyu Trench, and Manila Trench (all subduction zones) each intersect beneath and adjacent to Taiwan. I include their figure caption below the image as a blockquote.
- This map from Shyu et al. (2005) shows the earthquake slip regions for proposed earthquake scenarios. I include their figure caption below the image as a blockquote.
- This map from here shows the basement geology of Taiwan. Note the accretionary belts, including the forearc basin. This is a compilation from Teng et al. (2001) and Hsiao et al. (1998) as presented in Ustaszewski et al. (2012).
Supportive Figures
Geologic map of the Coastal Range on shaded relief (after Wang and Chen, 1993). The Longitudinal Valley Fault (LVF) can be subdivided into the Linding and Juisui locked Fault and the Chihshang and Lichi creeping Fault. Vertical cross-sections of VS perturbation tomography along the AeA0 and BeB0 profiles denote the Central Range, the Coastal Range, and the LVF. EU: Eurasian Plate; PH: Philippine Sea Plate.
A neotectonic snapshot of Taiwan and adjacent regions. (a) Taiwan is currently experiencing a double suturing. In the south the Luzon volcanic arc is colliding with the Hengchun forearc ridge, which is, in turn, colliding with the Eurasian continental margin. In the north both sutures are unstitching. Their disengagement is forming both the Okinawa Trough and the forearc basins of the Ryukyu arc. Thus, in the course of passing through the island, the roles of the volcanic arc and forearc ridge flip along with the flipping of the polarity of subduction. The three gray strips represent the three lithospheric pieces of Taiwan’s tandem suturing and disarticulation: the Eurasian continental margin, the continental sliver, and the Luzon arc. Black arrows indicate the suturing and disarticulation. This concept is discussed in detail by Shyu et al. [2005]. Current velocity vector of the Philippine Sea plate relative to the Eurasian plate is adapted from Yu et al. [1997, 1999]. Current velocity vector of the Ryukyu arc is adapted from Lallemand and Liu [1998]. Black dashed lines are the northern and western limits of the Wadati-Benioff zone of the two subducting systems, taken from the seismicity database of the Central Weather Bureau, Taiwan. DF, deformation front; LCS, Lishan-Chaochou suture; LVS, Longitudinal Valley suture; WF, Western Foothills; CeR, Central Range; CoR, Coastal Range; HP, Hengchun Peninsula. (b) Major tectonic elements around Taiwan. Active structures identified in this study are shown in red. Major inactive faults that form the boundaries of tectonic elements are shown in black: 1, Chiuchih fault; 2, Lishan fault; 3, Laonung fault; 4, Chukou fault. Selected GPS vectors relative to the stable Eurasian continental shelf are adapted from Yu et al. [1997]. A,Western Foothills; B, Hsueshan Range; C, Central Range and Hengchun Peninsula; D, Coastal Range; E, westernmost Ryukyu arc; F, Yaeyama forearc ridge; G, northernmost Luzon arc; H, western Taiwan coastal plains; I, Lanyang Plain; J, Pingtung Plain; K, Longitudinal Valley; L, submarine Hengchun Ridge; M, Ryukyu forearc basins.
Map of major active faults and folds of Taiwan (in red) showing that the two sutures are producing separate western and eastern neotectonic belts. Each collision belt matures and then decays progressively from south to north. This occurs in discrete steps, manifested as seven distinct neotectonic domains along the western belt and four along the eastern. A distinctive assemblage of active structures defines each domain. For example, two principal structures dominate the Taichung Domain. Rupture in 1999 of one of these, the Chelungpu fault, caused the disastrous Chi-Chi earthquake. The Lishan fault (dashed black line) is the suture between forearc ridge and continental margin. Thick light green and pink lines are boundaries of domains.
Proposed major sources for future large earthquakes in and around Taiwan. Thick red lines are proposed future ruptures, and the white patches are rupture planes projected to the surface. Here we have selected only a few representative scenarios from Table 1. Earthquake magnitude of each scenario is predicted value from our calculation.
Social Media:
#EarthquakeReport for M 6.9 #Earthquake in Taiwan on 18 September 2022
there was lots of damage and some casualties :-(
landslides and liquefaction models show that there was a high likelihood for these.https://t.co/3tzXgvQl26
damage informationhttps://t.co/I95RUCSWkh pic.twitter.com/TPKL95vqHI
— Jason "Jay" R. Patton (@patton_cascadia) November 9, 2022
- 2022.09.18 M 6.9 Taiwan
- 2021.05.21 M 7.3 China
- 2018.01.11 M 6.0 Burma
- 2017.08.08 M 6.3 China (different)
- 2017.08.08 M 6.5 China
- 2016.08.24 M 6.8 Burma
- 2016.04.13 M 6.9 Burma
- 2016.02.23 M 5.9 Antarctic plate
- 2016.02.05 M 6.4 Taiwan
- 2016.02.05 M 6.4 Taiwan Update #1
- 2015.12.04 M 7.1 SE India Ridge
- 2015.04.24 M 7.8 Nepal
- 2015.04.25 M 7.8 Nepal Update #1
- 2015.04.25 M 7.8 Nepal Update #2
- 2015.04.26 M 7.8 Nepal Update #3
- 2015.04.26 M 7.8 Nepal Update #4
- 2015.04.27 M 7.8 Nepal Update #5
- 2015.04.27 M 7.8 Nepal Update #6
India | Asia | India Ocean
Earthquake Reports
- Frisch, W., Meschede, M., Blakey, R., 2011. Plate Tectonics, Springer-Verlag, London, 213 pp.
- Hayes, G., 2018, Slab2 – A Comprehensive Subduction Zone Geometry Model: U.S. Geological Survey data release, https://doi.org/10.5066/F7PV6JNV.
- Holt, W. E., C. Kreemer, A. J. Haines, L. Estey, C. Meertens, G. Blewitt, and D. Lavallee (2005), Project helps constrain continental dynamics and seismic hazards, Eos Trans. AGU, 86(41), 383–387, , https://doi.org/10.1029/2005EO410002. /li>
- Jessee, M.A.N., Hamburger, M. W., Allstadt, K., Wald, D. J., Robeson, S. M., Tanyas, H., et al. (2018). A global empirical model for near-real-time assessment of seismically induced landslides. Journal of Geophysical Research: Earth Surface, 123, 1835–1859. https://doi.org/10.1029/2017JF004494
- Kreemer, C., J. Haines, W. Holt, G. Blewitt, and D. Lavallee (2000), On the determination of a global strain rate model, Geophys. J. Int., 52(10), 765–770.
- Kreemer, C., W. E. Holt, and A. J. Haines (2003), An integrated global model of present-day plate motions and plate boundary deformation, Geophys. J. Int., 154(1), 8–34, , https://doi.org/10.1046/j.1365-246X.2003.01917.x.
- Kreemer, C., G. Blewitt, E.C. Klein, 2014. A geodetic plate motion and Global Strain Rate Model in Geochemistry, Geophysics, Geosystems, v. 15, p. 3849-3889, https://doi.org/10.1002/2014GC005407.
- Meyer, B., Saltus, R., Chulliat, a., 2017. EMAG2: Earth Magnetic Anomaly Grid (2-arc-minute resolution) Version 3. National Centers for Environmental Information, NOAA. Model. https://doi.org/10.7289/V5H70CVX
- Müller, R.D., Sdrolias, M., Gaina, C. and Roest, W.R., 2008, Age spreading rates and spreading asymmetry of the world’s ocean crust in Geochemistry, Geophysics, Geosystems, 9, Q04006, https://doi.org/10.1029/2007GC001743
- Pagani,M. , J. Garcia-Pelaez, R. Gee, K. Johnson, V. Poggi, R. Styron, G. Weatherill, M. Simionato, D. Viganò, L. Danciu, D. Monelli (2018). Global Earthquake Model (GEM) Seismic Hazard Map (version 2018.1 – December 2018), DOI: 10.13117/GEM-GLOBAL-SEISMIC-HAZARD-MAP-2018.1
- Silva, V ., D Amo-Oduro, A Calderon, J Dabbeek, V Despotaki, L Martins, A Rao, M Simionato, D Viganò, C Yepes, A Acevedo, N Horspool, H Crowley, K Jaiswal, M Journeay, M Pittore, 2018. Global Earthquake Model (GEM) Seismic Risk Map (version 2018.1). https://doi.org/10.13117/GEM-GLOBAL-SEISMIC-RISK-MAP-2018.1
- Zhu, J., Baise, L. G., Thompson, E. M., 2017, An Updated Geospatial Liquefaction Model for Global Application, Bulletin of the Seismological Society of America, 107, p 1365-1385, https://doi.org/0.1785/0120160198
- Chen, W-S., Yang, C.Y., Chen, S-T., and Huang, Y-C., 2020. New insights into Holocene marine terrace development caused by seismic and aseismic faulting in the Coastal Range, eastern Taiwan in Quaternary Science Reviews, vol. 240, https://doi.org/10.1016/j.quascirev.2020.106369
- Shyu, J. B. H., K. Sieh, Y.-G. Chen, and C.-S. Liu, 2005. Neotectonic architecture of Taiwan and its implications for future large earthquakes in J. Geophys. Res., 110, B08402, doi:10.1029/2004JB003251.
- Smoczyk, G.M., Hayes, G.P., Hamburger, M.W., Benz, H.M., Villaseñor, Antonio, and Furlong, K.P., 2013. Seismicity of the Earth 1900–2012 Philippine Sea Plate and vicinity: U.S. Geological Survey Open-File Report 2010–1083-M, scale 1:10,000,000, http://dx.doi.org/10.3133/ofr20101083m.
- Ustaszewski, K., Wu, Y-M., Suppe, J., Huang, H-H., Chang, C-H., and Carena, S., 2012. Crust–mantle boundaries in the Taiwan–Luzon arc-continent collision system determined from local earthquake tomography and 1D models: Implications for the mode of subduction polarity reversal in Tectonophysics, v. 578, p. 31-49.
References:
Basic & General References
Specific References
Return to the Earthquake Reports page.
- Sorted by Magnitude
- Sorted by Year
- Sorted by Day of the Year
- Sorted By Region
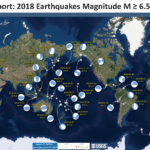
Here I summarize Earth’s significant seismicity for 2018. I limit this summary to earthquakes with magnitude greater than or equal to M 6.5. I am sure that there is a possibility that your favorite earthquake is not included in this review. Happy New Year. One year of #earthquakes recorded by @INGVterremoti in Italy. About 2500 events with magnitude equal or larger than M2, about seven per day. Data source https://t.co/g1RvR2A989) #Italia #terremoto #Italy #earthquake pic.twitter.com/ft8GAsFjKA — iunio iervolino (@iuniervo) December 31, 2018 Earthquakes of 2018: a quick post summarising global seismic activity last year (i.e., the figures I showed you yesterday). https://t.co/ahdwpf1OFv pic.twitter.com/S438okD8QQ — Chris Rowan (@Allochthonous) January 1, 2019 Global #earthquakes by Magnitude (M5+) by year (2000-18), showing remarkable consistency from geologic forcing. Whereas patterns are understood, they do not permit short-term, local predictions; instead, be informed and be prepared. #geohazards @IRIS_EPO @USGS pic.twitter.com/BmtXhhUvWF — Ben van der Pluijm 🌎 (@vdpluijm) January 2, 2019 The pattern of shallow earthquakes (depth < 33 km) is typical, with much of the country susceptible to regular shallow seismicity, with lower rates in Northland/Auckland and southeast Otago. pic.twitter.com/3jip8Lyje9 — John Ristau 🇨🇦 🇳🇿 (@SinistralSeismo) January 3, 2019
Just a couple hours ago there was an earthquake along the Swan fault, which is the transform plate boundary between the North America and Caribbean plates. The Cayman trough (CT) is a region of oceanic crust, formed at the Mid-Cayman Rise (MCR) oceanic spreading center. To the west of the MCR the CT is bound by the left-lateral strike-slip Swan fault. To the east of the MCR, the CT is bound on the north by the Oriente fault. We had a damaging and (sadly) deadly earthquake in southern Peru in the last 24 hours. This is an earthquake, with magnitude M 7.1, that is associated with the subduction zone forming the Peru-Chile trench (PCT). The Nazca plate (NP) is subducting beneath the South America plate (SAP). There are lots of geologic structures on the Nazca plate that tend to affect how the subduction zone responds during earthquakes (e.g. segmentation). This earthquake appears to be located along a reactivated fracture zone in the GA. There have only been a couple earthquakes in this region in the past century, one an M 6.0 to the east (though this M 6.0 was a thrust earthquake). The Gulf of Alaska shear zone is even further to the east and has a more active historic fault history (a pair of earthquakes in 1987-1988). The magnetic anomalies (formed when the Earth’s magnetic polarity flips) reflect a ~north-south oriented spreading ridge (the anomalies are oriented north-south in the region of today’s earthquake). There is a right-lateral offset of these magnetic anomalies located near the M 7.9 epicenter. Interesting that this right-lateral strike-slip fault (?) is also located at the intersection of the Gulf of Alaska shear zone and the 1988 M 7.8 earthquake (probably just a coincidence?). However, the 1988 M 7.8 earthquake fault plane solution can be interpreted for both fault planes (it is probably on the GA shear zone, but I don’t think that we can really tell). As a reminder, if the M 7.9 earthquake fault is E-W oriented, it would be left-lateral. The offset magnetic anomalies show right-lateral offset across these fracture zones. This was perhaps the main reason why I thought that the main fault was not E-W, but N-S. After a day’s worth of aftershocks, the seismicity may reveal some north-south trends. But, as a drama student in 7th grade (1977), my drama teacher (Ms. Naichbor, rest in peace) asked our class to go stand up on stage. We all stood in a line and she mentioned that this is social behavior, that people tend to stand in lines (and to avoid doing this while on stage). Later, when in college, professors often commented about how people tend to seek linear trends in data (lines). I actually see 3-4 N-S trends and ~2 E-W trends in the seismicity data. There was just now an earthquake in Oaxaca, Mexico between the other large earthquakes from last 2017.09.08 (M 8.1) and 2017.09.08 (M 7.1). There has already been a M 5.8 aftershock.Here is the USGS website for today’s M 7.2 earthquake. This morning (local time in California) there was an earthquake in Papua New Guinea with, unfortunately, a high likelihood of having a good number of casualties. I was working on a project, so could not immediately begin work on this report. We had an M 6.8 earthquake near a transform micro-plate boundary fault system north of New Ireland, Papua New Guinea today. Here is the USGS website for this earthquake. The New Britain region is one of the more active regions in the world. See a list of earthquake reports for this region at the bottom of this page, above the reference list. Well, those earthquakes from earlier, one a foreshock to a later one, were foreshocks to an earthquake today! Here is my report from a couple days ago. The M 6.6 and M 6.3 straddle today’s earthquake and all have similar hypocentral depths. A couple days ago there was a deep focus earthquake in the downgoing Nazca plate deep beneath Bolivia. This earthquake has an hypocentral depth of 562 km (~350 miles). There has been a swarm of earthquakes on the southeastern part of the big island, with USGS volcanologists hypothesizing about magma movement and suggesting that an eruption may be imminent. Here is a great place to find official USGS updates on the volcanism in Hawaii (including maps). This version includes earthquakes M ≥ 3.5 (note the seismicity offshore to the south, this is where the youngest Hawaii volcano is). Below are a series of plots from tide gages installed at several sites in the Hawaii Island Chain. These data are all posted online here and here. Yesterday morning, as I was recovering from working on stage crew for the 34th Reggae on the River (fundraiser for the non profit, the Mateel Community Center), I noticed on social media that there was an M 6.9 earthquake in Lombok, Indonesia. This is sad because of the likelihood for casualties and economic damage in this region. Well, yesterday while I was installing the final window in a reconstruction project, there was an earthquake along the Aleutian Island Arc (a subduction zone) in the region of the Andreanof Islands. Here is the USGS website for the M 6.6 earthquake. This earthquake is close to the depth of the megathrust fault, but maybe not close enough. So, this may be on the subduction zone, but may also be on an upper plate fault (I interpret this due to the compressive earthquake fault mechanism). The earthquake has a hypocentral depth of 20 km and the slab model (see Hayes et al., 2013 below and in the poster) is at 40 km at this location. There is uncertainty in both the slab model and the hypocentral depth. We just had a Great Earthquake in the region of the Fiji Islands, in the central-western Pacific. Great Earthquakes are earthquakes with magnitudes M ≥ 8.0. This ongoing sequence began in late July with a Mw 6.4 earthquake. Followed less than 2 weeks later with a Mw 6.9 earthquake. We just had a M 7.3 earthquake in northern Venezuela. Sadly, this large earthquake has the potential to be quite damaging to people and their belongings (buildings, infrastructure). Well, this earthquake, while having a large magnitude, was quite deep. Because earthquake intensity decreases with distance from the earthquake source, the shaking intensity from this earthquake was so low that nobody submitted a single report to the USGS “Did You Feel It?” website for this earthquake. Following the largest typhoon to strike Japan in a very long time, there was an earthquake on the island of Hokkaido, Japan today. There is lots on social media, including some spectacular views of disastrous and deadly landslides triggered by this earthquake (earthquakes are the number 1 source for triggering of landslides). These landslides may have been precipitated (sorry for the pun) by the saturation of hillslopes from the typhoon. Based upon the USGS PAGER estimate, this earthquake has the potential to cause significant economic damages, but hopefully a small number of casualties. As far as I know, this does not incorporate potential losses from earthquake triggered landslides [yet]. Today, there was a large earthquake associated with the subduction zone that forms the Kermadec Trench. Well, around 3 AM my time (northeastern Pacific, northern CA) there was a sequence of earthquakes including a mainshock with a magnitude M = 7.5. This earthquake happened in a highly populated region of Indonesia. Here is a map that shows the updated USGS model of ground shaking. The USGS prepared an updated earthquake fault slip model that was additionally informed by post-earthquake analysis of ground deformation. The original fault model extended from north of the epicenter to the northernmost extent of Palu City. Soon after the earthquake, Dr. Sotiris Valkaniotis prepared a map that showed large horizontal offsets across the ruptured fault along the entire length of the western margin on Palu Valley. This horizontal offset had an estimated ~8 meters of relative displacement. InSAR analyses confirmed that the coseismic ground deformation extended through Palu Valley and into the mountains to the south of the valley. Synthetic Aperture Radar (SAR) is a remote sensing method that uses Radar to make observations of Earth. These observations include the position of the ground surface, along with other information about the material properties of the Earth’s surface. Landslides during and following the M=7.5 earthquake in central Sulawesi, Indonesia possibly caused the majority of casualties from this catastrophic natural disaster. Volunteers (citizen scientists) have used satellite aerial imagery collected after the earthquake to document the spatial extent and magnitude of damage caused by the earthquake, landslides, and tsunami.
Nowicki Jessee and others (2018) is the preferred model for earthquake-triggered landslide hazard. Our primary landslide model is the empirical model of Nowicki Jessee and others (2018). The model was developed by relating 23 inventories of landslides triggered by past earthquakes with different combinations of predictor variables using logistic regression. The output resolution is ~250 m. The model inputs are described below. More details about the model can be found in the original publication. We modify the published model by excluding areas with slopes <5° and changing the coefficient for the lithology layer "unconsolidated sediments" from -3.22 to -1.36, the coefficient for "mixed sedimentary rocks" to better reflect that this unit is expected to be weak (more negative coefficient indicates stronger rock).To exclude areas of insignificantly small probabilities in the computation of aggregate statistics for this model, we use a probability threshold of 0.002.
Zhu and others (2017) is the preferred model for liquefaction hazard. The model was developed by relating 27 inventories of liquefaction triggered by past earthquakes to globally-available geospatial proxies (summarized below) using logistic regression. We have implemented the global version of the model and have added additional modifications proposed by Baise and Rashidian (2017), including a peak ground acceleration (PGA) threshold of 0.1 g and linear interpolation of the input layers. We also exclude areas with slopes >5°. We linearly interpolate the original input layers of ~1 km resolution to 500 m resolution. The model inputs are described below. More details about the model can be found in the original publication.
In this region of the world, the Solomon Sea plate and the South Bismarck plate converge to form a subduction zone, where the Solomon Sea plate is the oceanic crust diving beneath the S.Bismarck plate. This region of the Pacific-North America plate boundary is at the northern end of the Cascadia subduction zone (CSZ). To the east, the Explorer and Juan de Fuca plates subduct beneath the North America plate to form the megathrust subduction zone fault capable of producing earthquakes in the magnitude M = 9 range. The last CSZ earthquake was in January of 1700, just almost 319 years ago. Before I looked more closely, I thought this sequence might be related to the Kefallonia fault. I prepared some earthquake reports for earthquakes here in the past, in 2015 and in 2016. There was a M = 6.8 earthquake along a transform fault connecting segments of the Mid Atlantic Ridge recently. Today’s earthquake occurred along the convergent plate boundary in southern Alaska. This subduction zone fault is famous for the 1964 March 27 M = 9.2 megathrust earthquake. I describe this earthquake in more detail here. There was a sequence of earthquakes along the subduction zone near New Caledonia and the Loyalty Islands. A large earthquake in the region of the Bering Kresla fracture zone, a strike-slip fault system that coincides with the westernmost portion of the Aleutian trench (which is a subduction zone further to the east). This magnitude M = 7.0 earthquake is related to the subduction zone that forms the Philippine trench (where the Philippine Sea plate subducts beneath the Sunda plate). Here is the USGS website for this earthquake.
The two beach balls show the stike-slip fault motions for the M6.4 (left) and M6.0 (right) earthquakes. Helena Buurman's primer on reading those symbols is here. pic.twitter.com/aWrrb8I9tj — AK Earthquake Center (@AKearthquake) August 15, 2018
Strike Slip: A cutaway view along the Hawaiian island chain showing the inferred mantle plume that has fed the Hawaiian hot spot on the overriding Pacific Plate. The geologic ages of the oldest volcano on each island (Ma = millions of years ago) are progressively older to the northwest, consistent with the hot spot model for the origin of the Hawaiian Ridge-Emperor Seamount Chain. (Modified from image of Joel E. Robinson, USGS, in “This Dynamic Planet” map of Simkin and others, 2006.)
Hawaiian-Emperor Chain. White dots are the locations of radiometrically dated seamounts, atolls and islands, based on compilations of Doubrovine et al. and O’Connor et al. Features encircled with larger white circles are discussed in the text and Fig. 2. Marine gravity anomaly map is from Sandwell and Smith.
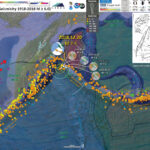
We just had a large earthquake in the region of the Bering Kresla fracture zone, a strike-slip fault system that coincides with the westernmost portion of the Aleutian trench (which is a subduction zone further to the east). I plot the seismicity from the past month, with color representing depth and diameter representing magnitude (see legend). I include earthquake epicenters from 1918-2018 with magnitudes M ≥ 6.0 in one version.
Tectonic setting of the Sredinny and Ganal Massifs in Kamchatka. Kamchatka/Aleutian junction is modified after Gaedicke et al. (2000). Onland geology is after Bogdanov and Khain (2000). 1, Active volcanoes (a) and Holocene monogenic vents (b). 2, Trench (a) and pull-apart basin in the Aleutian transform zone (b). 3, Thrust (a) and normal (b) faults. 4, Strike-slip faults. 5–6, Sredinny Massif. 5, Amphibolite-grade felsic paragneisses of the Kolpakovskaya series. 6, Allochthonous metasedimentary and metavolcanic rocks of the Malkinskaya series. 7, The Kvakhona arc. 8, Amphibolites and gabbro (solid circle) of the Ganal Massif. Lower inset shows the global position of Kamchatka. Upper inset shows main Cretaceous-Eocene tectonic units (Bogdanov and Khain 2000): Western Kamchatka (WK) composite unit including the Sredinny Massif, the Kvakhona arc, and the thick pile of Upper Cretaceous marine clastic rocks; Eastern Kamchatka (EK) arc, and Eastern Peninsulas terranes (EPT). Eastern Kamchatka is also known as the Olyutorka-Kamchatka arc (Nokleberg et al. 1998) or the Achaivayam-Valaginskaya arc (Konstantinovskaya 2000), while Eastern Peninsulas terranes are also called Kronotskaya arc (Levashova et al. 2000).
Kamchatka subduction zone. A: Major geologic structures at the Kamchatka–Aleutian Arc junction. Thin dashed lines show isodepths to subducting Pacific plate (Gorbatov et al., 1997). Inset illustrates major volcanic zones in Kamchatka: EVB—Eastern Volcanic Belt; CKD—Central
The two beach balls show the stike-slip fault motions for the M6.4 (left) and M6.0 (right) earthquakes. Helena Buurman's primer on reading those symbols is here. pic.twitter.com/aWrrb8I9tj — AK Earthquake Center (@AKearthquake) August 15, 2018
Strike Slip: A cutaway view along the Hawaiian island chain showing the inferred mantle plume that has fed the Hawaiian hot spot on the overriding Pacific Plate. The geologic ages of the oldest volcano on each island (Ma = millions of years ago) are progressively older to the northwest, consistent with the hot spot model for the origin of the Hawaiian Ridge-Emperor Seamount Chain. (Modified from image of Joel E. Robinson, USGS, in “This Dynamic Planet” map of Simkin and others, 2006.)
Hawaiian-Emperor Chain. White dots are the locations of radiometrically dated seamounts, atolls and islands, based on compilations of Doubrovine et al. and O’Connor et al. Features encircled with larger white circles are discussed in the text and Fig. 2. Marine gravity anomaly map is from Sandwell and Smith.
Mw=7.3, KOMANDORSKIYE OSTROVA REGION (Depth: 18 km), 2018/12/20 17:01:54 UTC – Full details here: https://t.co/pUYUdEnFtb pic.twitter.com/u9Uv1X4v4u — Earthquakes (@geoscope_ipgp) December 20, 2018 very strong #earthquake offshore #Kamchatka, #Russia, minor, regional #tsunami expected. Fortunately, region not well inhabitat @Quake_Tracker @LastQuake @JuskisErdbeben @UKEQ_Bulletin pic.twitter.com/DwCE4NuAOd — CATnews (@CATnewsDE) December 20, 2018 Seismic waves from the M7.4 Russia earthquake have rolled across Canada during the past hour (not felt here). The fastest travelling waves took about 7 minutes to travel from Kamchatka to Dawson, Yukon. — John Cassidy (@earthquakeguy) December 20, 2018
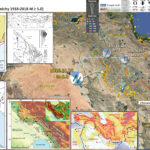
This morning (my time) there was a possibly shallow earthquake in western Iran with a magnitude of M = 6.3. This earthquake occurred in the aftershock zone of the 2017.11.12 M 7.3 earthquake. Here is my report for the M 7.3 earthquake. Here are the USGS webpagea for the M 6.3 and M 7.3 earthquakes. I plot the seismicity from the past month, with color representing depth and diameter representing magnitude (see legend). I include earthquake epicenters from 1918-2018 with magnitudes M ≥ 5.0 in one version.
Simpli”ed map of the Arabian Plate, with plate boundaries, approximate plate convergence vectors, and principal geologic features. Note location of Central Arabian Magnetic Anomaly (CAMA).
Tectonic setting of the Arabian Plate. Red and blue coloured symbols indicate divergence and convergence with overall amount and age, respectively. Green arrows show present-day GPS values with respect to fixed Europa from Iran [21] and white arrow from Oman [22]. a – [23]; b – [20]; c – [18]; d – [19]; e – [14]; f – [15]; g – [8]; h – [16]; i – [17]
Tectonic map of the Zagros Fold Belt showing the position and geometry of the Mountain Front Flexure (MFF). Earthquakes of M ≥ 5 are indicated by small black diamonds. Focal mechanisms from Talebian & Jackson (2004) are also shown, in black (Mw ≥ 5.3) and grey (Mw ≥ 5.3). KH, Khavir anticline; SI, Siah Kuh anticline; ZDF, Zagros Deformation Front.
a) Earthquakes with mb > 5.0 (Jackson and McKenzie, 1984) along seismogenic basement thrusts offset by major strike-slip faults. b) Schematic interpretative map of the main structural features in the Zagros basement. The overall north-south motion of Arabia increases along the belt from NW to SE (arrows with numbers). Central Iran acted as a rigid backstop and caused the strike-slip faults with N-S trends in the west to bulge increasingly eastward. Fault blocks in the north (elongated NW-SE) rotate anticlockwise; while fault blocks in the south (elongated NE-SW) rotate clockwise. c) Simple model involving parallel paper sheets illustrating the observed strike-slip faults in the Zagros. Opening between the sheets (i.e. faults) helped salt diapirs to extrude.
Tectonic map of the Zagros showing the location of the previously published cross-sections with the calculated amount of shortening and the extent of major hydrocarbon fields. The balanced cross-section is marked by the thick black line. M – Mand anticline. Dark grey: Naien-Baft ophiolites (Stöklin, 1968).
Structural cross-sections showing the style of folding across the studied regional transect (see location in Fig. 3). (a) The front of the Zagros Fold Belt along the Anaran anticline above the Mountain Front Flexure (MFF in Emami et al. 2010); (b) the Kabir Kuh anticline, which represents a multi-detachment fold (Vergés et al. 2010); (c) folds developed in the Upper Cretaceous basinal stratigraphy showing much tighter and upright anticlines (modified from Casciello et al. 2009).
The Global Seismic Hazard Map. Peak ground acceleration (pga) with a 10% chance of exceedance in 50 years is depicted in m/s2. The site classification is rock everywhere except Canada and the United States, which assume rock/firm soil site classifications. White and green correspond to low seismicity hazard (0%-8%g), yellow and orange correspond to moderate seismic hazard (8%-24%g), pink and dark pink correspond to high seismicity hazard (24%-40%g), and red and brown correspond to very high seismic hazard (greater than 40%g).
(a) Summary sketch of the tectonic pattern in the Zagros. Overall Arabia–Eurasia motions are shown by the big white arrows, as before. In the NW Zagros (Borujerd-Dezful), oblique shortening is partitioned into right-lateral strike-slip on the Main Recent Fault (MRF) and orthogonal shortening (large gray arrows). In the SE Zagros (Bandar Abbas) no strike-slip is necessary, as the shortening is parallel to the overall convergence. The central Zagros (Shiraz) is where the transition between these two regimes occurs, with anticlockwise rotating strike-slip faults allowing an along-strike extension (black arrows) between Bandar Abbas and Dezful. (b) A similar sketch for the Himalaya (after McCaffrey & N´abˇelek 1998). In this case the overall Tibet-India motion is likely to be slightly west of north. (The India-Eurasia motion is about 020◦, but Tibet moves east relative to both India and Eurasia: Wang et al. 2001). Thrust faulting slip vectors are radially outward around the entire arc (gray arrows). This leads to partitioning of the oblique convergence in the west, where right-lateral strike-slip is prominent on the Karakoram Fault, but no strike-slip in the east, where the convergence and shortening are parallel. The region in between extends parallel to the arc, on normal faults in southern Tibet. (c) A similar sketch for the Java–Sumatra arc, based on McCaffrey (1991). Slip partitioning occurs in the NW, with strike-slip faulting through Sumatra, but not in the SE, near Java. This change along the zone requires the Java–Sumatra forearc to extend along strike.
The two beach balls show the stike-slip fault motions for the M6.4 (left) and M6.0 (right) earthquakes. Helena Buurman's primer on reading those symbols is here. pic.twitter.com/aWrrb8I9tj — AK Earthquake Center (@AKearthquake) August 15, 2018
Strike Slip: A cutaway view along the Hawaiian island chain showing the inferred mantle plume that has fed the Hawaiian hot spot on the overriding Pacific Plate. The geologic ages of the oldest volcano on each island (Ma = millions of years ago) are progressively older to the northwest, consistent with the hot spot model for the origin of the Hawaiian Ridge-Emperor Seamount Chain. (Modified from image of Joel E. Robinson, USGS, in “This Dynamic Planet” map of Simkin and others, 2006.)
Hawaiian-Emperor Chain. White dots are the locations of radiometrically dated seamounts, atolls and islands, based on compilations of Doubrovine et al. and O’Connor et al. Features encircled with larger white circles are discussed in the text and Fig. 2. Marine gravity anomaly map is from Sandwell and Smith.
Significant #earthquake in #Iran, likely an aftershock of the M7.3 Ezgeleh earthquake of November 2017. The difference in focal mechanism reveals slip partitionning in the region. 2 other large strike-slip aftershocks were also recorded last summer pic.twitter.com/P2BOzGI625 — Baptiste Gombert (@BaptisteGomb) November 25, 2018 Mw=6.3, IRAN-IRAQ BORDER REGION (Depth: 10 km), 2018/11/25 16:37:31 UTC – Full details here: https://t.co/YoEYOD1agB pic.twitter.com/u54xzgx8ol — Earthquakes (@geoscope_ipgp) November 25, 2018 strong #earthquake along #Iran #Iraq border, felt #Baghdad, #Kirkuk and #Mosul in Iraq and in #Kermanshah, #Hamadan, #Sulaymaniyah in Iran, even even #Kuwait @LastQuake @Quake_Tracker @JuskisErdbeben @UKEQ_Bulletin pic.twitter.com/NpLVsxxunx — CATnews (@CATnewsDE) November 25, 2018 GFZ moment tensor solution of M6.3 earthquake on Iran-Iraq border https://t.co/ri4JlRyY3K #earthquake pic.twitter.com/VXAO5EdvNO — Aram Fathian (@AramFathian) November 25, 2018 Earthquake in Irak Iran border was widely felt more than 500 km away. Local damage close to the epicentre cannot be excluded, but having struck an area of low population, no widespread damage is expected pic.twitter.com/AaxB5X0ZX8 — EMSC (@LastQuake) November 25, 2018 Mwp6.1 #earthquake Iran – Iraq Border Region 2018.11.25-16:37:34UTC https://t.co/kCIw9Vypa6 — Anthony Lomax 🌍🇪🇺 (@ALomaxNet) November 25, 2018 My thoughts and solidarity to the people affected by #IranEarthquake. Deeply proud of our @Iranian_RCS volunteers and staff, who are ready to support their local communities. pic.twitter.com/Axi1dlRFjQ — Francesco Rocca (@Francescorocca) November 25, 2018 An interesting comparison of the latest M6.3 #Iran #Iraq #earthquake aftershocks and the 2013 #Khanaqin earthquake sequence. Epicenters from IRSC & @IRIS_EPO , focal mechanisms from GFZ pic.twitter.com/xTpds1Ke6V — Sotiris Valkaniotis (@SotisValkan) November 26, 2018 Wrapped interferogram (2.8 cm/1 inch color contours) for M6.3 earthquake near Iran-Iraq border from automatic processing of Copernicus Sentinel-1 SAR by NASA Caltech-JPL ARIA and ESA, with USGS epicenter (star). No sign of surface ruptures, so all fault slip was at depth pic.twitter.com/7eMx6LcpbB — Eric Fielding (@EricFielding) November 26, 2018 #Sentinel1 #InSAR descending interferogram for the M6.3 #Iran #Iraq #earthquake. No clear indications for surface ruptures, most of the slip occured at depth. Processed with DIAPASON at @esa_gep using @CopernicusEU #Sentinel1 data. pic.twitter.com/2Aj9y1759o — Sotiris Valkaniotis (@SotisValkan) November 26, 2018 Simulated coseismic ground deformation map of M6.3 earthquake near Iran/Irap border from our "quickdeform" platform: https://t.co/lrLi8Nrbnt. — Wenbin Xu (@WenbXu) November 27, 2018
Return to the Earthquake Reports page. Following the largest typhoon to strike Japan in a very long time, there was an earthquake on the island of Hokkaido, Japan today. There is lots on social media, including some spectacular views of disastrous and deadly landslides triggered by this earthquake (earthquakes are the number 1 source for triggering of landslides). These landslides may have been precipitated (sorry for the pun) by the saturation of hillslopes from the typhoon. Based upon the USGS PAGER estimate, this earthquake has the potential to cause significant economic damages, but hopefully a small number of casualties. As far as I know, this does not incorporate potential losses from earthquake triggered landslides [yet]. This earthquake is in an interesting location. to the east of Hokkaido, there is a subduction zone trench formed by the subduction of the Pacific plate beneath the Okhotsk plate (on the north) and the Eurasia plate (to the south). This trench is called the Kuril Trench offshore and north of Hokkaido and the Japan Trench offshore of Honshu. The okhotsk plate is considered part of the North America plate on some maps. The location of the plate boundary of the Okhotsk plate are not well understood (e.g. using GPS plate motion velocities, it is difficult to find the northern boundary with the North America plate). Many of the earthquakes in this region are related to the subduction zone. Most notably is the 2011 Tohoku-oki M 9.1 tsunamigenic earthquake. More background information about the 2011 earthquake can be found here and information about the tsunami can be found here. The 2011 earthquake had lots of aftershocks and was quite complicated. One interesting thing that happened is that there was an extensional earthquake in the Pacific plate to the west of the Japan Trench. This M 7.7 earthquake happened along faults formed as the Pacific plate bends near where it meets the trench. Similar subduction zone / outer rise earthquake pairs are known, including some along the New Hebrides Trench in the western equatorial Pacific ocean, as well as further north along the Kuril subduction zone. I spend time discussing the 2006/2007 Kuril earthquake pair in this report. There was also a subduction zone earthquake in 2003, the Tokachi-oki earthquake, that triggered submarine landslides. These landslides transformed into turbidity currents and these were directly observed with offshore instrumentation. One of the interesting things about this region is that there is a collision zone (a convergent plate boundary where two continental plates are colliding) that exists along the southern part of the island of Hokkaido. The Hidaka collision zone is oriented (strikes) in a northwest orientation as a result of northeast-southwest compression. Some suggest that this collision zone is no longer very active, however, there are an abundance of active crustal faults that are spatially coincident with the collision zone. Today’s M 6.6 earthquake is a thrust or reverse earthquake that responded to northeast-southwest compression, just like the Hidaka collision zone. However, the hypocentral (3-D) depth was about 33 km. This would place this earthquake deeper than what most of the active crustal faults might reach. The depth is also much shallower than where we think that the subduction zone megathrust fault is located at this location (the fault formed between the Pacific and the Okhotsk or Eurasia plates). Based upon the USGS Slab 1.0 model (Hayes et al., 2012), the slab (roughly the top of the Pacific plate) is between 80 and 100 km. So, the depth is too shallow for this hypothesis (Kuril Trench earthquake) and the orientation seems incorrect. Subduction zone earthquakes along the trench are oriented from northwest-southweast compression, a different orientation than today’s M 6.6. So today’s M 6.6 earthquake appears to have been on a fault deeper than the crustal faults, possibly along a deep fault associated with the collision zone. Though I am not really certain. This region is complicated (e.g. Kita et al., 2010), but there are some interpretations of the crust at this depth range (Iwasaki et al., 2004) shown in an interpreted cross section below. I present more about the basics behind ground shaking, triggered landslides, and possible earthquake triggering on Temblor here: I plot the seismicity from the past month, with color representing depth and diameter representing magnitude (see legend). I include earthquake epicenters from 1918-2018 with magnitudes M ≥ 6.5 in one version.
Maps showing tectonic context around the Japanese Islands (a) and geologic belts in Hokkaido (b; after Kato et al., 1990).
Geologic map around the Umaoi anticline redrawn from Geological Survey of Japan (2002). Location of active fault and/or fold scarps (after Ikeda et al., 2002) are also shown. buQ and bdQ attached on fault traces are upthrown and downthrown sides of faults, respectively. Sampling points of surface paleomagnetic data is after Kodama et al. (1993).
Geological map of Central Hokkaido with our seismic refraction/wide-angle reflection profiles and shot points (stars). Seismic reflection lines of the Hokkaido Transect were laid out from shot L-2 to M-5 on the wide-angle line. Reflection lines carried out from 1994 to 1997 in the southernmost part of the HCZ and refraction/wide-angle reflection lines in 1984 and 1992 are also shown. SYB: Sorachi-Yezo Belt; KMB: Kamuikotan Metamorphic Belt; IB: Idon’nappu Belt; HMB: Hidaka Metamorphic Belt; HB: Hidaka Belt; YB: Yubetsu Belt; TB: Tokoro Belt; HMT: Hidaka Main Trust.
Geological interpretation of the seismic model. KMB: Kamuikotan Metamorphic Belt; IB: Idon’nappu Belt; HMB: Hidaka Metamorphic Belt; Yz: Yezo Super Group; Sr: Sorachi Group; HMT: Hidaka Main Thrust.
Tectonic settings of the study region (black box). The solid sawtooth lines and the black dashed line denote the plate boundaries (Bird 2003). The red triangles denote the active volcanoes. The blue dashed lines and the pink lines denote the depth contours to the upper boundary of the subducting Pacific slab and that of the subducting Philippine Sea slab, respectively (Hasegawa et al. 2009; Zhao et al. 2012). The topography data are derived from the GEBCO_08 Grid, version 20100927, http://www.gebco.net. The ages of oceanic plates are from M¨uller et al. (2008).
(c) Distribution of the 4803 earthquakes used in
Tectonic setting of Kyushu within the Japanese island arc. The locations of active faults and volcanoes that have been active in the last 10,000 years are also shown.
Area affected by landslides in earthquakes of different magnitudes. Numbers beside data points are earthquakes listed in Table 1. Dots = onshore earthquakes; x = offshore earthquakes. Horizontal bars indicate range in reported magnitudes. Solid line is approximate upper bound enclosing all data.
Location and 12May 2008Wenchuan earthquake fault surface rupturemap, and focalmechanisms of the main earthquake (12May) and two of the major aftershocks (13 May and 25 May). Also the epicenters of historic earthquakes are indicated. The following faults are indicated: WMF: Wenchuan–Maowen fault; BF: Beichuan–Yingxiu fault; PF: Pengguan fault; JGF: Jiangyou–Guanxian fault; QCF: Qingchuan fault; HYF: Huya fault;MJF:Minjian fault based on the following sources: (Surface rupture: Xu et al., 2009a,b; Epicenter and aftershocks: USGS 2008; Historic earthquakes: Kirby et al., 2000; Li et al., 2008; Xu et al., 2009a,b).
Distribution of landslide dams triggered by the Wenchuan earthquake, China. The high landslide density zone is defined by a landslide area density >0.1 km−2; also shown are epicenters of historical earthquakes (USGS, 2008) and the historical Diexi landslide dams (Dahaizi, Xiaohaizi and Diexi). White polygons are unmapped due to the presence of clouds and shadows in post-earthquake imagery. WMF: Wenchuan–Maowen fault; YBF: Yingxiu–Beichuan fault; PF: Pengguan fault; JGF: Jiangyou–Guanxian fault; QCF: Qingchuan fault; HYF: Huya fault; MJF: Minjiang fault (after X. Xu et al., 2009). MJR: Minjiang River; MYR: Mianyuan River; JJR: Jianjiang River; QR: Qingjiang River.
Comparison of densities of blocking and non-blocking landslides. (a) Landslide density. (b) Landslide dam point density. White dashed lines are 240-km by 25-km swath profiles. (c). Mean normalized landslide and landslide dam densities along the SW–NE profile. Red lines are Yingxiu-Beichuan fault (YBF) and Pengguan fault (PF). Yellow dash lines are the boundary of the P1–P7 watersheds in the Pengguan Massif. YX, WC, HW, BC, and QC are the cities of Yingxiu, Wenchuan, Hanwang, Beichuan and Qingchuan, respectively. MJR, JJR, FJR, and QR represent Minjiang, Jianjiang, Fujiang and Qingjiang rivers, respectively.
The two beach balls show the stike-slip fault motions for the M6.4 (left) and M6.0 (right) earthquakes. Helena Buurman's primer on reading those symbols is here. pic.twitter.com/aWrrb8I9tj — AK Earthquake Center (@AKearthquake) August 15, 2018
Strike Slip: A cutaway view along the Hawaiian island chain showing the inferred mantle plume that has fed the Hawaiian hot spot on the overriding Pacific Plate. The geologic ages of the oldest volcano on each island (Ma = millions of years ago) are progressively older to the northwest, consistent with the hot spot model for the origin of the Hawaiian Ridge-Emperor Seamount Chain. (Modified from image of Joel E. Robinson, USGS, in “This Dynamic Planet” map of Simkin and others, 2006.)
Hawaiian-Emperor Chain. White dots are the locations of radiometrically dated seamounts, atolls and islands, based on compilations of Doubrovine et al. and O’Connor et al. Features encircled with larger white circles are discussed in the text and Fig. 2. Marine gravity anomaly map is from Sandwell and Smith.
If you need information in English, you can call to Hokkaido Disaster Prevention Information (available 24 hours). Please refer to the link.#Japanearthquake#HokkaidoEarthquake Emergency information for foreigners – News – NHK WORLD – English https://t.co/5mXIWbuYzU — へニキ藤山 (@He2ki) September 6, 2018 Nice example of basin effects around Tokyo! https://t.co/r2UHEixJgK — Emily Wolin (@GeoGinger) September 6, 2018 Japan has more measurable #earthquakes than any other country and has over 100 active volcanoes. These both result from Japan being wedged among four major tectonic plates. Learn more – https://t.co/KGI16OduAI #JapanEarthquake pic.twitter.com/ADbi2T8kGv — IRIS Earthquake Sci (@IRIS_EPO) September 5, 2018 Landslides that seemed be happened by the 6th Sept 2018 M6.7 Hokkaido earthquake pic.twitter.com/eZAiculsHX — Deepa Mele Veedu (@deepameleveedu) September 6, 2018 今、NHKでも中継見てるけど、信じられない光景……。https://t.co/6aOXDKqWtq pic.twitter.com/drZBljla0a — よんます (@yonmas) September 6, 2018 NHK News stream – massive landslides, probably assisted by heavy rain in the previous 30 hours. Some houses were in the wrong place. Hopefully there wasn't anybody home, but at 3:08 am there probably was #Earthquake @LastQuake @TTremblingEarth @Ambassador_SR pic.twitter.com/p5fLJyNEfN — Jamie Gurney (@UKEQ_Bulletin) September 5, 2018 #Sapporo #Hokkaido Massive landslide due M6.6 earthquake @davepetley pic.twitter.com/pOsnQAPVaK — Luis Donoso (@Geo_Risk) September 6, 2018 釧路が停電し、街の明かりが消えていく様子#北海道地震 pic.twitter.com/ySa8Rg1kei — saimon98 (@saimon98se) September 5, 2018 It took 11min 18sec for the first seismic waves from today's M6.6 quake in Japan to reach my @raspishake in Turlock, CA. Picking up quakes from 4,860mi away… NBD. pic.twitter.com/g5y5fsD0Qk — Ryan Hollister (@phaneritic) September 6, 2018 Aerial video shows a landslide burying homes in Hokkaido after a strong magnitude 6.6 earthquake struck the northern Japan island 🎥: @nhk_news pic.twitter.com/pEXYLxnQ5m — BuzzFeed Storm (@BuzzFeedStorm) September 5, 2018 Mw=6.6, HOKKAIDO, JAPAN REGION (Depth: 30 km), 2018/09/05 18:07:58 UTC – Full details here: https://t.co/IS1AVC6Enn pic.twitter.com/WngxJgHQkp — Earthquakes (@geoscope_ipgp) September 5, 2018 This shows bedded marine sediments (turbidites) on plane with sliding. Likely explains it. pic.twitter.com/Ayr9Fp9VDy — Patrick Williams (@quake_science) September 6, 2018 Hundreds of landslides reported after 6.6 magnitude Japan quakehttps://t.co/MvqYg5kEez — Carlo Meletti (@CarloMeletti) September 5, 2018 After A strong 6.6 #earthquake #Terremoto #Temblor a Lightning #storm over Hokkaido #Japón #Japan right now ⚡ pic.twitter.com/nGqf8TKb5o — Teacher From PR 🌧️🌀🌩️ (@MaestroDEPR) September 5, 2018 今朝未明の北海道の地震は、当初は最大震度6強と見られましたが、最大震度7に修正されています。 — ウェザーニュース (@wni_jp) September 6, 2018 Helicopter rescues for those who authorities can reach – now the challenge is getting to those trapped inside the mud (currently nearly 20 missing). Currently 100 injured from the #japanearthquake in Hokkaido. Pics via NHK pic.twitter.com/Sp3bC49H4B — Jake Sturmer (@JakeSturmer) September 6, 2018 3 million without power, all flights to New Chitose Airport cancelled today as 6.7 quake hits Hokkaido (Shindo 6+ in some parts) #Japanearthquake pic.twitter.com/w5SssxpyEd — Jake Sturmer (@JakeSturmer) September 5, 2018 Bullet trains suspended too from the #Japanearthquake pic.twitter.com/dbfdTosIvM — Jake Sturmer (@JakeSturmer) September 5, 2018 Tomari nuclear plant using emergency generators – News – NHK WORLD – English https://t.co/GT1FJ4bIvP — patton_cascadia (@patton_cascadia) September 6, 2018 Near the epicenter, landslides wiped out homes in Atsuma. All of the missing are from this town.Helicopter crews are carrying out rescue operations. pic.twitter.com/MLubmtDTO4 — NHK WORLD News (@NHKWORLD_News) September 6, 2018 震度7を観測した北海道厚真町 NHKがドローンで撮影した映像です — NHKニュース (@nhk_news) September 6, 2018 More details are emerging about the landslides triggered by 6th September 2018 Hokkaido earthquake. The high landslide density may reflect recent rainfall from typhoon Jebi:- https://t.co/tbg1zba6Za pic.twitter.com/wYWid5PZDg — Dave Petley (@davepetley) September 6, 2018 Pre- and post-seismic image of 2018 Hokkaido earthquake. Phenomenal landslides. — Jay Tung (@jaytung_earth) September 6, 2018 ALOS-2 InSAR interferogram of #HokkaidoEarthquake . — Sadra Karimzadeh (@Sadra_Krmz) September 6, 2018 Liquefaction probability map after #HokkaidoEarthquake M 6.6 https://t.co/Or2K7xnZIB pic.twitter.com/Qz5uVGYL0m — Sadra Karimzadeh (@Sadra_Krmz) September 6, 2018 — temblor (@temblor) September 7, 2018 Actualización terremoto #Hoakkaido, Japón🇯🇵. Asciende a 20 cifra de decesos; aún reportan personas desaparecidas. Se observa licuefacción: suelos saturados de agua, que suben a superficie, pierden firmeza por la sacudida del sismo desestabilizando el suelo. Créditos: NHK pic.twitter.com/zHOr1HR1tx — SkyAlert (@SkyAlertMx) September 7, 2018 Death toll rises to 30 in the aftermath of Japan's Hokkaido earthquakehttps://t.co/z9b8LdSvhZ — TIME (@TIME) September 8, 2018 NASA JPL-Caltech ARIA preliminary deformation map from Copernicus Sentinel-1 data for 5 September 2018 Hokkaido earthquake. Total motion is approximate due to very high noise level (low coherence), but deformation signal is between 9 and 14 cm of motion up and east. pic.twitter.com/YoL2IvdjSO — Eric Fielding (@EricFielding) September 9, 2018 Comparison view between 2015 (up) and post-earthquake (below) reveals the extent of co-seismic #landslides from the M6.6 #earthquake near Atsuma, Hokkaido, #Japan. Point cloud data for 2015 & 2018 extracted from aerial imagery provided by Japan Geographical Survey Institute. pic.twitter.com/lriXZt10Za — Sotiris Valkaniotis (@SotisValkan) September 10, 2018 Slippery volcanic soils blamed for deadly landslides during #Hokkaido earthquake, reports @guardianeco https://t.co/BhB0sm8kHW pic.twitter.com/sX8BFAXZfJ — EGU (@EuroGeosciences) September 11, 2018 【地殻変動情報】だいち2号のSARデータを使用した解析による、 #平成30年北海道胆振東部地震 に伴う地殻変動分布図を公開しました。 — 国土地理院 (@GSI_chiriin) September 10, 2018 High quality drone footage has been posted on Facebook providing detailed views of the landslides from the 2018 Hokkaido Eastern Iburi earthquake:- https://t.co/pjMXJOAxkK pic.twitter.com/LZJ1zUzwk2 — Dave Petley (@davepetley) September 11, 2018 Potential liquefaction damage map in urban areas based on LiquickMap, slope map, differential InSAR coherence and weighted overlay analysis (WOA). #hokkaidoearthquake pic.twitter.com/rJejYS2D8Y — Sadra Karimzadeh (@Sadra_Krmz) September 12, 2018 GNSS and ALOS-2 InSAR observations, and fault model for Mj6.7 #HokkaidoEarthquake on Sep 6 by GSI. The depth of the upper edge of the fault is ~15km, much shallower than the hypocenter depth (>30km). https://t.co/iQBE4GwPtL pic.twitter.com/0MX9PhWG5h — Yu Morishita (@Yu__Morishita) September 12, 2018 Slippery volcanic soils blamed for deadly landslides during Hokkaido earthquake https://t.co/s3WAAygPOr — temblor (@temblor) September 16, 2018
Return to the Earthquake Reports page. There was an earthquake in Burma today! The epicenter plotted very close to the Sagaing fault (SF), a major dextral (right-lateral) strike-slip fault system, part of the plate boundary between the India and Eurasia plates. This fault system accommodates much of the dextral relative movement between these two plates. I plot the seismicity from the past month, with color representing depth and diameter representing magnitude (see legend). I include earthquake epicenters from 1918-2018 with magnitudes M ≥ 6.5 (and down to M ≥ 4.5 in a second poster).
Structural fabric of the Bay of Bengal with its present kinematic setting. Shaded background is the gravity map from Sandwell and Smith [1997]. Fractures and magnetic anomalies in black color are from Desa et al.[2006]. Dashed black lines are inferred oceanic fracture zones which directions are deduced from Desa et al. in the Bay of Bengal and from the gravity map east of the 90E Ridge. We have flagged particularly the 90E and the 85E ridges (thick black lines). Gray arrow shows the Indo-Burmese Wedge (indicated as a white and blue hatched area) growth direction discussed in this paper. For kinematics, black arrows show the motion of the India Plate with respect to the Burma Plate and to the Sunda Plate (I/B and I/S, respectively). The Eurasia, Burma, and Sunda plates are represented in green, blue, and red, respectively.
Present cross section based on industrial multichannel seismics and field observations. The seismicity from USGS catalog and Engdahl [2002] is represented as black dots. Focal mechanisms from Global CMT (http://www.globalcmt.org/CMTsearch.html) catalog are also represented.
Cartoon showing the tectonic evolution of the Indo-Burmese Wedge from late Miocene to present.
Simplified neotectonic map of the Myanmar region. Black lines encompass the six neotectonic domains that we have defined. Green and Yellow dots show epicenters of the major twentieth century earthquakes (source: Engdahl and Villasenor [2002]). Green and yellow beach balls are focal mechanisms of significant modern earthquakes (source: GCMT database since 1976). Pink arrows show the relative plate motion between the Indian and Burma plates modified from several plate motion models [Kreemer et al., 2003a; Socquet et al., 2006; DeMets et al., 2010]. The major faults west of the eastern Himalayan syntax are adapted from Leloup et al. [1995] and Tapponnier et al. [2001]. Yellow triangle shows the uncertainty of Indian-Burma plate-motion direction.
Fault segments and historical earthquakes along the central and southern parts of the Sagaing fault. Green dots show relocated epicenters from Hurukawa and Phyo Maung Maung [2011]. Dashed and solid gray boxes surround segments of the fault that ruptured in historical events. NTf = Nanting fault; Lf = Lashio fault; KMf = Kyaukme fault; PYf = Pingdaya fault; TGf = Taunggyi fault.
Tectonic map of part of the northeastern Indian Ocean. Modified from Curray (1991).
Seismotectonic map of Myanmar (Burma) and surroundings. Faults are from Taylor & Yin (2009) with minor additions and adjustments. GPS vectors show velocities relative to a fixed India from Vernant et al. (2014), Gahalaut et al. (2013), Maurin et al. (2010) and Gan et al. (2007). Coloured circles indicateMw > 5 earthquakes from the EHB catalogue. Grey events are listed for depths <50 km, yellow for depths of 50–100 km and red for depths >100 km. The band of yellow and red earthquakes beneath the Indo-Burman Ranges represents the Burma Seismic Zone. The dashed black line shows the line of the cross-section in Figure 2.13. ASRR, Ailao Shan–Red River Shear Zone.
Seismotectonic map of Myanmar (Burma). Faults are from Taylor & Yin (2009) with minor additions and adjustments. GPS vectors show velocities relative to a fixed Eurasia from Maurin et al. (2010). Slip rate estimates on the Sagaing Fault are given in blue and are from a, Bertrand et al. (1998); b, Vigny et al. (2003); c, Maurin et al. (2010); and d, Wang et al. (2011). Major earthquakes (Ms ≥7) are shown by yellow stars for the period 1900–76 from International Seismological Centre (2011) and by red stars for the period 1836–1900 from Le Dain et al. (1984). The location and magnitude of theMb 7.5 1946 earthquake is taken from Hurukawa&Maung Maung (2011). Earthquake focal mechanisms are taken from the GCMT catalogue (Ekström et al. 2005) and show Mw ≥5.5 earthquakes, listed as being shallower than 30 km in the period 1976–2014. IR, Irrawaddy River; CR, Chindwin River; HV, Hukawng Valley; UKS, Upper Kachin State; SF, Sagaing Fault; KF, Koma Fault. The inset panel is an enlargement of the area within the dashed grey box. It shows the dense GPS network in this area.
Regional setting, and fault geometries and uplift distribution associated with the Sagaing Fault.
Regional tectonic setting of the Andaman Sea Region modified from Morley (2017). See text for explanation of labels A–E. The locations of Figures 2.15– 2.17 are indicated.
Extension of the Burma–Andaman–Sumatra microplate (shown in green). The Burma Platelet is the northern part in Myanmar. Active faults are shown in red and inactive faults in purple. The post-Santonian magnetic anomalies and associated transform faults of the Indian and Australian plates are suggested in blue. Left-lateral red arrows along the 90° E Ridge illustrate left-lateral motion between the Indian and Australian plates. India/Eurasia relative motion is shown with a yellow arrow, India/Sunda motion with purple arrows and Australia/Sunda motion with black arrows (modified from Rangin 2016).
Structural map of the active buckling of the Burma Platelet considered not to be rigid. The curved Sagaing Fault, Lelong, Kaladan and coastal faults outline this arched platelet. WSW extrusion of the platelet is outlined by the NE–SW diffuse dextral shear south of the South Assam Shear Zone into the north and by the left lateral Pyay-Prome shear zone in the south. The western margin (CSM: collapsing Sunda margin) of this platelet is affected by dextral wrench and active collapse of the continental margin, but no sign of active subduction was found. This platelet is bracketed tectonically between the drifted 90° E Ridge and the accreted volcanic ridges into the south and the Eurasian Buttress (Himalayas and Shillong) into the north. The East Himalaya Crustal Flow (EHCF; large curved red arrow) imaged in the East Himalaya Syntaxis (EHS) is induced by the Tibet Plateau collapse and could be an important component of the tectonic force causing the platelet buckling. The Burma Platelet is jammed between the Accreted Volcanic Ridges in the south, and the Shillong Plateau crustal block in the north, participate to the buckling of the Myanmar Platelet. BBacc, Bay of Bengal attenuated continental crust (Rangin & Sibuet 2017); CMB, Central Myanmar Basins; CMF, Churachandpur-Mao Fault (Gahalaut et al. 2013).
M6.0 #earthquake in #Myanmar near Pyu, recorded by Myanmar National Seismic Network pic.twitter.com/nxSOd4TTHO — Emily Wolin (@GeoGinger) January 11, 2018 Mw=5.9, MYANMAR (Depth: 6 km), 2018/01/11 18:26:24 UTC – Full details here: https://t.co/WTDLw0RKWg pic.twitter.com/tFmnCskMgF — Earthquakes (@geoscope_ipgp) January 11, 2018
A couple weeks following the earthquake in eastern Iraq, there was a sequence of earthquakes in central eastern Iran. These earthquakes are too distant to be related. The Iranian sequence includes a M 6.1 foreshock on 2017.12.01 and two M 6.0 aftershocks on 2017.12.12. Here is my report for the M 7.3 earthquake. I plot the seismicity from the past month, with color representing depth and diameter representing magnitude (see legend). I include earthquake epicenters from 1917-2017 with magnitudes M > 6.5.
Tectonic sketch map of the Persian Gulf and Arabian Peninsula, modified from Al-Husseini (2000), Ziegler (2001) and Pollastro (2003).
(Colour online) (a) Tectonic setting of Iran in the Middle East and presentation of major convergence vectors of the region. (b) Main sedimentary-structural zones of Iran (modified from Aghanabati, 2004). Major faults discussed in the text are shown. White and black arrows from Sella, Dixon & Mao (2002) and Vernant et al. (2004), respectively. DFS – Doruneh Fault System, MRZF – Main Zagros Reverse Fault, HZF – High Zagros Fault, MFF – Mountain Frontal Fault, ZFF – Zagros Foredeep Fault.
GTOPO30 image of central and eastern Iran showing the major fault zones and geographical regions. Black and gray arrows represent Arabia-Eurasia plate motions. Rates are in millimeters per year. Black arrows are GPS estimates from Sella et al. [2002] and gray arrows represent 3 Ma magnetic anomaly plate motions which are a combination of the Africa-Eurasia plate motion from Chu and Gordon [1998] and the Africa-Arabia plate motion of DeMets et al. [1994] (see Jackson et al. [1995] for method). Arabia-Eurasia convergence occurs in the Zagros, the Alborz, and Kopeh Dagh, and possibly in central Iran by the rotation of strike-slip faults (see later discussion). Right-lateral shear between central Iran and Afghanistan is taken up on N–S right-lateral faults of the Gowk-Nayband and Sistan suture zone systems, which surround the Dasht-e-Lut. North of 34N, the right-lateral shear is taken up on left-lateral faults that rotate clockwise.
(a) GTOPO30 topography of the Kerman region centered on the Gowk fault (see Figure 1 for location). Fault plane solutions of shallow (<35 km) earthquakes are shown. Black solutions are events modeled using body waveforms (listed by Jackson [2001], Walker [2003], and Talebian and Jackson [2004]); dark gray represents events from the Harvard CMT catalogue with >70% double-couple component; light gray represents first-motion solutions [from McKenzie, 1972]. Zones of shortening and thrust faulting are seen both to the north of Kerman, where the Gowk fault splits into the Kuh-Banan, Lakar-Kuh, and Nayband faults, and south of Mahan, where NW–SE trending thrust faults occupy the region between the Sabzevaran and Gowk faults. These zones of intense deformation may be partly caused by rotation of crustal blocks, as marked by black arrows (see section 5.3). The box marks the location of Figure 8b. (b) Landsat TM image of the central part of the Gowk fault. Restoration of drainage and structural features indicate between 12 and 15 km of cumulative right-lateral displacement [Walker and Jackson, 2002]. Restoration of 15 km of right-lateral slip aligns dark-colored lithologies (marked X), although it is not certain that the dark-colored rocks at either side of the fault are from a single displaced unit.
LANDSAT TM image and location map of the Gowk fault region.
Historical seismicity map based in ISC Bulletin data for yesterdays Mw 7.3 on Iran-Iraq border. Mostly shallow thrust events in a complex tectonic setting.
A: Shaded relief topographic map of Shahdad area with active faults (medium black lines) (Walker and Jackson, 2002), XX9 profile location (thick black line), moderate earthquakes (black filled circles), four large earthquakes since 1981 (white filled circles), and fault-plane solution (upper right) for Fandoqa earthquake (Berberian et al., 2001). Rectangles with thin black lines are Fandoqa rupture (F) and Shahdad basalthrust (S) dislocations shown in other figures. Thick dashed white line—Gowk fault zone; P—central Iranian plateau; L—Lut block. B: Topographic profile and depth cross section of Fandoqa main shock, Shahdad basal thrust, and splay slip planes. Solid lines show positions of fault planes from inversion after adjustment for topography; dashed lines are unadjusted. Gray fill shows Shahdad thrust wedge.
A: Average of two interferograms, converted to radar range change (motion in radar line of sight) in millimeters. Faults (black lines) and profile location (white line) as in Figure 1A. Rectangles (thin lines) show surface locations of Fandoqa and Shahdad basalthrust dislocation models. B: Surface deformation from Fandoqa main-shock elastic model, shown as radar range change. Large rectangle outlines area shown in C and D. C: Residual interferogram after subtracting Fandoqa main shock model shown in B. Note that color scale and area are different from A and B. Green labels are Universal Transverse Mercator zone 40 coordinates and tics are every 10 km. Thin red lines show updip projections of Fandoqa and Shahdad basal thrust to surface. Larger rectangle shows extended Shahdad basal thrust used in distributed slip inversion (Fig. 3) and Poly3D (Fig. 4). D: Surface deformation predicted by slip model of Shahdad basal thrust and splays shown in Figure 4, projected into radar line of sight. Same area and colors as C.
A month and a half ago, I was attending the PATA conference and an earthquake hit Iran and Iraq the night before our first field trip. Thus, I did not have the time to address this earthquake at the time. I am preparing this report in support of my annual summary. I plot the seismicity from the past month, with color representing depth and diameter representing magnitude (see legend). I include earthquake epicenters from 1917-2017 with magnitudes M > 6.5.
(a) Seismicity of the Eastern Mediterranean region and surroundings reported by USGS–NEIC during 1973–2007 with magnitudes for M . 3 superimposed on a shaded relief map derived from the GTOPO-30 Global Topography Data taken after USGS. Bathymetry data are derived from GEBCO/97–BODC, provided by GEBCO (1997) and Smith & Sandwell (1997a, b). (b) Summary sketch map of the faulting and bathymetry in the Eastern Mediterranean region, compiled from our observations and those of Le Pichon & Angelier (1981), Taymaz (1990), Taymaz et al. (1990, 1991a, b); S¸arogˇlu et al. (1992), Papazachos et al. (1998), McClusky et al. (2000) and Tan & Taymaz (2006). Large black arrows show relative motions of plates with respect to Eurasia (McClusky et al. 2003). Bathymetry data are derived from GEBCO/97–BODC, provided by GEBCO (1997) and Smith & Sandwell (1997a, b). Shaded relief map derived from the GTOPO-30 Global Topography Data taken after USGS. NAF, North Anatolian Fault; EAF, East Anatolian Fault; DSF, Dead Sea Fault; NEAF, North East Anatolian Fault; EPF, Ezinepazarı Fault; PTF, Paphos Transform Fault; CTF, Cephalonia Transform Fault; PSF, Pampak–Sevan Fault; AS, Apsheron Sill; GF, Garni Fault; OF, Ovacık Fault; MT, Mus¸ Thrust Zone; TuF, Tutak Fault; TF, Tebriz Fault; KBF, Kavakbas¸ı Fault; MRF, Main Recent Fault; KF, Kagˇızman Fault; IF, Igˇdır Fault; BF, Bozova Fault; EF, Elbistan Fault; SaF, Salmas Fault; SuF, Su¨rgu¨ Fault; G, Go¨kova; BMG, Bu¨yu¨k Menderes Graben; Ge, Gediz Graben; Si, Simav Graben; BuF, Burdur Fault; BGF, Beys¸ehir Go¨lu¨ Fault; TF, Tatarlı Fault; SuF, Sultandagˇ Fault; TGF, Tuz Go¨lu¨ Fault; EcF, Ecemis¸ Fau; ErF, Erciyes Fault; DF, Deliler Fault; MF, Malatya Fault; KFZ, Karatas¸–Osmaniye Fault Zone.
Simpli”ed map of the Arabian Plate, with plate boundaries, approximate plate convergence vectors, and principal geologic features. Note location of Central Arabian Magnetic Anomaly (CAMA).
(a) Regional topography and seismicity of the Arabia-Eurasia collision. Large dots are epicenters of earthquakes of M >6 from 1900 to 2000 [Jackson, 2001], small dots are epicenters from the EHB catalogue 1964–1999, M >5. Red arrows show GPS-derived velocity with respect to Asia from Sella et al. [2002]. A= Alborz; TIP = Turkish-Iranian plateau; Z = Zagros. (b) Seismicity of the Zagros: focal mechanisms reported in Nissen et al. [2011] and references therein. Note the scarcity of thrusts above the smoothed 1250m regional elevation contour (derived using a Gaussian filter with a radius of 50 km). Earthquake epicenters are accurate to within 20 km [Nissen et al., 2011]. GPS vectors are from Walpersdorf et al. [2006]. MZRF =Main Zagros Reverse Fault (Zagros suture).
(a) Location map and major structures of the Zagros Simply Folded Belt, Iran. Derived from NIOC [1975, 1977], Berberian [1995], Hessami et al. [2001], Blanc et al. [2003], Agard et al. [2005], and Babaie et al. [2006]. Key to fault abbreviations: B = Borazjan; Iz = Izeh; K= Kazerun; KB= Kareh Bas; Kh = Khanaqin; S = Sarvestan; SP = Sabz-Pushan; BL = Balarud Line; A= Kuh-e Asmari. b) Earthquake epicentres across the Zagros, from Nissen et al. [2011] and references therein, divided by fault type. MZRF =Main Zagros Reverse Fault.
(a) Cross-section through the Dezful Embayment and the Bakhtyari Culmination.
Large displacement (~90 cm upward and ~50 cm westward) has been detected around 20 km NNW of Sarpol-e Zahab. Around the epicenter, ~30 cm downward and ~35 cm westward displacement has been detected.
The Global Seismic Hazard Map. Peak ground acceleration (pga) with a 10% chance of exceedance in 50 years is depicted in m/s2. The site classification is rock everywhere except Canada and the United States, which assume rock/firm soil site classifications. White and green correspond to low seismicity hazard (0%-8%g), yellow and orange correspond to moderate seismic hazard (8%-24%g), pink and dark pink correspond to high seismicity hazard (24%-40%g), and red and brown correspond to very high seismic hazard (greater than 40%g).
M7.3 #earthquake Iran-Iraq Border Region: very high intensities reported, and very widely felt, out to 2000+km https://t.co/bJPAiRdLr9 https://t.co/FQD2C7dpmE pic.twitter.com/MjOGnz74rt — Anthony Lomax 🌍 (@ALomaxNet) November 13, 2017
Map of historical seismicity in & around Iran + 3 locations of significant quakes in last 2 months (in purple): today's M5 near Tehran, several M6 events in Kerman province & M7.3 Zagros quake on Nov 12 pic.twitter.com/3IMfjWhf0I — Jascha Polet (@CPPGeophysics) December 21, 2017
Mw=7.4, IRAN-IRAQ BORDER REGION (Depth: 19 km), 2017/11/12 18:18:19 UTC – Full details here: https://t.co/17cEvZks2x pic.twitter.com/KMISiKizn1 — Earthquakes (@geoscope_ipgp) November 12, 2017
Mw=5.9, NORTHERN AND CENTRAL IRAN (Depth: 11 km), 2017/12/12 08:43:18 UTC – Full details here: https://t.co/eaP3MwEHCI pic.twitter.com/RFutjTIgyR — Earthquakes (@geoscope_ipgp) December 12, 2017
Good old ASTER offers a better view of the huge #landslide displacement north of Sarpol Zahab, Iran. (before and after images). #Iran #Iraq #earthquake pic.twitter.com/mIGV6CfXsD — Sotiris Valkaniotis (@SotisValkan) November 21, 2017
Coseismic deformation detected by #ALOS2 #InSAR and fault model of #Iran #Iraq #earthquake uploaded on GSI web. KMZ also available. https://t.co/aBsAWSe9iZ pic.twitter.com/7RizXvQMR3 — Yu Morishita (@Yu__Morishita) November 15, 2017
Unwrapped #InSAR map of #Kermanshah earthquake, #Iran derived from ScanSAR #PALRSAR-2 descending data track 71 (10/4/2017 and 11/15/2017). Triangles and white dots are cities and villages in different provinces of #Iran, respectively. pic.twitter.com/XIdvyPGdDS — Sadra Karimzadeh (@Sadra_Krmz) November 19, 2017
Nearly 100,000 deaths since 1990 in earthquakes in Iran (in French) https://t.co/SCzEuJ99GJ — Anthony Lomax 🌍 (@ALomaxNet) November 15, 2017
Last night (my time) while I was tending to other business, there was an earthquake along the Sunda Megathrust. Here is the USGS website for this M 6.4 earthquake. I plot the seismicity from the past month, with color representing depth and diameter representing magnitude (see legend). I also include USGS epicenters from 1917-2017 for magnitudes M ≥ 7.
Sumatra core location and plate setting map with sedimentary and erosive systems figure. A. India-Australia plate subducts northeastwardly beneath the Sunda plate (part of Eurasia) at modern rates (GPS velocities are based on regional modeling of Bock et al, 2003 as plotted in Subarya et al., 2006). Historic earthquake ruptures (Bilham, 2005; Malik et al., 2011) are plotted in orange. 2004 earthquake and 2005 earthquake 5 meter slip contours are plotted in orange and green respectively (Chlieh et al., 2007, 2008). Bengal and Nicobar fans cover structures of the India-Australia plate in the northern part of the map. RR0705 cores are plotted as light blue. SRTM bathymetry and topography is in shaded relief and colored vs. depth/elevation (Smith and Sandwell, 1997). B. Schematic illustration of geomorphic elements of subduction zone trench and slope sedimentary settings. Submarine channels, submarine canyons, dune fields and sediment waves, abyssal plain, trench axis, plunge pool, apron fans, and apron fan channels are labeled here. Modified from Patton et al. (2013 a).
Map of Southeast Asia showing recent and selected historical ruptures of the Sunda megathrust. Black lines with sense of motion are major plate-bounding faults, and gray lines are seafloor fracture zones. Motions of Australian and Indian plates relative to Sunda plate are from the MORVEL-1 global model [DeMets et al., 2010]. The fore-arc sliver between the Sunda megathrust and the strike-slip Sumatran Fault becomes the Burma microplate farther north, but this long, thin strip of crust does not necessarily all behave as a rigid block. Sim = Simeulue, Ni = Nias, Bt = Batu Islands, and Eng = Enggano. Brown rectangle centered at 2°S, 99°E delineates the area of Figure 3, highlighting the Mentawai Islands. Figure adapted from Meltzner et al. [2012] with rupture areas and magnitudes from Briggs et al. [2006], Konca et al. [2008], Meltzner et al. [2010], Hill et al. [2012], and references therein.
Recent and ancient ruptures along the Mentawai section of the Sunda megathrust. Colored patches are surface projections of 1-m slip contours of the deep megathrust ruptures on 12–13 September 2007 (pink to red) and the shallow rupture on 25 October 2010 (green). Dashed rectangles indicate roughly the sections that ruptured in 1797 and 1833. Ancient ruptures are adapted from Natawidjaja et al. [2006] and recent ones come from Konca et al. [2008] and Hill et al. (submitted manuscript, 2012). Labeled points indicate coral study sites Sikici (SKC), Pasapuat (PSP), Simanganya (SMY), Pulau Pasir (PSR), and Bulasat (BLS).
Distribution of coupling on the Sumatra megathrust derived from the formal inversion of the coral and of the GPS data (Tables 2, 3, and 4) prior to the 2004 Sumatra-Andaman earthquake (model I-a in Table 7). (a) Distribution of coupling on the megathrust. Fully coupled areas are red, and fully creeping areas are white. Three strongly coupled patches are revealed beneath Nias island, Siberut island, and Pagai island. The annual moment deficit rate corresponding to that model is 4.0 X 10^20 N m/a. (b) Observed (black vectors) and predicted (red vectors) horizontal velocities appear. Observed and predicted vertical displacements are shown by color-coded large and small circles, respectively. The Xr^2 of this model is 3.9 (Table 7).
Distribution of coupling on the Sumatra megathrust derived from the formal inversion of the horizontal velocities and uplift rates derived from the CGPS measurements at the SuGAr stations (processed at SOPAC). To reduce the influence of postseismic deformation caused by the March 2005 Nias-Simeulue rupture, velocities were determined for the period between June 2005 and October 2006. (a) Distribution of coupling on the megathrust. Fully coupled areas are red and fully creeping areas are white. This model reveals strong coupling beneath the Mentawai Islands (Siberut, Sipora, and Pagai islands), offshore Padang city, and suggests that the megathrust south of Bengkulu city is creeping at the plate velocity. (b) Comparison of observed (green) and predicted (red) velocities. The Xr^2 associated to that model is 24.5 (Table 8).
Distribution of coupling on the Sumatra megathrust derived from the formal inversion of all the data (model J-a, Table 8). (a) Distribution of coupling on the megathrust. Fully coupled areas are red, and fully creeping areas are white. This model shows strong coupling beneath Nias island and beneath the Mentawai (Siberut, Sipora and Pagai) islands. The rate of accumulation of moment deficit is 4.5 X 10^20 N m/a. (b) Comparison of observed (black arrows for pre-2004 Sumatra-Andaman earthquake and green arrows for post-2005 Nias earthquake) and predicted velocities (in red). Observed and predicted vertical displacements are shown by color-coded large and small circles (for the corals) and large and small diamonds (for the CGPS), respectively. The Xr^2 of this model is 12.8.
Comparison of interseismic coupling along the megathrust with the rupture areas of the great 1797, 1833, and 2005 earthquakes. The southernmost rupture area of the 2004 Sumatra-Andaman earthquake lies north of our study area and is shown only for reference. Epicenters of the 2007 Mw 8.4 and Mw 7.9 earthquakes are also shown for reference. (a) Geometry of the locked fault zone corresponding to forward model F-f (Figure 6c). Below the Batu Islands, where coupling occurs in a narrow band, the largest earthquake for the past 260 years has been a Mw 7.7 in 1935 [Natawidjaja et al., 2004; Rivera et al., 2002]. The wide zones of coupling, beneath Nias, Siberut, and Pagai islands, coincide well with the source of great earthquakes (Mw > 8.5) in 2005 from Konca et al. [2007] and in 1797 and 1833 from Natawidjaja et al. [2006]. The narrow locked patch beneath the Batu islands lies above the subducting fossil Investigator Fracture Zone. (b) Distribution of interseismic coupling corresponding to inverse model J-a (Figure 10). The coincidence of the high coupling area (orange-red dots) with the region of high coseismic slip during the 2005 Nias-Simeulue earthquake suggests that strongly coupled patches during interseismic correspond to seismic asperities during megathrust ruptures. The source regions of the 1797 and 1833 ruptures also correlate well with patches that are highly coupled beneath Siberut, Sipora, and Pagai islands.
Latitudinal distributions of seismic moment released by great historical earthquakes and of accumulated deficit of moment due to interseismic locking of the plate interface. Values represent integrals over half a degree of latitude. Accumulated interseismic deficits since 1797, 1833, and 1861 are based on (a) model F-f and (b) model J-a. Seismic moments for the 1797 and 1833 Mentawai earthquakes are estimated based on the work by Natawidjaja et al. [2006], the 2005 Nias-Simeulue earthquake is taken from Konca et al. [2007], and the 2004 Sumatra-Andaman earthquake is taken from Chlieh et al. [2007]. Postseismic moments released in the month that follows the 2004 earthquake and in the 11 months that follows the Nias-Simeulue 2005 earthquake are shown in red and green, respectively, based on the work by Chlieh et al. [2007] and Hsu et al. [2006].
There was a deep focus earthquake in the Philippines today. This shaker was located near the city of Manila (I live in Manila. Manila, California). The hypocenter was quite deep (168 km) so (a) had lesser shaking due to the distance to the earthquake from Earth’s surface and (b) was not related to the subduction zone fault. Seismicity associated with the megathrust fault is typically less than 40 km or so. As the oceanic lithosphere dives into the upper mantle, there are lots of processes that can lead to earthquakes (e.g. internal deformation due to bending of the slab). Many are familiar with extensional earthquakes in this region (e.g. the 2001 Nisqually Earthquake in Washington, USA). But, today’s earthquake is compressional. I plot the seismicity from the past month, with color representing depth and diameter representing magnitude (see legend). I also include USGS epicenters from 1917-2017 for magnitudes M ≥ 7.
(a) Present-day Philippine Sea and East Asian tectonic setting. Plate motion azimuths in Figure 1a are shown relative to stable Eurasia from the MORVEL model [deMets et al., 2010]. Paleomagnetic sample locations in Figure 3 are shown by the colored symbols. (b) Present-day differential velocities across the Philippine Sea plate boundaries calculated from MORVEL. The southeast Philippine Sea plate is strongly edge coupled to the Pacific plate through the Caroline Sea, which has Pacific-like velocities. HB, Huatung Basin; AP, Amami Plateau; DR, Daito Ridge; ODR, Oki-Daito Ridge; BR, Benham Rise; KPR, Kyushu-Palau ridge; MS, Molucca Sea minor plate; BH, Bird’s Head minor plate; Hal, Halmahera.
(a) EMAG2 gridded magnetic anomalies for the Philippine Sea and East Asia [Maus et al., 2009]. Plate motion azimuths as in Figure 1. (b) Philippine Sea gridded seafloor spreading model used in this study (modified from Müller et al. [2008] and Seton et al. [2012]). WPB, West Philippine Basin; SB, Shikoku Basin; PVB, Parece Vela Basin; MT, Mariana Trough; DRP, Daito ridges province; PB, Palau Basin; L, Luzon; KPR, Kyushu-Palau ridge; HB, Huatung Basin.
(a) MITP08 tomographic cross section oriented along the mean 0 to 50Ma Pacific convergence direction showing the subvertical Pacific “slab wall” under the central Marianas. (b) Maximum E-W width of the Pacific slab wall anomaly under the northern and central Marianas calculated from a 0% dVp cutoff along three transects. (c) Pacific slab wall from Figure 15a shown undistorted within spherical Earth model. Three possible Pacific slab areas A to C (dashed colored lines) were picked from the tomographic section that were guided by dVp cutoffs of 0.2% to 0%, respectively. We measured unfolded slab lengths between 3041 km and 4447 km for areas A to C using cross-sectional area unfolding (for method, see Figure 8). Our unfolded slab lengths were corrected for PREM density-depth changes [Dziewonski and Anderson, 1981] and assumed an incoming 100 km thick Pacific slab. (d) Total Pacific slab subduction times for slab areas A to C was 48 ± 10 Ma, based on a comparison of unfolded Pacific slab lengths to the Pacific convergence rate at the central Marianas from Seton et al. [2012].
(a to f) Interpreted slabs and mantle structure under East Asia from MITP08 tomography vertical cross sections. The study area is dominated by subhorizontal, relatively lower amplitude detached slabs at 500 to 1100 km depths that we call the East Asian Sea slabs. Inset map shows section locations. Seismicity shown by red dots. AUS, Australian craton; Ayu, deep Ayu Trough slab; BMS, Bismarck Sea; MS, Molucca Sea slab; NH, New Hebrides slab; OR, Ordos block; Pac, Pacific slabs; PP, proto-Pacific slabs; PSCS, proto-South China Sea slabs; PSP, Philippine Sea plate; PT, Philippine Trench slab; Ryu, Philippine Sea Ryukyu slab; SCS, South China Sea and Eurasian slabs; Shk, Philippine Sea Shikoku slab; SMar, southern Marianas detached slab; SolE, Solomon east slab; SolW, Solomon west slab; SolS, Solomon south slab; SS, Solomon Sea plate; Sulu, Sulu Sea slab; Su, Sunda slabs.
Slab constraints for the SW Philippine Sea and surrounding areas. (a) Philippine Trench slab, Molucca Sea slabs, and detached “deep Ayu Trough” midslab maps. (b) Three-dimensional oblique view from west showing projected seismicity within 50 km of the Philippine Trench and Molucca Sea west midslab surfaces. (c) Unfolded Philippine Trench and Molucca Sea slabs colored by their dVp midslab seismic velocities. (d and e) MITP08 vertical tomographic cross sections and Benioff zone seismicity (red spheres) showing the interpreted fast-slab anomalies. Section locations are shown in Figure 21a. Note that the unfolded Molucca Sea slab in Figure 21c was the minimumlength model. A longer unfolded Molucca Sea slab is possible based on possible deeper (>900 km) anomalies in Figure 21b and the slab buckling in Figure 21e. PSP, Philippine Sea plate; Phil, Philippines; MS, Molucca Sea.
Eurasian slab constraints shown by (a) map of Benioff zone seismicity within 50 km of the midslab surface, (b) Eurasia midslab depth map. (c) Unfolded Eurasian slab colored by its intraslab seismic velocity dVp. The unfolded Eurasian slab has a 400 to 500 km E-W width and has an eastern edge that terminates near Ishigaki at the Ryukyu Islands. Similarly, the unfolded northern proto-South China Sea detached slabs shown by the purple dashed line also have a similar eastern limit. This suggests a linked origin, namely, that the South China Sea opened as a back-arc basin through subduction of the proto-South China Sea. (d) Three dimensional visualization of the subvertical Eurasian midslab surface between Taiwan and Palawan. Coastlines in white.
Preferred Philippine Sea plate reconstruction Model 1 showing its origin near the Manus mantle plume (yellow dot). Stippled areas show the unfolded slab constraints from this study. Purple polygons show oceanic plateaus from Ishizuka et al. [2013] and the UTIG University of Texas LIPs database [Coffin, 2011]. HB, Huatung Basin.
Creeping state and seismicity of the Manila Trench. Megathrust creeping ratio was determined by Hsu et al. (2012) by inverting GPS data from shown sites (triangles); Galgana et al. (2007) reported almost 100% creeping based on similar data.
Plate boundary deformation and trench parallel gravity anomaly along the Manila subduction zone. (a) Black vectors are GPS station velocities in the Sunda fixed reference frame. Error ellipses indicate 95% confidence intervals of GPS velocities. Blue vectors are velocities corrected for fault locking effect on the Philippine Fault (PHF in (b)). The yellow–red color scale indicates plate convergence rate. Bathymetry is shown in grey scale. The inset shows the regional geography with a red box indicating the study area (b) The seismicity is in the time period between 1973 and 2010 from NEIC (the US Geological Survey National Earthquake Information Center). The moment magnitude is in the range between 4.6 and 7.7. Color scale indicates focal depth. (c) The shaded relief topography and estimated free-air TPGA on the Manila subduction zone (Sandwell and Smith, 2009). The color bar indicates the amplitude of TPGA values. The black barbed and dashed lines denote the Manila Trench and 50 km slab iso-depth, respectively. (d) The Bouguer TPGA at the Manila subduction zone.
Earthquake Report: 2018 Summary
However, our historic record is very short, so any thoughts about whether this year (or last, or next) has smaller (or larger) magnitude earthquakes than “normal” are limited by this small data set.
Here is a table of the earthquakes M ≥ 6.5.
Here is a plot showing the cumulative release of seismic energy. This summary is imperfect in several ways, but shows how only the largest earthquakes have a significant impact on the tally of energy release from earthquakes. I only include earthquakes M ≥ 6.5. Note how the M 7.5 Sulawesi earthquake and how little energy was released relative to the two M = 7.9 earthquakes.
Below is my summary poster for this earthquake year
This is a video that shuffles through the earthquake report posters of the year
2018 Earthquake Report Pages
Other Annual Summaries
2018 Earthquake Reports
General Overview of how to interact with these summaries
Background on the Earthquake Report posters
Magnetic Anomalies
2018.01.10 M 7.6 Cayman Trough
Based upon our knowledge of the plate tectonics of this region, I can interpret the fault plane solution for this earthquake. The M 7.6 earthquake was most likely a left-lateral strike-slip earthquake associated with the Swan fault.
2018.01.14 M 7.1 Peru
In the region of this M 7.1 earthquake, two large structures in the NP are the Nazca Ridge and the Nazca fracture zone. The Nazca fracture zone is a (probably inactive) strike-slip fault system. The Nazca Ridge is an over-thickened region of the NP, thickened as the NP moved over a hotspot located near Salas y Gomez in the Pacific Ocean east of Easter Island (Ray et al., 2012).
There are many papers that discuss how the ridge affects the shape of the megathrust fault here. The main take-away is that the NR is bull dozing into South America and the dip of the subduction zone is flat here. There is a figure below that shows the deviation of the subducting slab contours at the NR.
Well, I missed looking further into a key update paper and used figures from an older paper on my interpretive poster yesterday. Thanks to Stéphane Baize for pointing this out! Turns out, after their new analyses, the M 7.1 earthquake was in a region of higher seismogenic coupling, rather than low coupling (as was presented in my first poster).
Also, Dr. Robin Lacassin noticed (as did I) the paucity of aftershocks from yesterday’s M 7.1. This was also the case for the carbon copy 2013 M 7.1 earthquake (there was 1 M 4.6 aftershock in the weeks following the M 7.1 earthquake on 2013.09.25; there were a dozen M 1-2 earthquakes in Nov. and Dec. of 2013, but I am not sure how related they are to the M 7.1 then). I present a poster below with this in mind. I also include below a comparison of the MMI modeled estimates. The 2013 seems to have possibly generated more widespread intensities, even though that was a deeper earthquake.
2018.01.23 M 7.9 Gulf of Alaska
This is strange because the USGS fault plane is oriented east-west, leading us to interpret the fault plane solution (moment tensor or focal mechanism) as a left-lateral strike-slip earthquake. So, maybe this earthquake is a little more complicated than first presumed. The USGS fault model is constrained by seismic waves, so this is probably the correct fault (east-west).
I prepared an Earthquake Report for the 1964 Good Friday Earthquake here.
So, that being said, here is the animation I put together. I used the USGS query tool to get earthquakes from 1/22 until now, M ≥ 1.5. I include a couple inset maps presented in my interpretive posters. The music is copyright free. The animations run through twice.
Here is a screenshot of the 14 MB video embedded below. I encourage you to view it in full screen mode (or download it).
2018.02.16 M 7.2 Oaxaca, Mexico
The SSN has a reported depth of 12 km, further supporting evidence that this earthquake was in the North America plate.
This region of the subduction zone dips at a very shallow angle (flat and almost horizontal).
There was also a sequence of earthquakes offshore of Guatemala in June, which could possibly be related to the M 8.1 earthquake. Here is my earthquake report for the Guatemala earthquake.
The poster also shows the seismicity associated with the M 7.6 earthquake along the Swan fault (southern boundary of the Cayman trough). Here is my earthquake report for the Guatemala earthquake.2018.02.25 M 7.5 Papua New Guinea
This M 7.5 earthquake (USGS website) occurred along the Papua Fold and Thrust Belt (PFTB), a (mostly) south vergent sequence of imbricate thrust faults and associated fold (anticlines). The history of this PFTB appears to be related to the collision of the Australia plate with the Caroline and Pacific plates, the delamination of the downgoing oceanic crust, and then associated magmatic effects (from decompression melting where the overriding slab (crust) was exposed to the mantle following the delamination). More about this can be found in Cloos et al. (2005).
The aftershocks are still coming in! We can use these aftershocks to define where the fault may have slipped during this M 7.5 earthquake. As I mentioned yesterday in the original report, it turns out the fault dimension matches pretty well with empirical relations between fault length and magnitude from Wells and Coppersmith (1994).
The mapped faults in the region, as well as interpreted seismic lines, show an imbricate fold and thrust belt that dominates the geomorphology here (as well as some volcanoes, which are probably related to the slab gap produced by crust delamination; see Cloos et al., 2005 for more on this). I found a fault data set and include this in the aftershock update interpretive poster (from the Coordinating Committee for Geoscience Programmes in East and Southeast Asia, CCOP).
I initially thought that this M 7.5 earthquake was on a fault in the Papuan Fold and Thrust Belt (PFTB). Mark Allen pointed out on twitter that the ~35km hypocentral depth is probably too deep to be on one of these “thin skinned” faults (see Social Media below). Abers and McCaffrey (1988) used focal mechanism data to hypothesize that there are deeper crustal faults that are also capable of generating the earthquakes in this region. So, I now align myself with this hypothesis (that the M 7.5 slipped on a crustal fault, beneath the thin skin deformation associated with the PFTB. (thanks Mark! I had downloaded the Abers paper but had not digested it fully.2018.03.08 M 6.8 New Ireland
The main transform fault (Weitin fault) is ~40 km to the west of the USGS epicenter. There was a very similar earthquake on 1982.08.12 (USGS website).
This earthquake is unrelated to the sequence occurring on the island of New Guinea.
Something that I rediscovered is that there were two M 8 earthquakes in 1971 in this region. This testifies that it is possible to have a Great earthquake (M ≥ 8) close in space and time relative to another Great earthquake. These earthquakes do not have USGS fault plane solutions, but I suspect that these are subduction zone earthquakes (based upon their depth).
This transform system is capable of producing Great earthquakes too, as evidenced by the 2000.11.16 M 8.0 earthquake (USGS website). This is another example of two Great earthquakes (or almost 2 Great earthquakes, as the M 7.8 is not quite a Great earthquake) are related. It appears that the M 8.0 earthquake may have triggered teh M 7.8 earthquake about 3 months later (however at first glance, it seemed to me like the strike-slip earthquake might not increase the static coulomb stress on the subduction zone, but I have not spent more than half a minute thinking about this).Main Interpretive Poster with emag2
Earthquakes M≥ 6.5 with emag2
2018.03.26 M 6.6 New Britain
Today’s M 6.6 earthquake happened close in proximity to a M 6.3 from 2 days ago and a M 5.6 from a couple weeks ago. The M 5.6 may be related (may have triggered these other earthquakes), but this region is so active, it might be difficult to distinguish the effects from different earthquakes. The M 5.6 is much deeper and looks like it was in the downgoing Solomon Sea plate. It is much more likely that the M 6.3 and M 6.6 are related (I interpret that the M 6.3 probably triggered the M 6.6, or that M 6.3 was a foreshock to the M 6.6, given they are close in depth). Both M 6.3 and M 6.6 are at depths close to the depth of the subducting slab (the megathrust fault depth) at this location. So, I interpret these to be subduction zone earthquakes.
2018.03.26 M 6.9 New Britain
2018.04.02 M 6.8 Bolivia
We are still unsure what causes an earthquake at such great a depth. The majority of earthquakes happen at shallower depths, caused largely by the frictional between differently moving plates or crustal blocks (where earth materials like the crust behave with brittle behavior and not elastic behavior). Some of these shallow earthquakes are also due to internal deformation within plates or crustal blocks.
As plates dive into the Earth at subduction zones, they undergo a variety of changes (temperature, pressure, stress). However, because people cannot directly observe what is happening at these depths, we must rely on inferences, laboratory analogs, and other indirect methods to estimate what is going on.
So, we don’t really know what causes earthquakes at the depth of this Bolivia M 6.8 earthquake. Below is a review of possible explanations as provided by Thorne Lay (UC Santa Cruz) in an interview in response to the 2013 M 8.3 Okhotsk Earthquake.
2018.05.04 M 6.9 Hawai’i
Hawaii is an active volcanic island formed by hotspot volcanism. The Hawaii-Emperor Seamount Chain is a series of active and inactive volcanoes formed by this process and are in a line because the Pacific plate has been moving over the hotspot for many millions of years.
Southeast of the main Kilauea vent, the Pu‘u ‘Ö‘ö crater saw an elevation of lava into the crater, leading to overtopping of the crater (on 4/30/2018). Seismicity migrated eastward along the ERZ. This morning, there was a M 5.0 earthquake in the region of the Hilina fault zone (HFZ). I was getting ready to write something up, but I had other work that I needed to complete. Then, this evening, there was a M 6.9 earthquake between the ERZ and the HFZ.
There have been earthquakes this large in this region in the past (e.g. the 1975.1.29 M 7.1 earthquake along the HFZ). This earthquake was also most likely related to magma injection (Ando, 1979). The 1975 M 7.1 earthquake generated a small tsunami (Ando, 1979). These earthquakes are generally compressional in nature (including the earthquakes from today).
Today’s earthquake also generated a tsunami as recorded on tide gages throughout Hawaii. There is probably no chance that a tsunami will travel across the Pacific to have a significant impact elsewhere.Temblor Reports:
2018.05.05 Pele, the Hawai’i Goddess of Fire, Lightning, Wind, and Volcanoes
2018.05.06 Pele, la Diosa Hawaiana del Fuego, los Relámpagos, el Viento y los Volcanes de Hawái
2018.08.05 M 6.9 Lombok, Indonesia
However, it is interesting because the earthquake sequence from last week (with a largest earthquake with a magnitude of M 6.4) were all foreshocks to this M 6.9. Now, technically, these were not really foreshocks. The M 6.4 has an hypocentral (3-D location) depth of ~6 km and the M 6.9 has an hypocentral depth of ~31 km. These earthquakes are not on the same fault, so I would interpret that the M 6.9 was triggered by the sequence from last week due to static coulomb changes in stress on the fault that ruptured. Given the large difference in depths, the uncertainty for these depths is probably not sufficient to state that they may be on the same fault (i.e. these depths are sufficiently different that this difference is larger than the uncertainty of their locations).
I present a more comprehensive analysis of the tectonics of this region in my earthquake report for the M 6.4 earthquake here. I especially address the historic seismicity of the region there. This M 6.9 may have been on the Flores thrust system, while the earthquakes from last week were on the imbricate thrust faults overlying the Flores Thrust. See the map from Silver et al. (1986) below. I include the same maps as in my original report, but after those, I include the figures from Koulani et al. (2016) (the paper is available on researchgate).2018.08.15 M 6.6 Aleutians
The Andreanof Islands is one of the most active parts of the Aleutian Arc. There have been many historic earthquakes here, some of which have been tsunamigenic (in fact, the email that notified me of this earthquake was from the ITIC Tsunami Bulletin Board).
Possibly the most significant earthquake was the 1957 Andreanof Islands M 8.6 Great (M ≥ 8.0) earthquake, though the 1986 M 8.0 Great earthquake is also quite significant. As was the 1996 M 7.9 and 2003 M 7.8 earthquakes. Lest we forget smaller earthquakes, like the 2007 M 7.2. So many earthquakes, so little time.2018.08.18 M 8.2 Fiji
This earthquake is one of the largest earthquakes recorded historically in this region. I include the other Large and Great Earthquakes in the posters below for some comparisons.
Today’s earthquake has a Moment Magnitude of M = 8.2. The depth is over 550 km, so is very very deep. This region has an historic record of having deep earthquakes here. Here is the USGS website for this M 8.2 earthquake. While I was writing this, there was an M 6.8 deep earthquake to the northeast of the M 8.2. The M 6.8 is much shallower (about 420 km deep) and also a compressional earthquake, in contrast to the extensional M 8.2.
This M 8.2 earthquake occurred along the Tonga subduction zone, which is a convergent plate boundary where the Pacific plate on the east subducts to the west, beneath the Australia plate. This subduction zone forms the Tonga trench.2018.08.19 M 6.9 Lombok, Indonesia
Today there was an M 6.3 soon followed by an M 6.9 earthquake (and a couple M 5.X quakes).
These earthquakes have been occurring along a thrust fault system along the northern portion of Lombok, Indonesia, an island in the magamatic arc related to the Sunda subduction zone. The Flores thrust fault is a backthrust to the subduction zone. The tectonics are complicated in this region of the world and there are lots of varying views on the tectonic history. However, there has been several decades of work on the Flores thrust (e.g. Silver et al., 1986). The Flores thrust is an east-west striking (oriented) north vergent (dipping to the south) thrust fault that extends from eastern Java towards the Islands of Flores and Timor. Above the main thrust fault are a series of imbricate (overlapping) thrust faults. These imbricate thrust faults are shallower in depth than the main Flores thrust.
The earthquakes that have been happening appear to be on these shallower thrust faults, but there is a possibility that they are activating the Flores thrust itself. Perhaps further research will illuminate the relations between these shallower faults and the main player, the Flores thrust.
2018.08.21 M 7.3 Venezuela
The northeastern part of Venezuela lies a large strike-slip plate boundary fault, the El Pilar fault. This fault is rather complicated as it strikes through the region. There are thrust faults and normal faults forming ocean basins and mountains along strike.
Many of the earthquakes along this fault system are strike-slip earthquakes (e.g. the 1997.07.09 M 7.0 earthquake which is just to the southwest of today’s temblor. However, today’s earthquake broke my immediate expectations for strike-slip tectonics. There is a south vergent (dipping to the north) thrust fault system that strikes (is oriented) east-west along the Península de Paria, just north of highway 9, east of Carupano, Venezuela. Audenard et al. (2000, 2006) compiled a Quaternary Fault database for Venezuela, which helps us interpret today’s earthquake. I suspect that this earthquake occurred on this thrust fault system. I bet those that work in this area even know the name of this fault. However, looking at the epicenter and the location of the thrust fault, this is probably not on this thrust fault. When I initially wrote this report, the depth was much shallower. Currently, the hypocentral (3-D location) depth is 123 km, so cannot be on that thrust fault.
The best alternative might be the subduction zone associated with the Lesser Antilles.2018.08.24 M 7.1 Peru
While doing my lit review, I found the Okal and Bina (1994) paper where they use various methods to determine focal mechanisms for the some deep earthquakes in northern Peru. More about focal mechanisms below. These authors created focal mechanisms for the 1921 and 1922 deep earthquakes so they could lean more about the 1970 deep earthquake. Their seminal work here forms an important record of deep earthquakes globally. These three earthquakes are all extensional earthquakes, similar to the other deep earthquakes in this region. I label the 1921 and 1922 earthquakes a couplet on the poster.
There was also a pair of earthquakes that happened in November, 2015. These two earthquakes happened about 5 minutes apart. They have many similar characteristics, suggest that they slipped similar faults, if not the same fault. I label these as doublets also.
So, there may be a doublet companion to today’s M 7.1 earthquake. However, there may be not. There are examples of both (single and doublet) and it might not really matter for 99.99% of the people on Earth since the seismic hazard from these deep earthquakes is very low.
Other examples of doublets include the 2006 | 2007 Kuril Doublets (Ammon et al., 2008) and the 2011 Kermadec Doublets (Todd and Lay, 2013).2018.09.05 M 6.6 Hokkaido, Japan
This earthquake is in an interesting location. to the east of Hokkaido, there is a subduction zone trench formed by the subduction of the Pacific plate beneath the Okhotsk plate (on the north) and the Eurasia plate (to the south). This trench is called the Kuril Trench offshore and north of Hokkaido and the Japan Trench offshore of Honshu.
One of the interesting things about this region is that there is a collision zone (a convergent plate boundary where two continental plates are colliding) that exists along the southern part of the island of Hokkaido. The Hidaka collision zone is oriented (strikes) in a northwest orientation as a result of northeast-southwest compression. Some suggest that this collision zone is no longer very active, however, there are an abundance of active crustal faults that are spatially coincident with the collision zone.
Today’s M 6.6 earthquake is a thrust or reverse earthquake that responded to northeast-southwest compression, just like the Hidaka collision zone. However, the hypocentral (3-D) depth was about 33 km. This would place this earthquake deeper than what most of the active crustal faults might reach. The depth is also much shallower than where we think that the subduction zone megathrust fault is located at this location (the fault formed between the Pacific and the Okhotsk or Eurasia plates). Based upon the USGS Slab 1.0 model (Hayes et al., 2012), the slab (roughly the top of the Pacific plate) is between 80 and 100 km. So, the depth is too shallow for this hypothesis (Kuril Trench earthquake) and the orientation seems incorrect. Subduction zone earthquakes along the trench are oriented from northwest-southweast compression, a different orientation than today’s M 6.6.
So today’s M 6.6 earthquake appears to have been on a fault deeper than the crustal faults, possibly along a deep fault associated with the collision zone. Though I am not really certain. This region is complicated (e.g. Kita et al., 2010), but there are some interpretations of the crust at this depth range (Iwasaki et al., 2004) shown in an interpreted cross section below.Temblor Reports:
2018.09.06 Violent shaking triggers massive landslides in Sapporo Japan earthquake
2018.09.09 M 6.9 Kermadec
This earthquake was quite deep, so was not expected to generate a significant tsunami (if one at all).
There are several analogies to today’s earthquake. There was a M 7.4 earthquake in a similar location, but much deeper. These are an interesting comparison because the M 7.4 was compressional and the M 6.9 was extensional. There is some debate about what causes ultra deep earthquakes. The earthquakes that are deeper than about 40-50 km are not along subduction zone faults, but within the downgoing plate. This M 6.9 appears to be in a part of the plate that is bending (based on the Benz et al., 2011 cross section). As plates bend downwards, the upper part of the plate gets extended and the lower part of the plate experiences compression.2018.09.28 M 7.5 Sulawesi
This area of Indonesia is dominated by a left-lateral (sinistral) strike-slip plate boundary fault system. Sulawesi is bisected by the Palu-Kola / Matano fault system. These faults appear to be an extension of the Sorong fault, the sinistral strike-slip fault that cuts across the northern part of New Guinea.
There have been a few earthquakes along the Palu-Kola fault system that help inform us about the sense of motion across this fault, but most have maximum magnitudes mid M 6.
GPS and block modeling data suggest that the fault in this area has a slip rate of about 40 mm/yr (Socquet et al., 2006). However, analysis of offset stream channels provides evidence of a lower slip rate for the Holocene (last 12,000 years), a rate of about 35 mm/yr (Bellier et al., 2001). Given the short time period for GPS observations, the GPS rate may include postseismic motion earlier earthquakes, though these numbers are very close.
Using empirical relations for historic earthquakes compiled by Wells and Coppersmith (1994), Socquet et al. (2016) suggest that the Palu-Koro fault system could produce a magnitude M 7 earthquake once per century. However, studies of prehistoric earthquakes along this fault system suggest that, over the past 2000 years, this fault produces a magnitude M 7-8 earthquake every 700 years (Bellier et al., 2006). So, it appears that this is the characteristic earthquake we might expect along this fault.
Most commonly, we associate tsunamigenic earthquakes with subduction zones and thrust faults because these are the types of earthquakes most likely to deform the seafloor, causing the entire water column to be lifted up. Strike-slip earthquakes can generate tsunami if there is sufficient submarine topography that gets offset during the earthquake. Also, if a strike-slip earthquake triggers a landslide, this could cause a tsunami. We will need to wait until people take a deeper look into this before we can make any conclusions about the tsunami and what may have caused it.
My 2018.10.01 BC Newshour Interview
InSAR Analysis
Interferometric SAR (InSAR) utilizes two separate SAR data sets to determine if the ground surface has changed over time, the time between when these 2 data sets were collected. More about InSAR can be found here and here. Explaining the details about how these data are analyzed is beyond the scope of this report. I rely heavily on the expertise of those who do this type of analysis, for example Dr. Eric Fielding.
M 7.5 Landslide Model vs. Observation Comparison
Until these landslides are analyzed and compared with regions that did not fail in slope failure, we will not be able to reconstruct what happened… why some areas failed and some did not.
There are landslide slope stability and liquefaction susceptibility models based on empirical data from past earthquakes. The USGS has recently incorporated these types of analyses into their earthquake event pages. More about these USGS models can be found on this page.
I prepared some maps that compare the USGS landslide and liquefaction probability maps. Below I present these results along with the MMI contours. I also include the faults mapped by Wilkinson and Hall (2017). Shown are the cities of Donggala and Palu. Also shown are the 2 tide gage locations (Pantoloan Port – PP and Mumuju – M). I also used post-earthquake satellite imagery to outline the largest landslides in Palu Valley, ones that appear to be lateral spreads.
Temblor Reports:
2018.09.28 The Palu-Koro fault ruptures in a M=7.5 quake in Sulawesi, Indonesia, triggering a tsunami and likely more shocks
2018.10.03 Tsunami in Sulawesi, Indonesia, triggered by earthquake, landslide, or both
2018.10.16 Coseismic Landslides in Sulawesi, Indonesia
2018.10.10 M 7.0 New Britain, PNG
The subduction zone forms the New Britain Trench with an axis that trends east-northeast. To the east of New Britain, the subduction zone bends to the southeast to form the San Cristobal and South Solomon trenches. Between these two subduction zones is a series of oceanic spreading ridges sequentially offset by transform (strike slip) faults.
Earthquakes along the megathrust at the New Britain trench are oriented with the maximum compressive stress oriented north-northwest (perpendicular to the trench). Likewise, the subduction zone megathrust earthquakes along the S. Solomon trench compress in a northeasterly direction (perpendicular to that trench).
There is also a great strike slip earthquake that shows that the transform faults are active.
This earthquake was too small and too deep to generate a tsunami.Temblor Reports:
2018.10.10 M 7.5 Earthquake in New Britain, Papua New Guinea
2018.10.22 M 6.8 Explorer plate
The Juan de Fuca plate is created at an oceanic spreading center called the Juan de Fuca Ridge. This spreading ridge is offset by several transform (strike-slip) faults. At the southern terminus of the JDF Ridge is the Blanco fault, a transtensional transform fault connecting the JDF and Gorda ridges.
At the northern terminus of the JDF Ridge is the Sovanco transform fault that strikes to the northwest of the JDF Ridge. There are additional fracture zones parallel and south of the Sovanco fault, called the Heck, Heckle, and Springfield fracture zones.
The first earthquake (M = 6.6) appears to have slipped along the Sovanco fault as a right-lateral strike-slip earthquake. Then the M 6.8 earthquake happened and, given the uncertainty of the location for this event, occurred on a fault sub-parallel to the Sovanco fault. Then the M 6.5 earthquake hit, back on the Sovanco fault.2018.10.25 M 6.8 Greece
Both of those earthquakes were right-lateral strike-slip earthquakes associated with the Kefallonia fault.
However, today’s earthquake sequence was further to the south and east of the strike-slip fault, in a region experiencing compression from the Ionian Trench subduction zone. But there is some overlap of these different plate boundaries, so the M 6.8 mainshock is an oblique earthquake (compressional and strike-slip). Based upon the sequence, I interpret this earthquake to be right-lateral oblique. I could be wrong.
Temblor Reports:
2018.10.26 Greek earthquake in a region of high seismic hazard
2018.11.08 M 6.8 Mid Atlantic Ridge (Jan Mayen fracture zone)
North of Iceland, the MAR is offset by many small and several large transform faults. The largest transform fault north of Iceland is called the Jan Mayen fracture zone, which is the location for the 2018.11.08 M = 6.8 earthquake.
2018.11.30 M 7.0 Alaska
During the 1964 earthquake, the downgoing Pacific plate slipped past the North America plate, including slip on “splay faults” (like the Patton fault, no relation, heheh). There was deformation along the seafloor that caused a transoceanic tsunami.
The Pacific plate has pre-existing zones of weakness related to fracture zones and spreading ridges where the plate formed and are offset. There was an earthquake in January 2016 that may have reactivated one of these fracture zones. This earthquake (M = 7.1) was very deep (~130 km), but still caused widespread damage.
The earthquake appears to have a depth of ~40 km and the USGS model for the megathrust fault (slab 2.0) shows the megathrust to be shallower than this earthquake. There are generally 2 ways that may explain the extensional earthquake: slab tension (the downgoing plate is pulling down on the slab, causing extension) or “bending moment” extension (as the plate bends downward, the top of the plate stretches out.Temblor Reports:
2018.11.30 Exotic M=7.0 earthquake strikes beneath Anchorage, Alaska
2018.12.11 What the Anchorage earthquake means for the Bay Area, Southern California, Seattle, and Salt Lake City
2018.12.05 M 7.5 New Caledonia
This part of the plate boundary is quite active and I have a number of earthquake reports from the past few years (see below, a list of earthquake reports for this region).
But the cool thing from a plate tectonics perspective is that there was a series of different types of earthquakes. At first view, it appears that there was a mainshock with a magnitude of M = 7.5. There was a preceding M 6.0 earthquake which may have been a foreshock.
The M 7.5 earthquake was an extensional earthquake. This may be due to either extension from slab pull or due to extension from bending of the plate. More on this later.
Following the M 7.5, there was an M 6.6 earthquake, however, this was a thrust or reverse (compressional) earthquake. The M 6.6 may have been in the upper plate or along the subduction zone megathrust fault, but we won’t know until the earthquake locations are better determined.
A similar sequence happened in October/November 2017. I prepared two reports for this sequence here and here. Albeit, in 2017, the thrust earthquake was first (2017.10.31 vs. 2017.11.19).
There have been some observations of tsunami. Below is from the Pacific Tsunami Warning Center.
2018.12.20 M 7.4 Bering Kresla
This earthquake happened in an interesting region of the world where there is a junction between two plate boundaries, the Kamchatka subduction zone with the Aleutian subduction zone / Bering-Kresla Shear Zone. The Kamchatka Trench (KT) is formed by the subduction (a convergent plate boundary) beneath the Okhotsk plate (part of North America). The Aleutian Trench (AT) and Bering-Kresla Shear Zone (BKSZ) are formed by the oblique subduction of the Pacific plate beneath the Pacific plate. There is a deflection in the Kamchatka subduction zone north of the BKSZ, where the subduction trench is offset to the west. Some papers suggest the subduction zone to the north is a fossil (inactive) plate boundary fault system. There are also several strike-slip faults subparallel to the BKSZ to the north of the BKSZ.
UPDATE #1
2018.12.29 M 7.0 Philippines
The earthquake was quite deep, which makes it less likely to cause damage to people and their belongings (e.g. houses and roads) and also less likely that the earthquake will trigger a trans-oceanic tsunami.
Here are the tidal data:
Geologic Fundamentals
Compressional:
Extensional:
Return to the Earthquake Reports page.
Earthquake Report: Bering Kresla / Pacific plate
At first, when I noticed the location, I hypothesized that this may be a strike-slip earthquake. womp womp. The earthquake mechanism from the USGS shows that this M = 7.4 earthquake was a normal fault earthquake (extension).
This earthquake happened in an interesting region of the world where there is a junction between two plate boundaries, the Kamchatka subduction zone with the Aleutian subduction zone / Bering-Kresla Shear Zone. The Kamchatka Trench (KT) is formed by the subduction (a convergent plate boundary) beneath the Okhotsk plate (part of North America). The Aleutian Trench (AT) and Bering-Kresla Shear Zone (BKSZ) are formed by the oblique subduction of the Pacific plate beneath the Pacific plate. There is a deflection in the Kamchatka subduction zone north of the BKSZ, where the subduction trench is offset to the west. Some papers suggest the subduction zone to the north is a fossil (inactive) plate boundary fault system. There are also several strike-slip faults subparallel to the BKSZ to the north of the BKSZ.
Today’s M = 7.4 earthquake shows northwest-southeast directed extension. This is consistent with slab tension in the direction of the Kurile subduction zone. It may also represent extension due to bending in the Pacific plate, but this seems less likely to me. Basically, the Pacific plate, as it subducts beneath the Okhotsk plate, the downgoing slab (the plate) exerts forces on the rest of the plate that pulls it down, into the subduction zone.
A second cool thing about this earthquake is that this may be evidence that the Kuril subduction zone extends north of the intersection of the BKSZ with Kamchatka. I discussed this in my earthquake report from 2017 here.
There are a couple analogy earthquakes, but one is the best. There were several strike-slip earthquakes nearby in 1982, 1987, and 1999. However, there was a M = 6.2 earthquake in almost the same location as the M = 7.4 from today. This M = 6.2 earthquake was slightly deeper (33 km) relative to the M = 7.4 (9.6 km).Check out my update here
Below is my interpretive poster for this earthquake
I plot the USGS fault plane solutions (moment tensors in blue and focal mechanisms in orange), possibly in addition to some relevant historic earthquakes.
Magnetic Anomalies
Age of Oceanic Lithosphere
I include some inset figures. Some of the same figures are located in different places on the larger scale map below.
Other Report Pages
Some Relevant Discussion and Figures
Kamchatka Depression (rift-like tectonic structure, which accommodates the northern end of EVB); SR—Sredinny Range. Distribution of Quaternary volcanic rocks in EVB and SR is shown in orange and green, respectively. Small dots are active vol canoes. Large circles denote CKD volcanoes: T—Tolbachik; K l — K l y u c h e v s k o y ; Z—Zarechny; Kh—Kharchinsky; Sh—Shiveluch; Shs—Shisheisky Complex; N—Nachikinsky. Location of profiles shown in Figures 2 and 3 is indicated. B: Three dimensional visualization of the Kamchatka subduction zone from the north. Surface relief is shown as semi-transparent layer. Labeled dashed lines and color (blue to red) gradation of subducting plate denote depths to the plate from the earth surface (in km). Bold arrow shows direction of Pacific Plate movement.
Geologic Fundamentals
Compressional:
Extensional:
Alaska | Kamchatka | Kurile
General Overview
Earthquake Reports
Social Media
Quake details: https://t.co/sCHEMhsY7g
Tsunami info: https://t.co/kIFgUWkdzj pic.twitter.com/15ixlcPRld
References:
Return to the Earthquake Reports page.
Earthquake Report: Iran
The M 7.3 earthquake was a reverse/thrust earthquake associated with tectonics of the Zagros fold and thrust belt. This plate boundary fault system is a section of the Alpide belt, a convergent plate boundary that extends from the west of the Straits of Gibraltar, through Europe (causing uplift of the Alps and subduction offshore of Greece), the Middle East, India (causing the uplift forming the Himalayas), then to end in eastern Indonesia (forming the continental collision zone between Australia and Indonesia).
Some of the earthquakes (including this one) are strike-slip earthquakes (see explanation of different earthquake types below in the geologic fundamentals section). So, one might ask why there are strike-slip earthquakes associated with a compressional earthquake?
As pointed out by Baptiste Gombert, these strike-slip earthquakes are are evidence of strain partitioning. Basically, when relative plate motion (the direction that plates are moving relative to each other) is not perpendicular or parallel to a tectonic fault, this oblique motion is partitioned into these perpendicular and parallel directions.
A great example of this type of strain partitioning is the plate boundary offshore of Sumatra where the India-Australia plate subducts beneath the Sunda plate (part of Eurasia). The plate boundary is roughly N45W (oriented to the northwest with an azimuth of 325°) and the relative plate motion direction is oriented closer to a north-south orientation. The relative plate motion perpendicular to the plate boundary is accommodated by earthquakes on the subduction. These earthquakes are oriented showing compression in a northeast direction. Along the axis of Sumatra is a huge strike-slip fault called the Great Sumatra fault. This fault is parallel to the plate boundary and accommodates relative plate motion parallel to the plate boundary. The Great Sumatra fault is a fault called a forearc sliver fault.
There are other examples of this elsewhere, like here in western Iran/eastern Iraq. Relative plate motion between the Arabia and Eurasia plates is oriented north-south, but the plate boundary is oriented northwest-southeast (just like the Sumatra example). So this oblique relative plate motion is partitioned into fault normal compression (the M 7.3 earthquake) and fault parallel shear (today’s M 6.3 earthquake).
There is also a strike-slip fault in the region of today’s M 6.3, the Khanaqin fault. So, given what we know about the tectonics and historic seismicity, I interpret today’s M 6.3 earthquake to have been a strike-slip earthquake associated with the Khanaqin fault, triggered by changes in stress by the M 7.3 earthquake. I could be incorrect and this earthquake could be unrelated to the > 7.3 earthquake.Below is my interpretive poster for this earthquake
I include an inset map showing seismicity from 2016.11.22 through 2018.11.28 showing the aftershocks from the M 7.3 earthquake. Note the cluster of earthquakes to the south of the aftershock zone. This is a swarm with earthquakes in the lower to mid M 5 range. The earthquakes with mechanisms are compressional, oriented the same as the M 7.3.
I plot the USGS fault plane solutions (moment tensors in blue and focal mechanisms in orange), possibly in addition to some relevant historic earthquakes.
I include some inset figures. Some of the same figures are located in different places on the larger scale map below.
Other Report Pages
Some Relevant Discussion and Figures
Geologic Fundamentals
Compressional:
Extensional:
Middle East
General Overview
Earthquake Reports
Social Media
UPDATE: 2018.11.26
This website automatically display coseismic deformation maps of recent M >= 6 earthquakes for rapid hazard evaluations. pic.twitter.com/gDqRceAHK7
References:
Earthquake Report: Hokkaido, Japan
Below is my interpretive poster for this earthquake
I plot the USGS fault plane solutions (moment tensors in blue and focal mechanisms in orange), possibly in addition to some relevant historic earthquakes.
I also include active crustal faults from the Coordinating Committee for Geoscience Programmes in East and Southeast Asia (CCOP). Note the abundance of north-northwest oriented yellow lines to the east of today’s earthquakes. While today’s earthquake was not on those crustal faults, the earthquakes and these faults are responding to similarly oriented tectonic stresses.
Magnetic Anomalies
I include some inset figures. Some of the same figures are located in different places on the larger scale map below.
Some Relevant Discussion and Figures
this study. The black crosses denote 3818 events (Group-1) that occurred under the seismic network. The green dots show 228 events (Group-2) that occurred outside the seismic network, selected from the events relocated by Gamage et al. (2009) using sP depth phases. The red dots denote 757 suboceanic earthquakes (Group-3) that are newly relocated in this work using P-wave, S-wave and sP depth-phase data. (d) East–west and (e) north–south vertical cross-sections of the earthquakes shown in (c).
Earthquake Triggered Landslides
Geologic Fundamentals
Compressional:
Extensional:
Japan | Izu-Bonin | Mariana
Earthquake Reports
Social Media
震度7を観測した厚真町では土砂崩れが相次ぎ、新千歳空港は閉鎖、札幌市内で液状化現象、全道で停電など広範囲で影響が出ています。
今後も大きな余震に警戒が必要です。https://t.co/Tfi8PeI3gr pic.twitter.com/ZeVKpjduA5
#nhk_news #ドローン #地震 #震度7 #厚真町
#土砂崩れ pic.twitter.com/jaSVW78yupUPDATE 2018.09.06
Credit: https://t.co/Cu6UjVmIpQ pic.twitter.com/sZd7E4MTDT
Source: https://t.co/7K2hfGwqM0
master and slave: 2018/08/23 & 2018/09/06 pic.twitter.com/zuLUM8nlbs
UPDATE 2018.09.07
UPDATE 2018.09.08
UPDATE 2018.09.09
UPDATE 2018.09.10
UPDATE 2018.09.11
今後も地殻変動の監視を続けていきます。
詳細はこちら→https://t.co/vDFA0hYtOd pic.twitter.com/ivFreV1bFL
UPDATE 2018.09.12
UPDATE 2018.09.16
References:
°
≥
ñEarthquake Report: Burma!
I initially thought this would be a strike-slip earthquake. However, the USGS fault plane solution (moment tensor, read more about them below) shows that this was a thrust (compressional) earthquake. There is a region of uplift to the west of the SF, where there is a fold and thrust belt (the Bago-Yoma Range). This region may be experiencing compression due to the relative plate motion here and the orientation of the SF (strain partitioning). There is a GPS rate map below that shows geodetic motion oblique to the SF, showing compression.
There were two M 7.2 and M 7.4 earthquakes just to the southeast in 1930 and an earthquake in 1994. The 1994 earthquake was a dextral strike-slip earthquake, but the 1930 earthquakes are too old to have this type of analytical results on the USGS website (see Sloan et al., 2017 figure below for the M 7.3 1930 earthquake, which shows a strike-slip mechanism).Below is my interpretive poster
I plot the USGS fault plane solutions (moment tensors in blue and focal mechanisms in orange) for the M 6.0 earthquake, in addition to some relevant historic earthquakes.
I include some inset figures.
USGS Earthquake Pages
These are from this current sequence
2018-01-11 18:26:24 UTC 18.429°N 96.087°E 10.0 km depth
https://earthquake.usgs.gov/earthquakes/eventpage/us2000cifa#executive
2018-01-11 18:38:12 UTC 18.334°N 96.098°E 10.0 km depth
https://earthquake.usgs.gov/earthquakes/eventpage/us2000cifm#executive
2018-01-11 18:42:59 UTC 18.448°N 96.175°E 10.0 km depth
https://earthquake.usgs.gov/earthquakes/eventpage/us2000cifw#executive
2018-01-11 18:43:59 UTC 18.440°N 96.062°E 10.0 km depth
https://earthquake.usgs.gov/earthquakes/eventpage/us2000cig2#executive
These are from earlier
1994-08-19 21:02:45 UTC 17.974°N 96.415°E 12.3 km depth
https://earthquake.usgs.gov/earthquakes/eventpage/usp0006h6h#executiveSome Relevant Discussion and Figures
Social Media
India | Asia | India Ocean
General Overview
Earthquake Reports
References:
Earthquake Report: Iran
While putting together my annual summary for 2017, I wanted to include a poster that shows these two earthquakes as they relate to regional historic seismicity (with fault plane solutions).Below is my interpretive poster for this earthquake.
I plot the USGS fault plane solutions (moment tensors in blue and focal mechanisms in orange) for the M 6.1 earthquake. I also include USGS fault plane solutions for most of the earthquakes in the region.
I include some inset figures.
Here are the USGS pages for the main earthquake in this sequence.
Iraq
Iran
Historic
1976-11-24 12:22:18 UTC 39.121°N 44.029°E 36.0 km depth
https://earthquake.usgs.gov/earthquakes/eventpage/usp0000kf0#executive
1977-03-21 21:18:54 UTC 27.609°N 56.393°E 29.0 km depth
https://earthquake.usgs.gov/earthquakes/eventpage/usp0000n1c#executive
1977-03-21 21:18:54 UTC 27.609°N 56.393°E 29.0 km depth
https://earthquake.usgs.gov/earthquakes/eventpage/usp0000n1c#executive
1978-09-16 15:35:56 UTC 33.386°N 57.434°E 33.0 km depth
https://earthquake.usgs.gov/earthquakes/eventpage/usp0000wjx#executive
1979-11-27 17:10:32 UTC 33.962°N 59.726°E 10.0 km depth
https://earthquake.usgs.gov/earthquakes/eventpage/usp000147t#executive
1981-07-28 17:22:24 UTC 30.013°N 57.794°E 33.0 km depth
https://earthquake.usgs.gov/earthquakes/eventpage/usp0001ezf#executive
1983-04-18 10:58:51 UTC 27.793°N 62.054°E 64.0 km depth
https://earthquake.usgs.gov/earthquakes/eventpage/usp0001uj8#executive
1990-06-20 21:00:09 UTC 36.957°N 49.409°E 18.5 km depth
https://earthquake.usgs.gov/earthquakes/eventpage/usp0004arq#executive
1990-11-06 18:45:52 UTC 28.251°N 55.462°E 10.6 km depth
https://earthquake.usgs.gov/earthquakes/eventpage/usp0004gkf#executive
1997-02-04 10:37:47 UTC 37.661°N 57.291°E 10.0 km depth
https://earthquake.usgs.gov/earthquakes/eventpage/usp0007wrr#executive
1997-05-10 07:57:29 UTC 33.825°N 59.809°E 10.0 km depth
https://earthquake.usgs.gov/earthquakes/eventpage/usp000820p#executive
1998-03-14 19:40:27 UTC 30.154°N 57.605°E 9.0 km depth
https://earthquake.usgs.gov/earthquakes/eventpage/usp0008hg7#executive
1999-03-04 05:38:26 UTC 28.343°N 57.193°E 33.0 km depth
https://earthquake.usgs.gov/earthquakes/eventpage/usp00093tj#executive
2003-12-26 01:56:52 UTC 28.995°N 58.311°E 10.0 km depth
https://earthquake.usgs.gov/earthquakes/eventpage/usp000cg2d#executive
2010-12-20 18:41:59 UTC 28.412°N 59.180°E 12.0 km depth
https://earthquake.usgs.gov/earthquakes/eventpage/usp000hr7k#executive
2011-10-23 10:41:23 UTC 38.721°N 43.508°E 18.0 km depth
https://earthquake.usgs.gov/earthquakes/eventpage/usp000j9rr#executive
2013-04-16 10:44:20 UTC 28.033°N 61.996°E 80.0 km depth
https://earthquake.usgs.gov/earthquakes/eventpage/usb000g7x7#executive
2013-09-24 11:29:47 UTC 26.951°N 65.501°E 15.0 km depth
https://earthquake.usgs.gov/earthquakes/eventpage/usb000jyiv#executive
Middle East
General Overview
Earthquake Reports
References
Earthquake Report: Iraq
This was a damaging earthquake and is the most deadly for 2017. Over 500 people were killed and thousands were injured.
I post lots of material below that was developed in the 6 weeks following the earthquake.
There is a page here with some photos of the damage: Earthquake-Report.com.Below is my interpretive poster for this earthquake.
I plot the USGS fault plane solutions (moment tensors in blue) for the M 7.3 earthquake.
Here are the USGS pages for the main earthquake in this sequence.
I include some inset figures.
2007). I place a green star in the general location of the M 7.3 earthquake. Note that this M 7.3 earthquake happened along the Bitis-Zagros Fold Belt.
Other Social Media Posts
Middle East
General Overview
Earthquake Reports
References
Earthquake Report: Bengkulu (Sumatra)!
This M 6.4 earthquake happened down-dip (“deeper than”) along the megathrust from the 2007.09.12 M 8.4 megathrust earthquake. Here is the USGS website for the M 8.4 earthquake. This M 6.4 earthquake occurred in a region of low seismogenic coupling (as inferred by Chlieh at al., 2008), albeit with sparse GPS data in this region. Chlieh et al. (2008) used coral geodetic and paleogeodetic data, along with Global Positioning System (GPS) observations, to constrain their model. Because there are no forearc islands in this part of the subduction zone, there are no GPS nor coral data with which to constrain their model (so it may underestimate the coupling %, i.e. coupling ratio).
Based upon the USGS fault plane slip model, this M 6.4 earthquake actually happened in a region of higher slip from the M 8.4 earthquake. We may consider this M 6.4 earthquake to be an aftershock of the M 8.4 earthquake.
Here is a report from earthquake-report.com.Below is my interpretive poster for this earthquake
I also include the USGS moment tensor for today’s earthquake, as well as for the 2007 M 8.4 earthquake. I label the other epicenters with large magnitudes (2004, 2005, and 2012). Find more details about these earthquakes in my reports listed at the bottom of this page, above the references.
I include some inset figures in the poster.
Indonesia | Sumatra
General Overview
Earthquake Reports
References:
Earthquake Report: Philippines!
Here is the USGS website for today’s M 6.2 earthquake.
There was a series of earthquakes earlier this year and here is my earthquake report for those earthquakes.
Here is a report from earthquake report dot com.Below is my interpretive poster for this earthquake
I also include the USGS moment tensor for today’s earthquake, as well as for the other historic earthquake in the region that had a similarly deep focus (the 1985.04.23 M 7.0 earthquake). The 1985 earthquake was an extensional earthquake and slightly deeper (188 km).
I include some inset figures in the poster.
Philippines
Earthquake Reports
References: