- Summary of Reports for the Ridgecrest Earthquake Sequence
There have been well over 1000 aftershocks with magnitudes M ≥ 0.5.
Last night there was the largest aftershock (so far) a magnitude M 5.4 earthquake.
It is clear that this sequence has involved at least 2 main faults. I interpret the mainshock (the M 6.4) to be on a northeast trending (striking) left-lateral strike-slip fault. This is largely because (1) the longer of the 2 aftershock trends is has this orientation and (2) the majority of field observations of surface rupture are along this orientation. The M 5.4 aftershock is located along the right-lateral northwest trending fault. The M 6.4 could be on the nw striking fault.
Lots of information about the regional tectonics is in my original report, so I won’t rehash that here.
- I present two summaries below:
- A video showing seismicity for the past day or two.
- An updated seismicity map.
https://earthquake.usgs.gov/earthquakes/eventpage/ci38457511/executive
Seismicity Visualization
- I use the USGS earthquake website to query for earthquakes for a given time range, spatial extent, and minimum magnitude. Using the query results, I export these data as a text file (for the GIS based maps) and as Google Earth kmz files.
- I use the animated version of the kmz, use computer software to capture the animation, and then do some video editing with this software. The music is copyright free.
Updated Seismicity Map
- I plot the seismicity from the past month, with color representing depth and diameter representing magnitude (see legend). I include earthquake epicenters from 1919-2019 with magnitudes M ≥ 5.0 in one version.
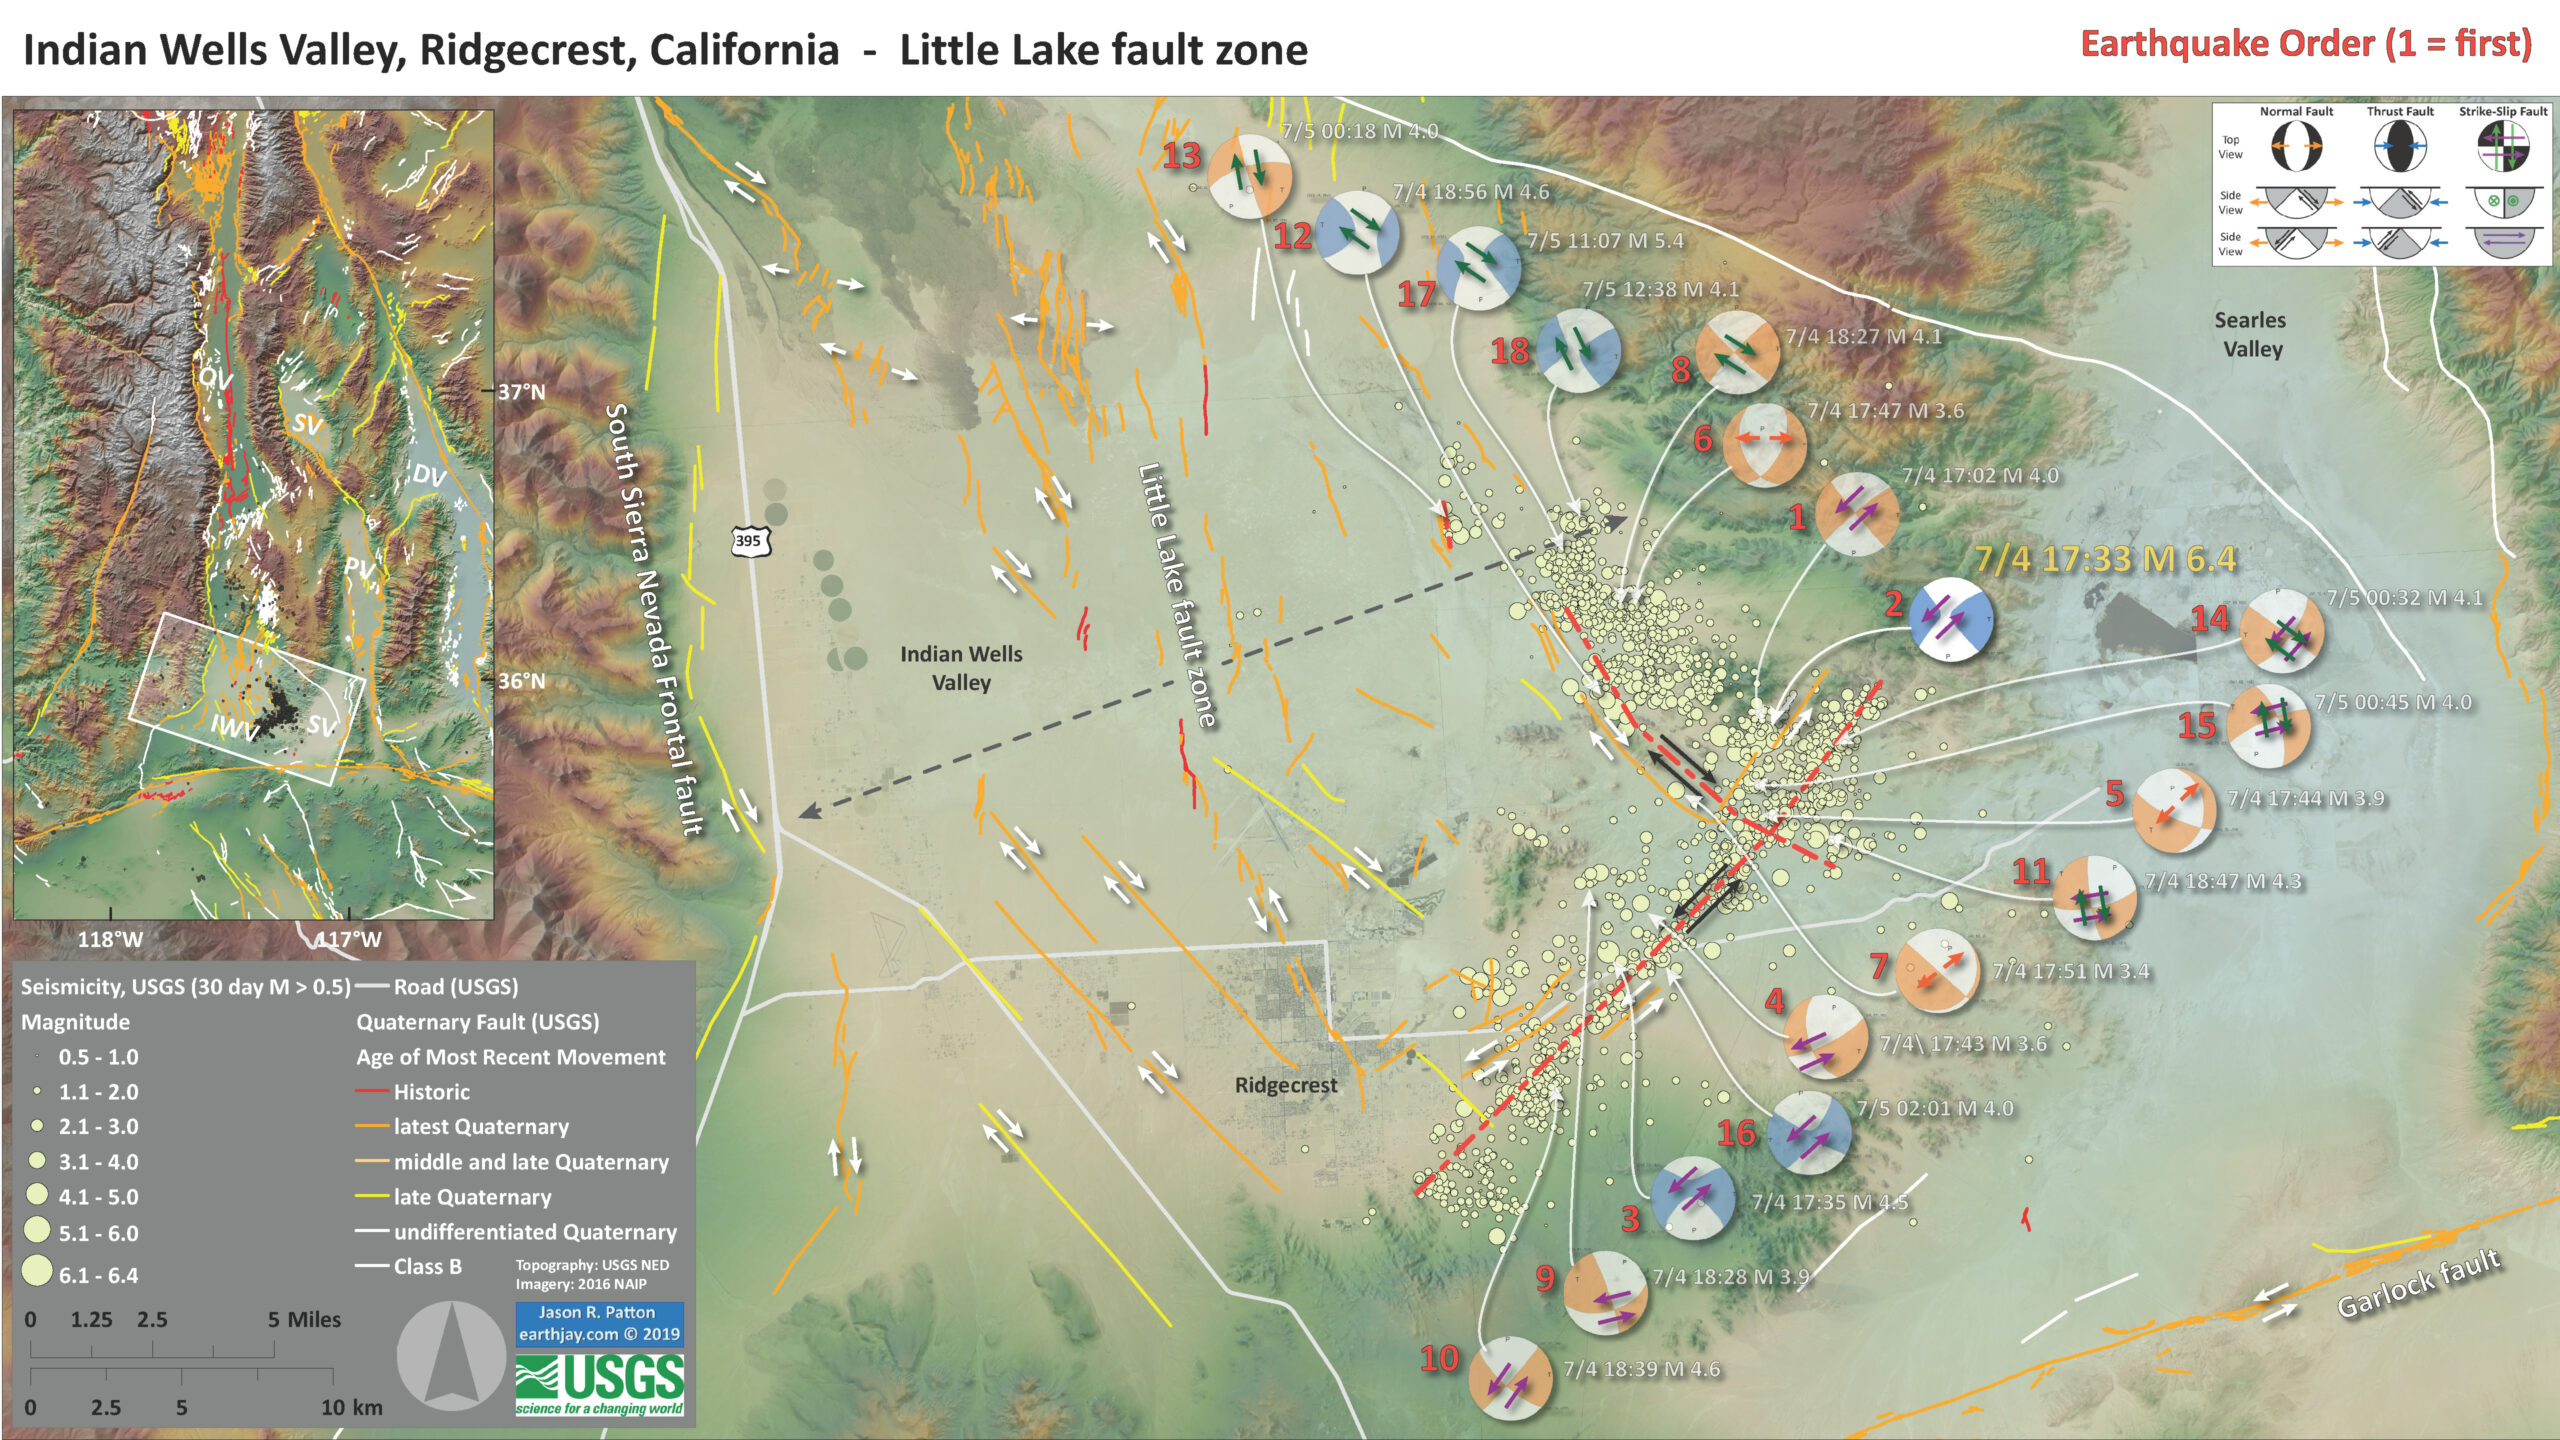
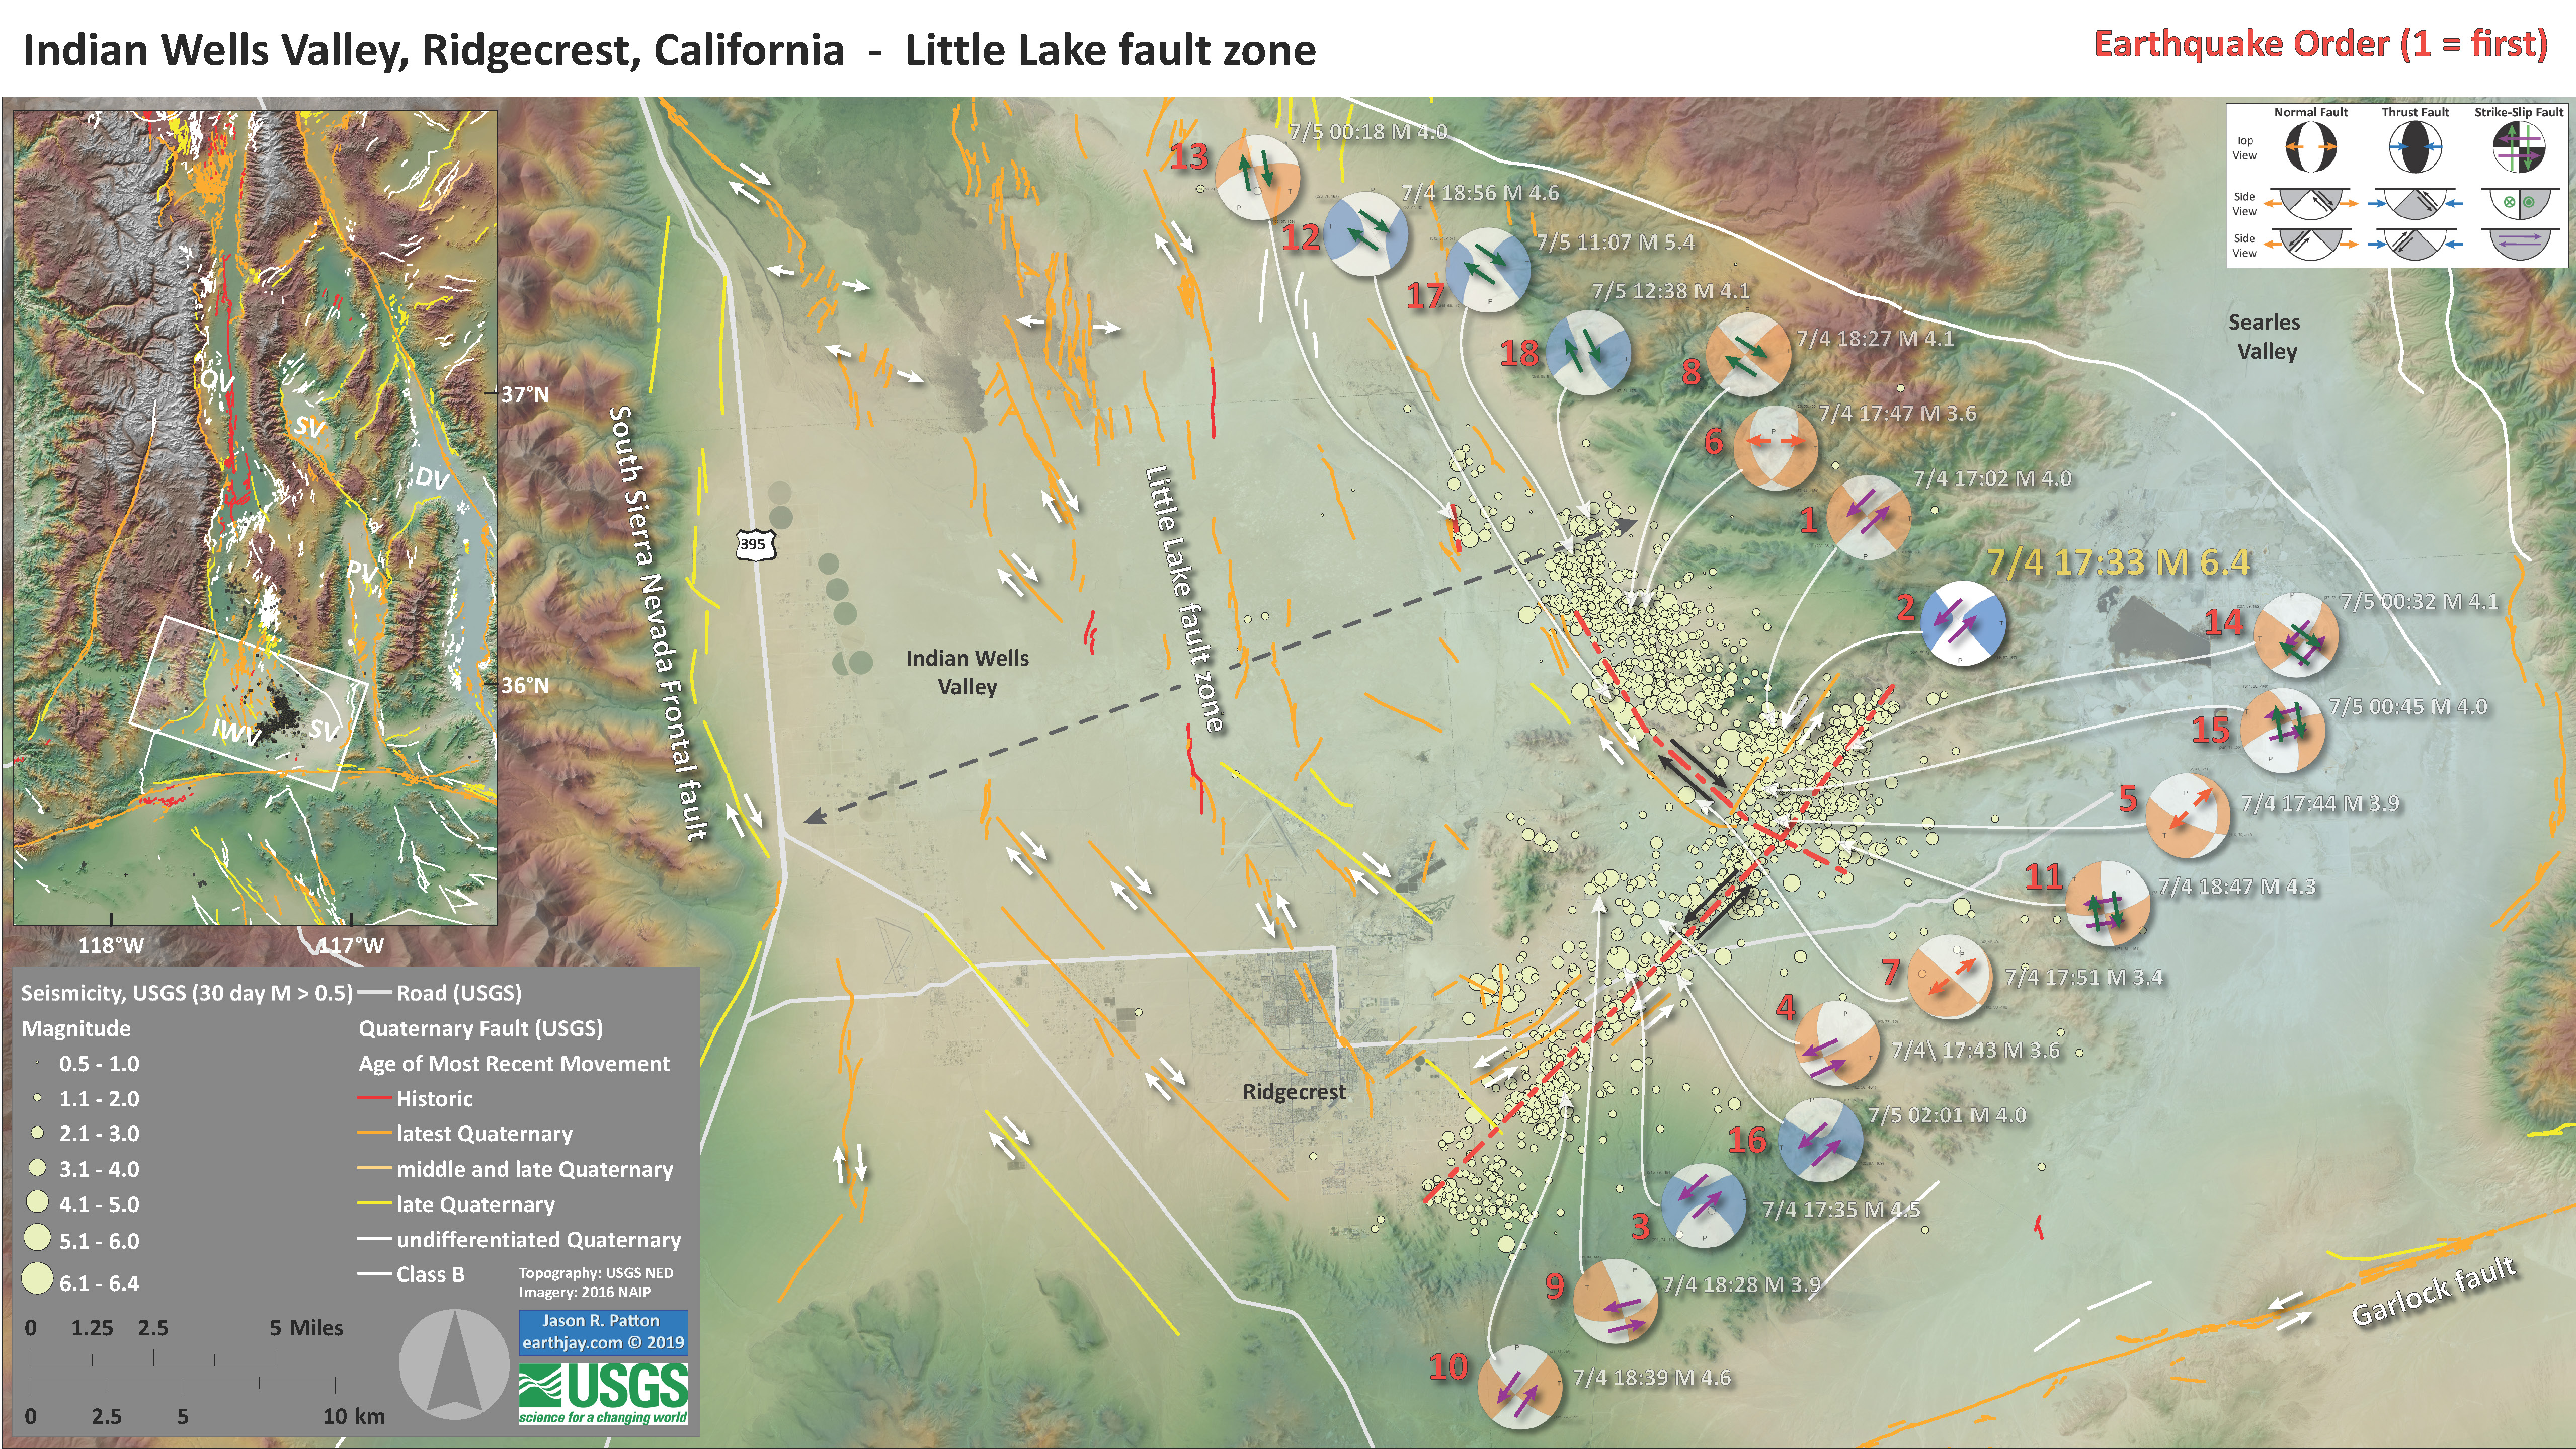
- I plot the USGS fault plane solutions (moment tensors in blue and focal mechanisms in orange) for the earthquakes for which the USGS has prepared earthquake mechanism plots. Read more about these plots in my original report under “Geologic Fundamentals” at the bottom of the report.
- I label these earthquakes relative to the date and time of their ocurrence. I also label them in red in order of appearance. There was a M 4.0 foreshock to the M 6.4 mainshock.
- It is not clear, for some quakes, which fault they are on, so i include both nodal plane solutions (purple and green arrows). Obviously, these are just my interpretations based on a simple overlay with the faults. Upon more rigorous analysis, we will learn more about how these earthquakes relate to each other.
- I place red dashed lines in the general location of the proposed faults involved in this sequence. They are not well constrained, though the northeast striking fault is somewhat located where the surface rupture is located crossing Highway 178 (the major road that traverses Ridgecrest).
- Note that there are 3 normal faulting events (#5, 6, 7) and they happen at about the same time. As I mention in my original report, there are lots of normal faults mapped in this region.
- The northeast striking fault is about 22 km long and the northwest striking fault is about 17 km long (if the most westerly eqs are not included as they appear to be on a separate fault based on the gap in seismicity). Using Wells and Coppersmith (1995), I calculate that a 22 km long fault could produce a M 6.6 earthquake. This is pretty close to M 6.4 given the uncertainty in those fault magnitude : fault lenth relations.
LATE BREAKING NEWS
UPDATE
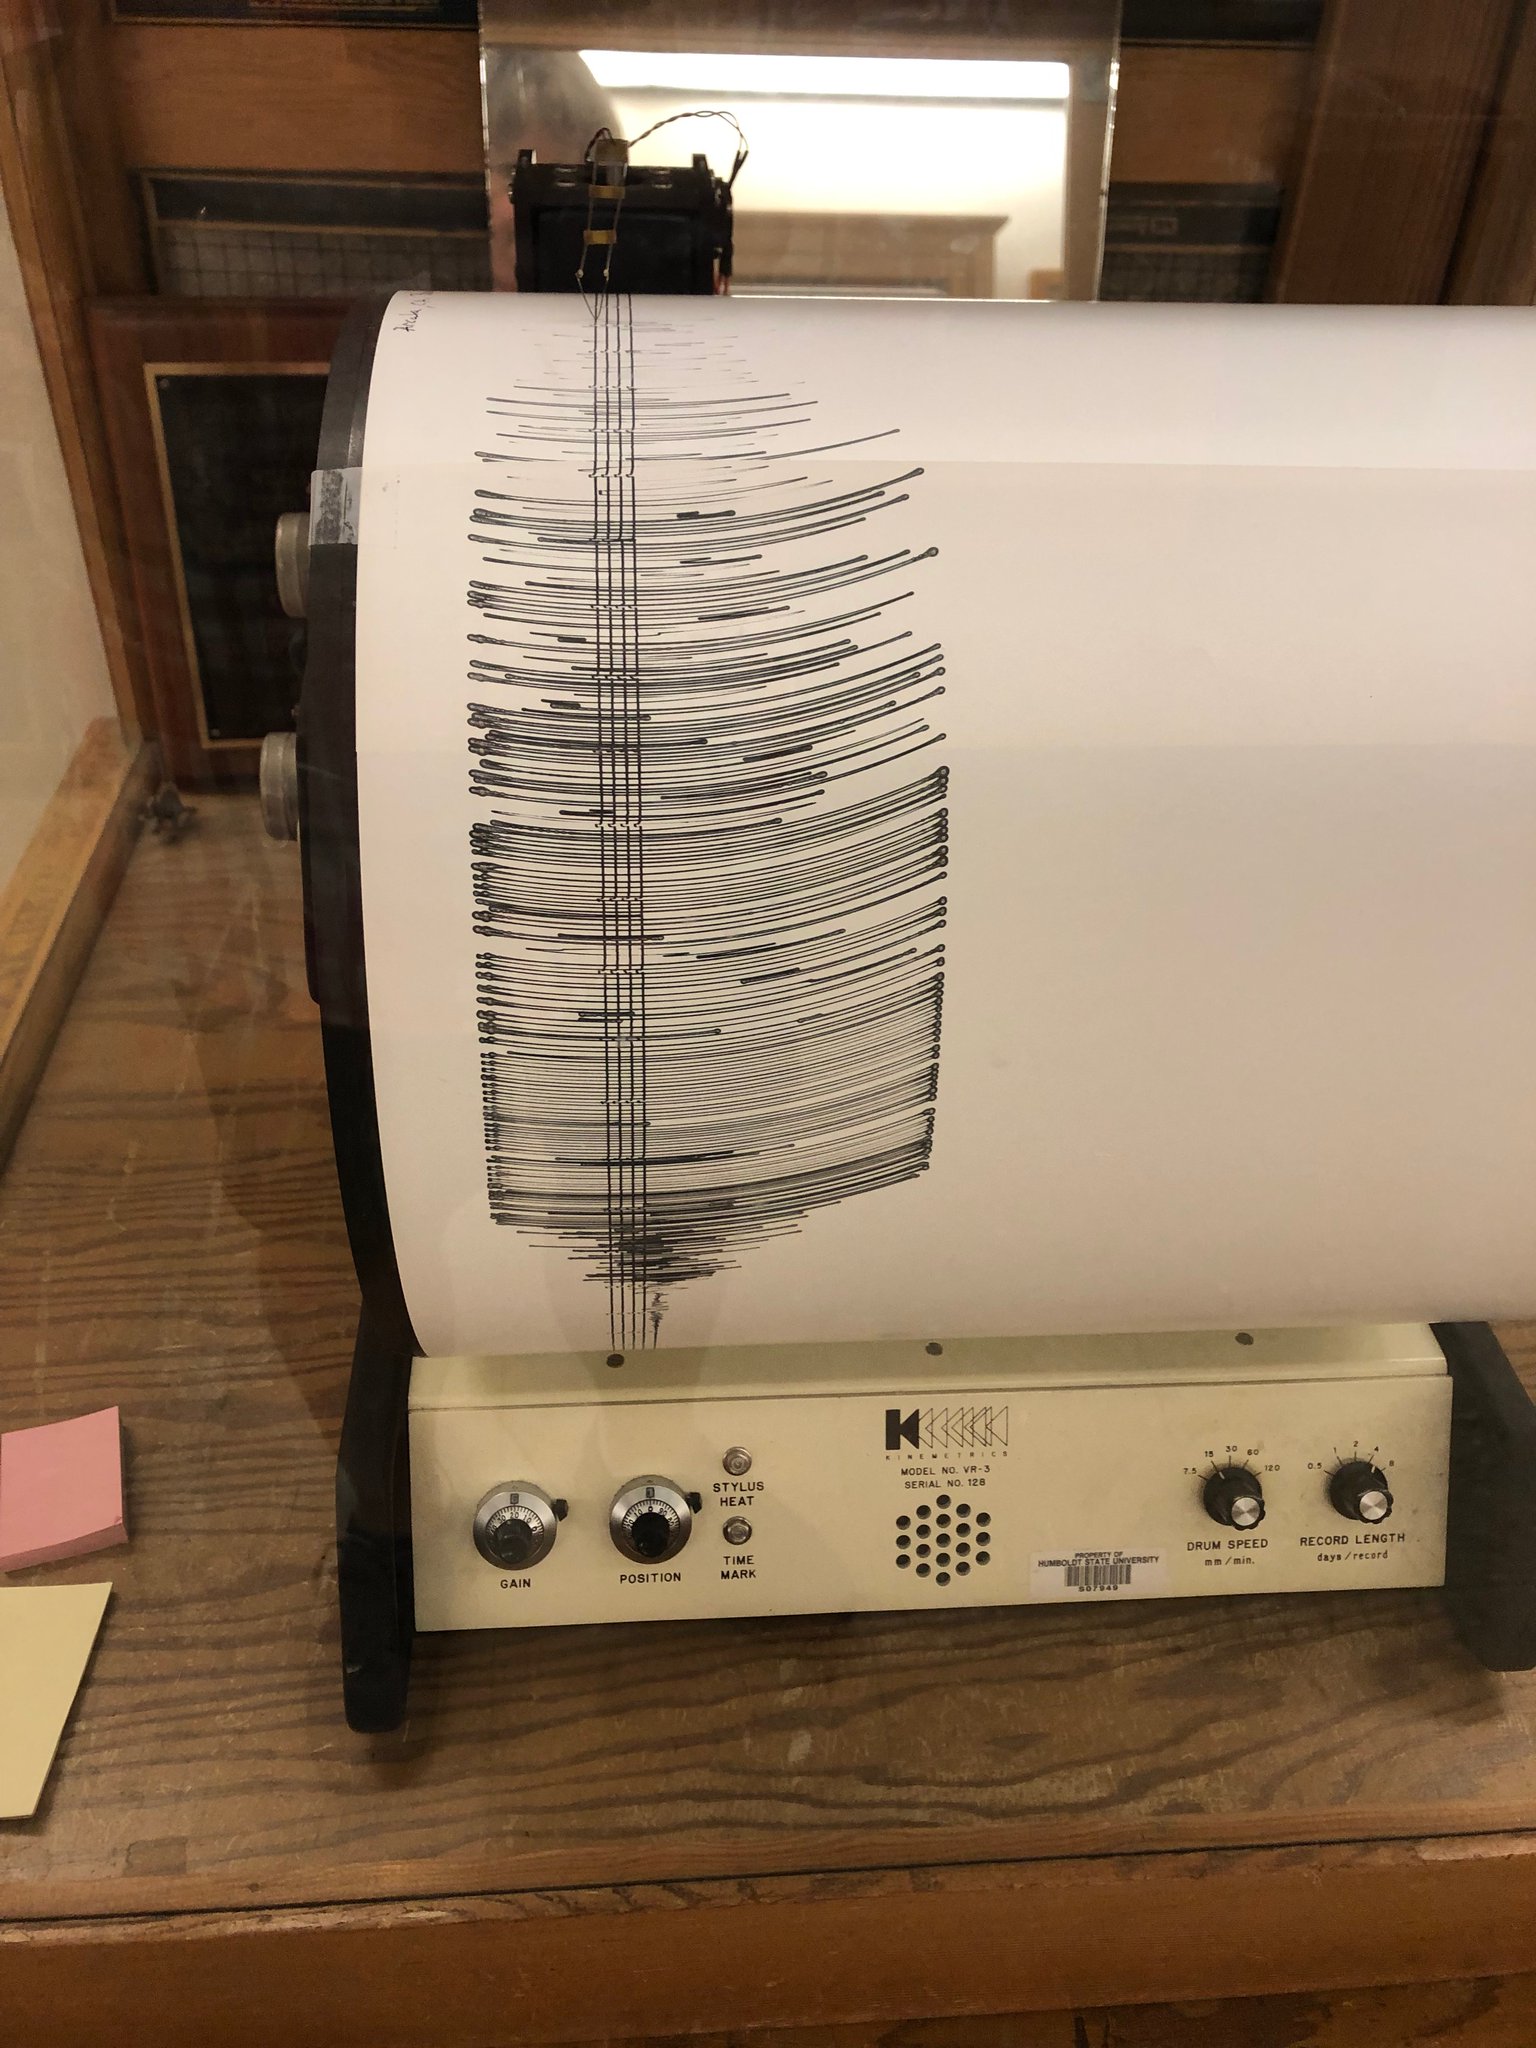
- Here is a photo taken Dr. Mark Hemphill-Haley. This shows the Humboldt State University Baby Benioff seismograph for the M 7.1 earthquake. As Hemphill-Haley states, the gain is turned up so people can see smaller quakes. This is why the record maxes out. The beginning of the earthquake is on the bottom.
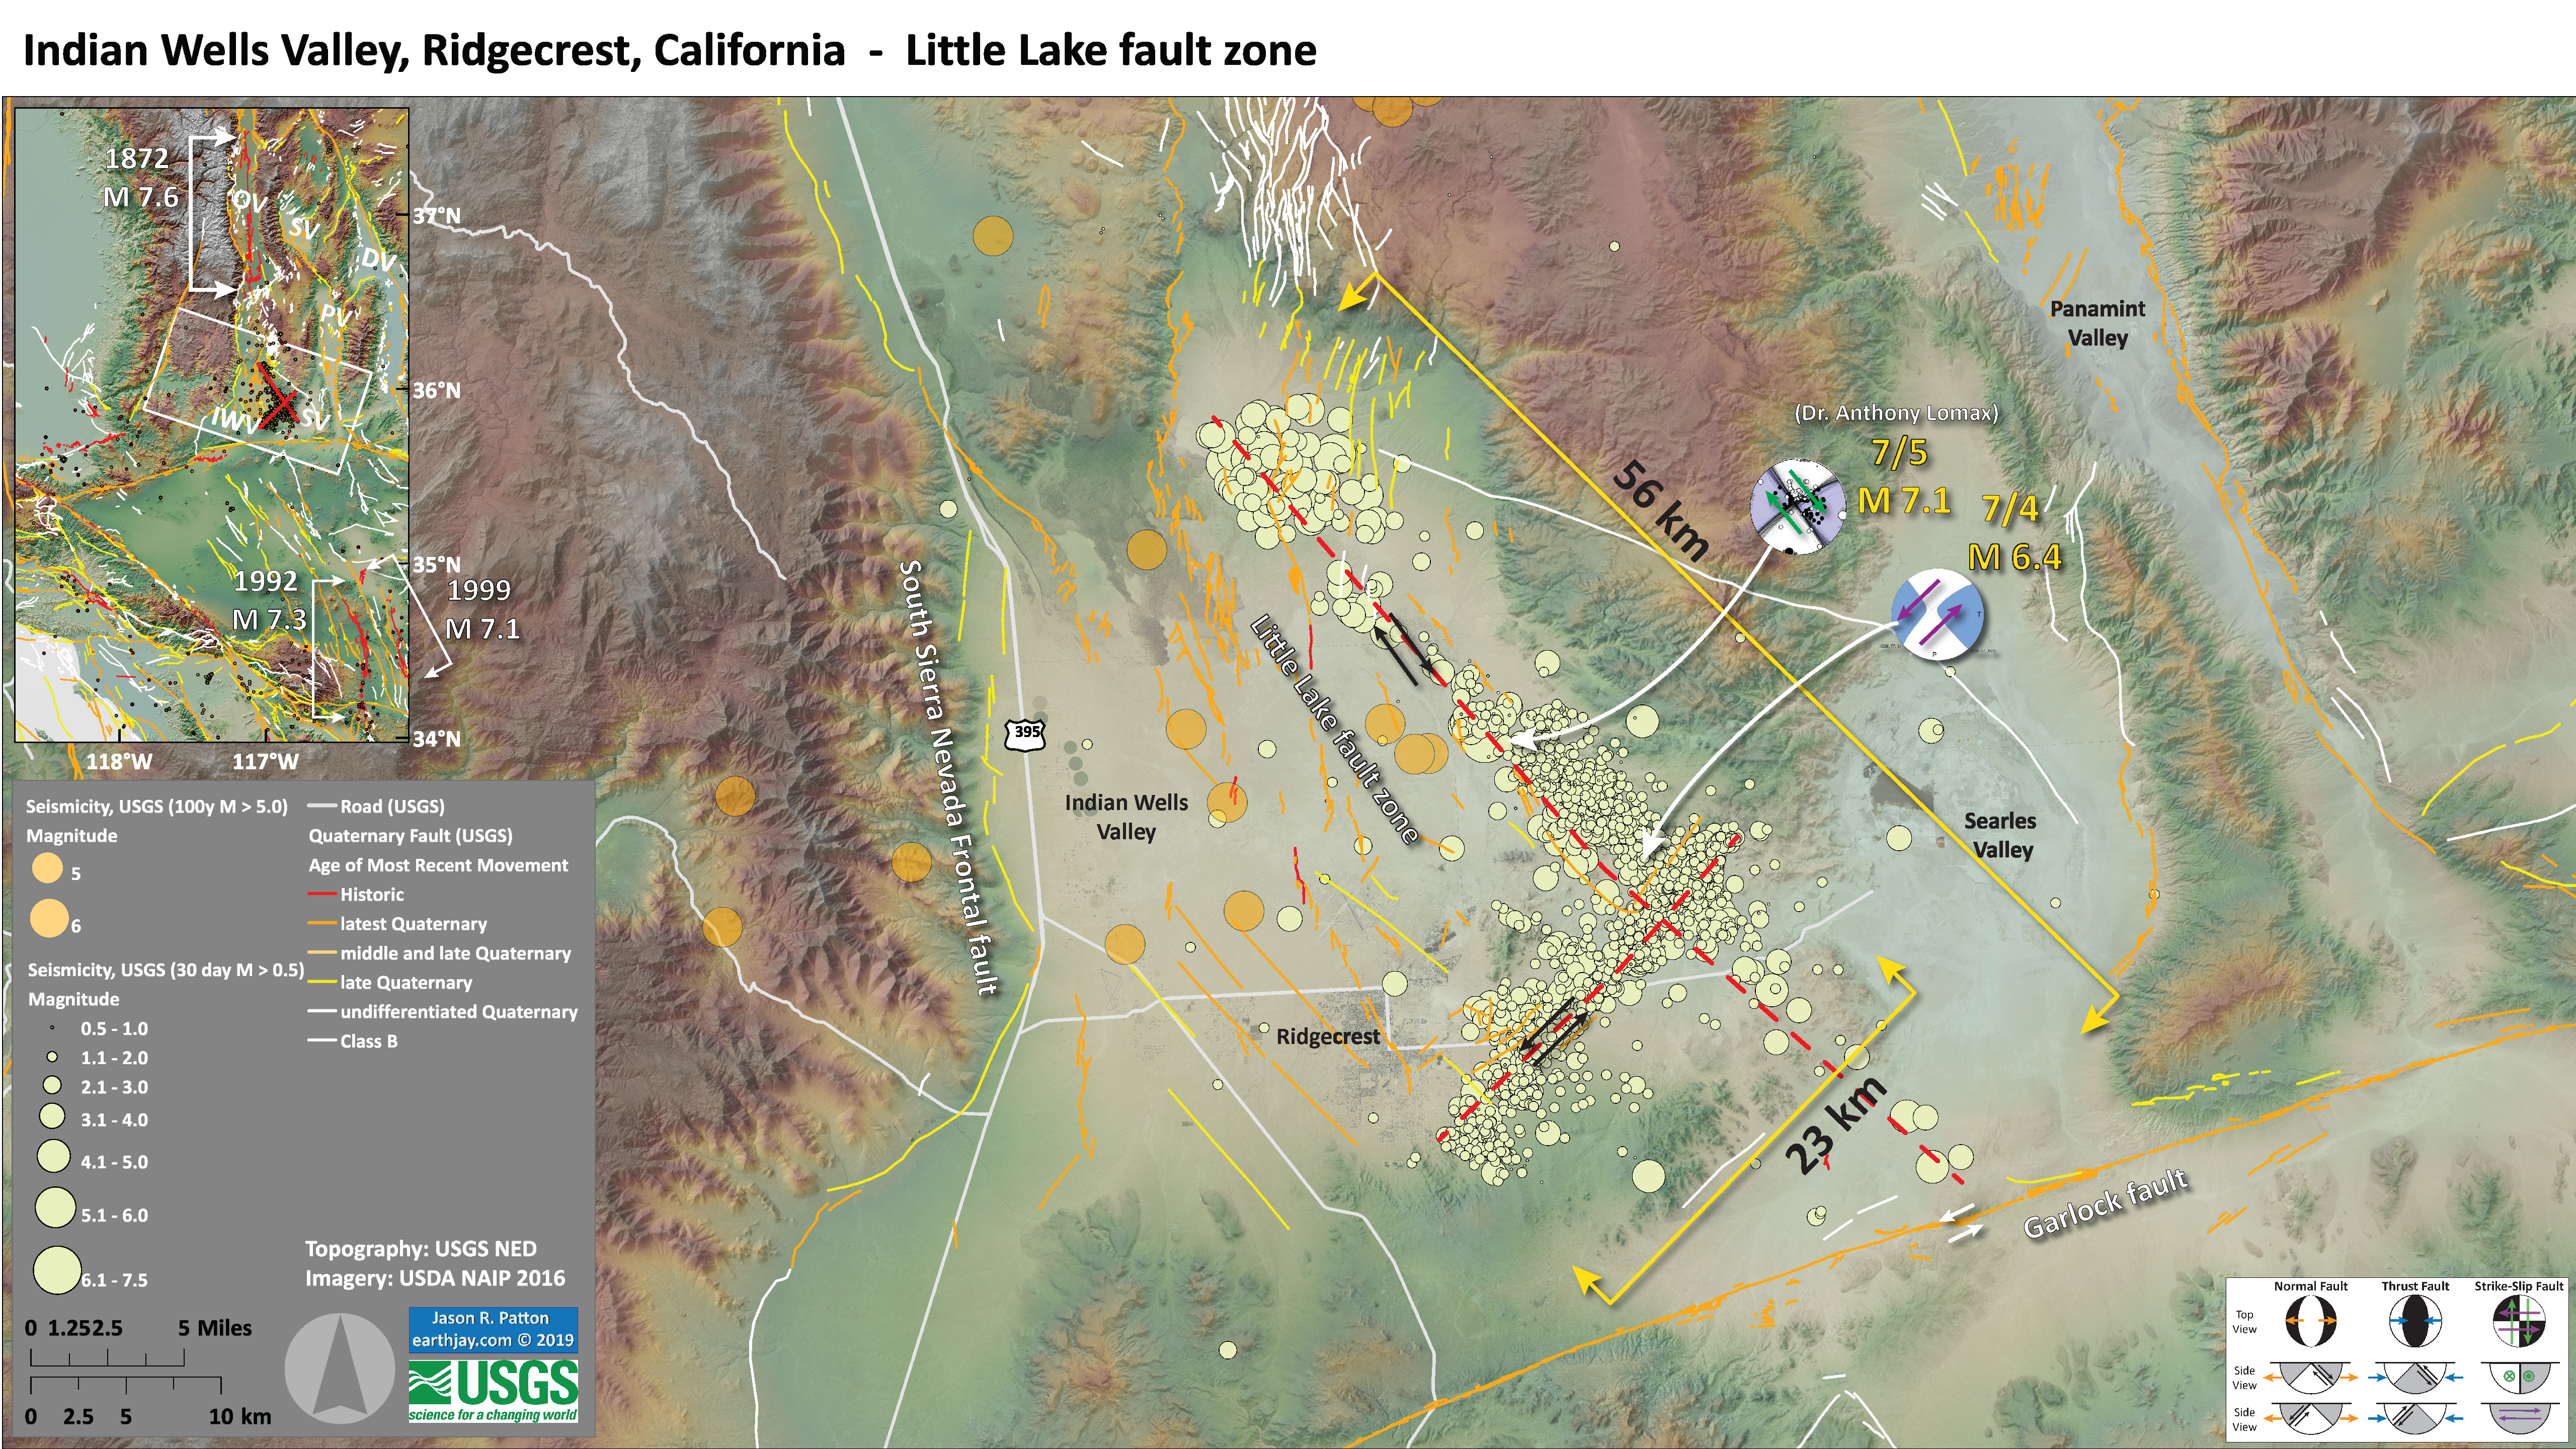
- Here is an updated map. Please see previous maps and reports for more information about what is on this map.
- I have plotted epicenters from the past few days for magnitudes M > 0.5 in green and earthquakes for the past century for magnitudes M > 5.0.
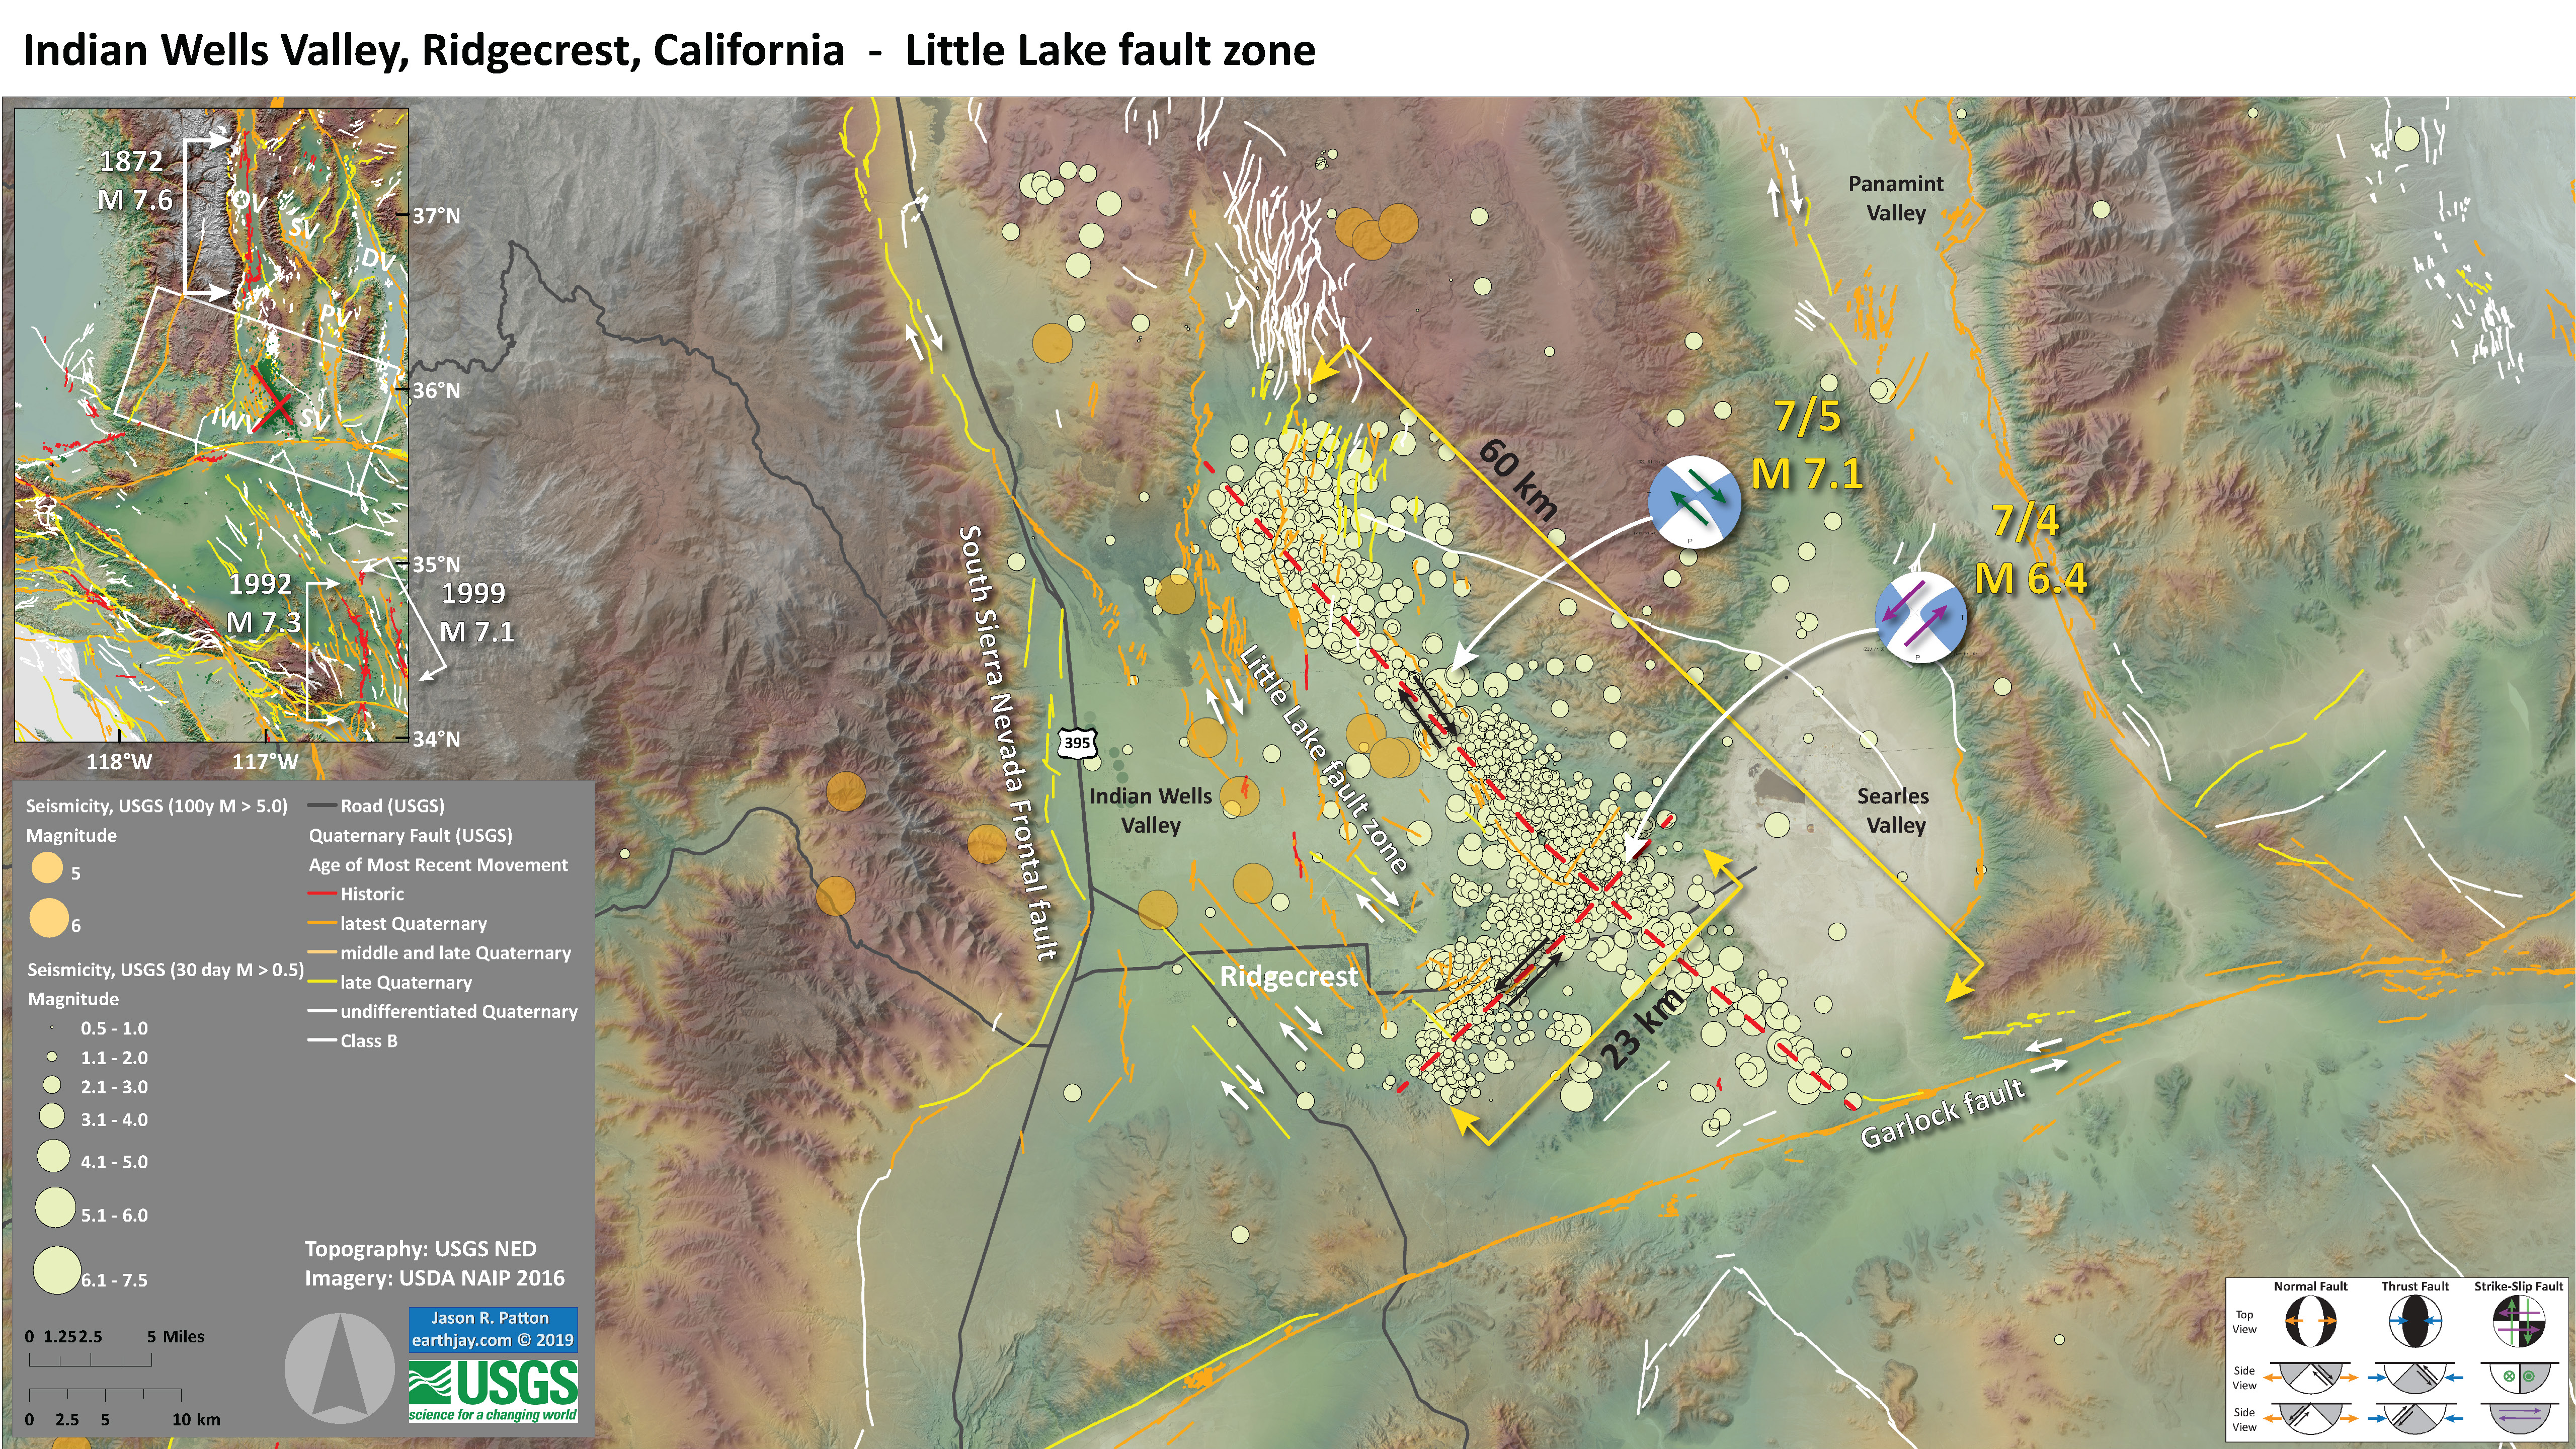
- As I have discussed earlier and here, there are 2 major faults that are participating in this sequence. One fault is a northeast striking (oriented) left-lateral strike-slip fault (analog = Garlock fault). The other fault is a northwest striking (oriented) right-lateral strike-slip fault (analog = San Andreas, Owens Valley faults). There are also many other smaller faults too.
- Earlier I interpreted the M 6.4 to have been on the northeast striking left-lateral strike-slip fault. This is still my favored interpretation as (1) using the empirical fault scaling relations from Wells and Coppersmith (1995), the 23 km length could produce a magnitude M 6.6 earthquake (close enough to > 6.4), (2) this is where the aftershocks were following the M 6.4, and (3) the surface rupture was identified along the northeast striking region. However, it may be on the northwest striking fault.
- The M 7.1 earthquake is clearly on the nw striking right-lateral strike-slip fault. The aftershocks are filling in, showing us the spatial extent (the length) of this fault rupture. At first, there were several M 4+ aftershocks at the northwestern end of the aftershocks. As I was preparing the map below, some starting ripping off to the southeast of the ne striking fault. The nw fault appears to be about 60 km long. Using Wells and Coppersmith, a 56 km long rupture would produce a M 7.0 magnitude earthquake. Imagine that!
- In the above map, there is an inset map showing the eastern California Shear Zone, the San Andreas fault, and the Garlock fault. I highlight several key historic earthquakes. The 1872 M 7.6+- Owens Valley, the 1992 M 7.4 Landers, and the 1999 M 7.1 Hector Mine earthquakes (the faults that ruptured are shown as red lines in the inset map).
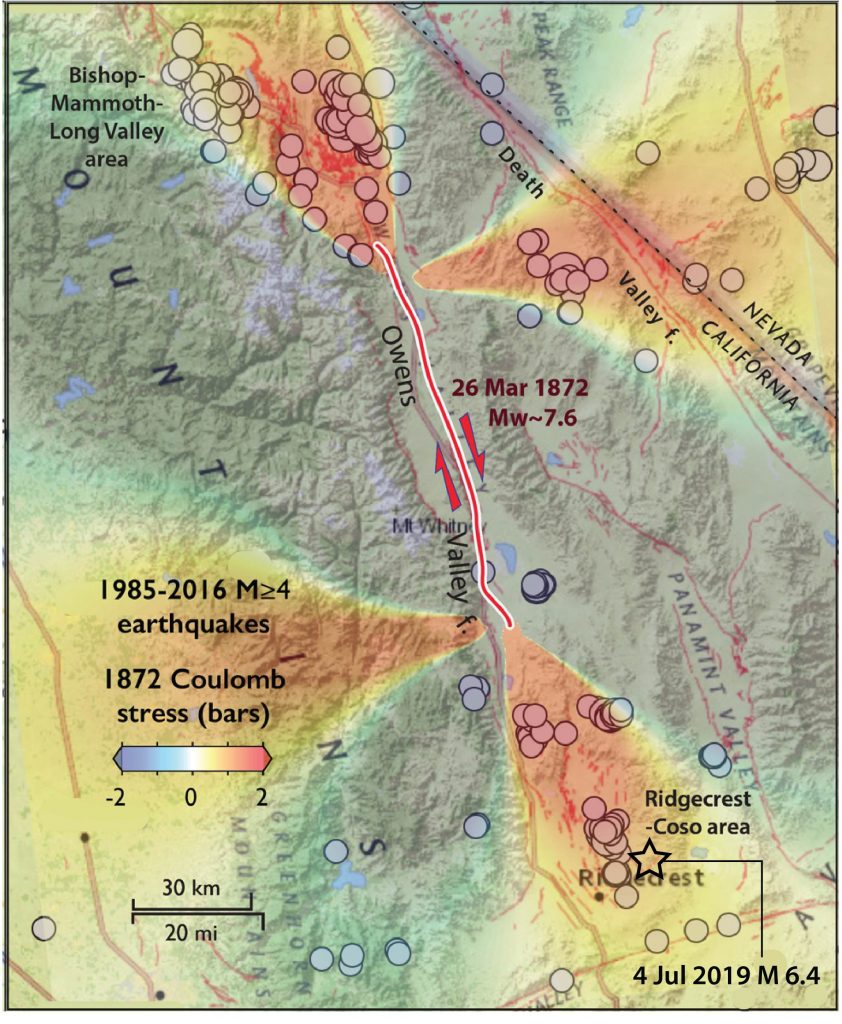
- In Dr. Ross Stein’s article on Temblor from late yesterday, Stein suggested that these Ridgecrest earthquakes are in a region of increased static coulomb stress from the 1872, 1992, and 1999 earthquakes. Below is one of his figures that shows regions that have an increased (in red) and decreased stress following the 1872 earthquake. Of particular interest is that there is a region of faults that lie between this ongoing Ridgecrest sequence and the 1872 rupture.
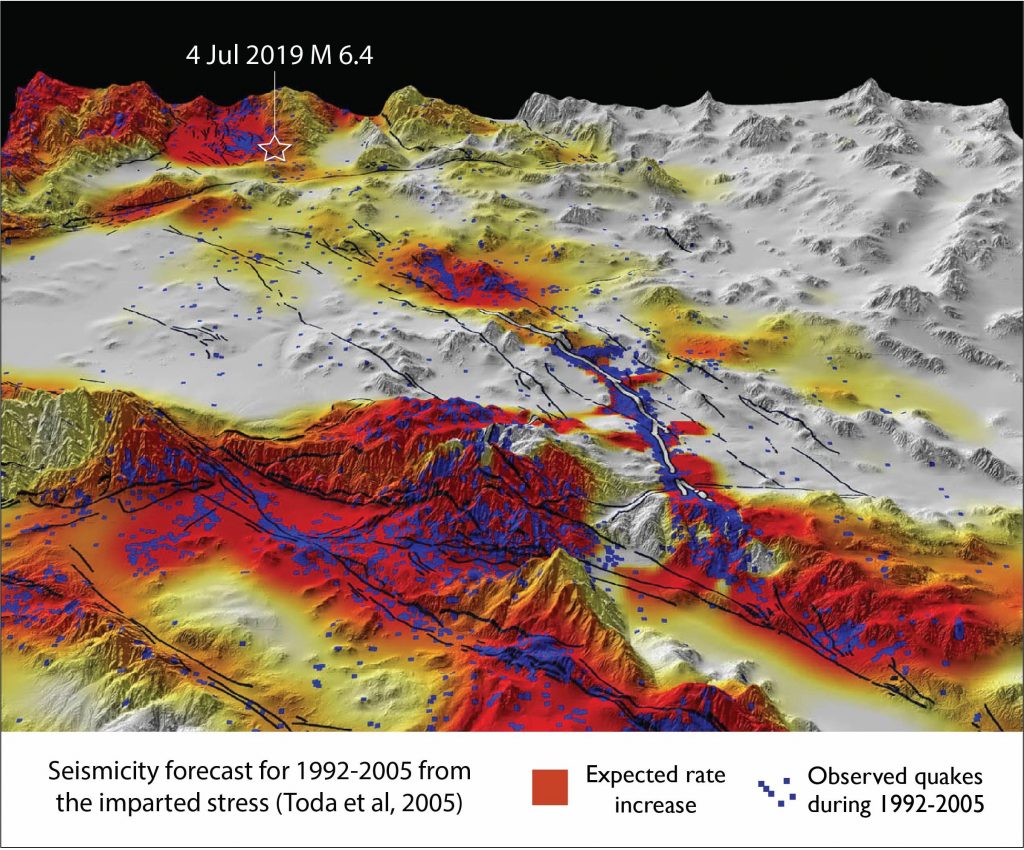
- Here is their analysis that shows an expected increase in rates of seismicity follwing earthquakes from 1992-2005 (Toda et al., 2005). This is also from the Temblor report.
- The reason I bring all this up is that there is a possibility that other faults in the region may rupture as a large earthquake. Of course, this could happen tomorrow or months or years from now. Recall that the last earthquake this size was in 1999 and the one prior to that was in 1992. Regardless, there is a stretch of the plate boundary faults (e.g. Owens Valley) that are between the 1872 and this 2019 slip.
- My cousin (a famous blues guitarist, Barry Levenson) just asked me on social media about the “Big One.” (I am paraphrasing.). I wrote to him this: as far as the San Andreas fault (SAF), this Ridgecrest sequence probably does not affect the chance that the SAF might rupture. The SAF is getting ready to go every day, but this Ridgecrest sequence is probably not affecting that… the Ridgecrest sequence is just too far away from the SAF to affect it.
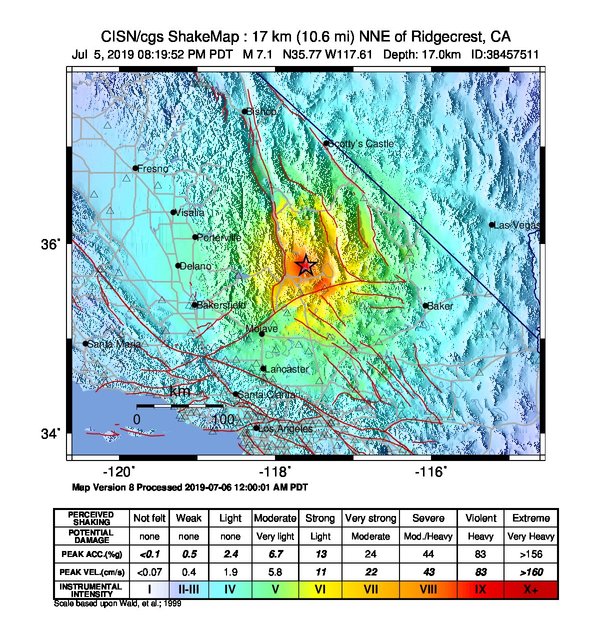
- Here is the intensity map from the CISN/California Geological Survey. The color represents the shaking intensity from the M 7.1 earthquake.
- The map above is based on an empirical relation between earthquake shaking intensity, earthquake magnitude, and distance to the earthquake. These relations depend also on other factors, like the type of earthquake and the type of Earth materials.
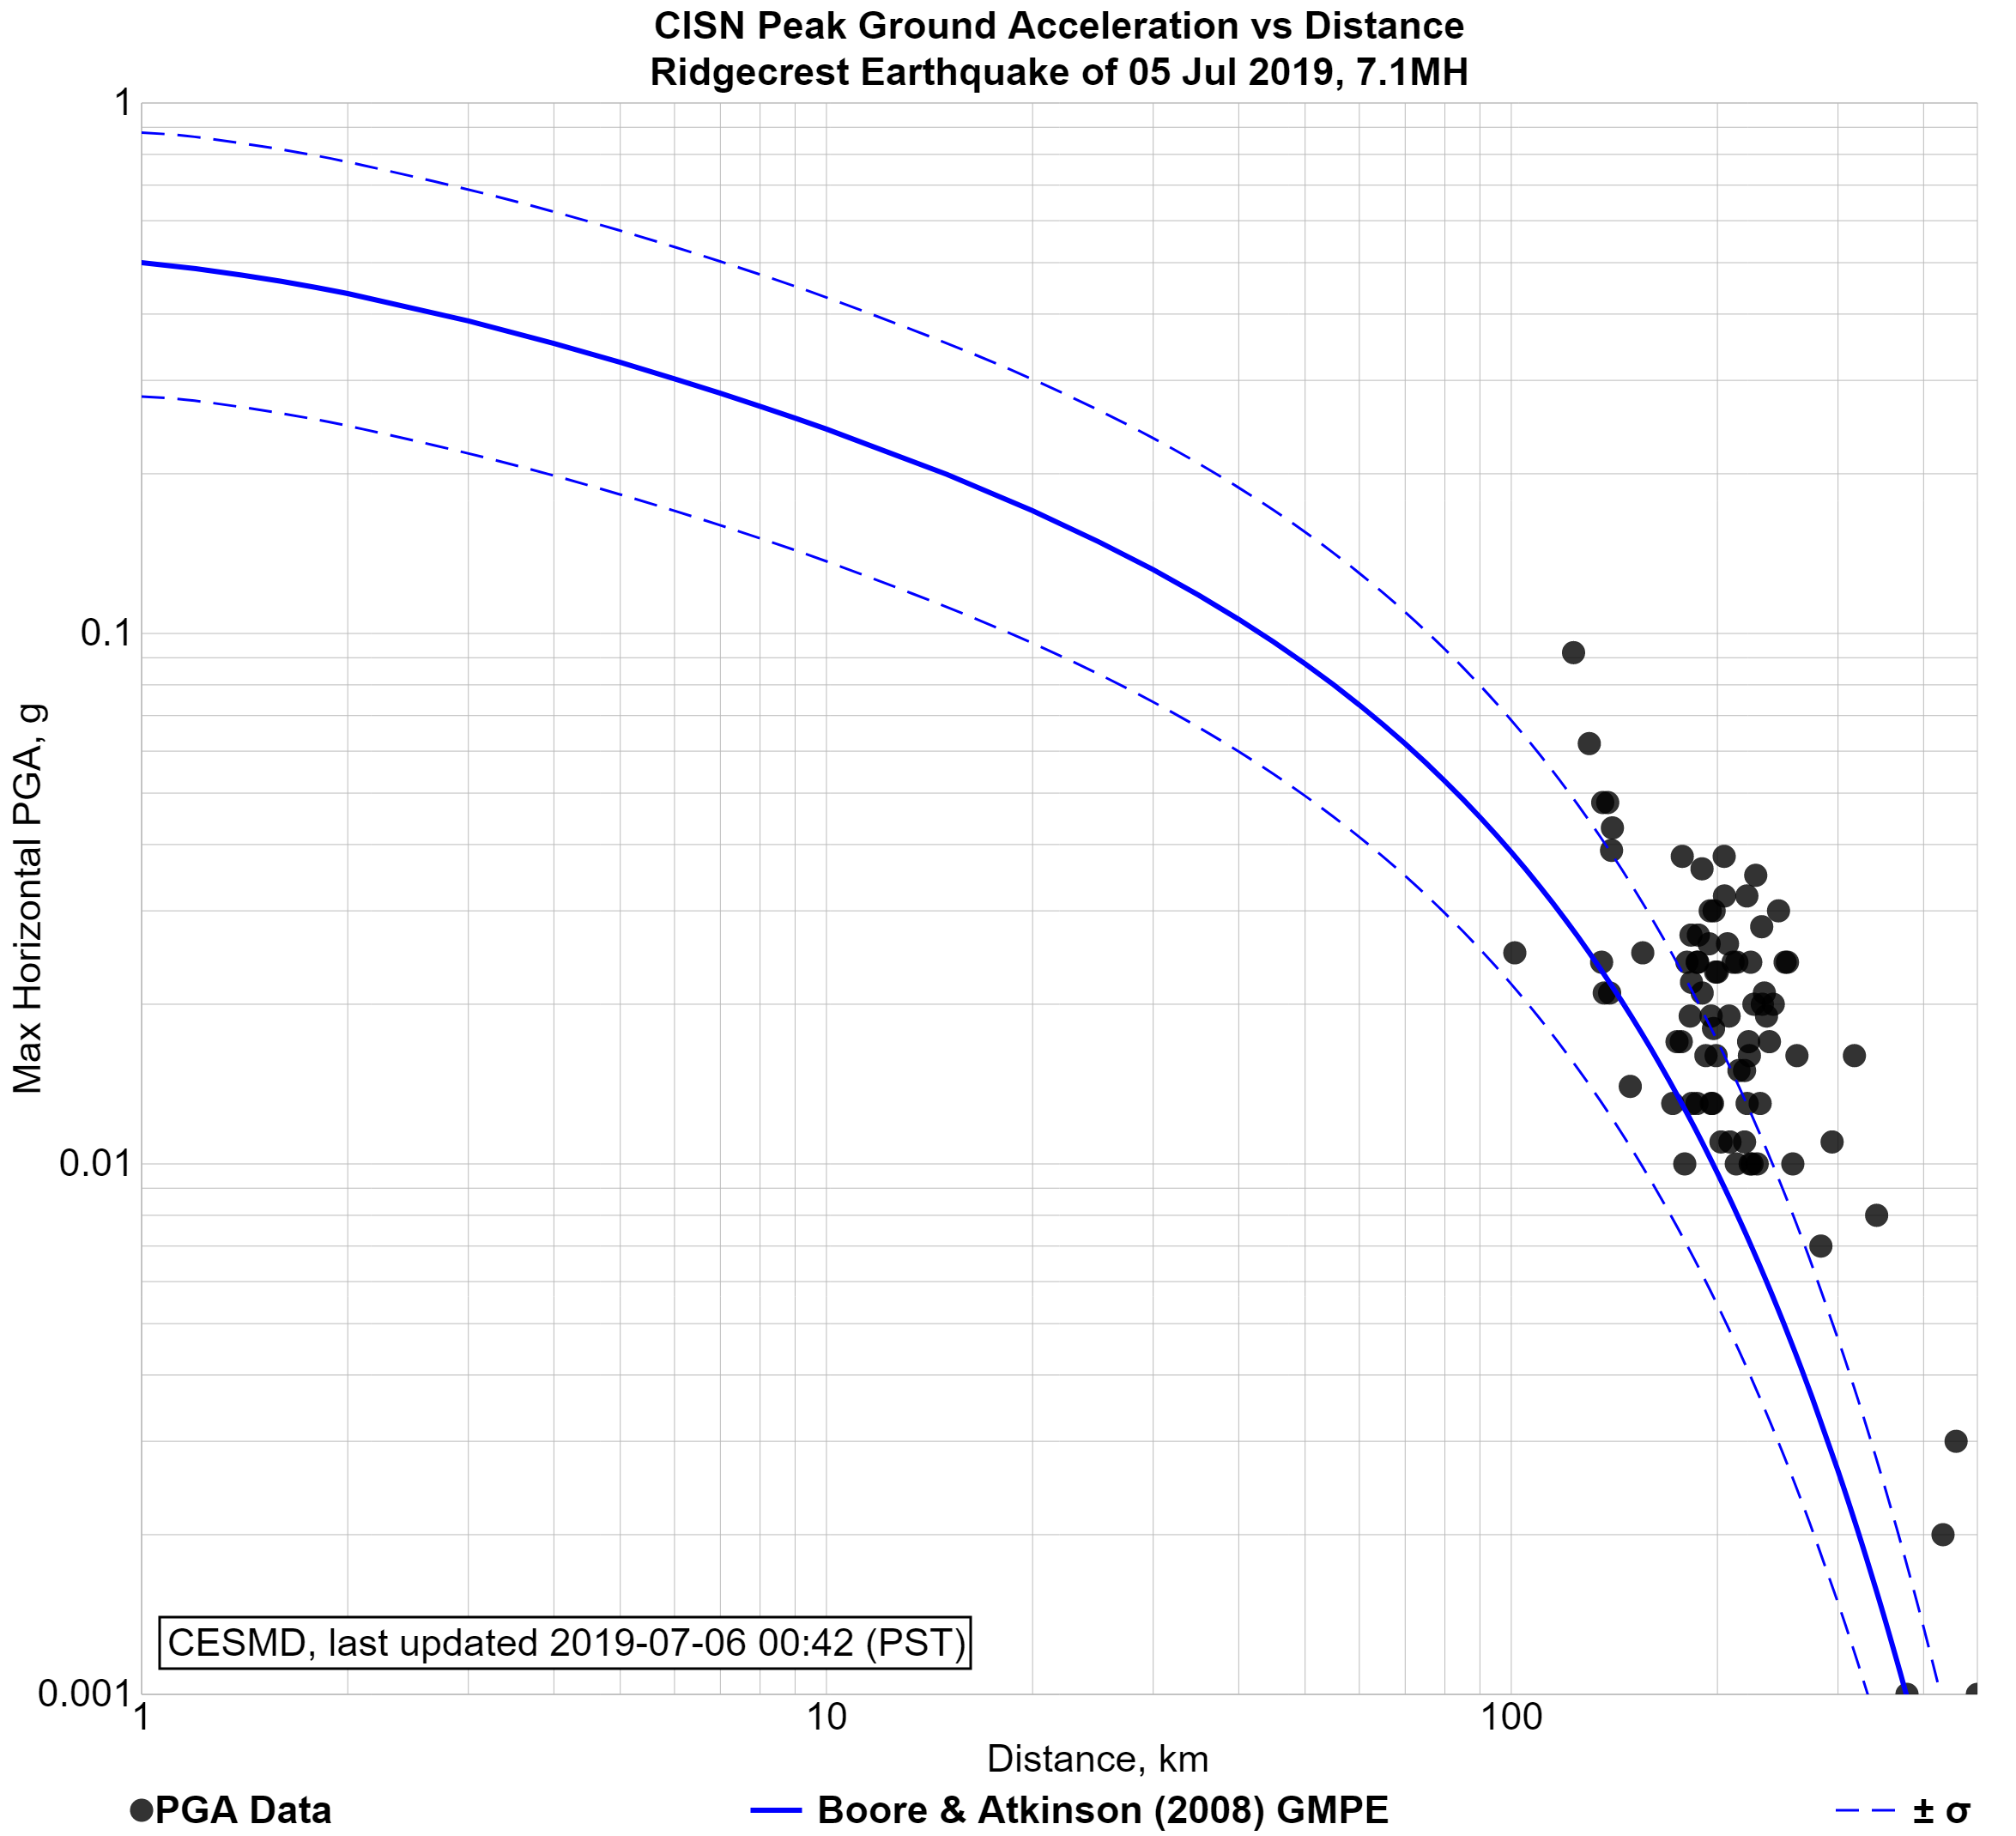
- Here is a plot showing the empirical plot (blue lines) based on the attenuation relations of Boore and Atkinson (2008). The black dots represent observations from seismometers operated by the California Geological Survey. Note the limitation that there are few observations less than 100 km from the earthquake.
UPDATE: 2019.07.06 afternoon
- Here are some updated maps. I am heading to the field tomorrow, so probably won’t be providing more updates, but we will see.
- Here is an updated seismicity map. The aftershock zone is now extending all the way to the Garlock fault. Also, there are some triggered events far to the northwest of the aftershock zone. These are probably not part of the main northwest trending fault, which appears to end near where the aftershocks are. The pdf version of this map is 167 MB.
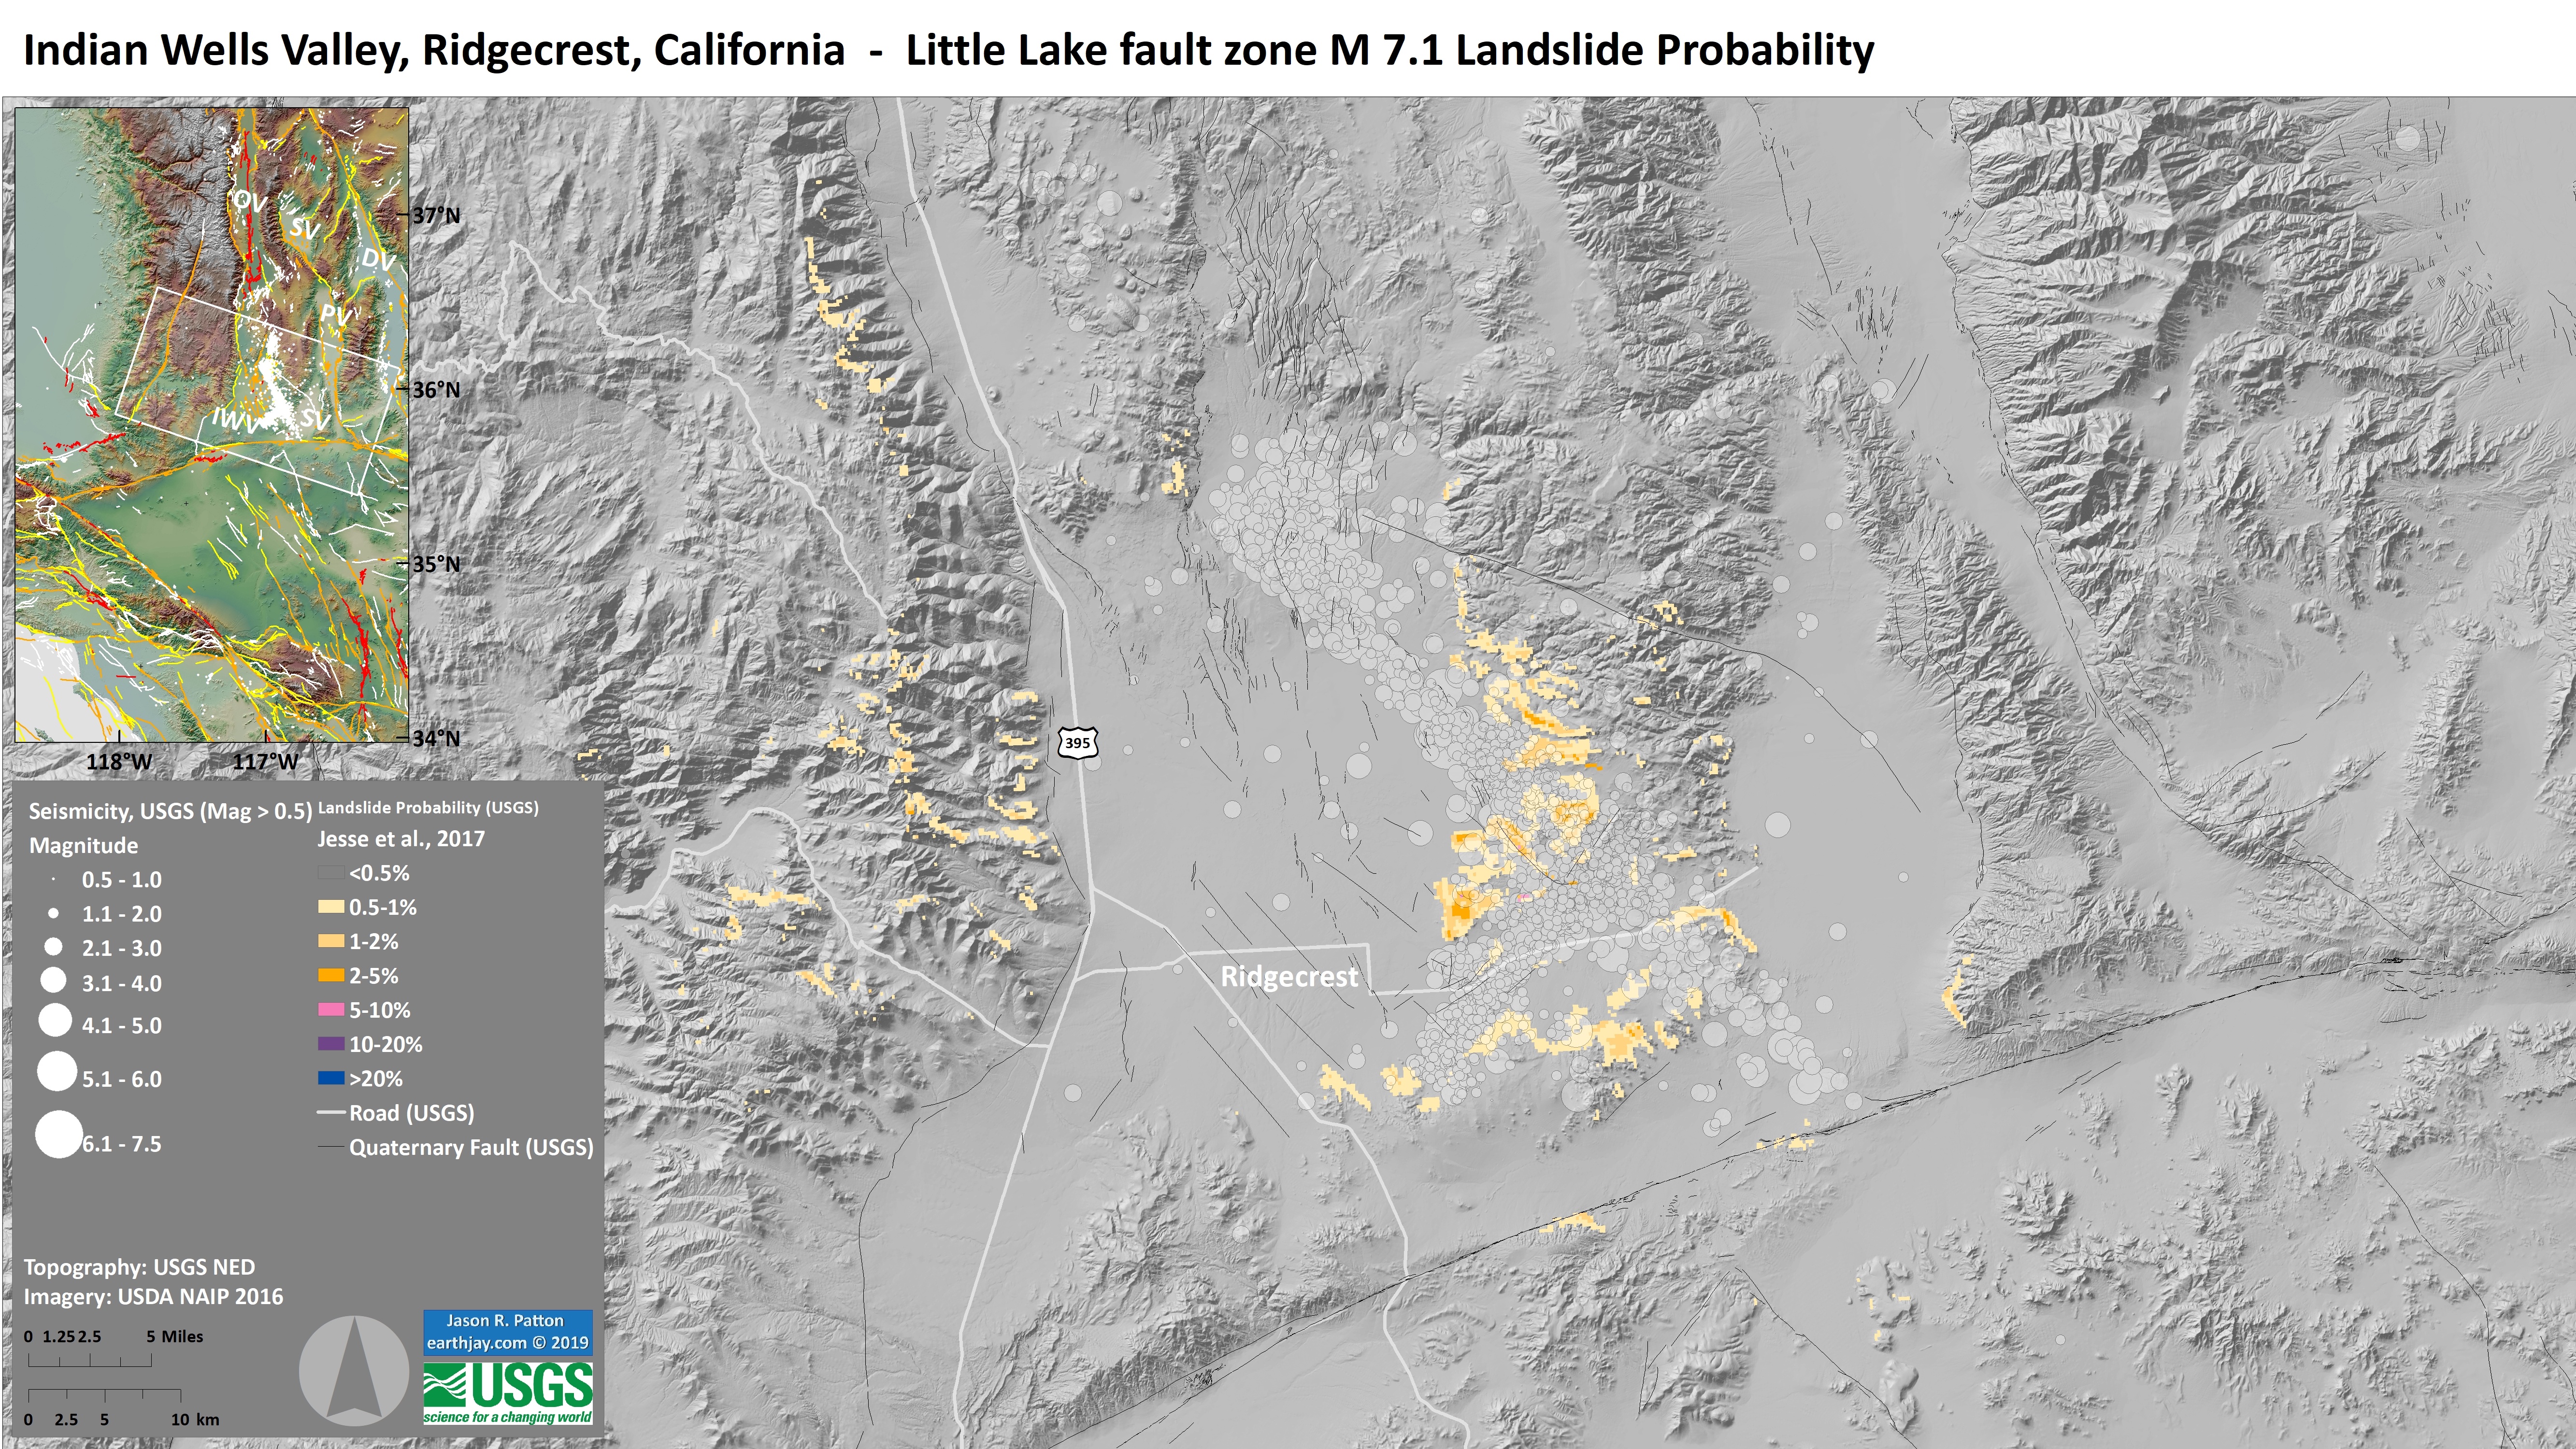
- Here is a map with landslide probability on it. I prepared one like this for the M 6.4 earthquake. Please head over to that report for more information about the USGS Ground Failure products (landslides and liquefaction). Basically, earthquakes shake the ground and this ground shaking can cause landslides. We can see that there is a low probability for landslides. However, we have already seen photographic evidence for landslides and the lower limit for earthquake triggered landslides is magnitude M 5.5 (from Keefer 1984-ish).
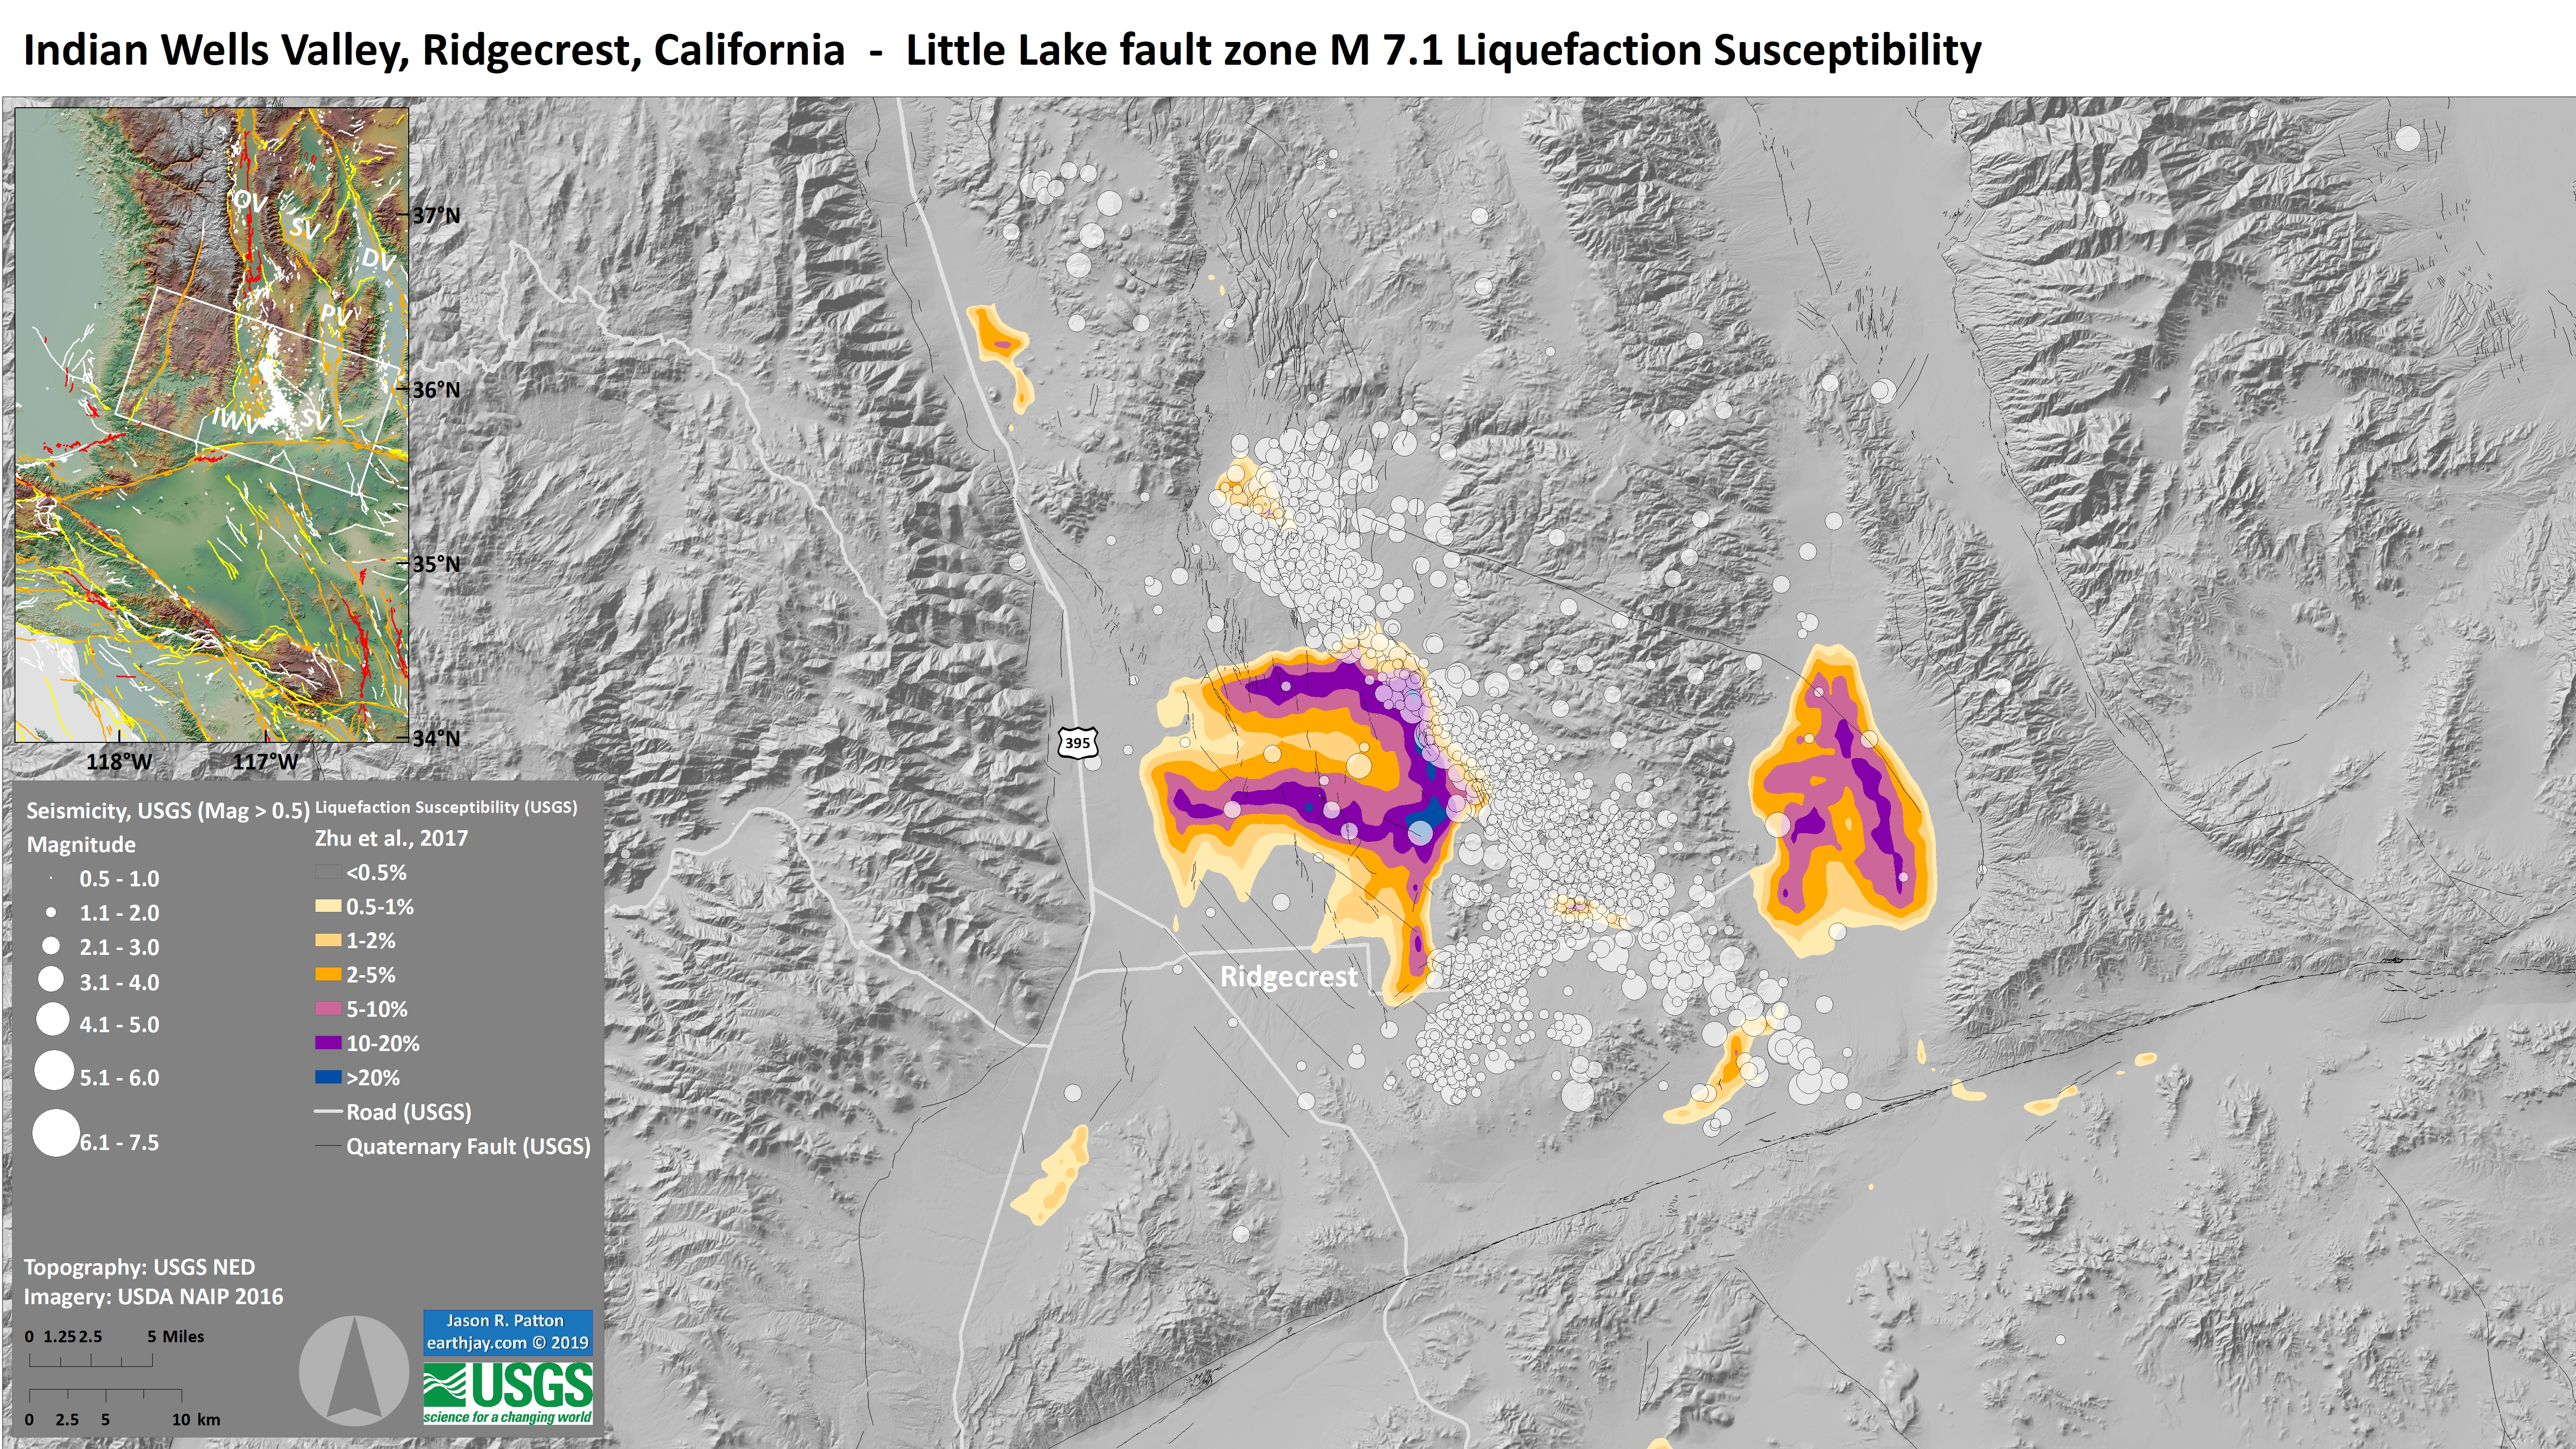
- Here is a map showing liquefaction susceptibility. I explain more about this type of map in my original report for the M 6.4 earthquake. Scroll down a bit to find the landslide and liquefaction maps for that event.
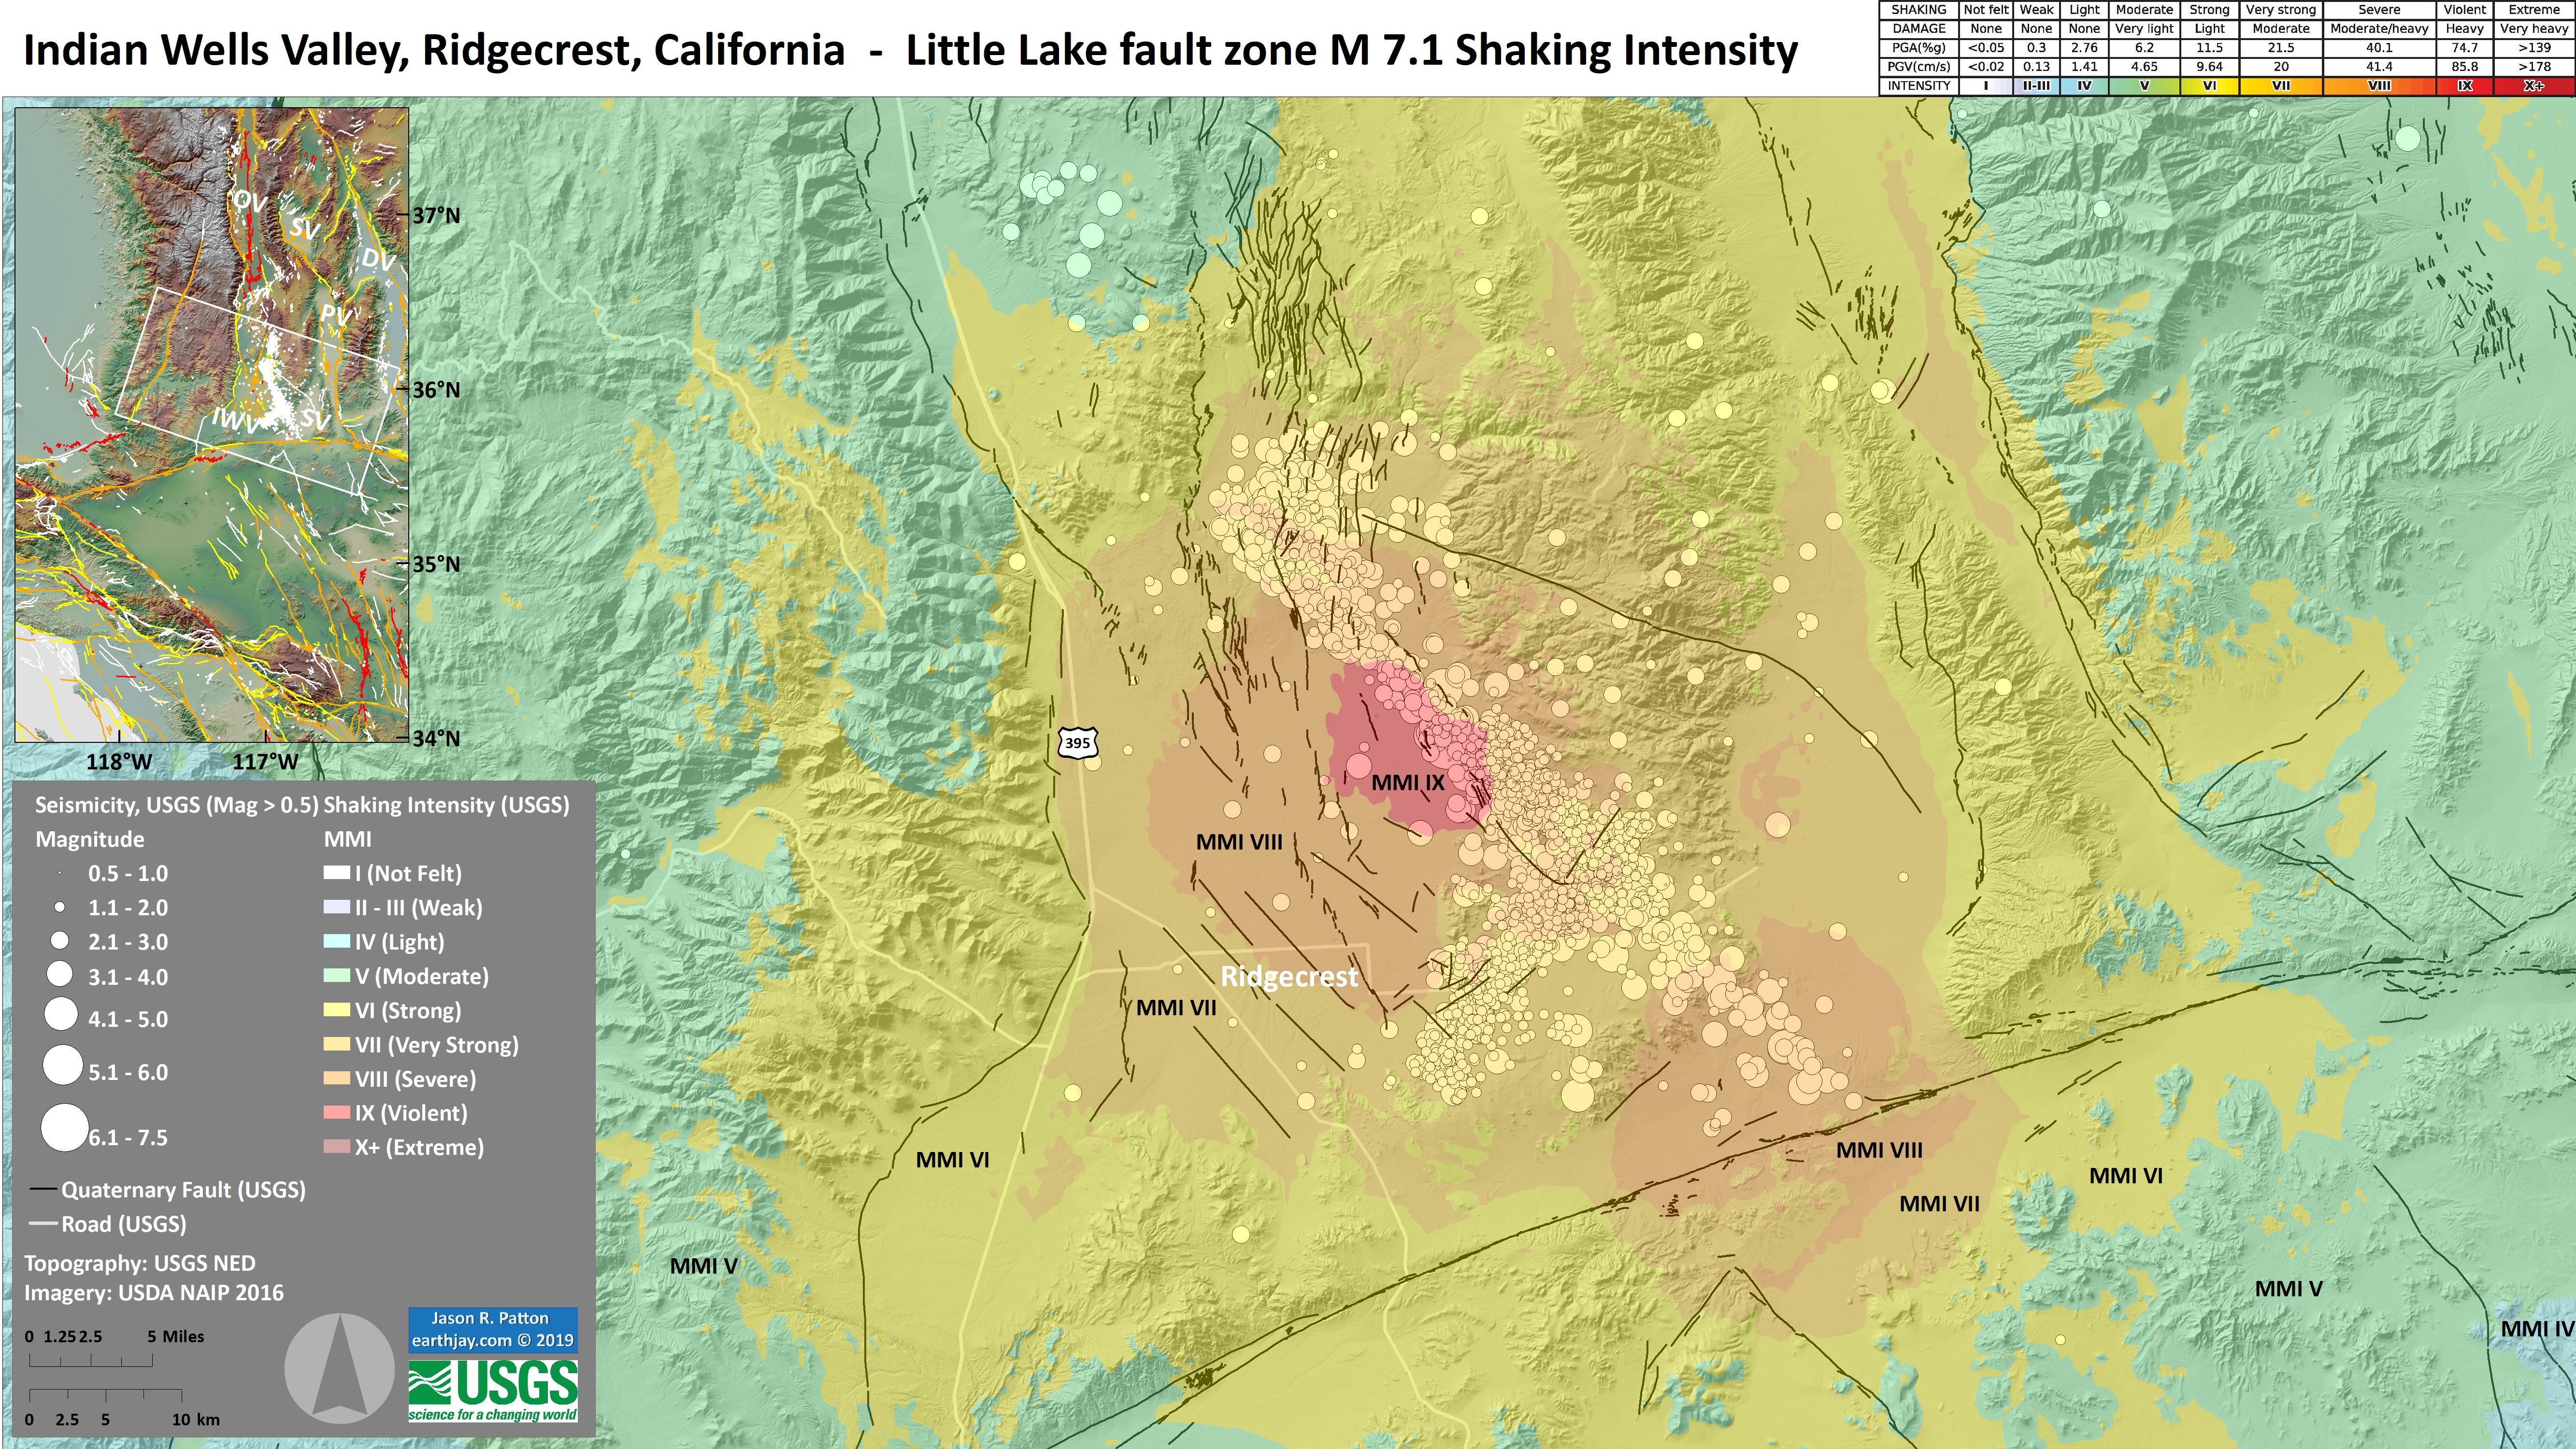
- Finally, here is a map that shows the shaking intensity for the M 7.1 earthquake. As I mention in my original report, this is based on a model that relates earthquake shaking intensity with earthquake magnitude and distance from the earthquake. Note that there was violent shaking from the M 7.1 event (MMI IX).
- Incorporated Research Institutions for Seismology (IRIS): Special Event: Central California
- USGS:
- USGS: Magnitude 6.4 Earthquake in Southern California
- USGS Event Page: 2019.07.04 M 6.4
- USGS Event Page: 2019.07.05 M 4.4
- Southern California Earthquake Center (SCEC): M 6.4 – 12km SW of Searles Valley, CA
- California Geological Survey Strong Motion Instrument Program (CGS SMIP): Searles Valley Earthquake of 04 Jul 2019
- Dr. J Ramón Arrowsmith, Geology Professor in the School of Earth and Space Exploration at Arizona State University: Accumulating links for: M 6.4 – 12km SW of Searles Valley, CA
- Temblor: Southern California M 6.4 earthquake stressed by two large historic ruptures
- Updated Temblor: Magnitude 7.1 earthquake rips northwest from the M6.4 just 34 hours later
Other Report Pages
- The USGS has been increasing the list of products that are produced in association with their earthquake pages. One of these products is an earthquake forecast (not a prediction as nobody can predict earthquakes yet) that lists the chance of an earthquake with a given magnitude over a certain period of time. The forecast for the M 6.4 earthquake is found here. These forecasts are updated periodically, so the information will change with time. Below is a table where I present the forecast as it was when I checked the page this morning (would be nice if the USGS would produce an easy to read table).
- Thanks to Dr. Harold Tobin for reviewing these tables (I reformat them) as he noticed a mistake. They are now fixed.
- More earthquakes than usual (called aftershocks) will continue to occur near the mainshock.
- When there are more earthquakes, the chance of a large earthquake is greater which means that the chance of damage is greater.
- The USGS advises everyone to be aware of the possibility of aftershocks, especially when in or around vulnerable structures such as unreinforced masonry buildings.
- This earthquake could be part of a sequence. An earthquake sequence may have larger and potentially damaging earthquakes in the future, so remember to: Drop, Cover, and Hold on.
- So far in this sequence there have been 97 magnitude 3 or higher earthquakes, which are strong enough to be felt, and 1 magnitude 5 or higher earthquakes, which are large enough to do damage.
- According to our forecast, over the next 1 Week there is a 3 % chance of one or more aftershocks that are larger than magnitude 6.4. It is likely that there will be smaller earthquakes over the next 1 Week, with 47 to 88 magnitude 3 or higher aftershocks. Magnitude 3 and above are large enough to be felt near the epicenter. The number of aftershocks will drop off over time, but a large aftershock can increase the numbers again, temporarily.
- No one can predict the exact time or place of any earthquake, including aftershocks. Our earthquake forecasts give us an understanding of the chances of having more earthquakes within a given time period in the affected area. We calculate this earthquake forecast using a statistical analysis based on past earthquakes.
- Our forecast changes as time passes due to decline in the frequency of aftershocks, larger aftershocks that may trigger further earthquakes, and changes in forecast modeling based on the data collected for this earthquake sequence.
- The first table presents this forecast in terms of percent chance and the second table presents the forecast in terms of number of earthquakes.
USGS Earthquake Forecast (UPDATED 5 July 2019)
From the USGS:
Be ready for more earthquakes
About this earthquake and related aftershocks
What we think will happen next
About our earthquake forecasts
- 1906.04.18 M 7.9 San Francisco
- 2017.12.14 M 4.3 Laytonville
- 2016.11.06 M 4.1 Laytonville, CA
- 2016.11.03 M 3.8 Laytonville, CA
- 2016.08.10 M 5.1 Lake Pillsbury, CA
- 2015.08.30 M 3.6 Mendocino County, CA
- 2015.07.27 M 3.5 Point Arena, CA
- 2018.07.30 M 3.7 San Pablo Bay
- 2018.01.04 M 4.4 Berkeley
- 2019.07.04 M 6.4 Ridgecrest
- 2019.07.05 M 6.4 / 7.1 Ridgecrest Update #1
- 2019.07.18 M 6.4 / 7.1 Ridgecrest Update #2
- 2019.07.20 M 6.4 / 7.1 Ridgecrest Update #3
- 2016.02.23 M 4.9 Bakersfield
- 2015.12.30 M 4.4 San Bernardino, CA
- 2015.05.03 M 3.8 Los Angeles, CA
- 2015.04.13 M 3.3 Los Angeles, CA
- 2014.04.01 M 5.1 La Habra p-3
- 2014.03.29 M 5.1 La Habra p-2
- 2014.03.28 M 5.1 La Habra p-1
- 2016.08.04 M 4.5 Honey Lake, CA
San Andreas fault
General Overview
Earthquake Reports
Northern CA
Central CA
Southern CA
Eastern CA
- 2019.06.05 M 4.3 San Clemente Island
- 2018.04.05 M 5.3 Channel Islands
- 2018.04.05 M 5.3 Channel Islands Update #1
- 1994.11.17 M 6.7 Northridge, CA
- 1971.02.09 M 6.7 Sylmar, CA
Southern CA
Earthquake Reports
Social Media
Analog seismograph record from an instrument near the Grapevine. Mainshock and large aftershock are in view. Photo taken at CGS HQ in Sacramento. #RidgecrestEarthquake #SearlesValleyEarthquake pic.twitter.com/HmL5g0I8Yy
— Nick Graehl (@nickgraehl) July 5, 2019
The fault also ruptured across Randsburg Wash Road (south of Hwy 178) and offset it approx 1.5 feet. The offset is more here because it’s focused on 2-3 fault strands instead of 5-6 strand at Hwy 178. #ridgecrest #earthquake pic.twitter.com/GSVbTd60Kw
— Brian Olson (@mrbrianolson) July 5, 2019
I ran the coseismics through G-FAST and got the following slip model for the Searles Valley EQ. G-FAST adds some extra fault real-estate (i.e. to NE) to allow for bilateral rupture, but does a good job putting slip only where it should be. pic.twitter.com/EleHejDZez
— Brendan Crowell (@bwcphd) July 5, 2019
Earthquake aftershocks could last months or even years, scientists say https://t.co/YMoq0pLMVX @r_valejandra
— Ron Lin (@ronlin) July 5, 2019
Aftershocks are continuing and damage/injury reports are becoming more detailed after today's magnitude 6.4 between the Sierras and the Mojave Desert, near Ridgecrest, CA. See our recent web article for basic earthquake information and safety tips: https://t.co/y41yRoHZYP. pic.twitter.com/oCniHnRXry
— SCEC (@SCEC) July 4, 2019
Ridgecrest earthquake video: Parents, kids scream as 6.4-magnitude quake rattles stage during July 4th performance https://t.co/OIcBHswdnf via @abc7
— CaliforniaDisasters (@CalDisasters) July 6, 2019
New surface rupture from latest earthquake. 35.64900, -117.48240 pic.twitter.com/xgBUOExshK
— Rich Koehler (@faultcreeper) July 6, 2019
Preliminary finite fault model for today's California earthquake. ~50 km long, ~20 s duration, peak slip ~3m in this model. Deep slip at NW end of model probably not real. Updates will follow. pic.twitter.com/i5q4iFK0yF
— Gavin Hayes (@gph_seismo) July 6, 2019
Another huge earthquake in Los Angeles! #earthquake #LosAngeles #california pic.twitter.com/c7hVHLrNaN
— Max Graham (@maxgraham22) July 6, 2019
7.1 just happened! The seismograph at #GriffithObservatory was going crazy during the #SoCal #earthquake #StrangerThings #RidgecrestEarthquake #LasVegas #vegasearthquake #California pic.twitter.com/Hc0Gv5d5ey
— CantTameMe (@CantTameMe69) July 6, 2019
Earthquake batters Trona: Rockslides cut off town; water is scarce https://t.co/ugYcpujKiE
— L.A. Times: L.A. Now (@LANow) July 6, 2019
#Video taken at Morongo Casino in Cabazon, California, at the moment 6.9 mag earthquake strikes in southern California minutes ago. pic.twitter.com/BLQxO0ZqBq
— 1st Breaking News® 🇲🇽 (@1stBreakingNews) July 6, 2019
7.1 magnitude earthquake 150 miles away in Ridgecrest, Ca. This is in my 6th (very top) floor apartment in Glendale, Ca. Turn your volume on for the full effect! #earthquakes #earthquake #EarthquakeLA #earthquakecalifornia @earthquakeBot @USGSBigQuakes pic.twitter.com/ZCokTSHvgM
— russell john (@russelljohnnn) July 6, 2019
Aftershock activity comparison:
M7.1 succeeding aftershocks are 1.4x larger in numbers and, so far, released 6.5x more energy than aftershocks succeeding the M6.4 event two days ago (within ~4h)Largest expected aftershock M6.0-6.3 is still to come (or maybe not) pic.twitter.com/q2Bid6C6w0
— CATnews | Andreas M. Schäfer (@CATnewsDE) July 6, 2019
Too amped to sleep. https://t.co/B0y7x6xhwY
— Tiegan Hobbs (@THobbsGeo) July 6, 2019
UPDATE: 2019.07.06
DOC's Acting State Geologist, Tim McCrink, on @kcranews showing the #RidgecrestQuake area seismic faults and explaining the aftershock sequence. https://t.co/44NWJUiDq2 @Cal_OES
— DeptofConservation (@CalConservation) July 6, 2019
Hold the train! near Trona pinnacles with @faultcreeper close to 1 m RL offset. #earthquake #ridgecrestearthquake pic.twitter.com/J9Z8npqZH5
— Ian Pierce (@neotectonic) July 6, 2019
Second quake did not rupture 395 or any roads east of coso junction pic.twitter.com/HPz2DfRo0O
— Ian Pierce (@neotectonic) July 6, 2019
Creating two pictures, one from the M6.4 to the M7.1 (top), and the second from the M7.1 onwards (bottom). This, to separate the two sequences (although that of the M6.4 continues to some extent after the M7.1). The green and blue lines materialize the M6.4 aftershock sequence. pic.twitter.com/atYSvNJvCp
— Bertrand Delouis (@BertrandDelouis) July 6, 2019
Just ran the Ridgecrest slip model through G-FAST, M7.19, a bit over 3 m slip, still preliminary. pic.twitter.com/hmUD6uSRg4
— Brendan Crowell (@bwcphd) July 6, 2019
Back Projection for M 7.1 CENTRAL CALIFORNIA #EARTHQUAKE https://t.co/ajDkYpZFRS pic.twitter.com/B1Qg78bpbI
— IRIS Earthquake Sci (@IRIS_EPO) July 6, 2019
Today's large EQ in USA is a good example of how its not large earthquakes that kill people but poorly built/designed buildings and infrastructure. So far no reported fatalities.
BBC News – California earthquake: Larger 7.1 magnitude quake hitshttps://t.co/PfVSqJPFQS
— tectonictweets (@tectonictweets) July 6, 2019
Animation of the #SoCalEarthquake sequence made using the IRIS Interactive Earthquake Browser. This covers the time period 7/4-to 7/6 17:00 UTC and uses USGS #earthquake locations. https://t.co/o0PzvGOiJH pic.twitter.com/f12FJXhi13
— IRIS Earthquake Sci (@IRIS_EPO) July 6, 2019
Permanent deformations predicted on the base of the finite fault provided by #USGS, through waveform inversion, for the M 7.1 #EarthquakeLA.
Wating for #InSAR measurements.#RidgecrestEarthquake #TerremotoCalifornia #Terremoto @InSARinfo @USGSBigQuakes @EricFielding @gfun pic.twitter.com/jCXsE9oqL5— Simone Atzori (@SimoneAtzori73) July 6, 2019
View the #SoCalQuake sequence on the IRIS Interactive Earthquake Viewer. You can even view the #earthquake hypocenters in 3D (like in the black image below) and animate the aftershock sequence! https://t.co/Gs3ykBEp0y pic.twitter.com/RsK6kQ2T4v
— IRIS Earthquake Sci (@IRIS_EPO) July 6, 2019
Earthquakes near Ridgecrest were clearly in an red zone in the Coulomb failure stress changes (ΔCFS) analysis by Verdecchia and Carena, Tectonics (2016) 10.1002/2015TC004091. Would be great to see an after-event update? and see the impact on Garlock Fault. pic.twitter.com/VWh6po02dg
— Anne-Sophie Meriaux 🇪🇺 (@Tecto_Asm) July 6, 2019
Right offsets pic.twitter.com/cv5gM1ms9N
— Rich Koehler (@faultcreeper) July 6, 2019
This mornings findings in the Trona pinacles area along the #Ridgecrest surface rupture with @neotectonic Think we Found southern extent of rupture pic.twitter.com/YhkgQA2aUF
— Rich Koehler (@faultcreeper) July 6, 2019
DOC California Geological Survey's Janis Hernandez measures an offset on Highway 178. She's 1 of 20 geologists deployed to survey the effects of #RidgecrestEarthquake #earthquakeresponse @USGS @Cal_OES #cgs pic.twitter.com/LY3vv0H9uR
— DeptofConservation (@CalConservation) July 6, 2019
Chris was in the field this morning and saw an offset anthill with about ~ 1 ft RL displacement from M7.1. His pictures below: pic.twitter.com/WwqXq1giz6
— Danielle Madugo (@DanielleVerdugo) July 6, 2019
1m of right lateral displacement of tire tracks, a dirt road and a fence. Pretty amazing. And we are at the southern part of the rupture pic.twitter.com/Fl4cIKvyr1
— Colin Chupik (@ChupikColin) July 6, 2019
More from today. Tiny pull aparts, pressure ridges and wide zones of deformation… pic.twitter.com/TjJwCVOBOJ
— Colin Chupik (@ChupikColin) July 6, 2019
Just got into cell range from the 7.1 rupture where it crosses the 178. Just south of there, it crosses a dirt road with 1 strand with ~2ish ft RL and some vertical and another strand with very minimal RL and diffuse vertical displacement. NBC is camped on the RL and main strand. pic.twitter.com/54qxfaEHrk
— Danielle Madugo (@DanielleVerdugo) July 6, 2019
Latest view of aftershocks from the SoCal quakes + slip model of today's M7.1 rupture (projected on the surface+aligned along the fault). Looks like today's rupture went SE past the intersection of the two faults. SW-NE fault has been less active today in terms of aftershocks. pic.twitter.com/td2V75ukNS
— Stephen Hicks 🇪🇺 (@seismo_steve) July 6, 2019
@Planetlabs satellite images shows complex and distributed rupture of the July 4th Mw 6.4 Ridgecrest #earthquake. You can make out subtle left-lateral motion in top left of image. pic.twitter.com/cFpI4wTz4m
— Chris Milliner (@Geo_GIF) July 6, 2019
Nevada Geodetic Lab (next door to M6.4, M7.1 Searles Valley quakes) is analyzing their network and other data, more here https://t.co/mnJuhMXK53
Screenshot from NGL webpage pic.twitter.com/LFM5Mz3OLj— UNAVCO (@UNAVCO) July 6, 2019
Seismologists at Scripps created this plot of the #RidgecrestEarthquake sequences and magnitudes over time. There have been more than 2,400 aftershocks to date. pic.twitter.com/mOgXQzCyz4
— Scripps Oceanography (@Scripps_Ocean) July 6, 2019
Seismologists at Scripps created this plot of the #RidgecrestEarthquake sequences and magnitudes over time. There have been more than 2,400 aftershocks to date. pic.twitter.com/mOgXQzCyz4
— Scripps Oceanography (@Scripps_Ocean) July 6, 2019
UPDATE: 2019.07.07
Great article by @WeiPoints in @NatGeo about the #SoCalQuake with quotes from @SeismoSue from the @USGS, Ross Stein from @temblor and me (from @IRIS_EPO). #scicomm #earthquake https://t.co/BHN0WuIMnl
— Dr. Wendy Bohon (@DrWendyRocks) July 6, 2019
Satellite imagery from @Planetlabs shows surface rupture of the Mw 7.1 July 5th #earthquake. There is much larger fault slip here than the Mw 6.4, ~2m of right-lateral offset at this location (35.79, -117.61). Slip profile and correlation results to come. pic.twitter.com/RMZX9XydeM
— Chris Milliner (@Geo_GIF) July 7, 2019
- Amos, C.B., Bwonlee, S.J., Hood, D.H., Fisher, G.B., Bürgmann, R., Renne, P.R., and Jayko, A.S., 2013. Chronology of tectonic, geomorphic, and volcanic interactions and the tempo of fault slip near Little Lake, California in GSA Bulletin, v. 125, no. 7-8, https://doi.org/10.1130/B30803.1
- Frankel, K.L., Glazner, A.F., Kirby, E., Monastero, F.C., Strane, M.D., Oskin, M.E., Unruh, J.R., Walker, J.D., Anandakrishnan, S., Bartley, J.M., Coleman, D.S., Dolan, J.F., Finkel, R.C., Greene, D., Kylander-Clark, A., Morrero, S., Owen, L.A., and Phillips, F., 2008, Active tectonics of the eastern California shear zone, in Duebendorfer, E.M., and Smith, E.I., eds., Field Guide to Plutons, Volcanoes, Faults, Reefs, Dinosaurs, and Possible Glaciation in Selected Areas of Arizona, California, and Nevada: Geological Society of America Field Guide 11, p. 43–81, doi: 10.1130/2008.fl d011(03).
- Frisch, W., Meschede, M., Blakey, R., 2011. Plate Tectonics, Springer-Verlag, London, 213 pp.
- Hayes, G., 2018, Slab2 – A Comprehensive Subduction Zone Geometry Model: U.S. Geological Survey data release, https://doi.org/10.5066/F7PV6JNV.
- Holt, W. E., C. Kreemer, A. J. Haines, L. Estey, C. Meertens, G. Blewitt, and D. Lavallee (2005), Project helps constrain continental dynamics and seismic hazards, Eos Trans. AGU, 86(41), 383–387, , https://doi.org/10.1029/2005EO410002. /li>
- Kreemer, C., J. Haines, W. Holt, G. Blewitt, and D. Lavallee (2000), On the determination of a global strain rate model, Geophys. J. Int., 52(10), 765–770.
- Kreemer, C., W. E. Holt, and A. J. Haines (2003), An integrated global model of present-day plate motions and plate boundary deformation, Geophys. J. Int., 154(1), 8–34, , https://doi.org/10.1046/j.1365-246X.2003.01917.x.
- Kreemer, C., G. Blewitt, E.C. Klein, 2014. A geodetic plate motion and Global Strain Rate Model in Geochemistry, Geophysics, Geosystems, v. 15, p. 3849-3889, https://doi.org/10.1002/2014GC005407.
- Meyer, B., Saltus, R., Chulliat, a., 2017. EMAG2: Earth Magnetic Anomaly Grid (2-arc-minute resolution) Version 3. National Centers for Environmental Information, NOAA. Model. https://doi.org/10.7289/V5H70CVX
- Müller, R.D., Sdrolias, M., Gaina, C. and Roest, W.R., 2008, Age spreading rates and spreading asymmetry of the world’s ocean crust in Geochemistry, Geophysics, Geosystems, 9, Q04006, https://doi.org/10.1029/2007GC001743
References:
Return to the Earthquake Reports page.
this is not what i do for a living, so please try not to laugh too hard. If you look at angulation of blanco fracture zone, it seems more in line with the forces of Ridgecrest. June 22 suggested movement along Mendocino fracture zone as well as activity at blanco … followed by cluster July 4 again in the neighborhood of blanco :::: is it that san andreas isn’t seeing much activity because force angulation is actually being transmitted farther inland? Regardless, seems like recent press has been buzzing about heightened level of concern in the Cascadian (BC public statement, military rescue drills Oregon and Washington) —
And thanks for the awesome site —
-
heading for the field, so i don’t have the time to fully discuss this. however, these fault systems are simply too far from each other to affect each other… (except for dynamic triggering, but the timing is not right for that). no need to be on alert, just to be prepared (things in cascadia are no different now than they were a month ago).
Love your data and your passion! Keep it up! It helps data geeks (like myself) get an informed grip on what is going on.
Thanks for all your hard work!
