Today (2015.11.09) we had another moderate sized earthquake along the Aleutian subduction zone, the largest of four earthquakes of magnitude mid 5-6. My initial earthquake report form 2015.11.02 can be found here.
-
Here are the USGS web sites for the largest magnitude earthquakes plotted below.
- 2015.11.02 M 5.9
- 2015.11.06 M 5.5
- 2015.11.08 M 5.4
- 2015.11.08 M 5.7
- 2015.11.09 M 6.2
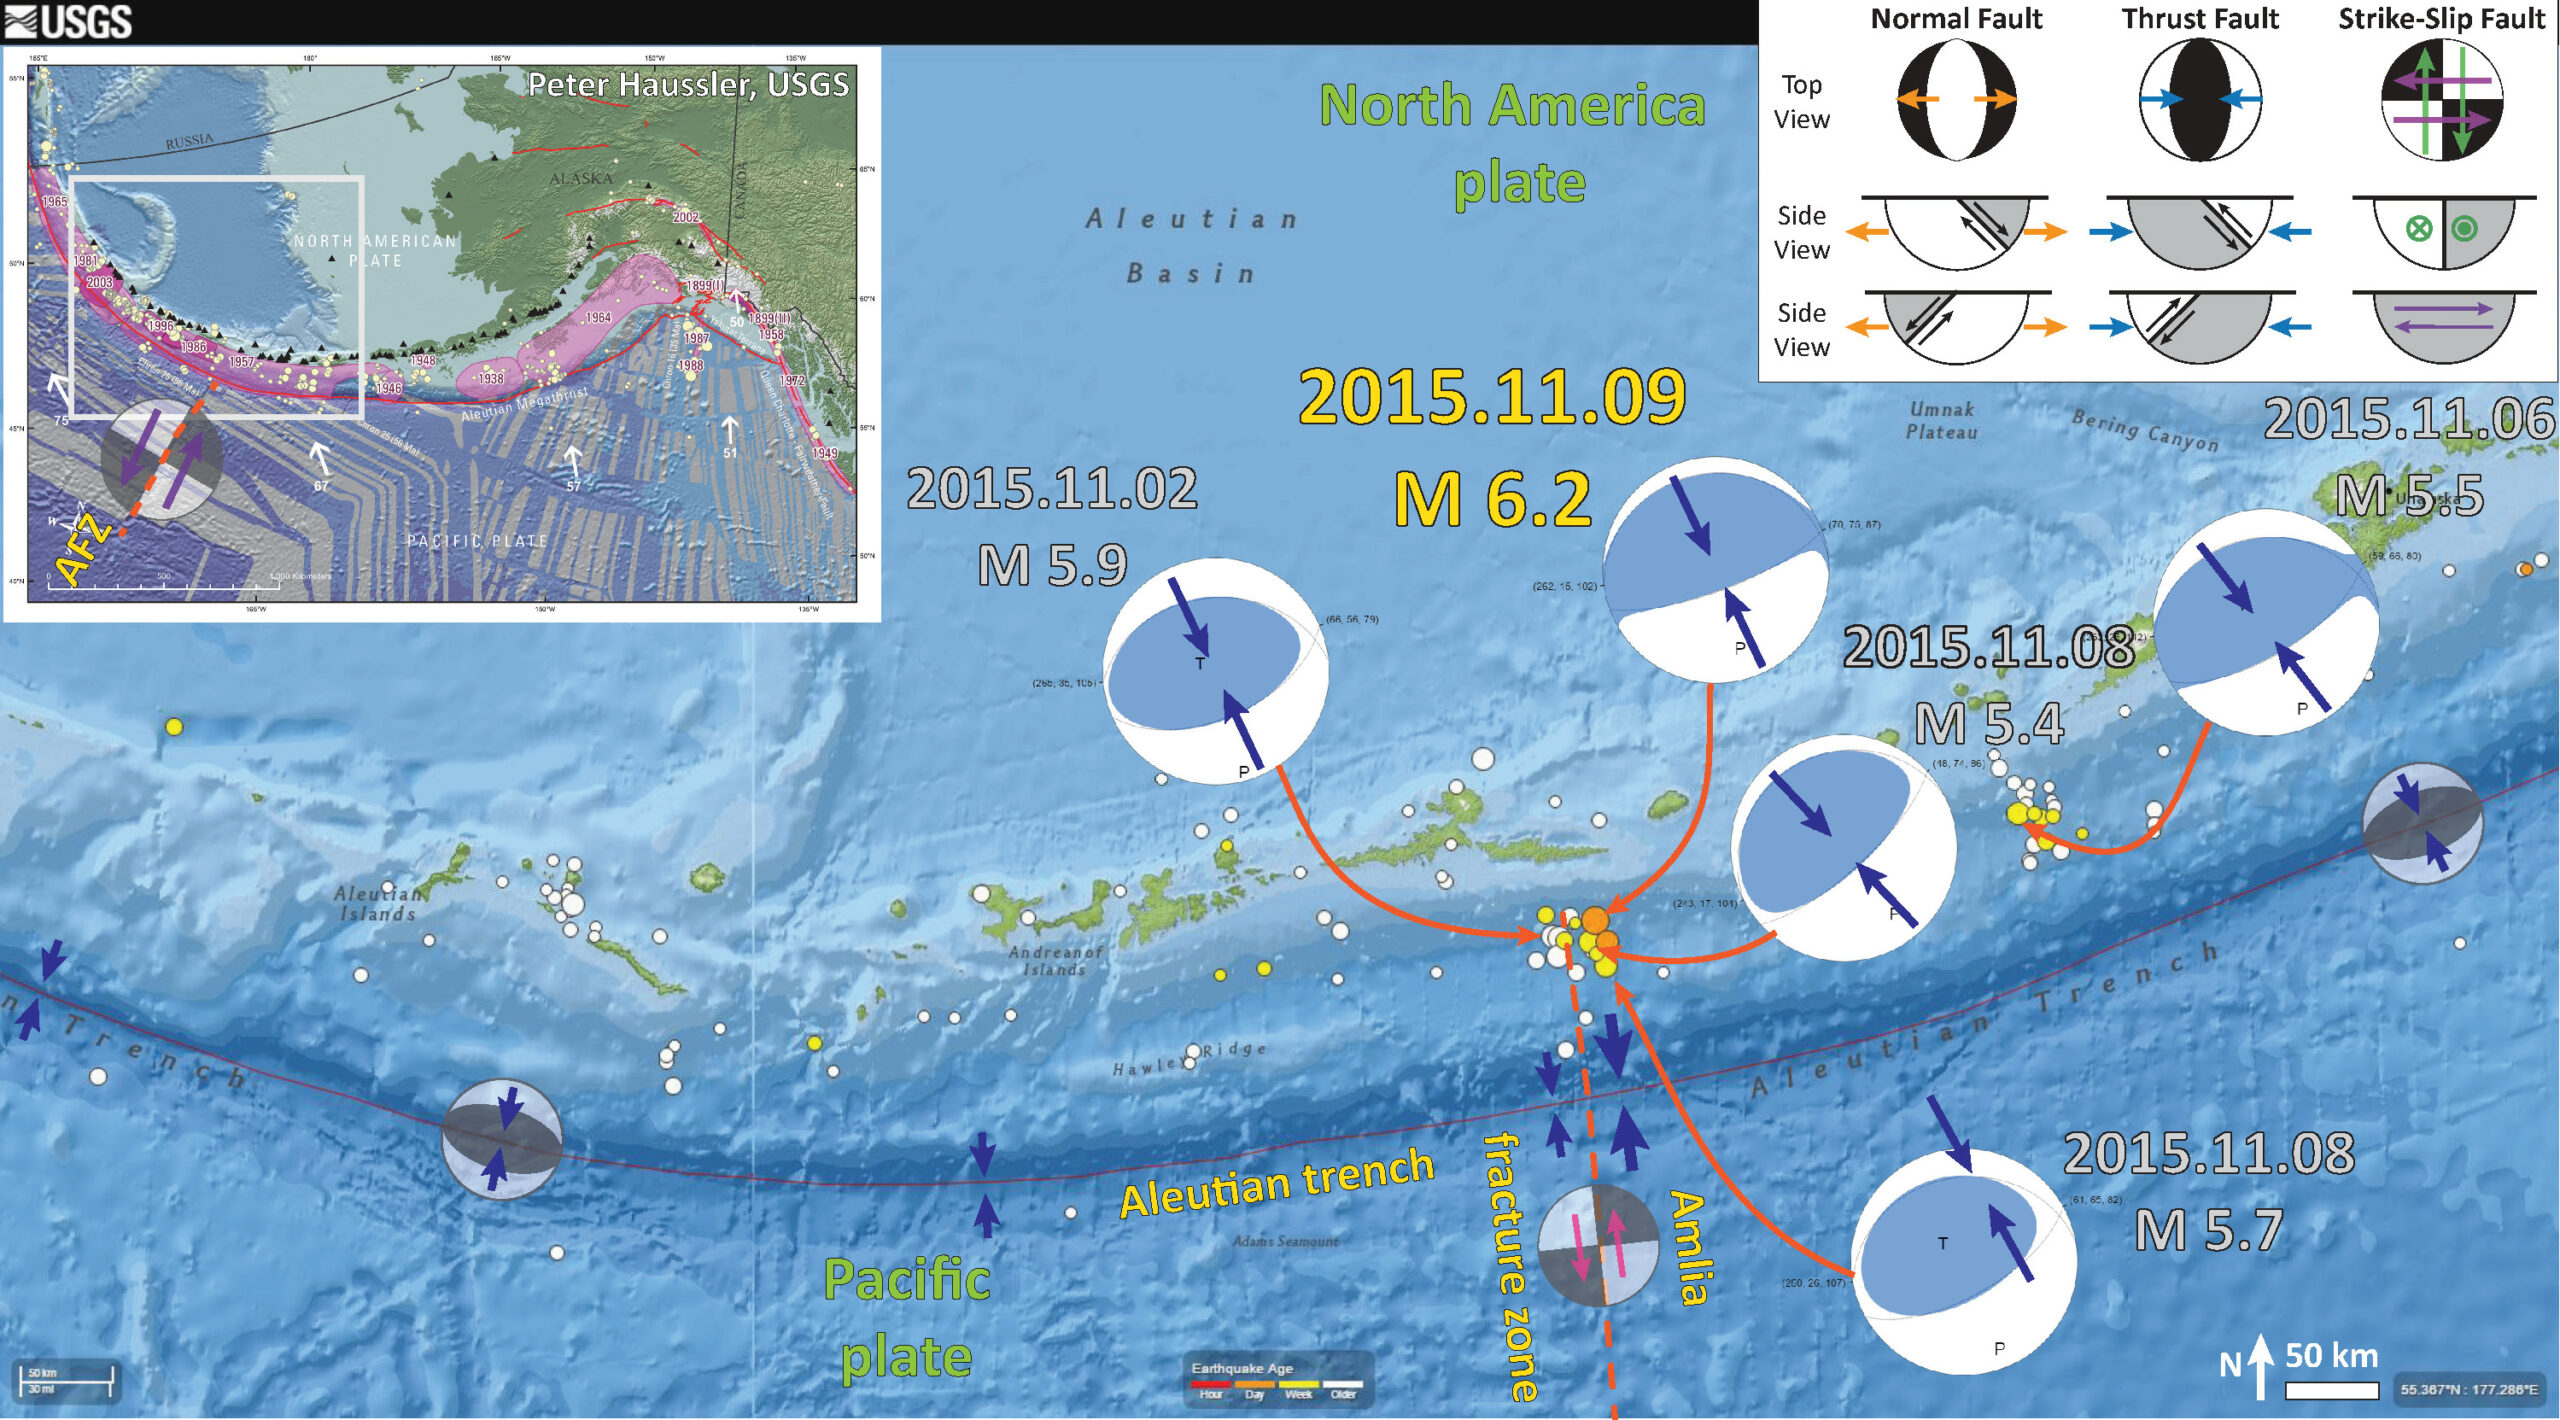
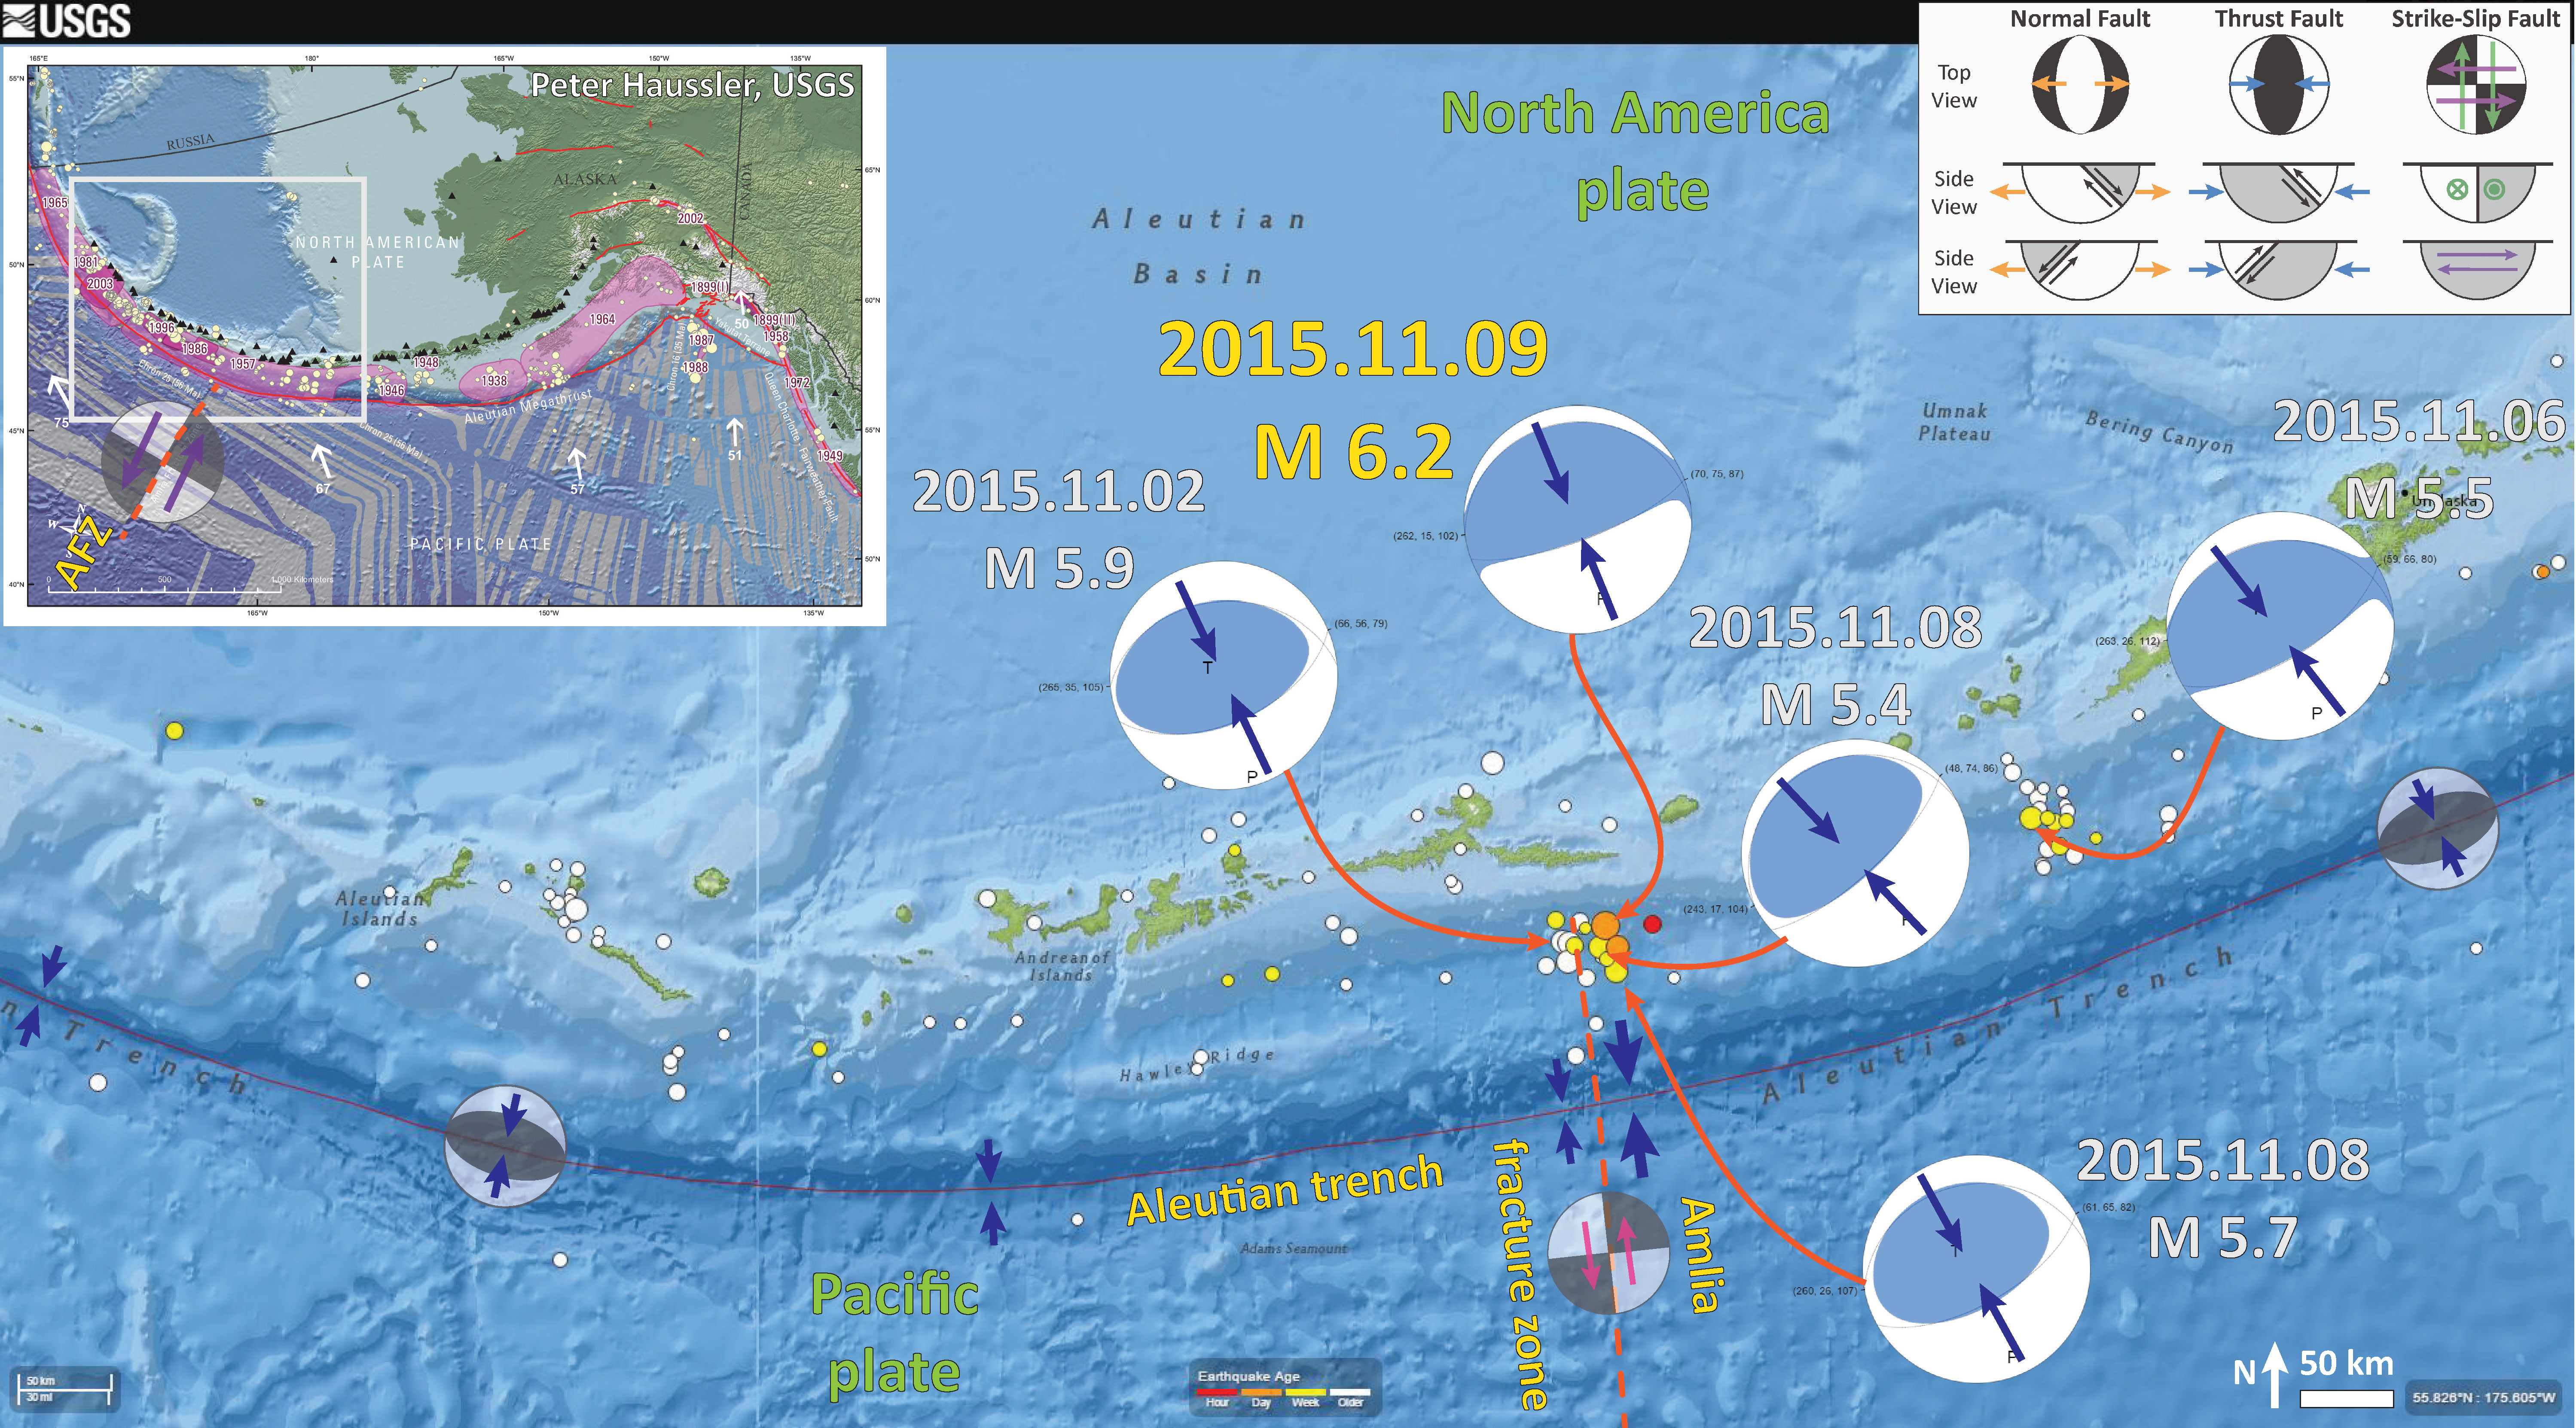
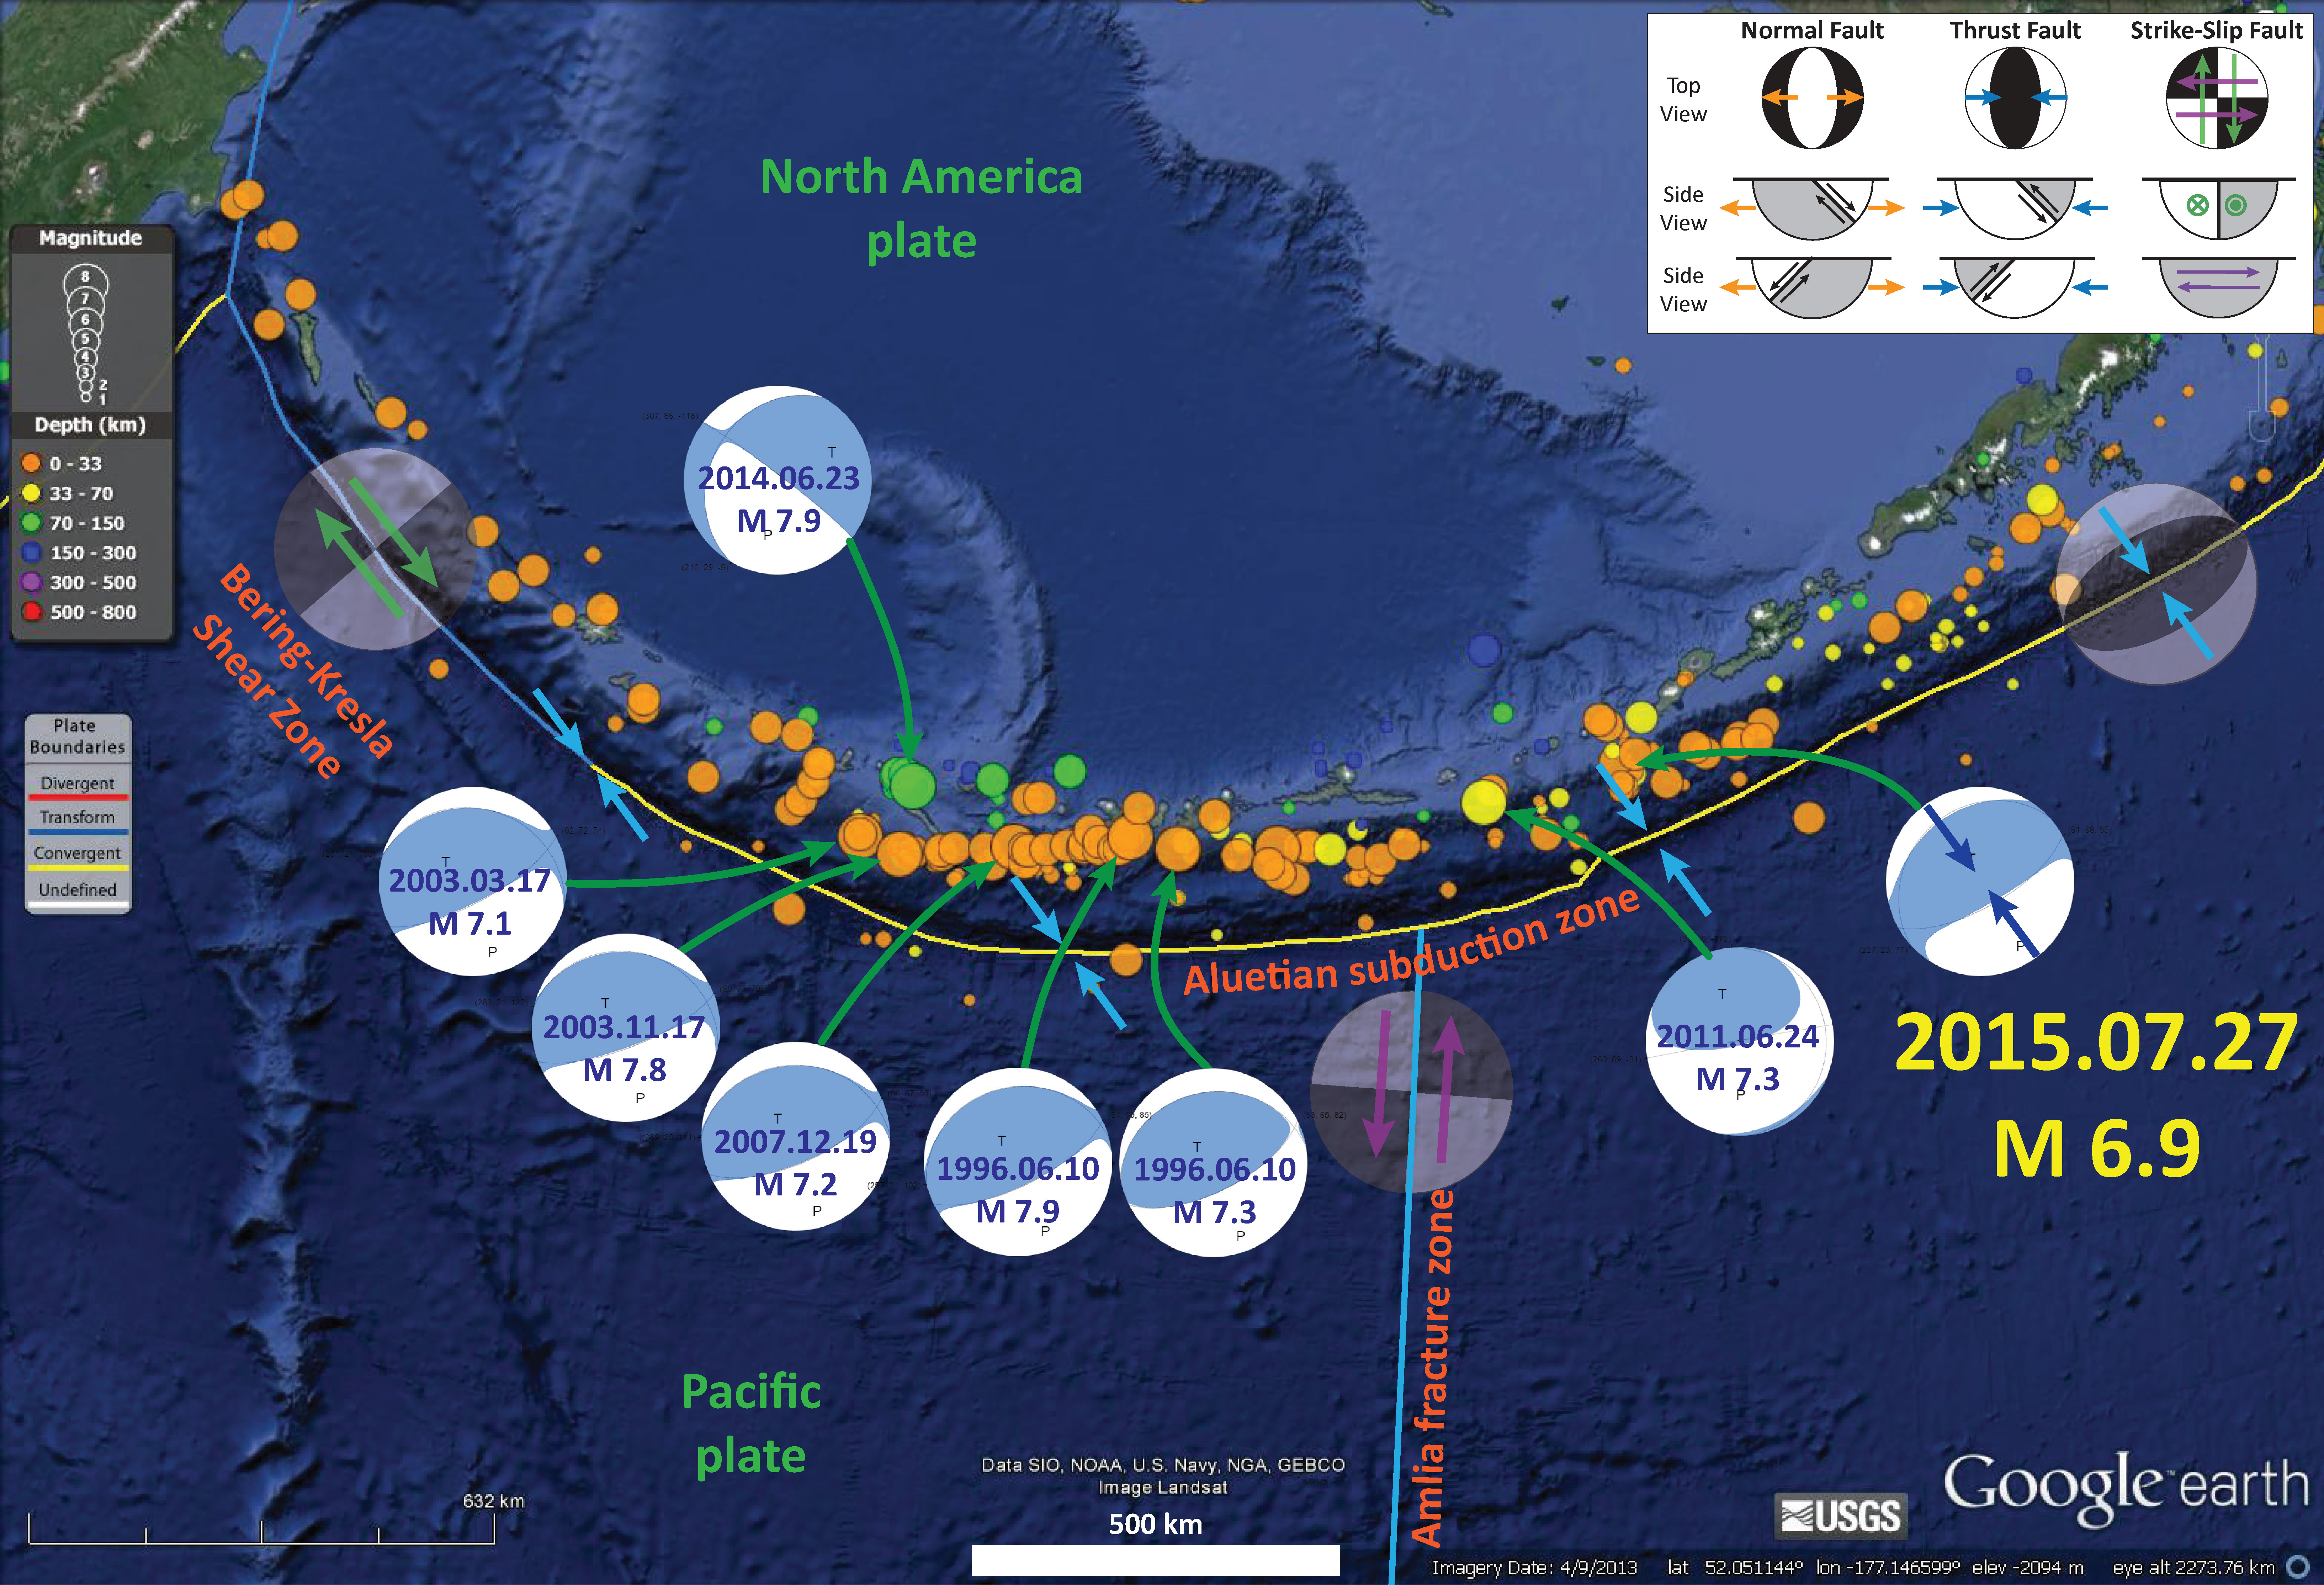
Below is a map showing the epicenters from earthquakes during the past 30 days in the region of some earthquakes with largest magnitudes ranging from 5.4-6.2 (linked above). I plot the moment tensors from the earthquakes with the 4 largest magnitudes.
These five earthquakes are the result of north-northwest compression from the subduction of the Pacific plate underneath the North America plate to the north. The majority of these earthquakes occurred in the region of the subduction zone where the Amlia fracture zone is aligned. The AMZ is a left lateral strike slip oriented fracture zone, which displaces crust of unequal age, beneath the megathrust.
The difference in age results in a variety of factors that may contribute to differences in fault stress across the fracture zone (buoyancy, thermal properties, etc). For example, older crust is colder and denser, so it sinks lower into the mantle and exerts a different tectonic force upon the overriding plate.
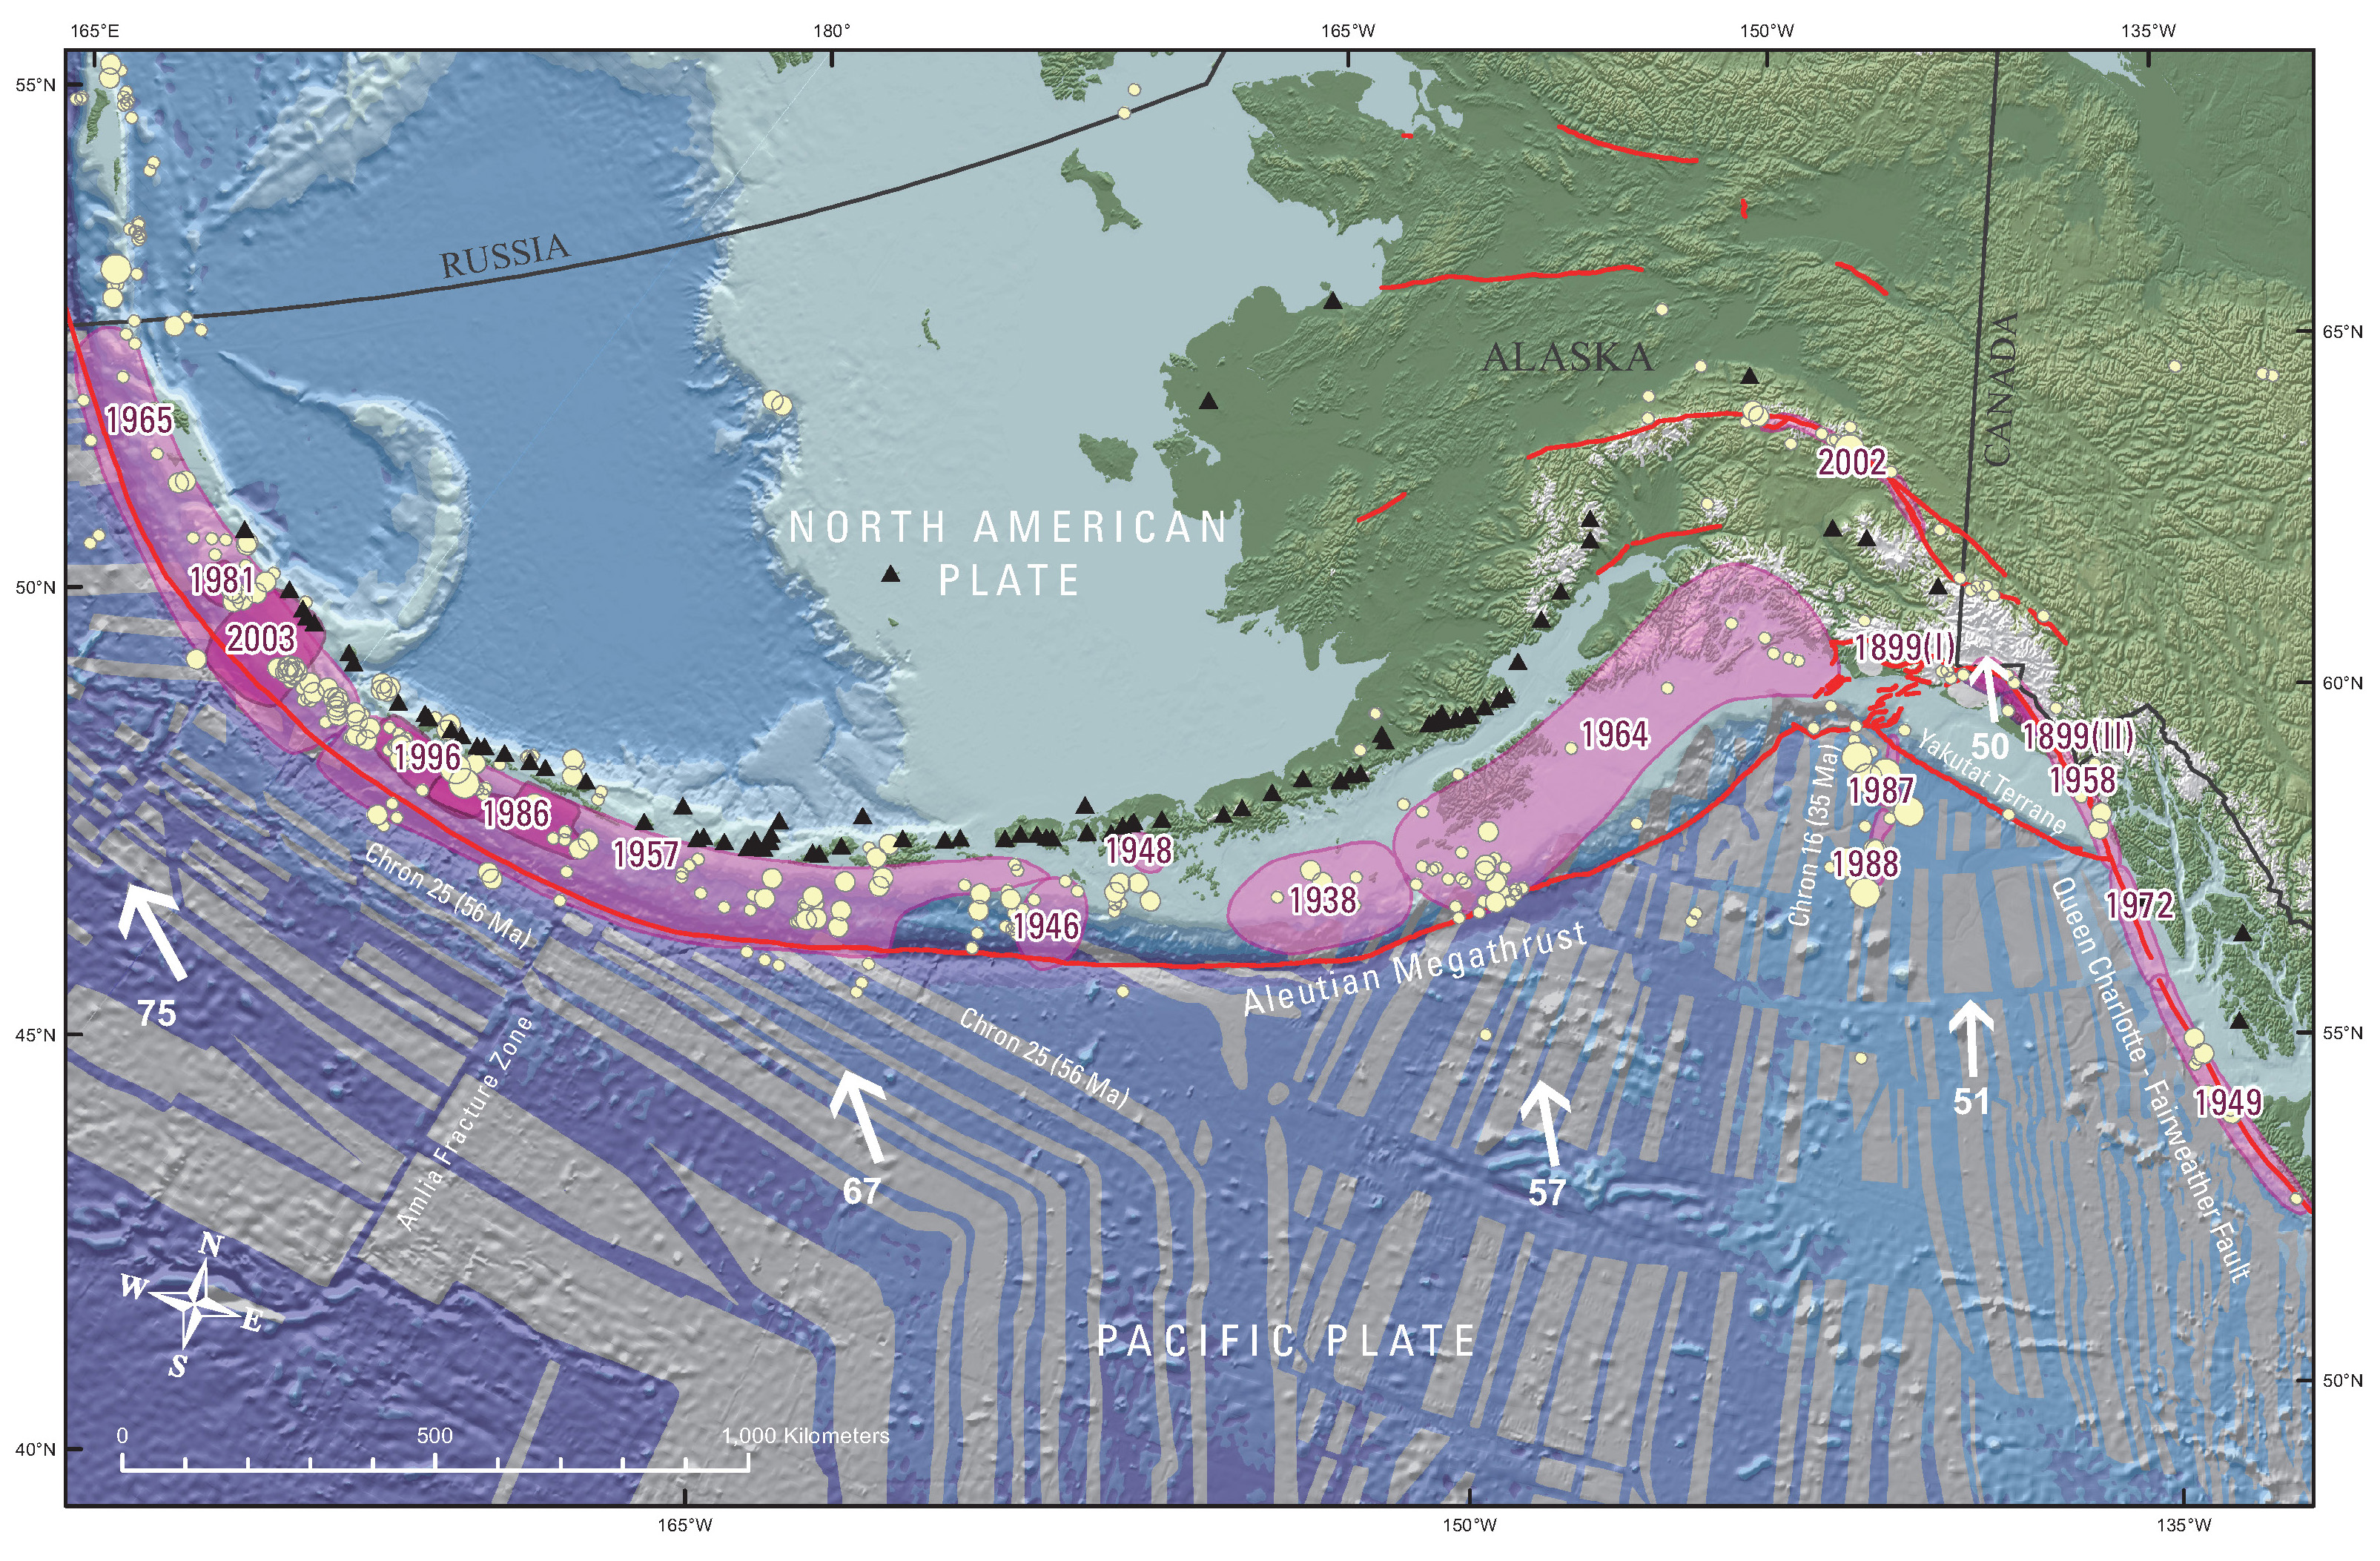
In the upper left corner, I place a map created by Peter Haeussler, USGS, which shows the historic earthquakes along the Alaska and Aleutian subduction zones.
I placed a moment tensor / focal mechanism legend in the upper right corner of the map. There is more material from the USGS web sites about moment tensors and focal mechanisms (the beach ball symbols). Both moment tensors and focal mechanisms are solutions to seismologic data that reveal two possible interpretations for fault orientation and sense of motion. One must use other information, like the regional tectonics, to interpret which of the two possibilities is more likely.
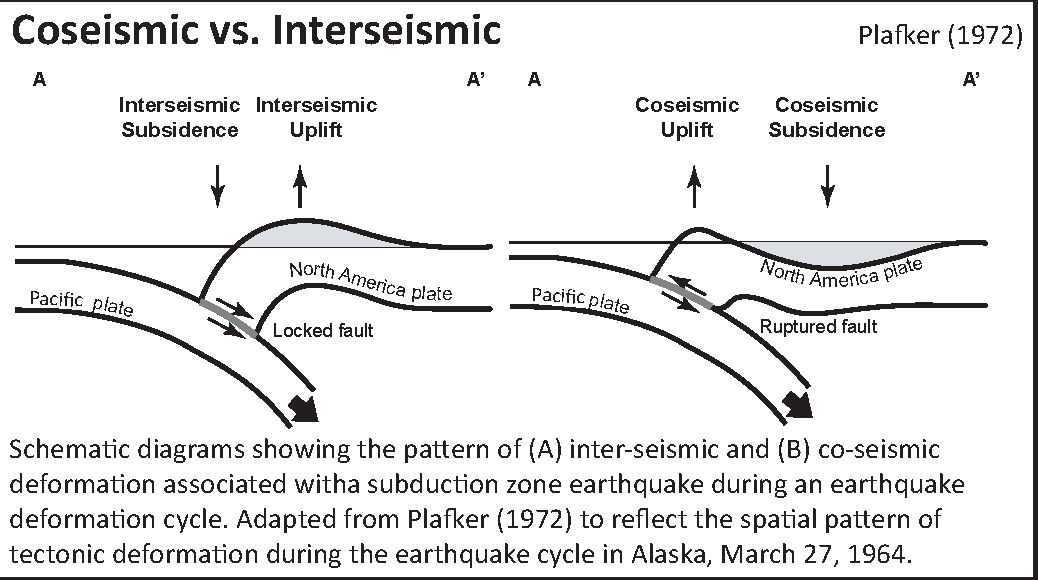
This is a USGS graphic that shows a cross section of the Aleutian subduction zone that is a part of the “Eastern Aleutian Volcanic Arc Digital Model.’
This shows a cross section of a subduction zone through the two main parts of the earthquake cycle. The interseismic part (in-between earthquakes) and the coseismic part (during earthquakes). This was developed by George Plafker and published in his 1972 paper on the Good Friday Earthquake.
Here is a map that shows historic earthquake slip regions as pink polygons (Peter Haeussler, USGS). Dr. Haeussler also plotted the magnetic anomalies (grey regions), the arc volcanoes (black diamonds), and the plate motion vectors (mm/yr, NAP vs PP).
This region was active in September of 2015 also. Here is my earthquake report from that series of earthquakes. Below is a map from this 2015/09 report that shows some late 20th and early 21st century earthquakes and their moment tensors for this region of the Aleutian subduction zone.
-
References:
- Plafker, G., 1972. Alaskan earthquake of 1964 and Chilean earthquake of 1960: Implications for arc tectonics in Journal of Geophysical Research, v. 77, p. 901-925.
1 thought on “Earthquake report: Aleutian subduction zone at the Amlia fracture zone update”