This took me just a few minutes to put together. I searched the USGS earthquakes website with a rectangular search area for earthquakes greater than M = 6.0, downloaded the google Earth kml file with epicenters colored by depth (and animated), and recorded this animation to a video capture application. Here is the search that I used to get these data.
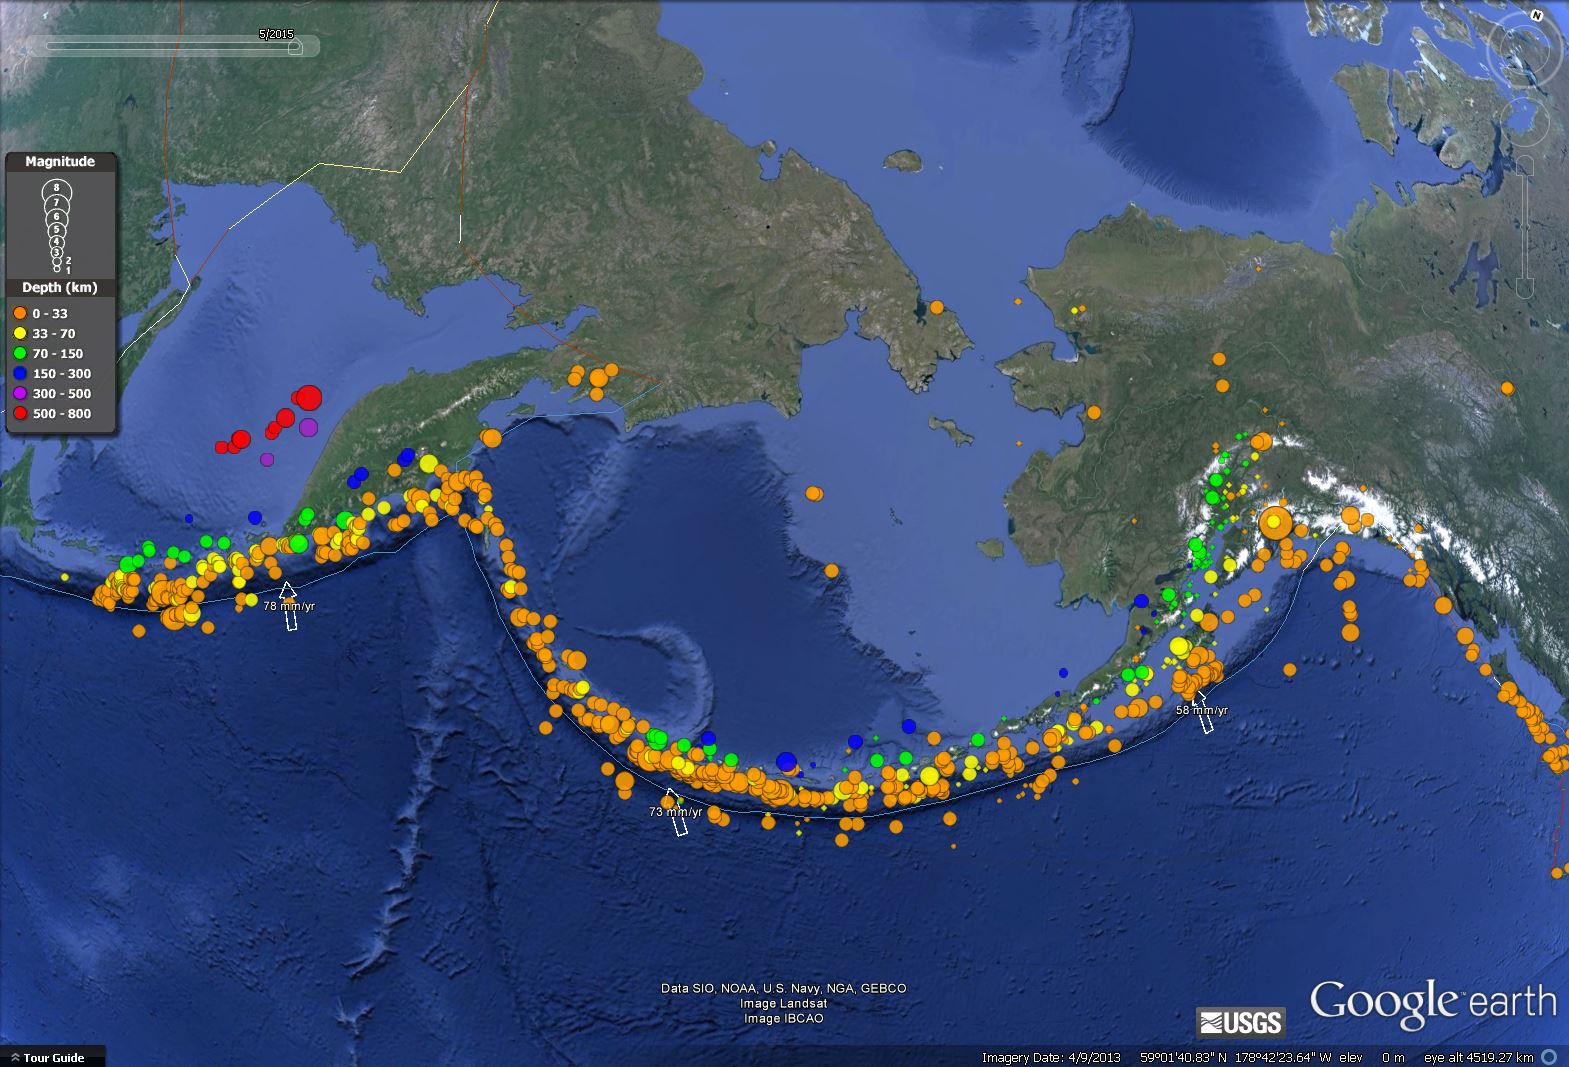
Here is a map showing the epicenters in the following animations. Check out my post about the M 6.7 earthquake from early this morning. I include more information about the regional tectonics on that page (and provide links to other sources too).
Here are two videos that show animations of the seismicity from 1960 until today.
The first one leaves the epicenters on the screen for the entire animation. Here is a link to the file to save to your computer.
This animation has a moving time window (~1 year), so that 1 year after the earthquake, it is removed from the map. Here is a link to the file to save to your computer.
N I C E site, Jason!
thanks!