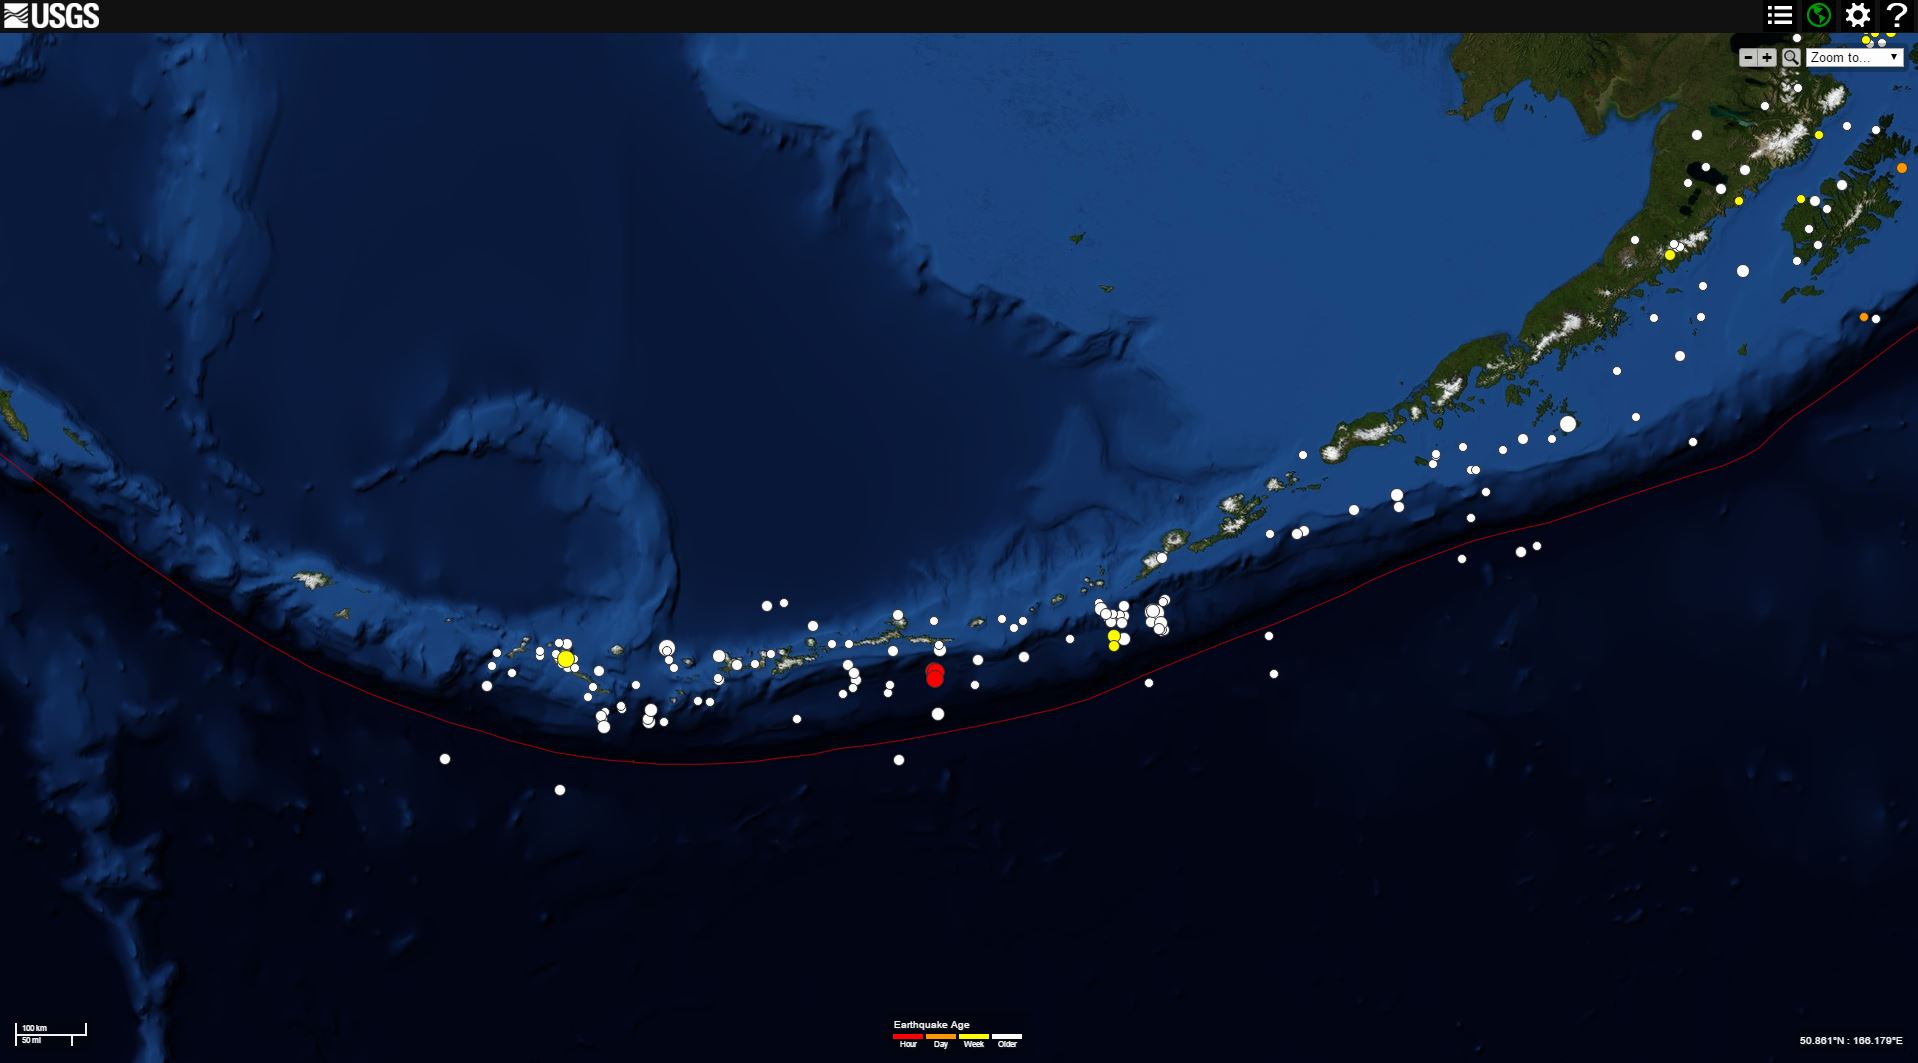
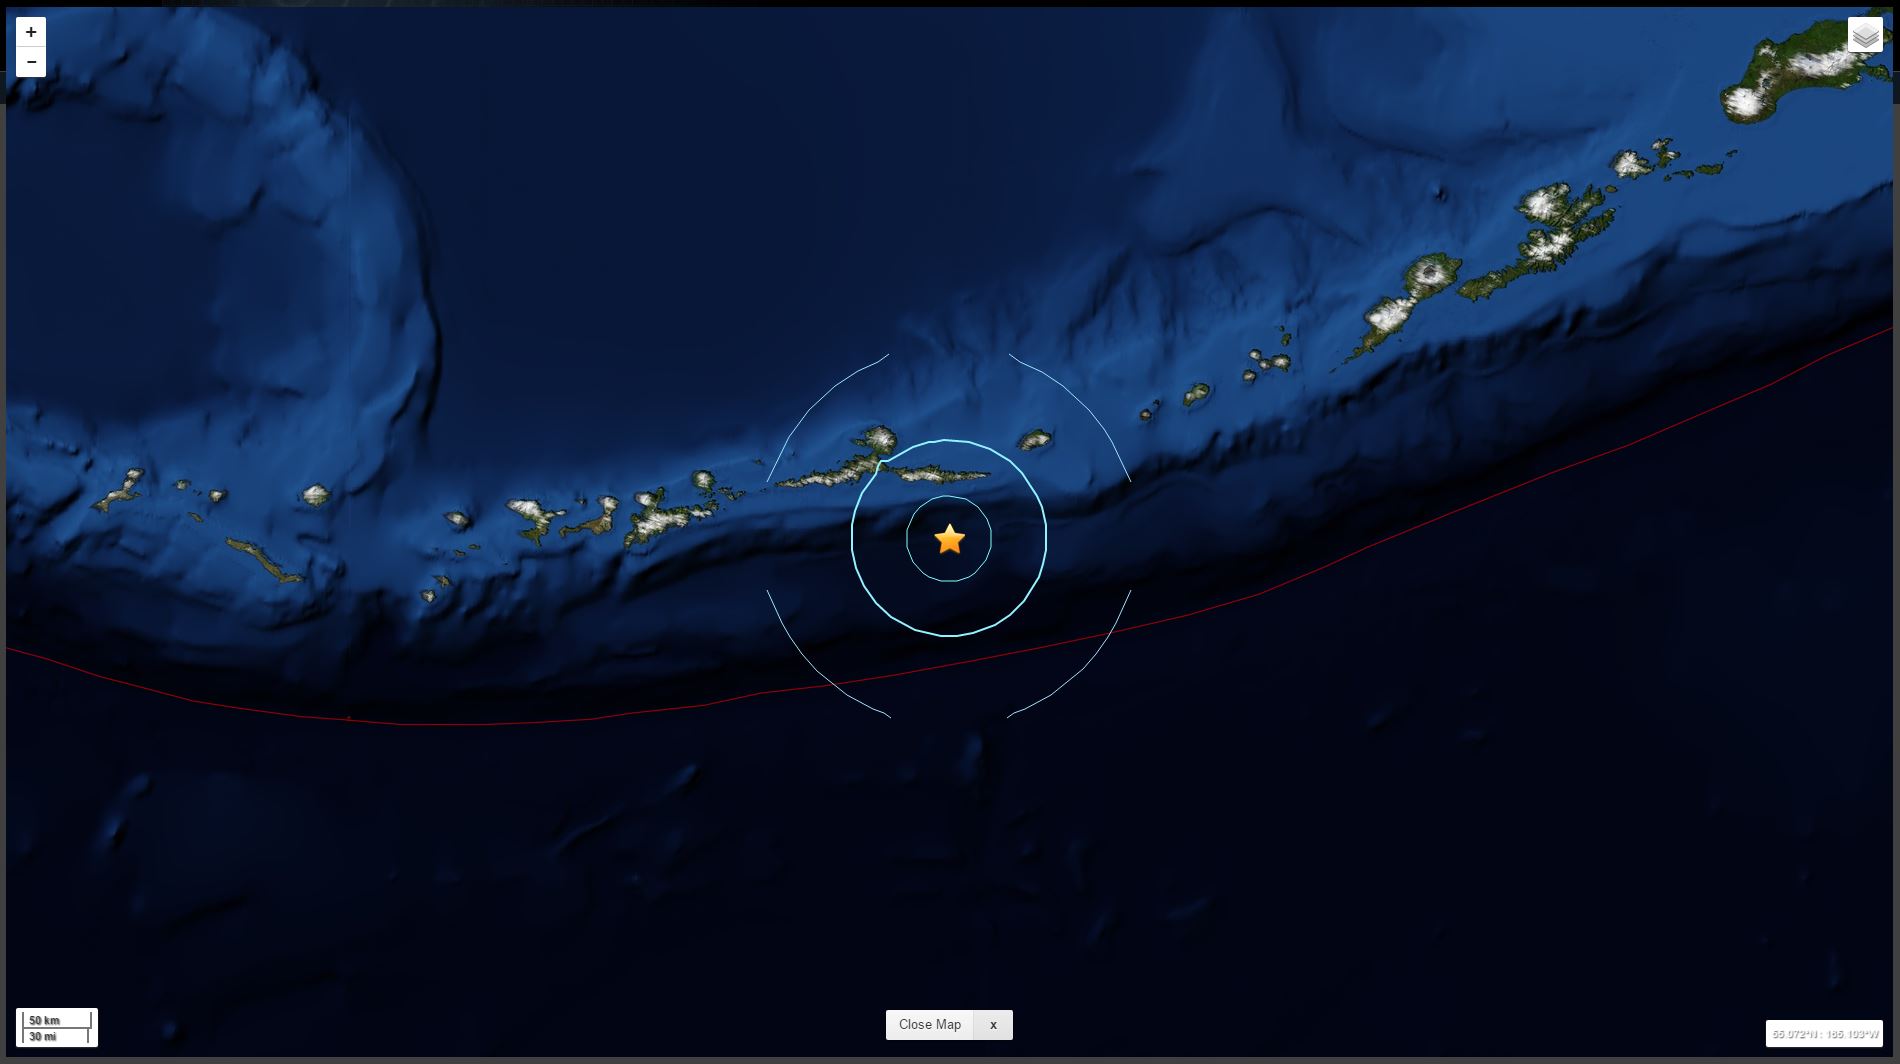
There were just a few earthquakes in the mid 5 magnitude range. The first one was largest, so we would consider the others aftershocks. They appear to align north-south, so may be related to the Amlia fracture zone. The Amlia fracture zone is a strike-slip fault system in the downgoing Pacific plate.
Here is a map that shows these three earthquakes as red circles. The three earthquakes temporally plot north to south (i.e. the M = 5.9 is the northernmost and the M = 5.3 is the southernmost).
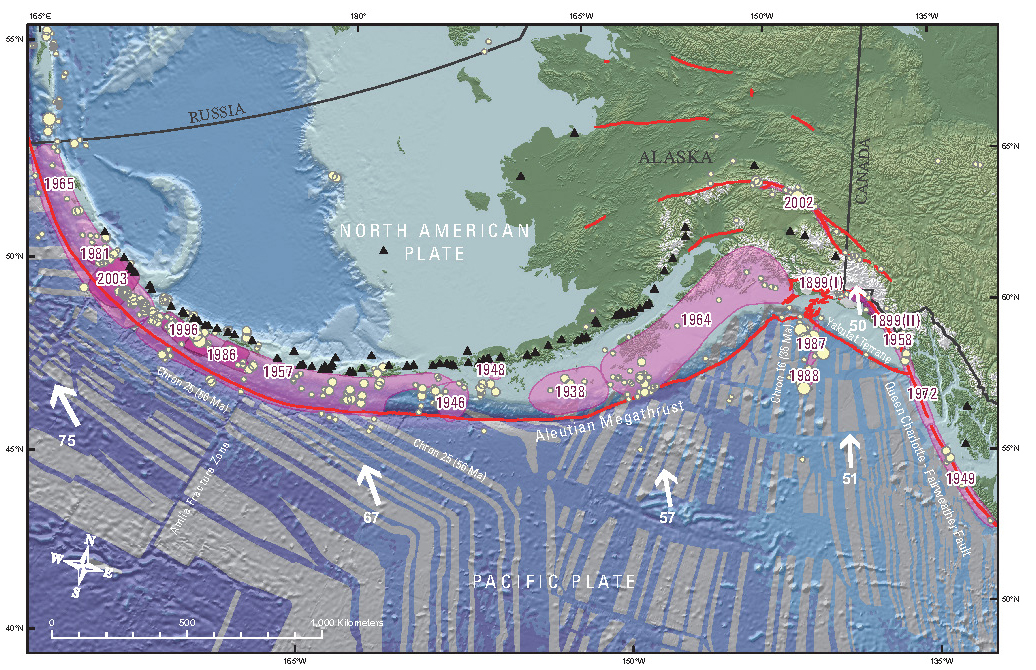
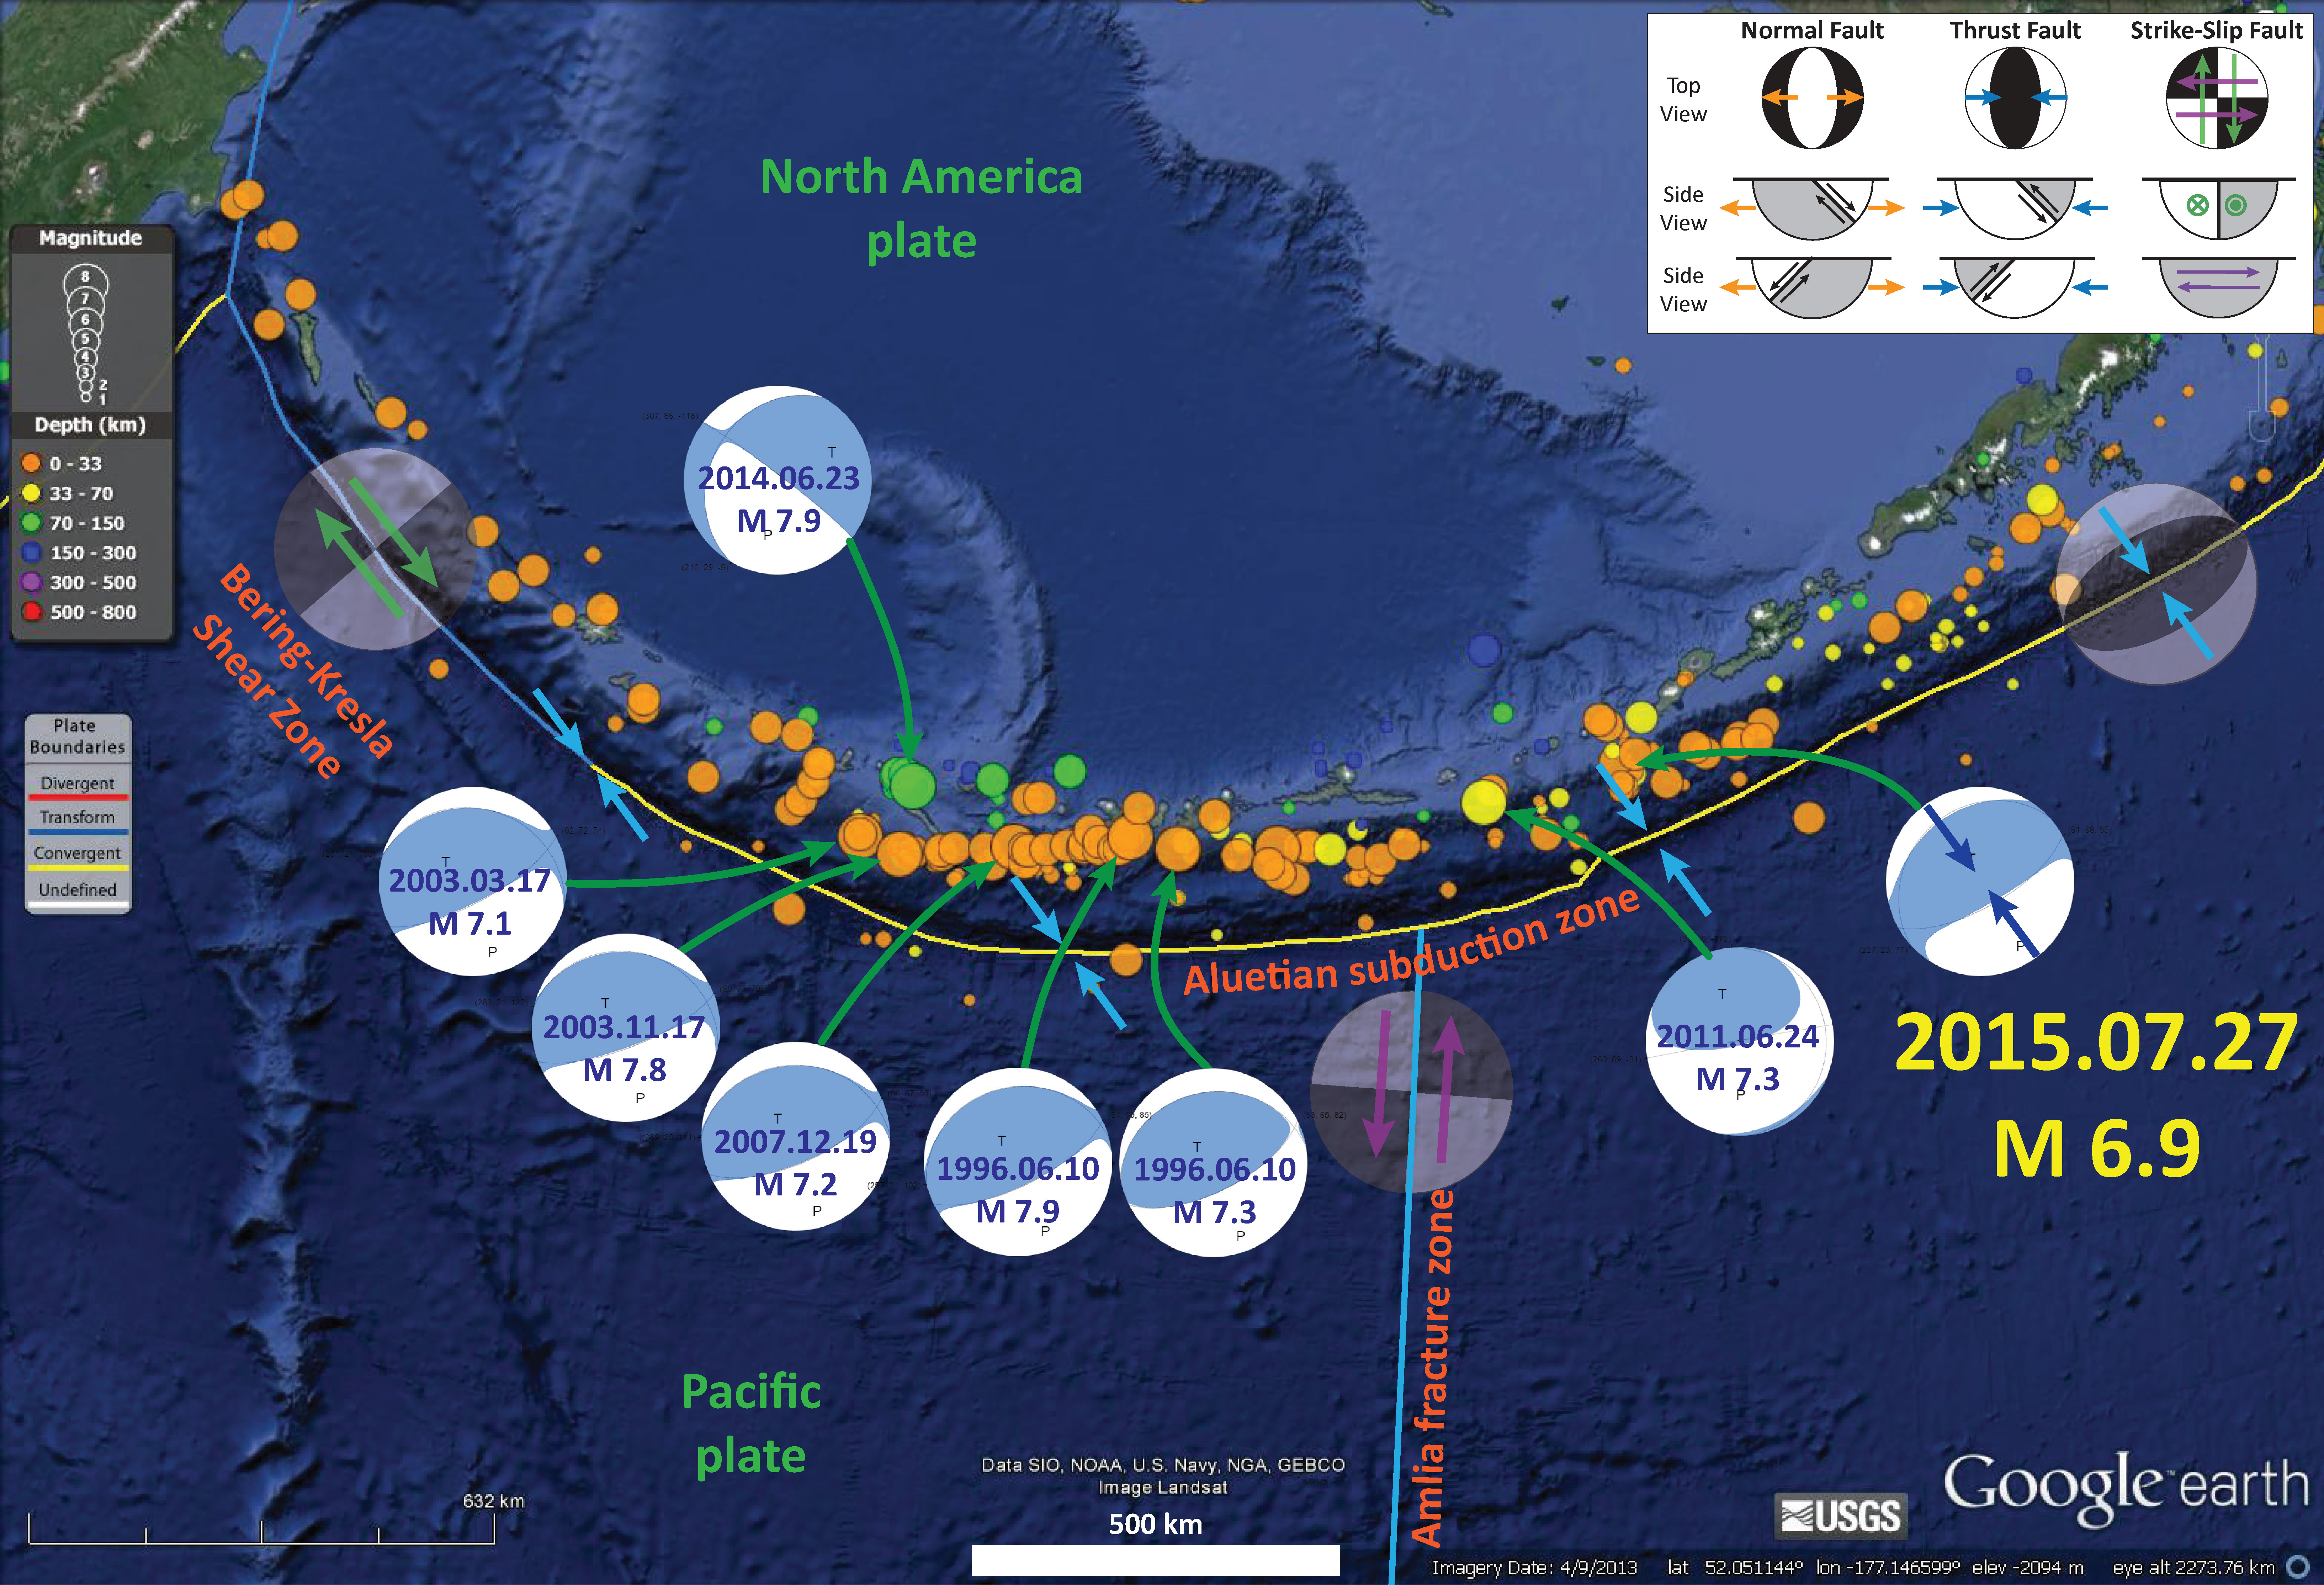
Here is a map that shows historic earthquake slip regions as pink polygons (Peter Haeussler, USGS). Dr. Haeussler also plotted the magnetic anomalies (grey regions), the arc volcanoes (black diamonds), and the plate motion vectors (mm/yr, NAP vs PP). Today’s M 6.9 earthquake occurred in the eastern part of the 1957 M = 8.6 earthquake region.
Below are two videos that show animations of the seismicity from 1960 until May 2015. Here is a map showing the epicenters in the following animations. Check out my post about the M 6.7 earthquake along the Alaska Peninsula from May 2015. I include more information about the regional tectonics on that page (and provide links to other sources too).
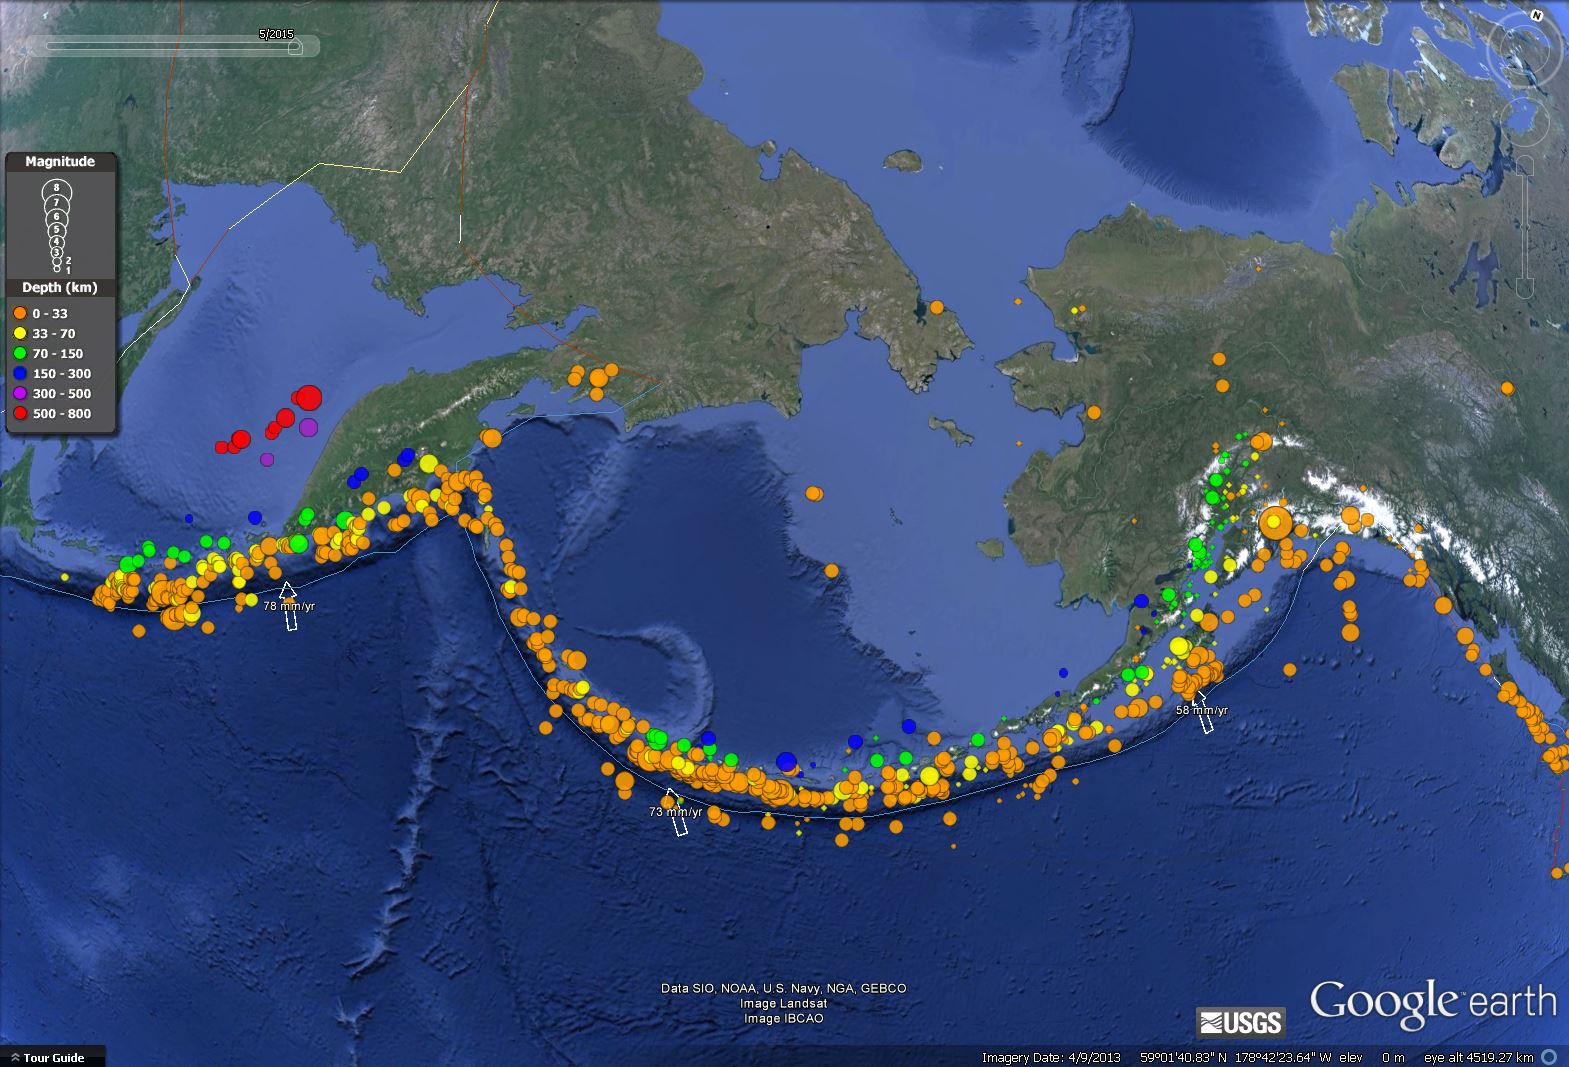
The first one leaves the epicenters on the screen for the entire animation. Here is a link to the file to save to your computer.
This animation has a moving time window (~1 year), so that 1 year after the earthquake, it is removed from the map. Here is a link to the file to save to your computer.
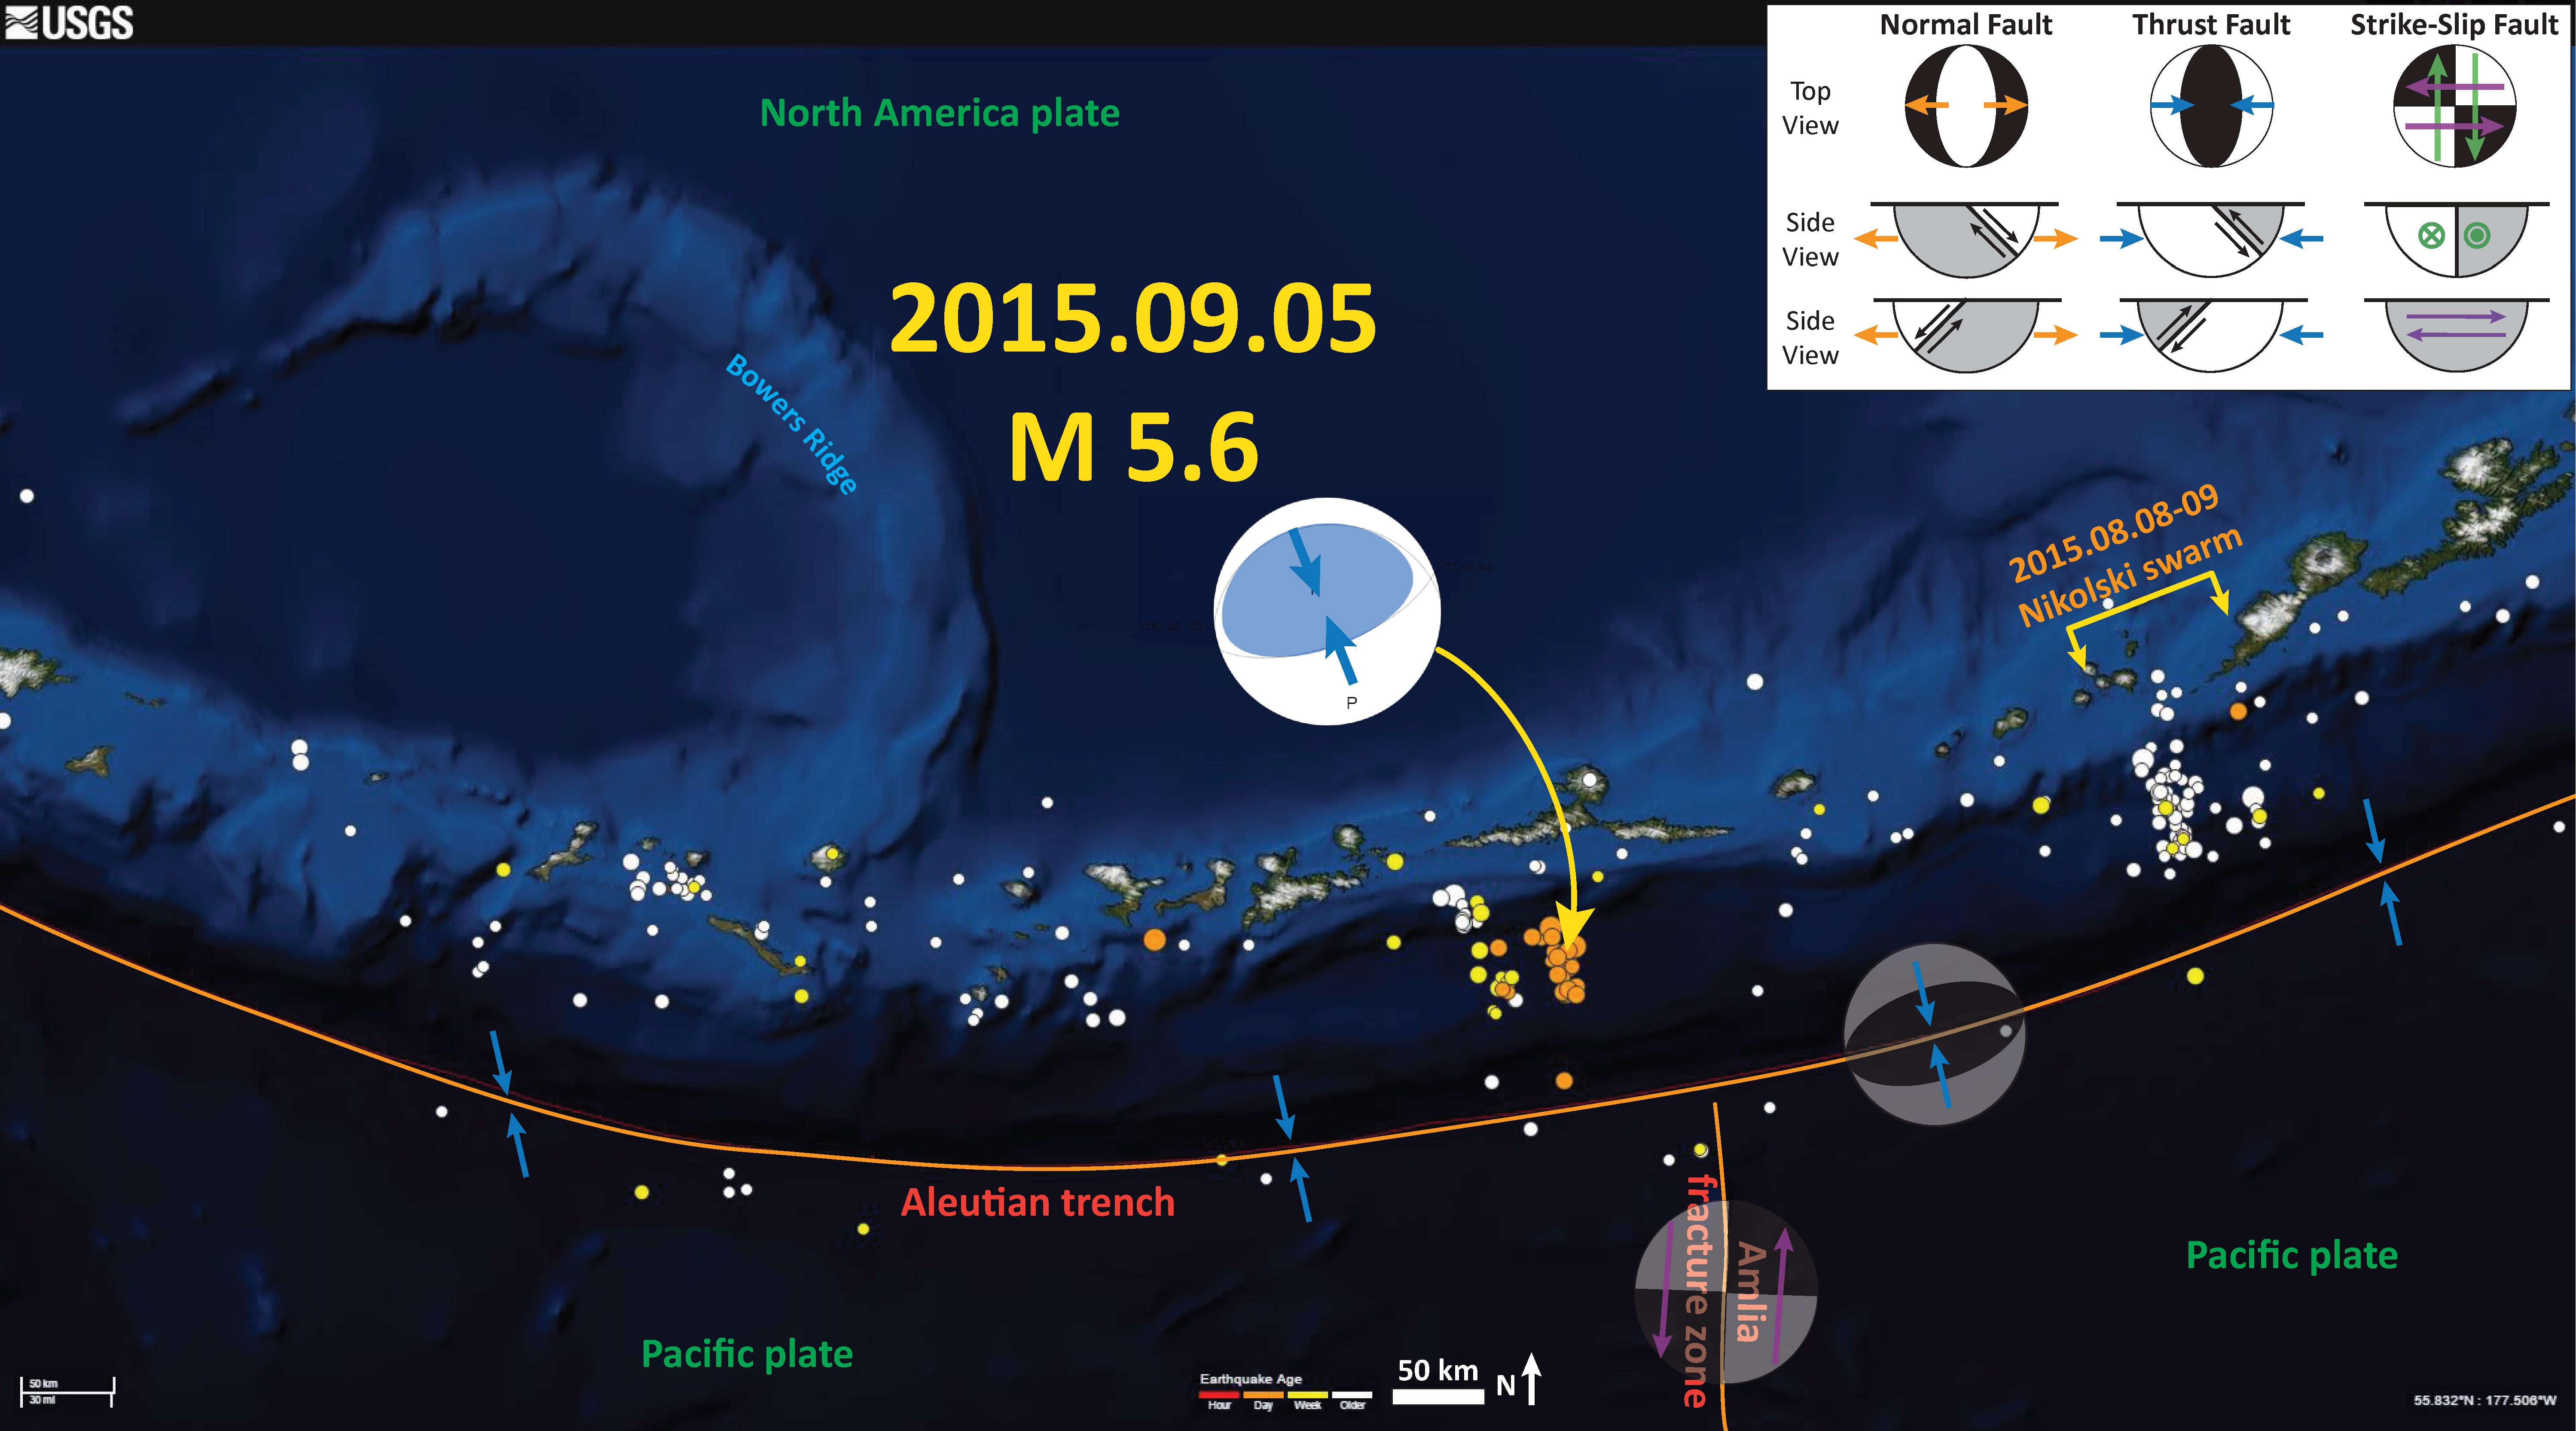
This region has been active lately, with a M 5.6 and related swarm in September of 2015. Here is a map from that earthquake swarm.
In July of 2015, there was another earthquake swarm to the east, near the Fox Islands. Here is my report about that swarm. Here is a map in which I compilte the seismicity for this region from 1996 through July 2015.
-
Here are the USGS web pages for the earthquakes in the above map that have moment tensors plotted.
- 1996/06/10 M 7.9
- 1996/06/10 M 7.3
- 2003/03/17 M 7.1
- 2003/11/17 M 7.8
- 2007/12/19 M 7.2
- 2011/06/24 M 7.3
- 2014/06/23 M 7.9
- 2015/07/27 M 6.9
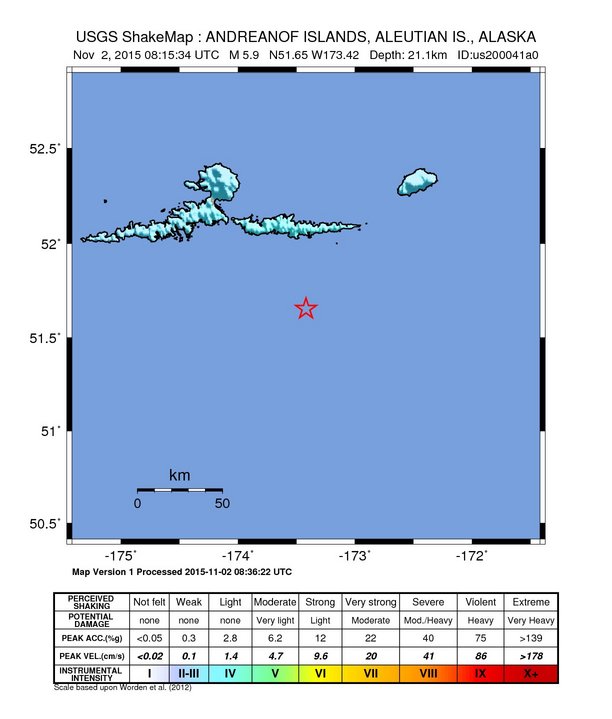
Here is a map showing the shaking intensity contours for the M = 5.9. These contours show regions of equal ground shaking using the Modified Mercalli Shaking Intensity scale.
Here is the modeled estimate of ground shaking. This is based upon attenuation models of ground shaking, as developed by regressions of thousands of earthquake seismologic records. This also uses the MMI scale.
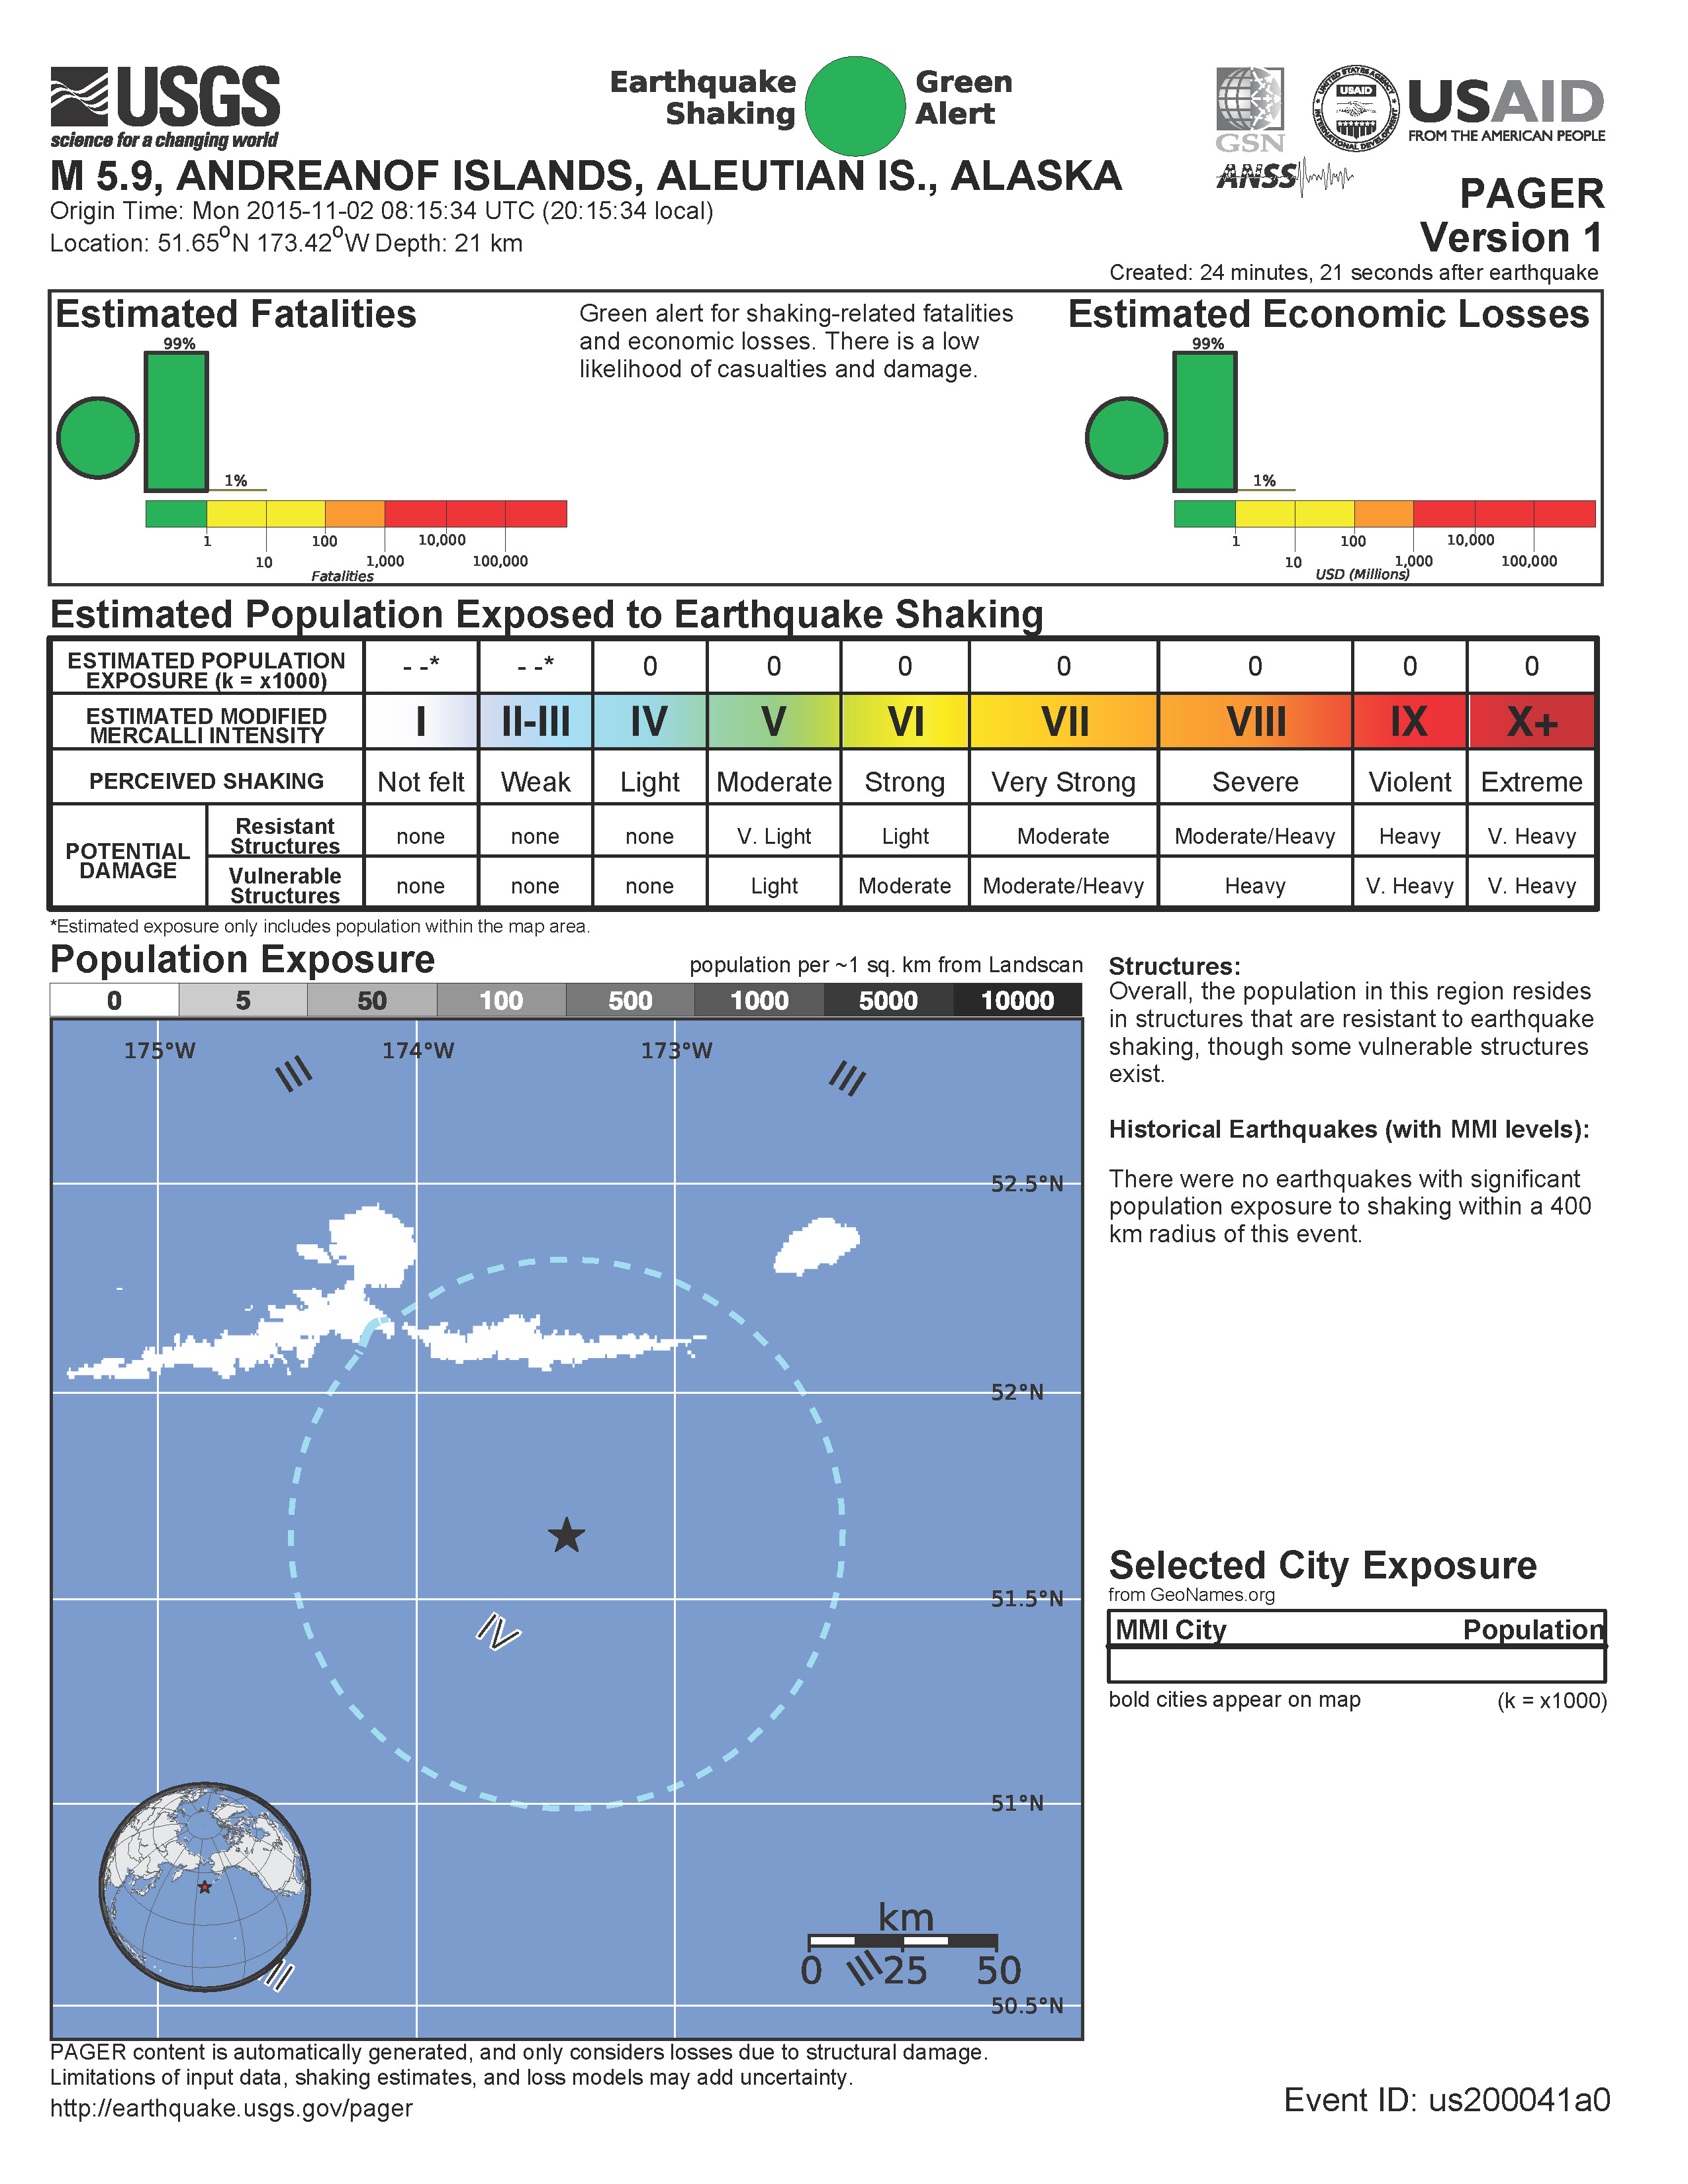
Here is the PAGER estimate of damages to people and their belongings. This is primarily based upon the same model that is used to prepare the above map. Once more seismologic records are produced and analyzed, there may be updates to this PAGER report. I do not suspect that this earthquake will have an update.
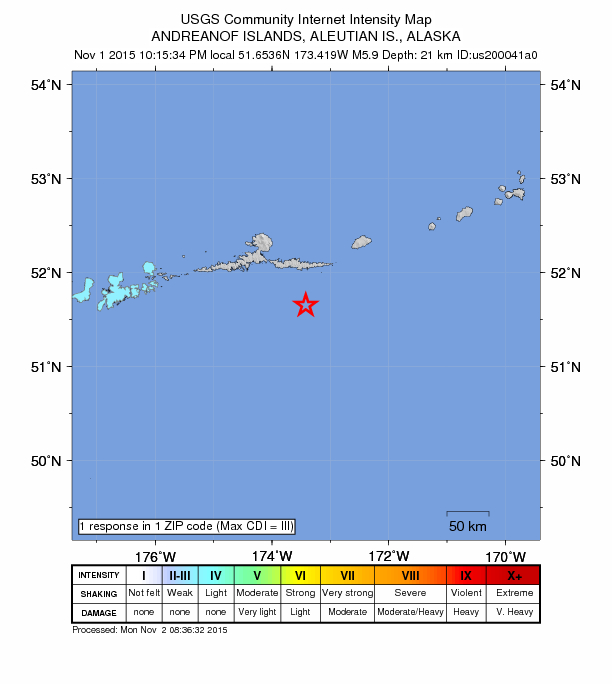
What is a better estimate of ground shaking is the “Did You Feel It?” map, which is made from actual observations from people.
4 thoughts on “Earthquakes along the Amlia fracture zone!”