Well. What a firestorm of social media discusions about this earthquake. It seems that, like how we learn so much when earthquakes like this happen, the amount of interacting in public on social media has been growing earthquake by earthquake.
I spent some time this afternoon looking at the magnetic anomalies, after taking a load of a part of an old building to the county dump (transfer station) before the rain started. Stephen Hicks found a great paper (and tweeted about it, see my original report here where I include his tweet).
UPDATES Below is a list of all the reports associated with this earthquake sequence.
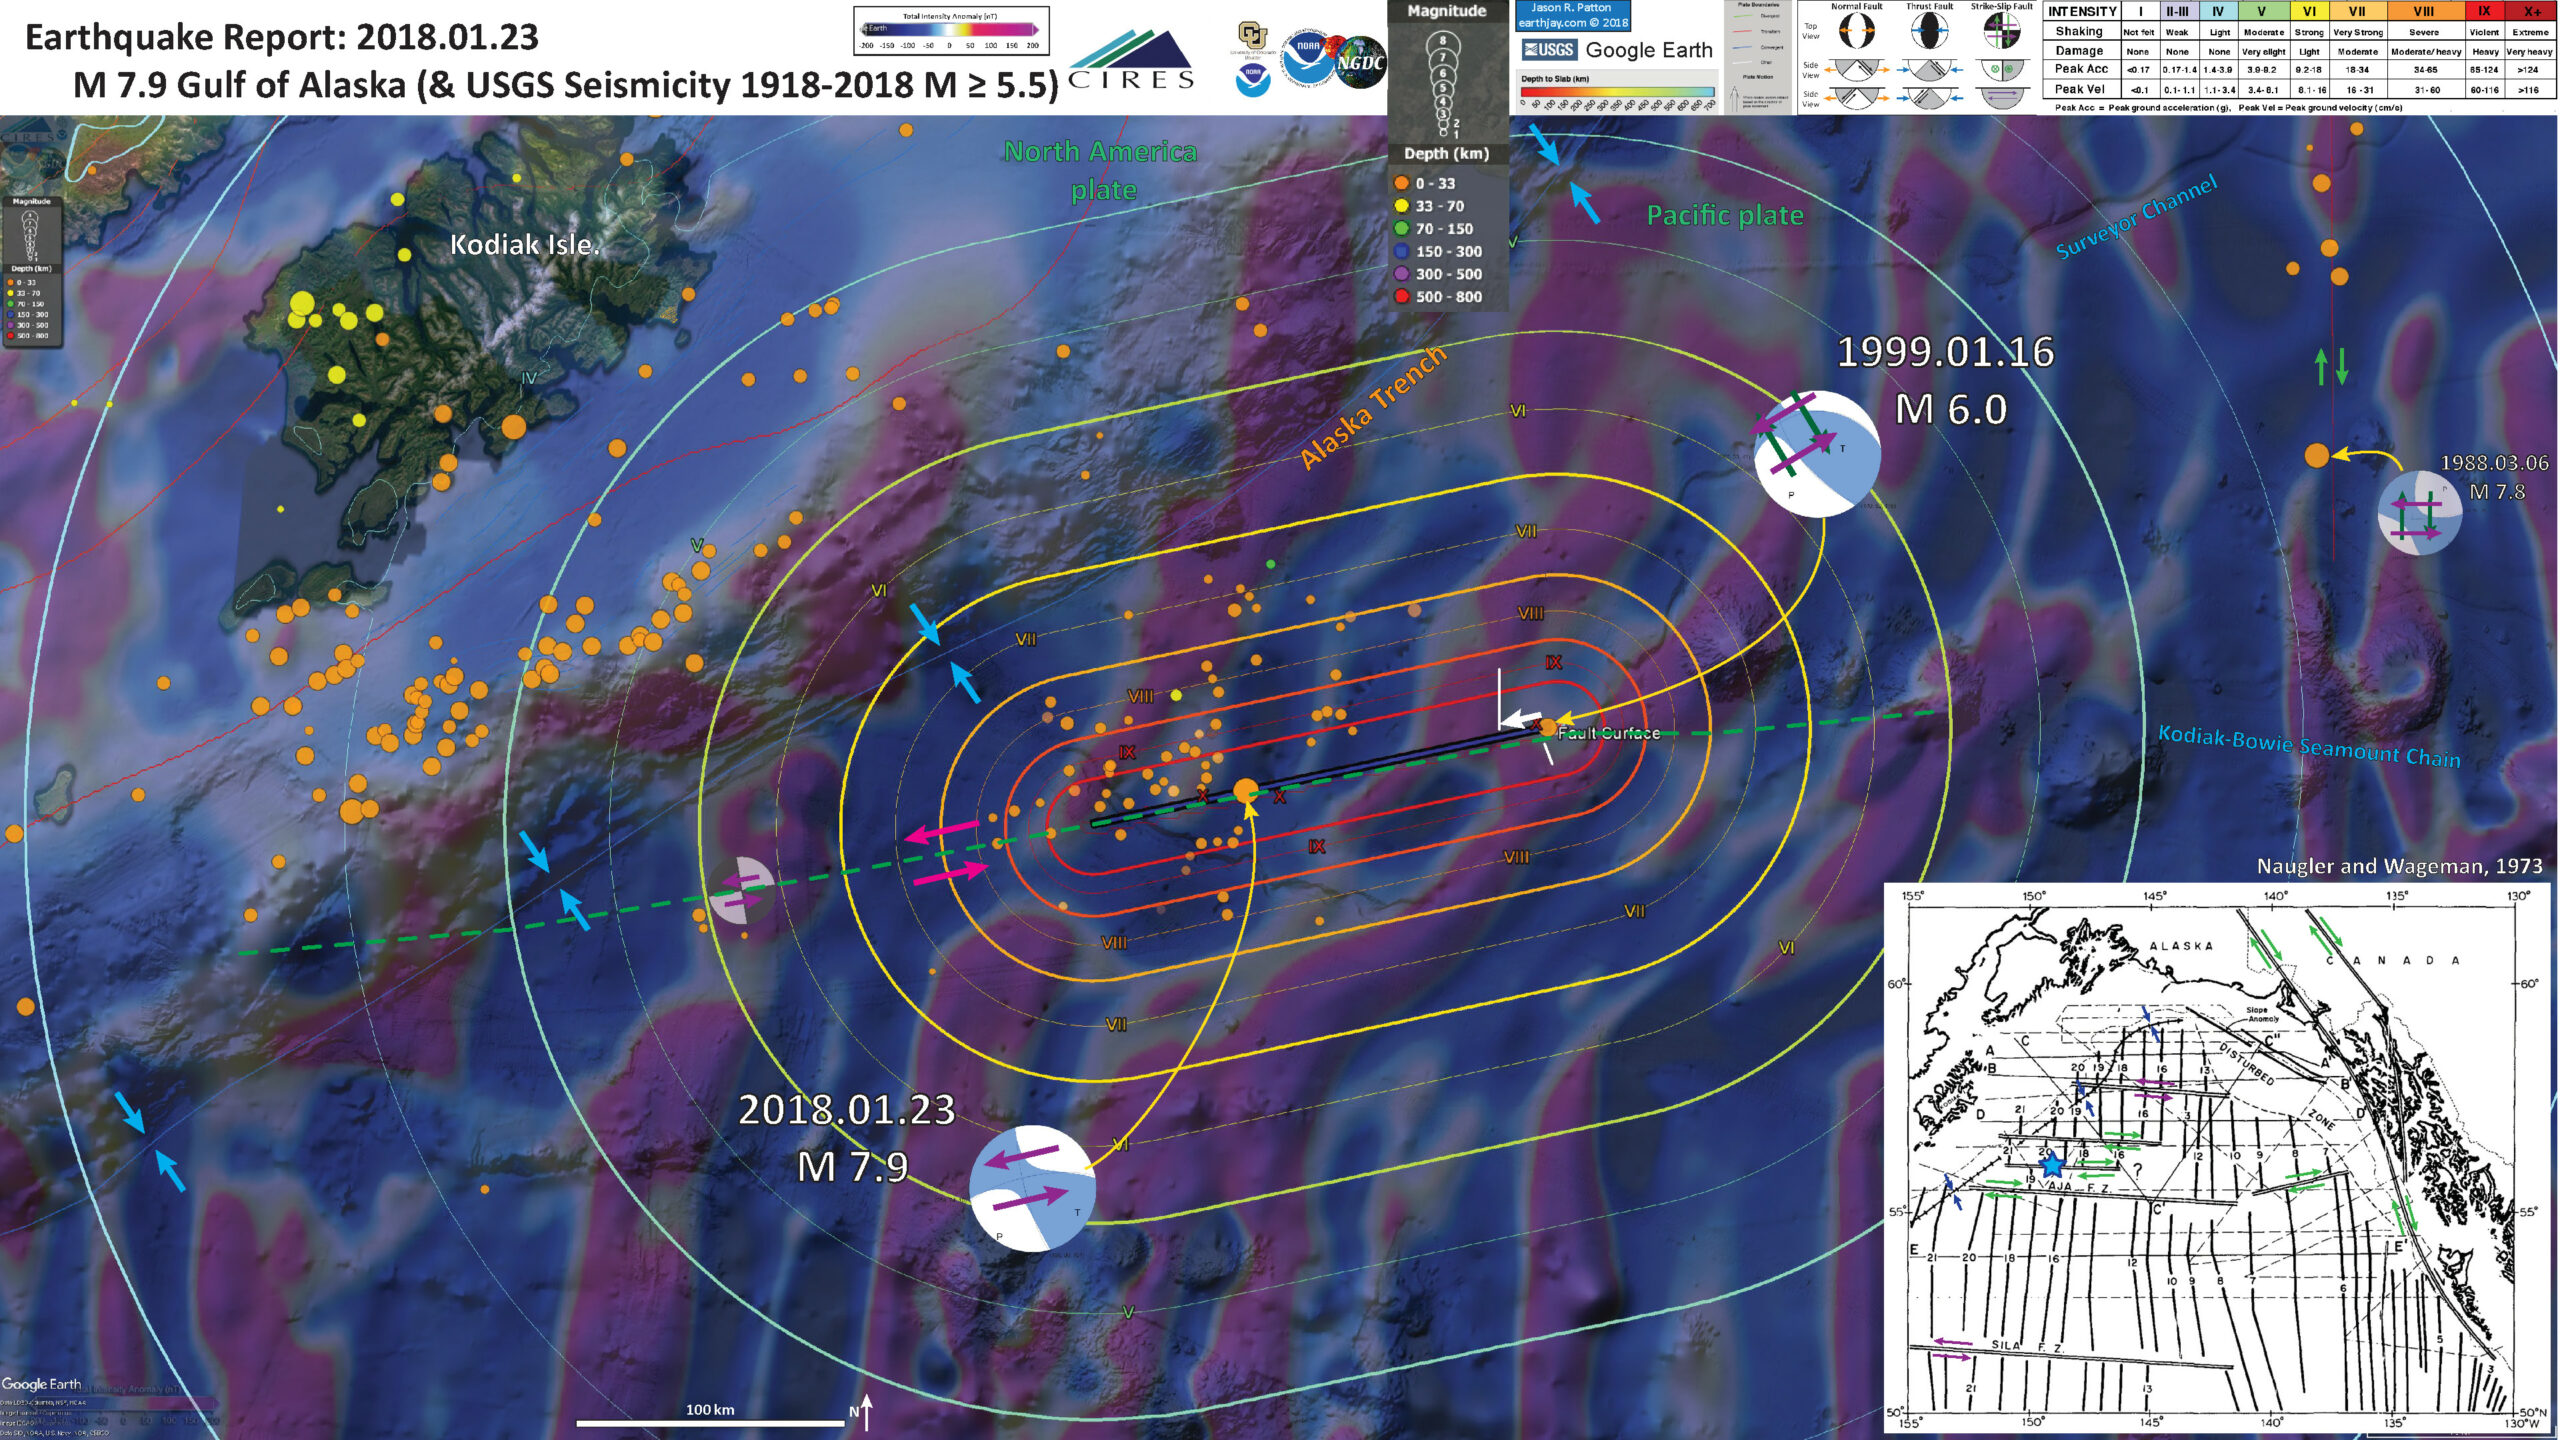
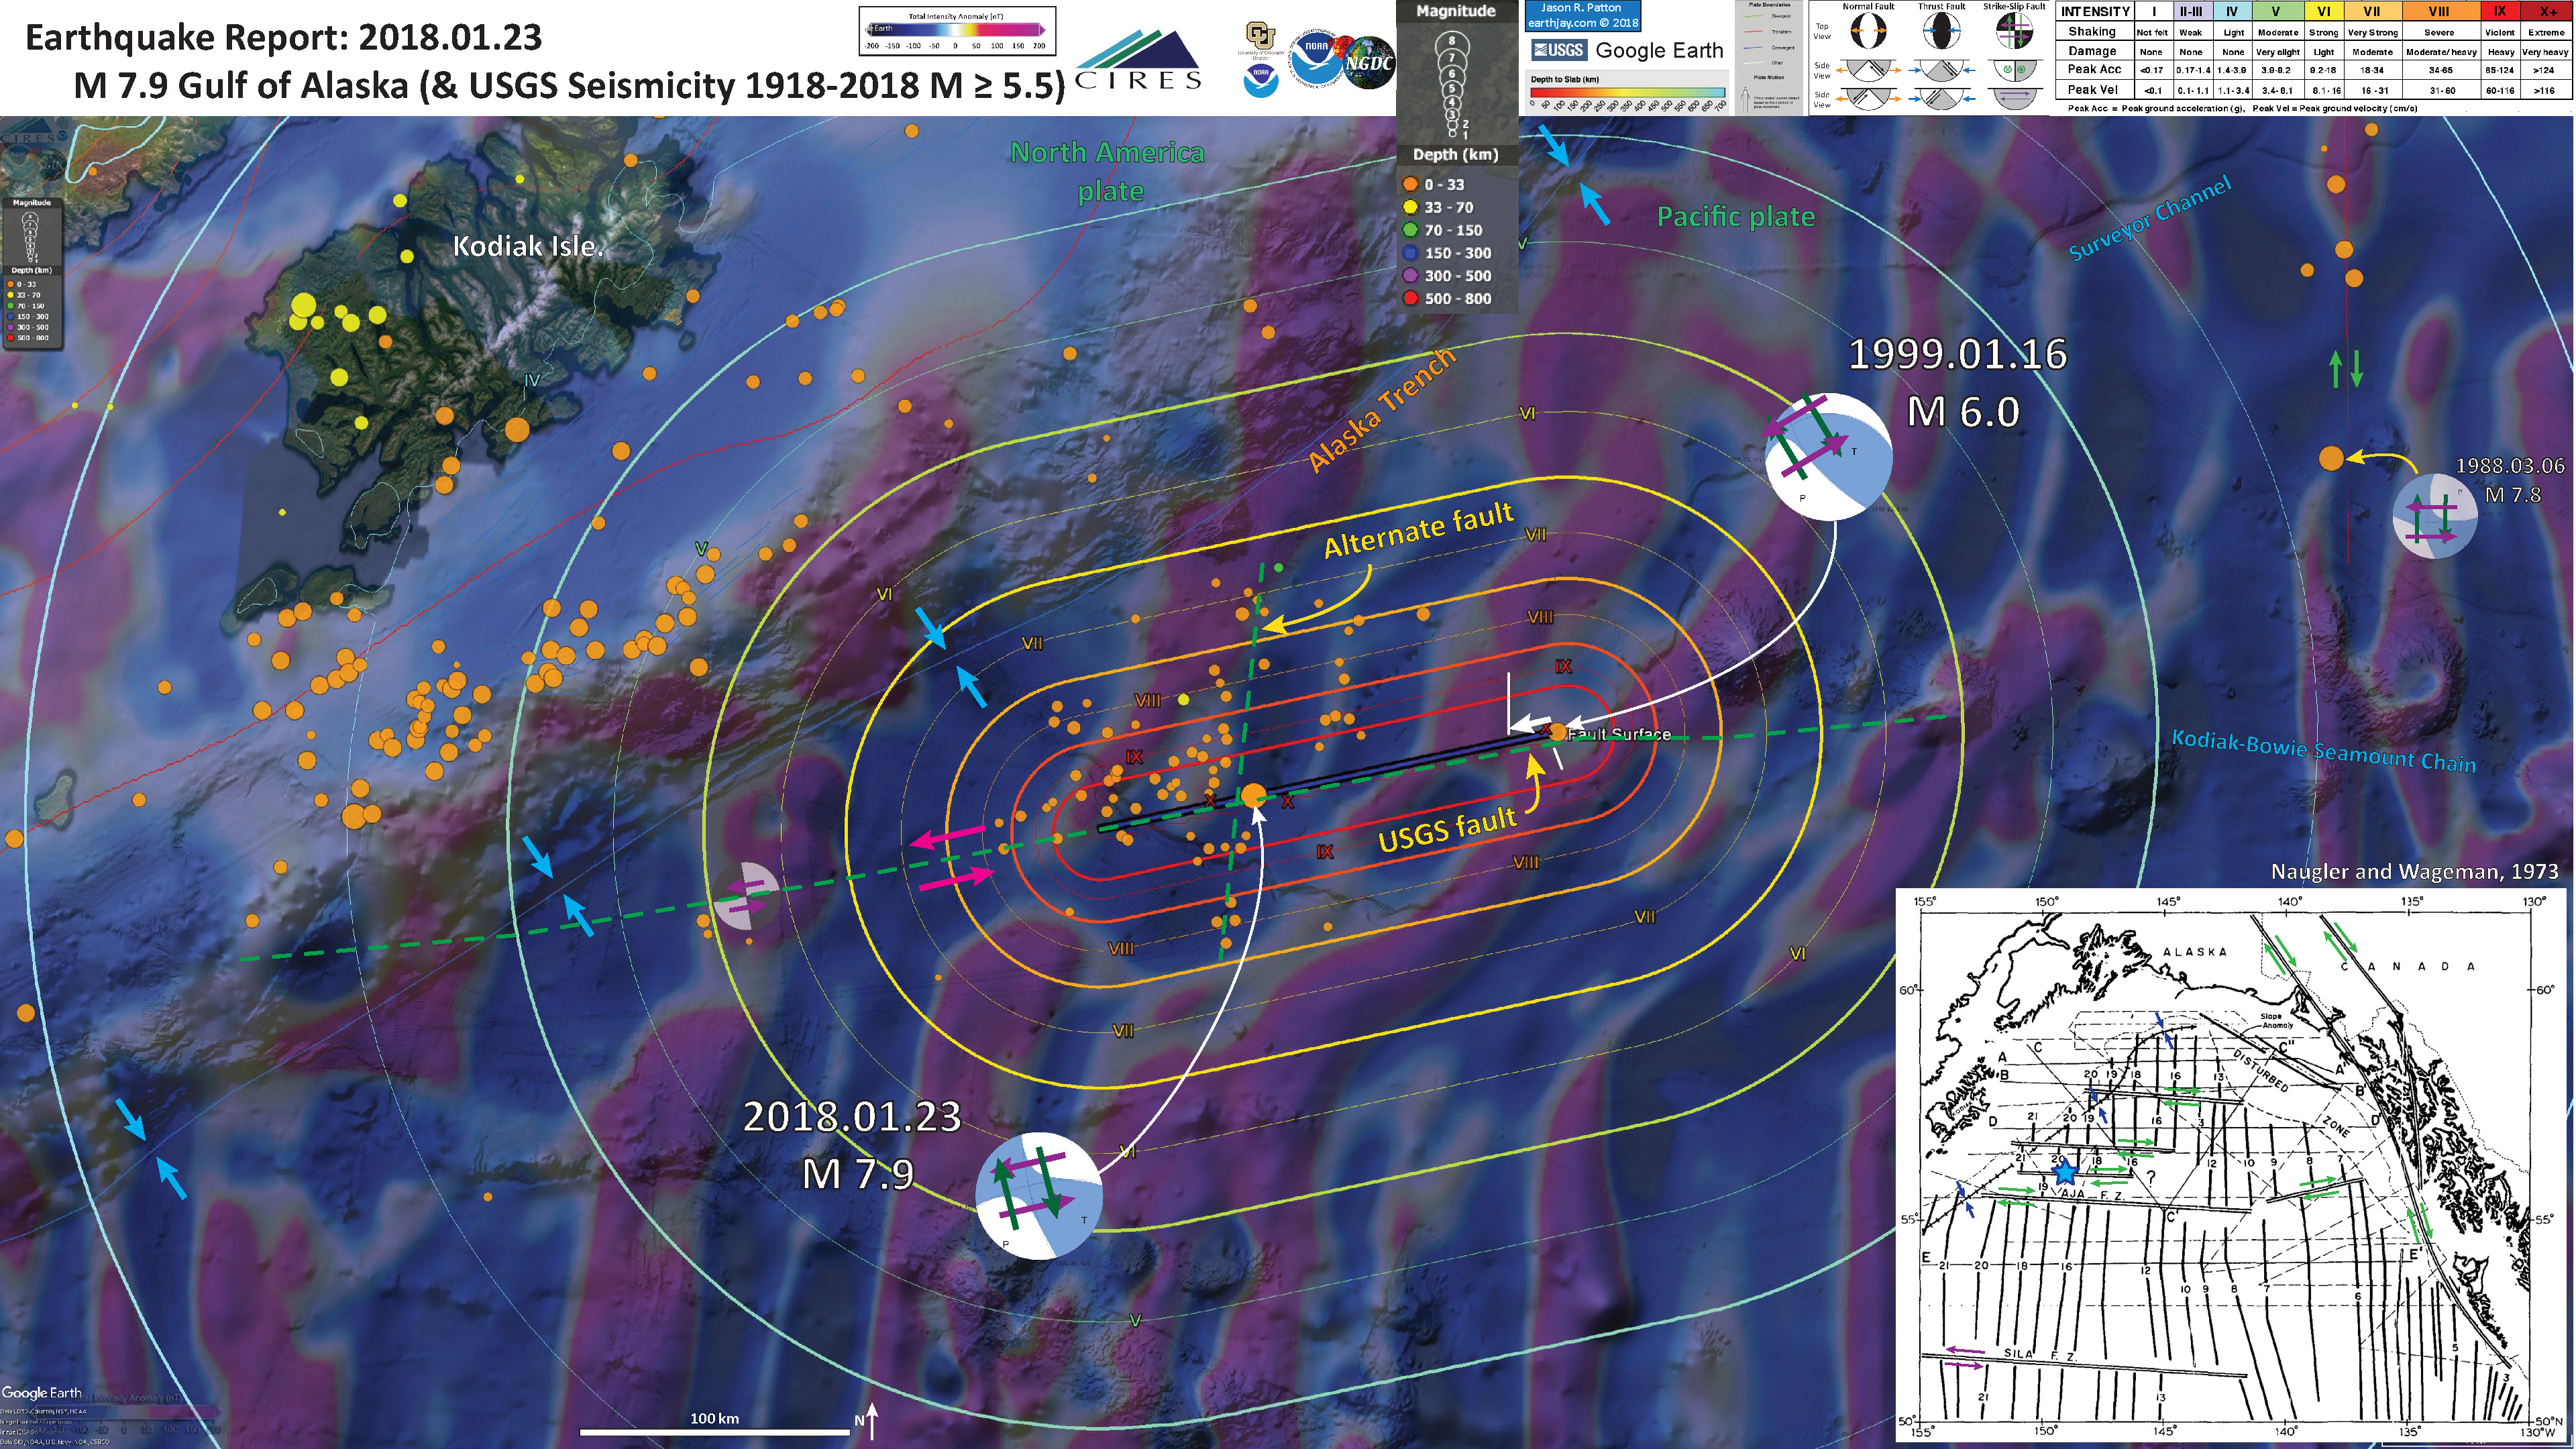
In my original report, I proposed that if the earthquake happened on the USGS fault model, then there is a problem when considering the magnetic anomaly map. The USGS fault solution is left-lateral, but the magnetic anomaly offsets appear to be right-laterally offset. Upon further review, I noticed that there are some details in this area that could be interpreted as left lateral. In my poster below, I place a white arrow along the hypothetical fault (drawn as a green dashed line). I located the line based upon offsets in the magnetic anomaly data as aligned with the USGS model.
Then I took a look at the mag anomaly map from Naugler and Wageman (1973). These authors show the isochrons for the Gulf of Alaska (GA). The fracture zone nearest today’s M 7.9 earthquake is right-lateral (supporting my original interpretation). However, the USGS fault model appears to be oblique to this fracture zone. Perhaps today’s M 7.9 is on a conjugate fault, with a different sense of motion.
Interesting that the USGS fault model terminates on the eastern side with the epicenter from a 1999 earthquake. This earthquake has a fault plane solution that shows oblique slip, not pure strike-slip. This could be because (1) the earthquake happened on a different fault or (2) the earthquake happened on the same fault, but the fault is changing its orientation (I favor the first hypothesis).
Some people have been stating that the aftershocks appear to be aligned in a north-south orientation. I cannot figure out how they made this observation, but maybe I am missing something. This did make me think about instances where off fault earthquakes can be triggered, or when there are major fault systems that are not reflected in the geomorphology nor other measures of long term tectonics (like magnetic anomalies or fracture zones). A great example is the 2012 M 8.6 Wharton Basin earthquakes that ruptured in response to the 2004 Sumatra-Andaman subduction zone earthquake eight years earlier. Today’s M 7.9 earthquake is rather deep (like the 2012 earthquakes), so perhaps there are some deep faults that are not reflected by the shape of the seafloor nor reflected by the gravity data for some reason (the former seems more likely to me).
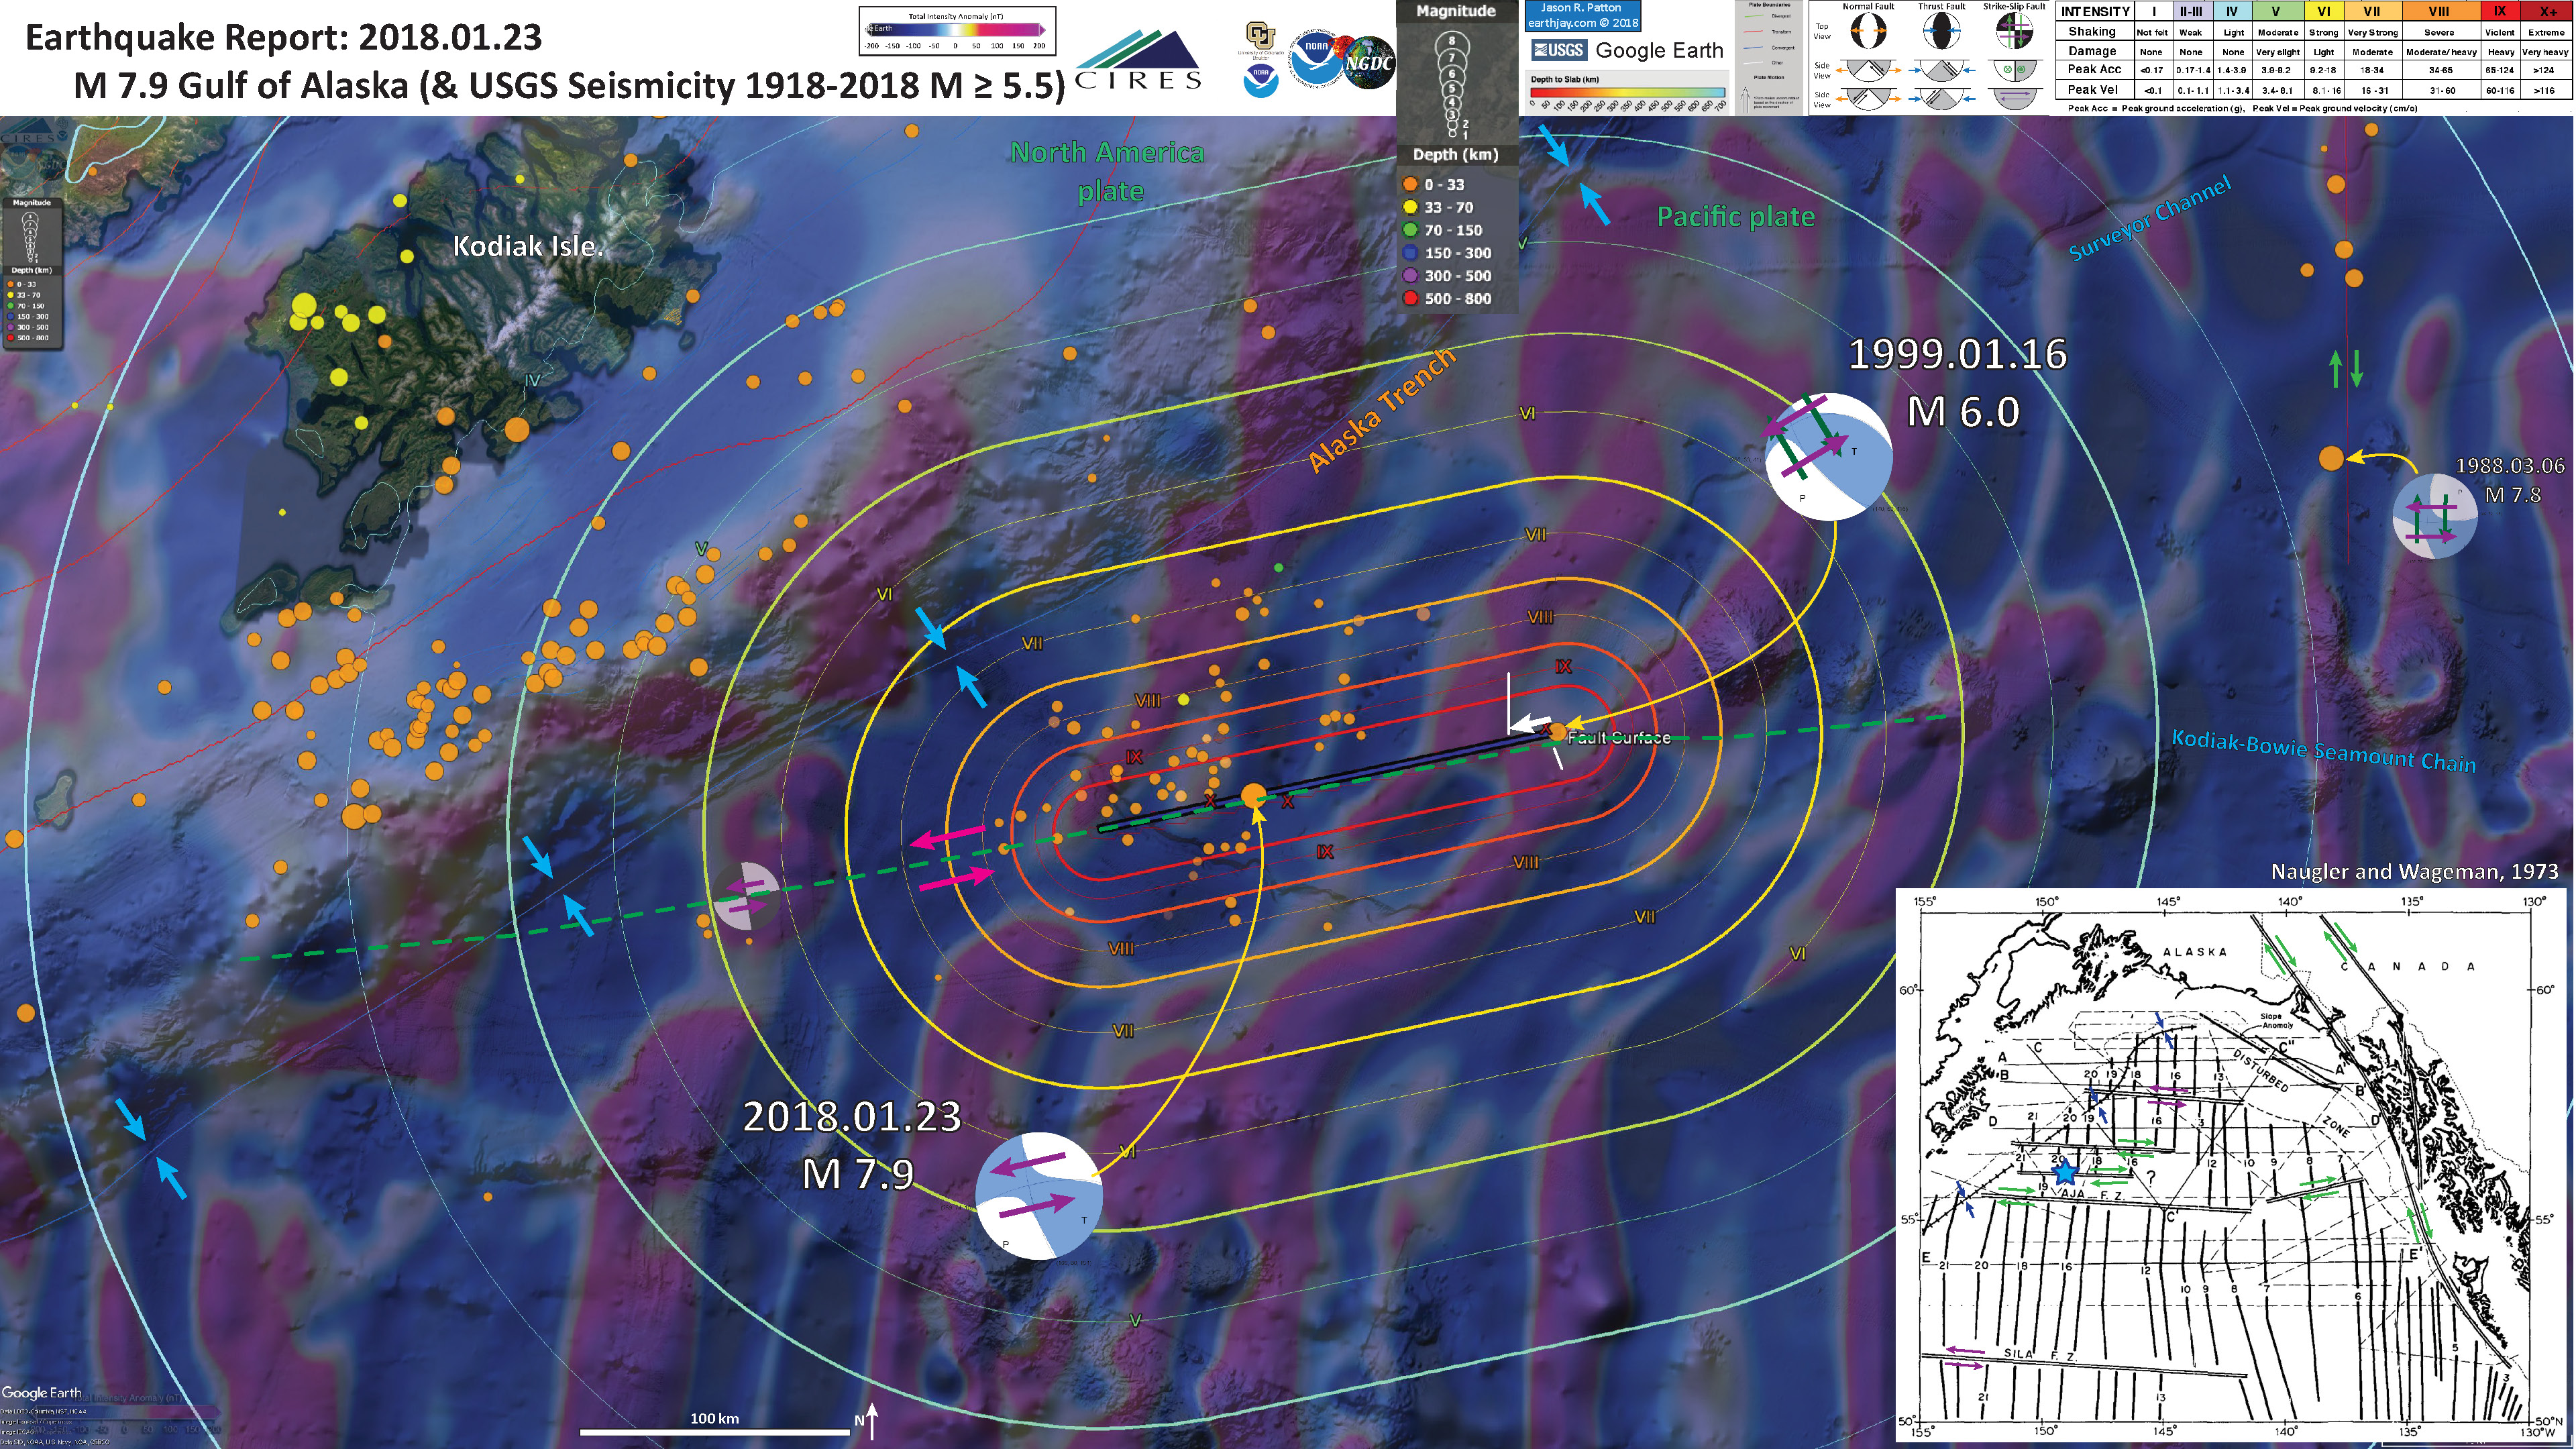
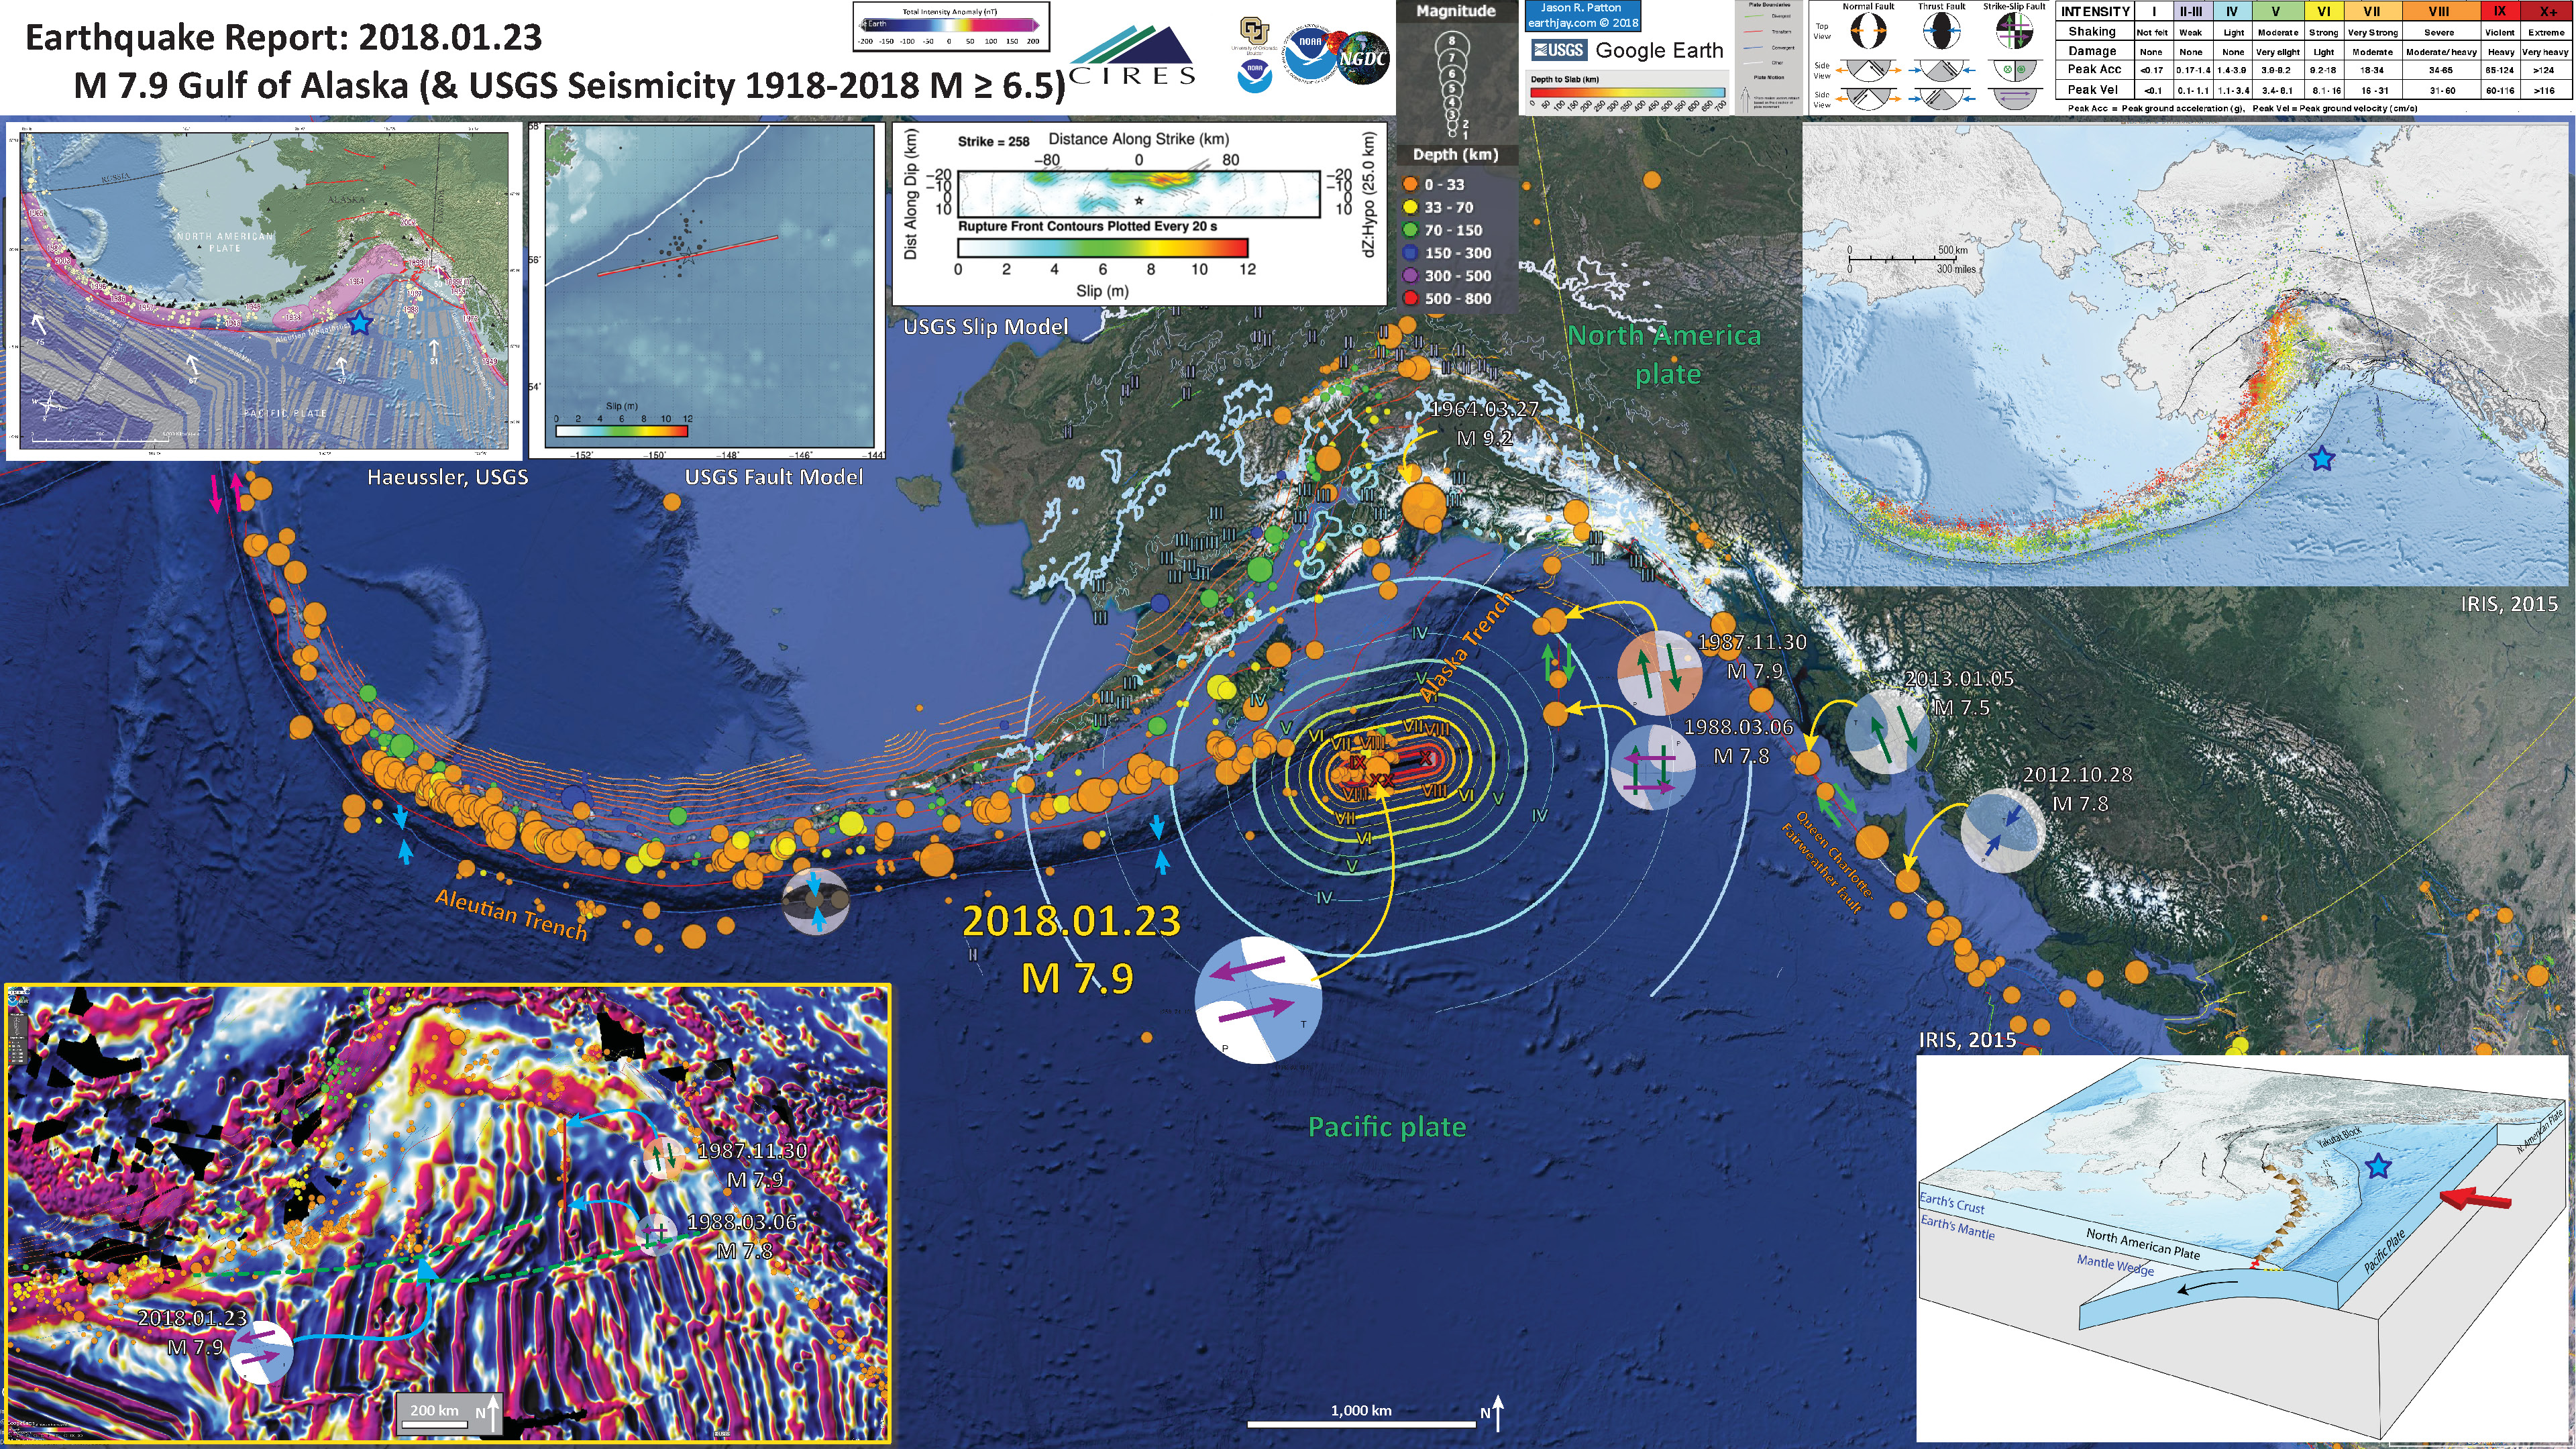
Below is my interpretive poster for this earthquake
I plot the seismicity from the past month, with color representing depth and diameter representing magnitude (see legend). I include earthquake epicenters from 1918-2018 with magnitudes M ≥ 6.5. More about the plate boundary can be found in that report.
I plot the USGS fault plane solutions (moment tensors in blue and focal mechanisms in orange) for the M 7.9 earthquake, in addition to some relevant historic earthquakes.
- I placed a moment tensor / focal mechanism legend on the poster. There is more material from the USGS web sites about moment tensors and focal mechanisms (the beach ball symbols). Both moment tensors and focal mechanisms are solutions to seismologic data that reveal two possible interpretations for fault orientation and sense of motion. One must use other information, like the regional tectonics, to interpret which of the two possibilities is more likely.
- I also include the shaking intensity contours on the map. These use the Modified Mercalli Intensity Scale (MMI; see the legend on the map). This is based upon a computer model estimate of ground motions, different from the “Did You Feel It?” estimate of ground motions that is actually based on real observations. The MMI is a qualitative measure of shaking intensity. More on the MMI scale can be found here and here. This is based upon a computer model estimate of ground motions, different from the “Did You Feel It?” estimate of ground motions that is actually based on real observations.
- I include the slab contours plotted (Hayes et al., 2012), which are contours that represent the depth to the subduction zone fault. These are mostly based upon seismicity. The depths of the earthquakes have considerable error and do not all occur along the subduction zone faults, so these slab contours are simply the best estimate for the location of the fault. Slab 2.0 is due out later this year!
-
I include some inset figures.
- In the lower right corner, I place a map from Naugler and Sageman (1973). I added relative slip vectors for the fracture zones here. I place the epicenter from today’s earthquake as a cyan star.
- As I was rereading my report (don’t always get a chance, but good to check for typos), looking at the aftershocks, and considering the problems associated with this earthquake and its tectonic setting (i.e. right-lateral fracture zones and a left-lateral USGS fault solution), I decided to make some updates to this large scale poster. There were several aftershocks while I was making this map that made a north-south trend more apparent. So, now I am favoring the following interpretation: the M 7.9 mainshock and many aftershocks are the result of a right-lateral north-striking strike-slip fault.
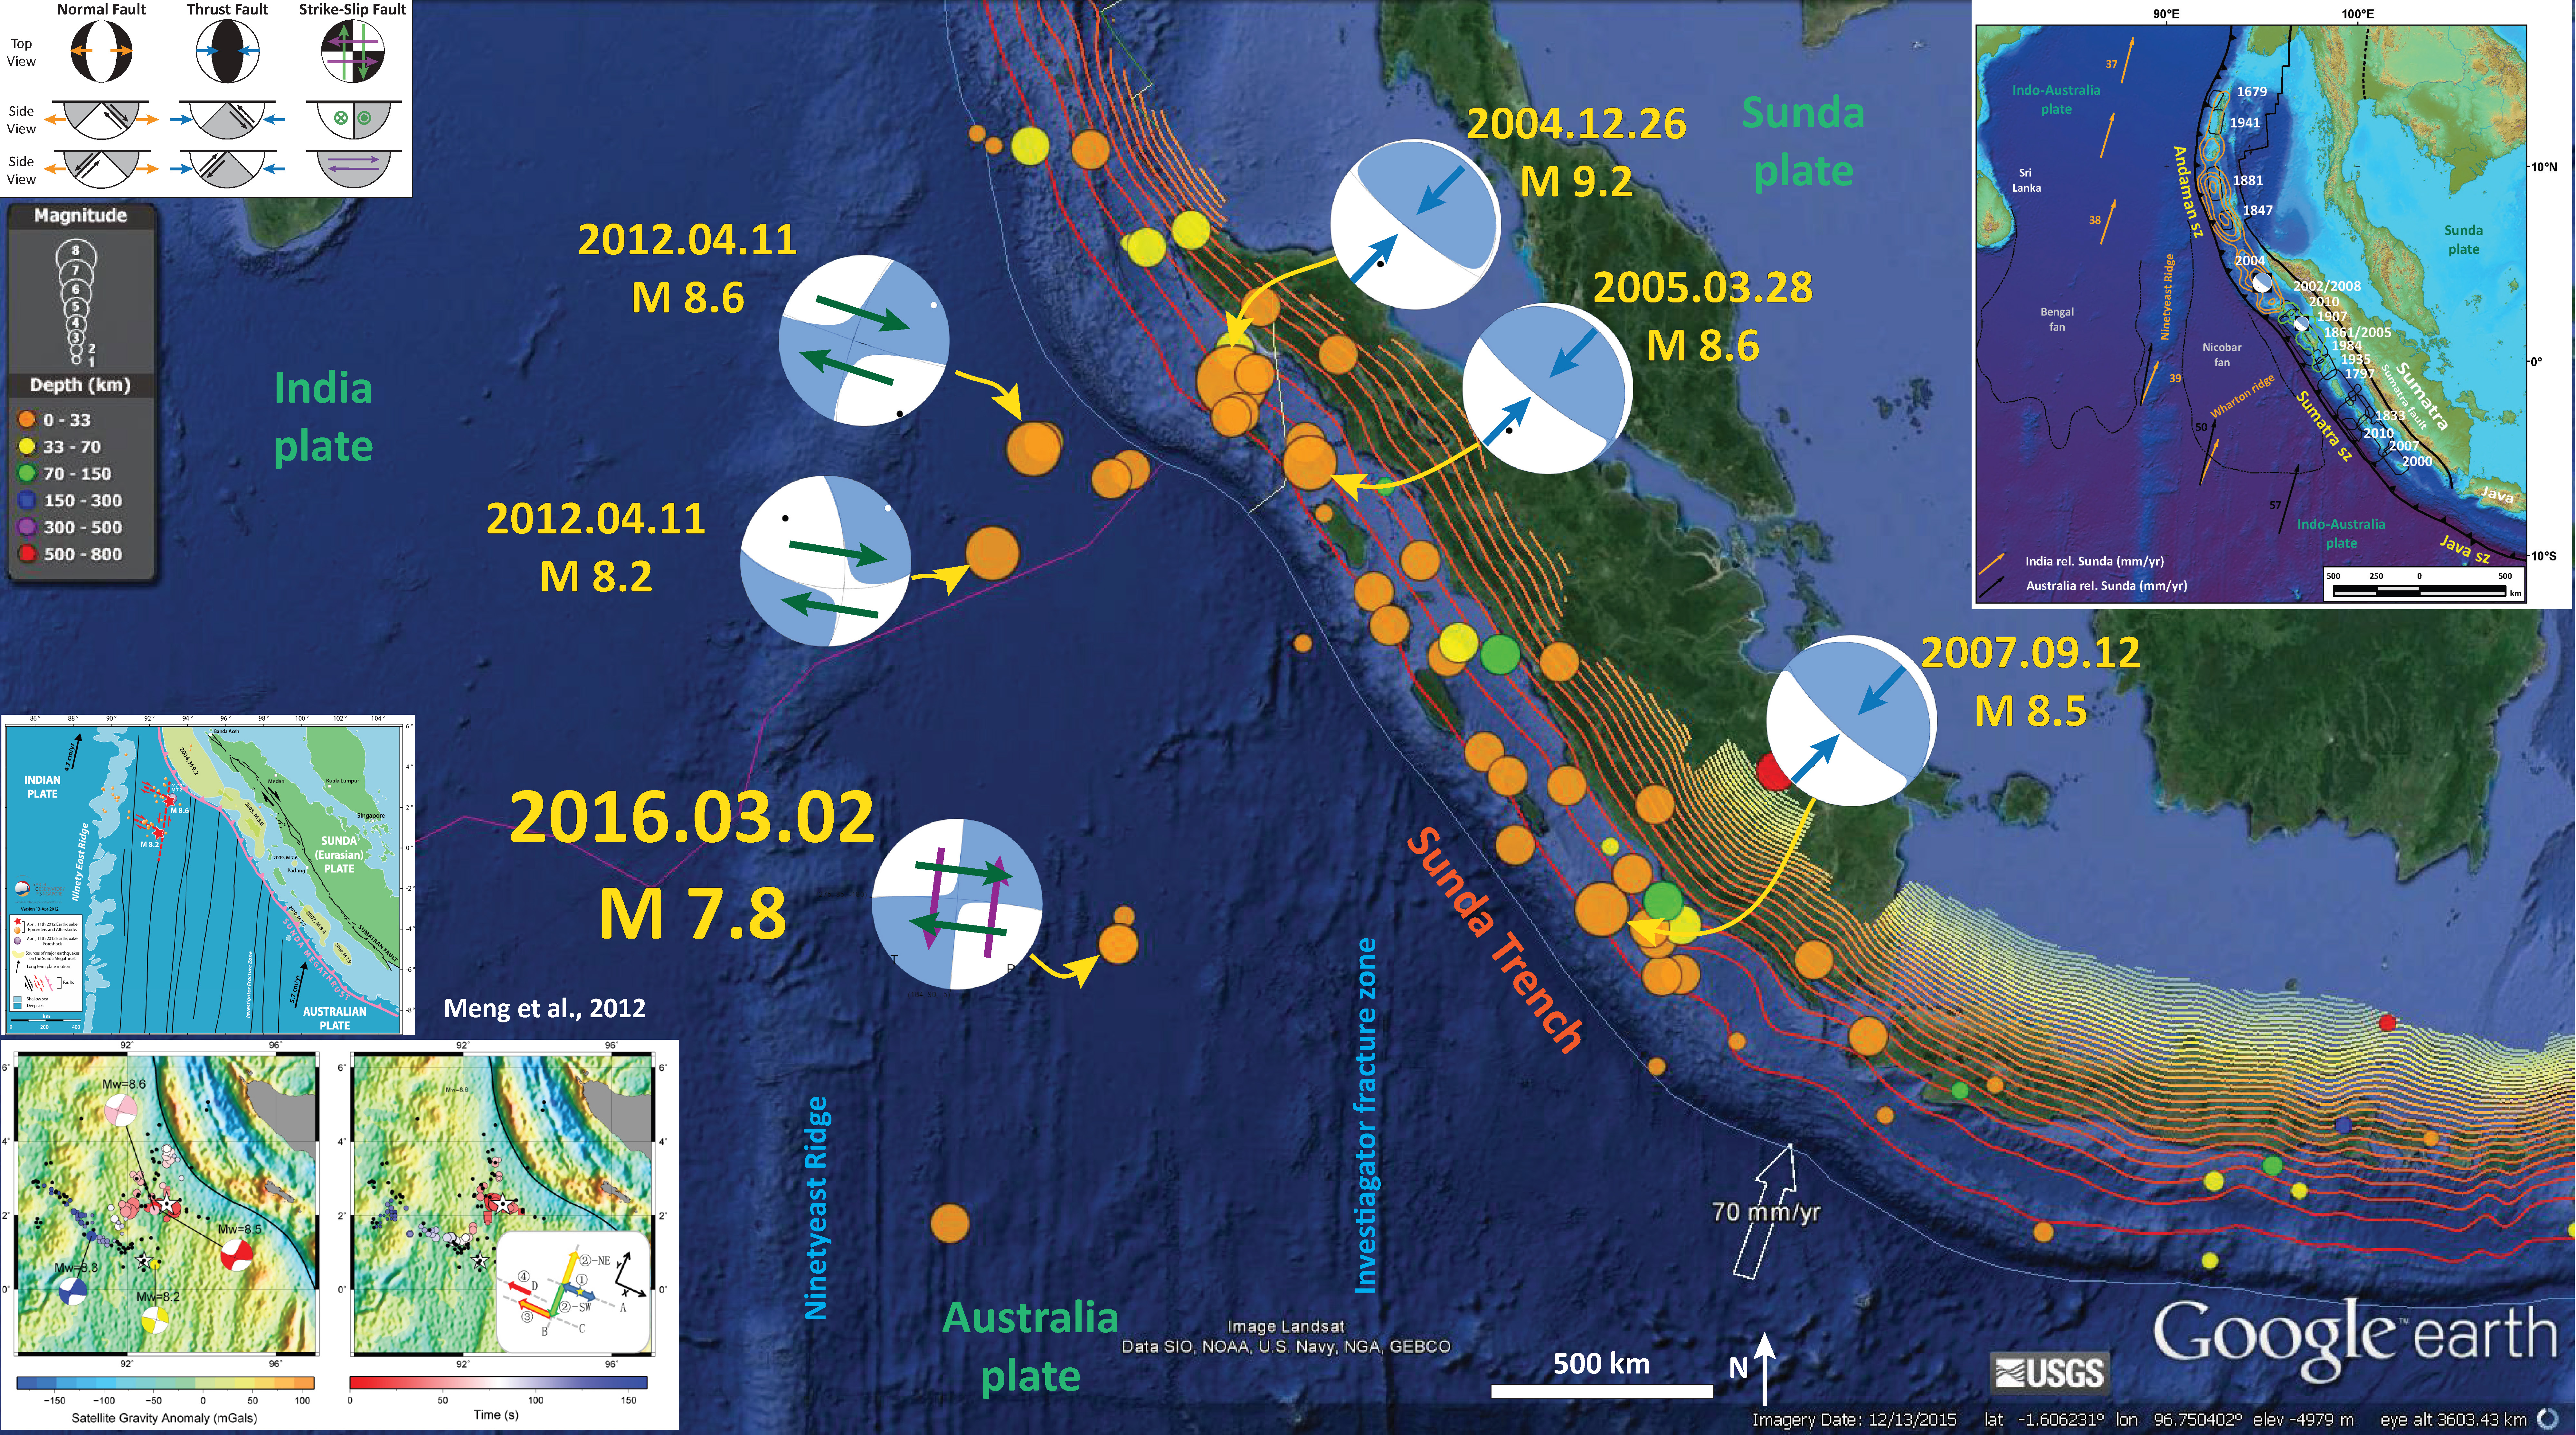
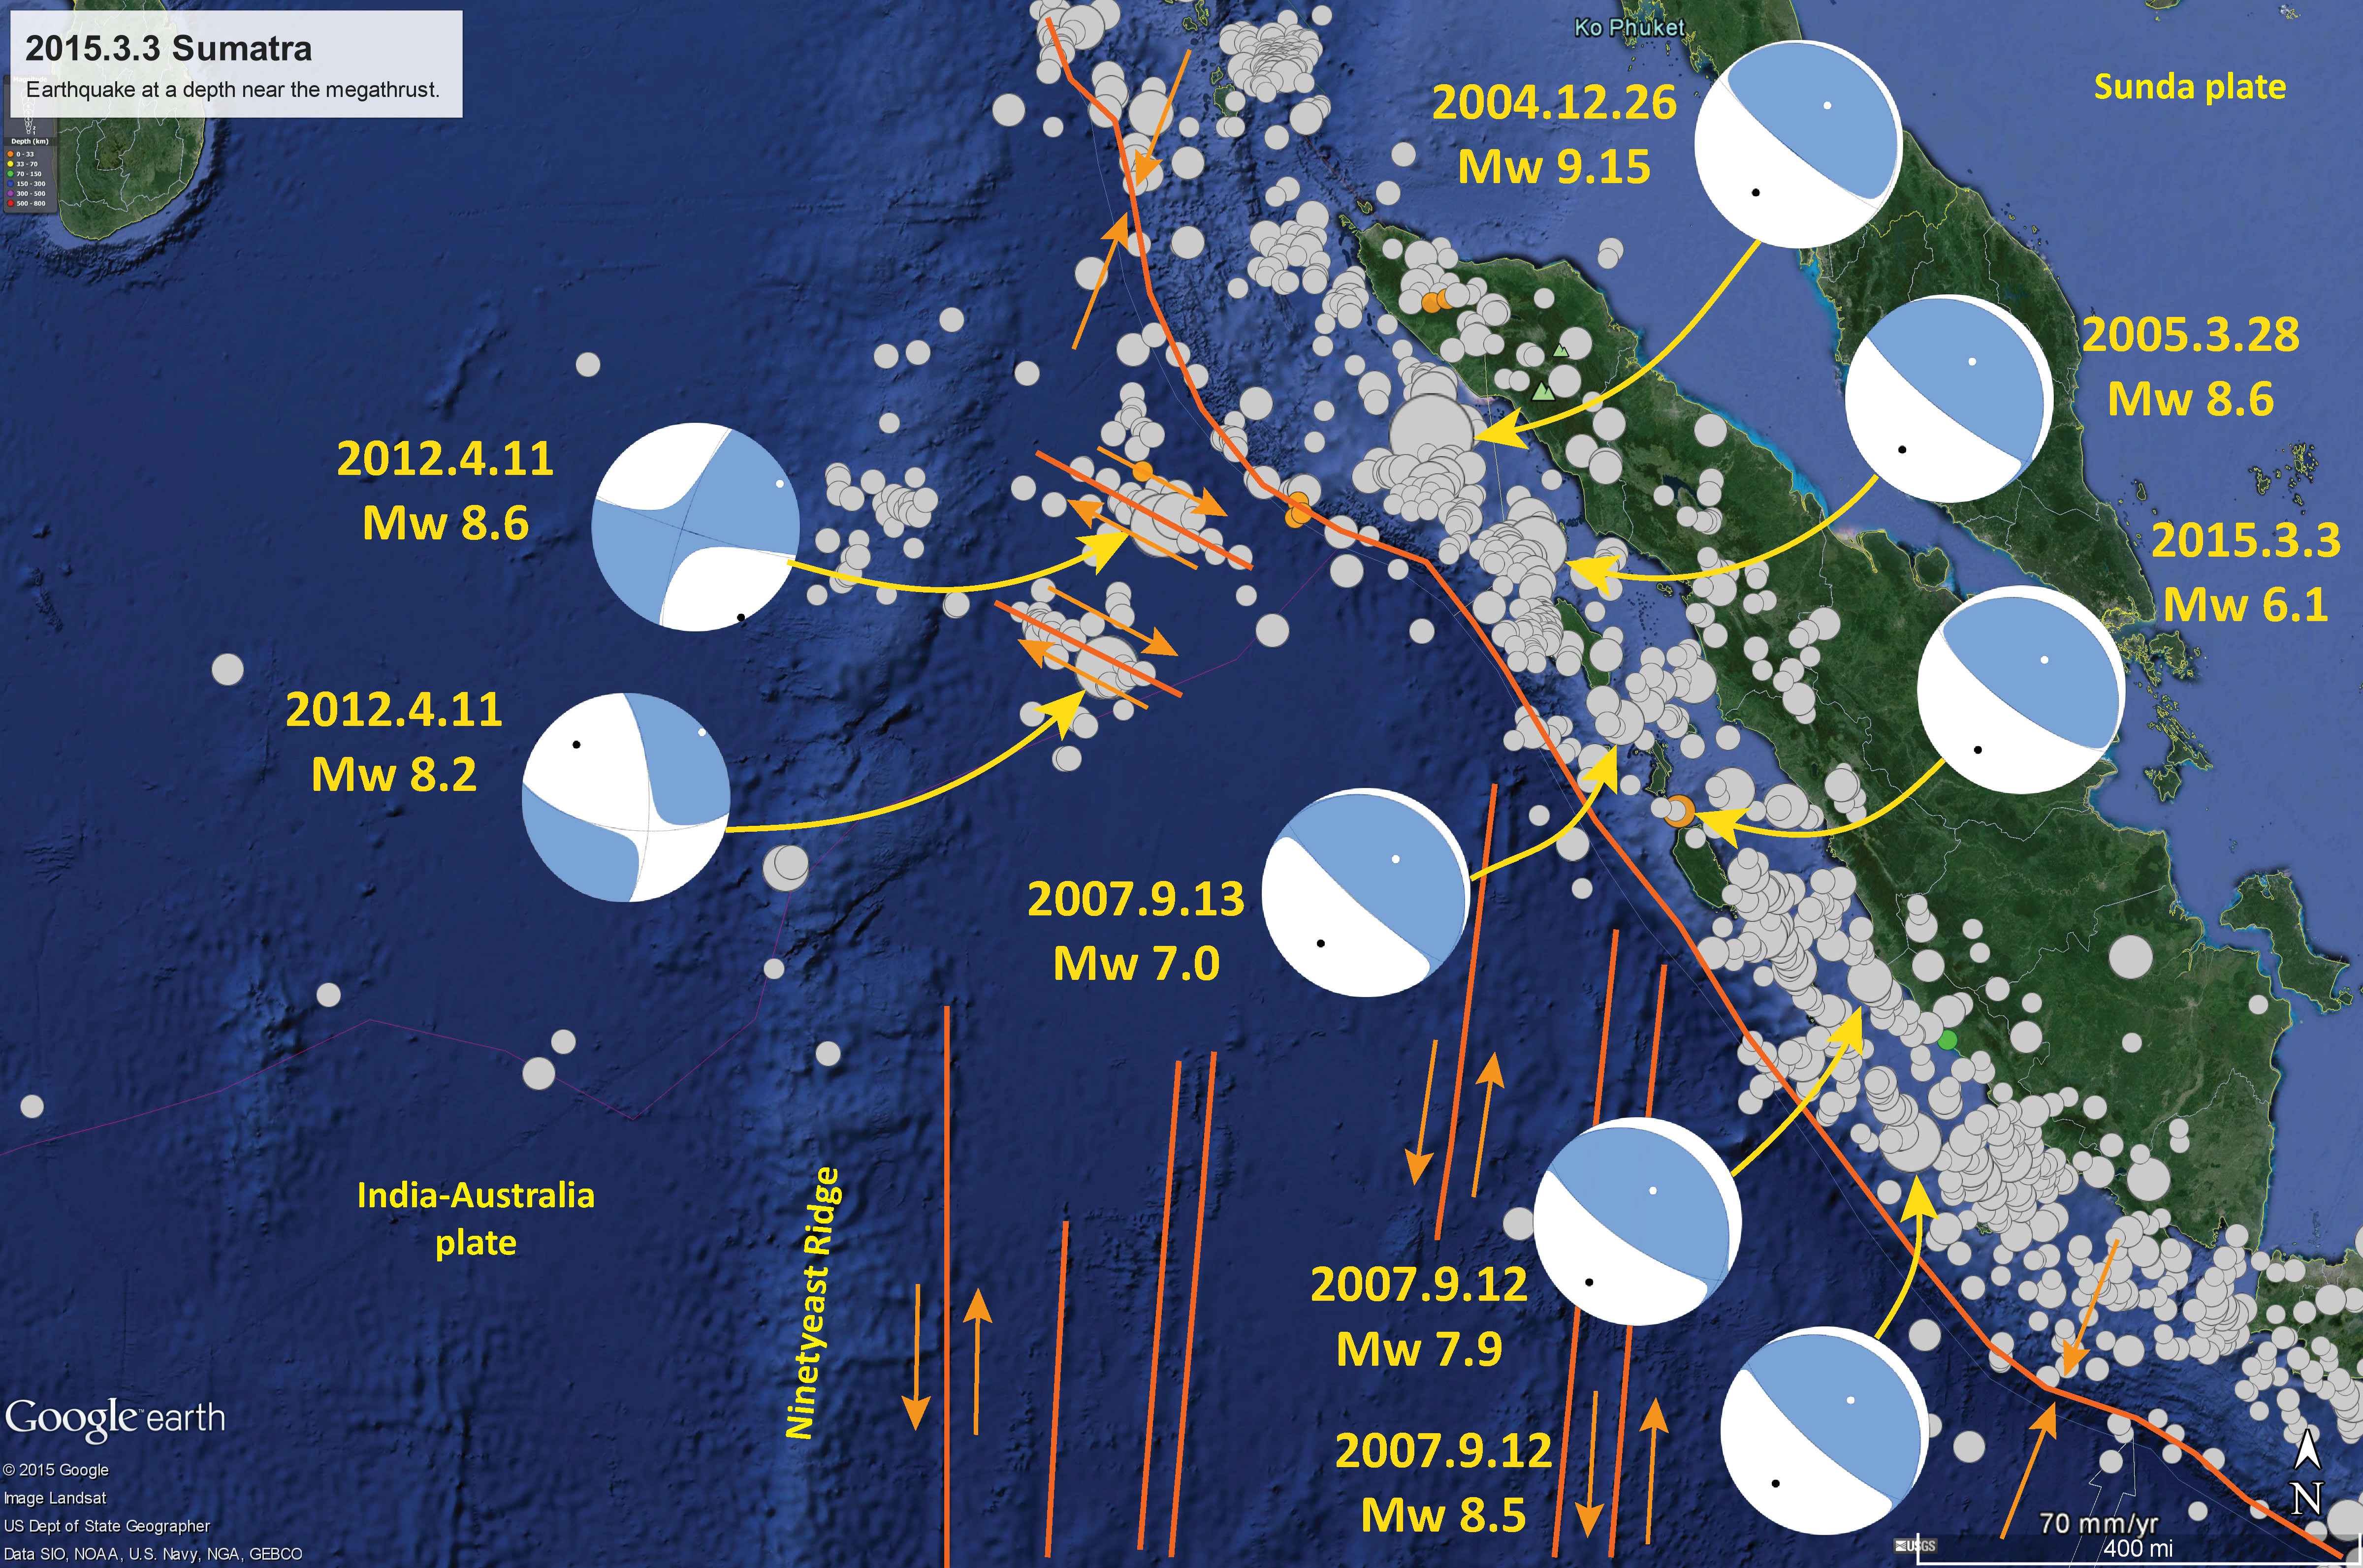
- This is the exact same thing that happened following the 2012 Wharton Basin M 8.6/8.2 earthquake sequence along the outer rise of the Sumatra-Andaman subduction zone. The M 8.6 is the largest strike-slip intraplate earthquake ever recorded on modern seismometers. I present some maps from Sumatra earthquakes below. Basically, the fracture zones in the the India-Australia plate trend north-south. So that was my initial interpretation, that these earthquakes were left-lateral earthquakes on faults associated with these fracture zones. However, this was not the case. The Wharton Basin earthquake sequence involved both fracture zone related faults, in addition to conjugate faults trending east-west. There were initially fault slip models for both interpretations.
- Here is my original interpretive poster with the updated USGS fault model MMI contours. Head to my original report here for more information.
Some Relevant Discussion and Figures
- This is a great map from UNAVCO. This shows the static offsets to GPS sites as a result of this M 7.9 earthquake.
Seismically derived static displacements (first figure, pink is p1 and blue is p2) and their difference (figure 2)(Figure/Dave Mencin, UNAVCO)
- However, there is supporting evidence that the USGS fault is the correct fault. I just watched the back projections for this earthquake prepared by IRIS. Basically, these are animations that show where the energy was released, at what time, during this earthquake. These animations show an east-west trending energy release. I am not a seismologist, so don’t know if these back projections absolutely rule out a north-south fault.
- Here are their two animations.
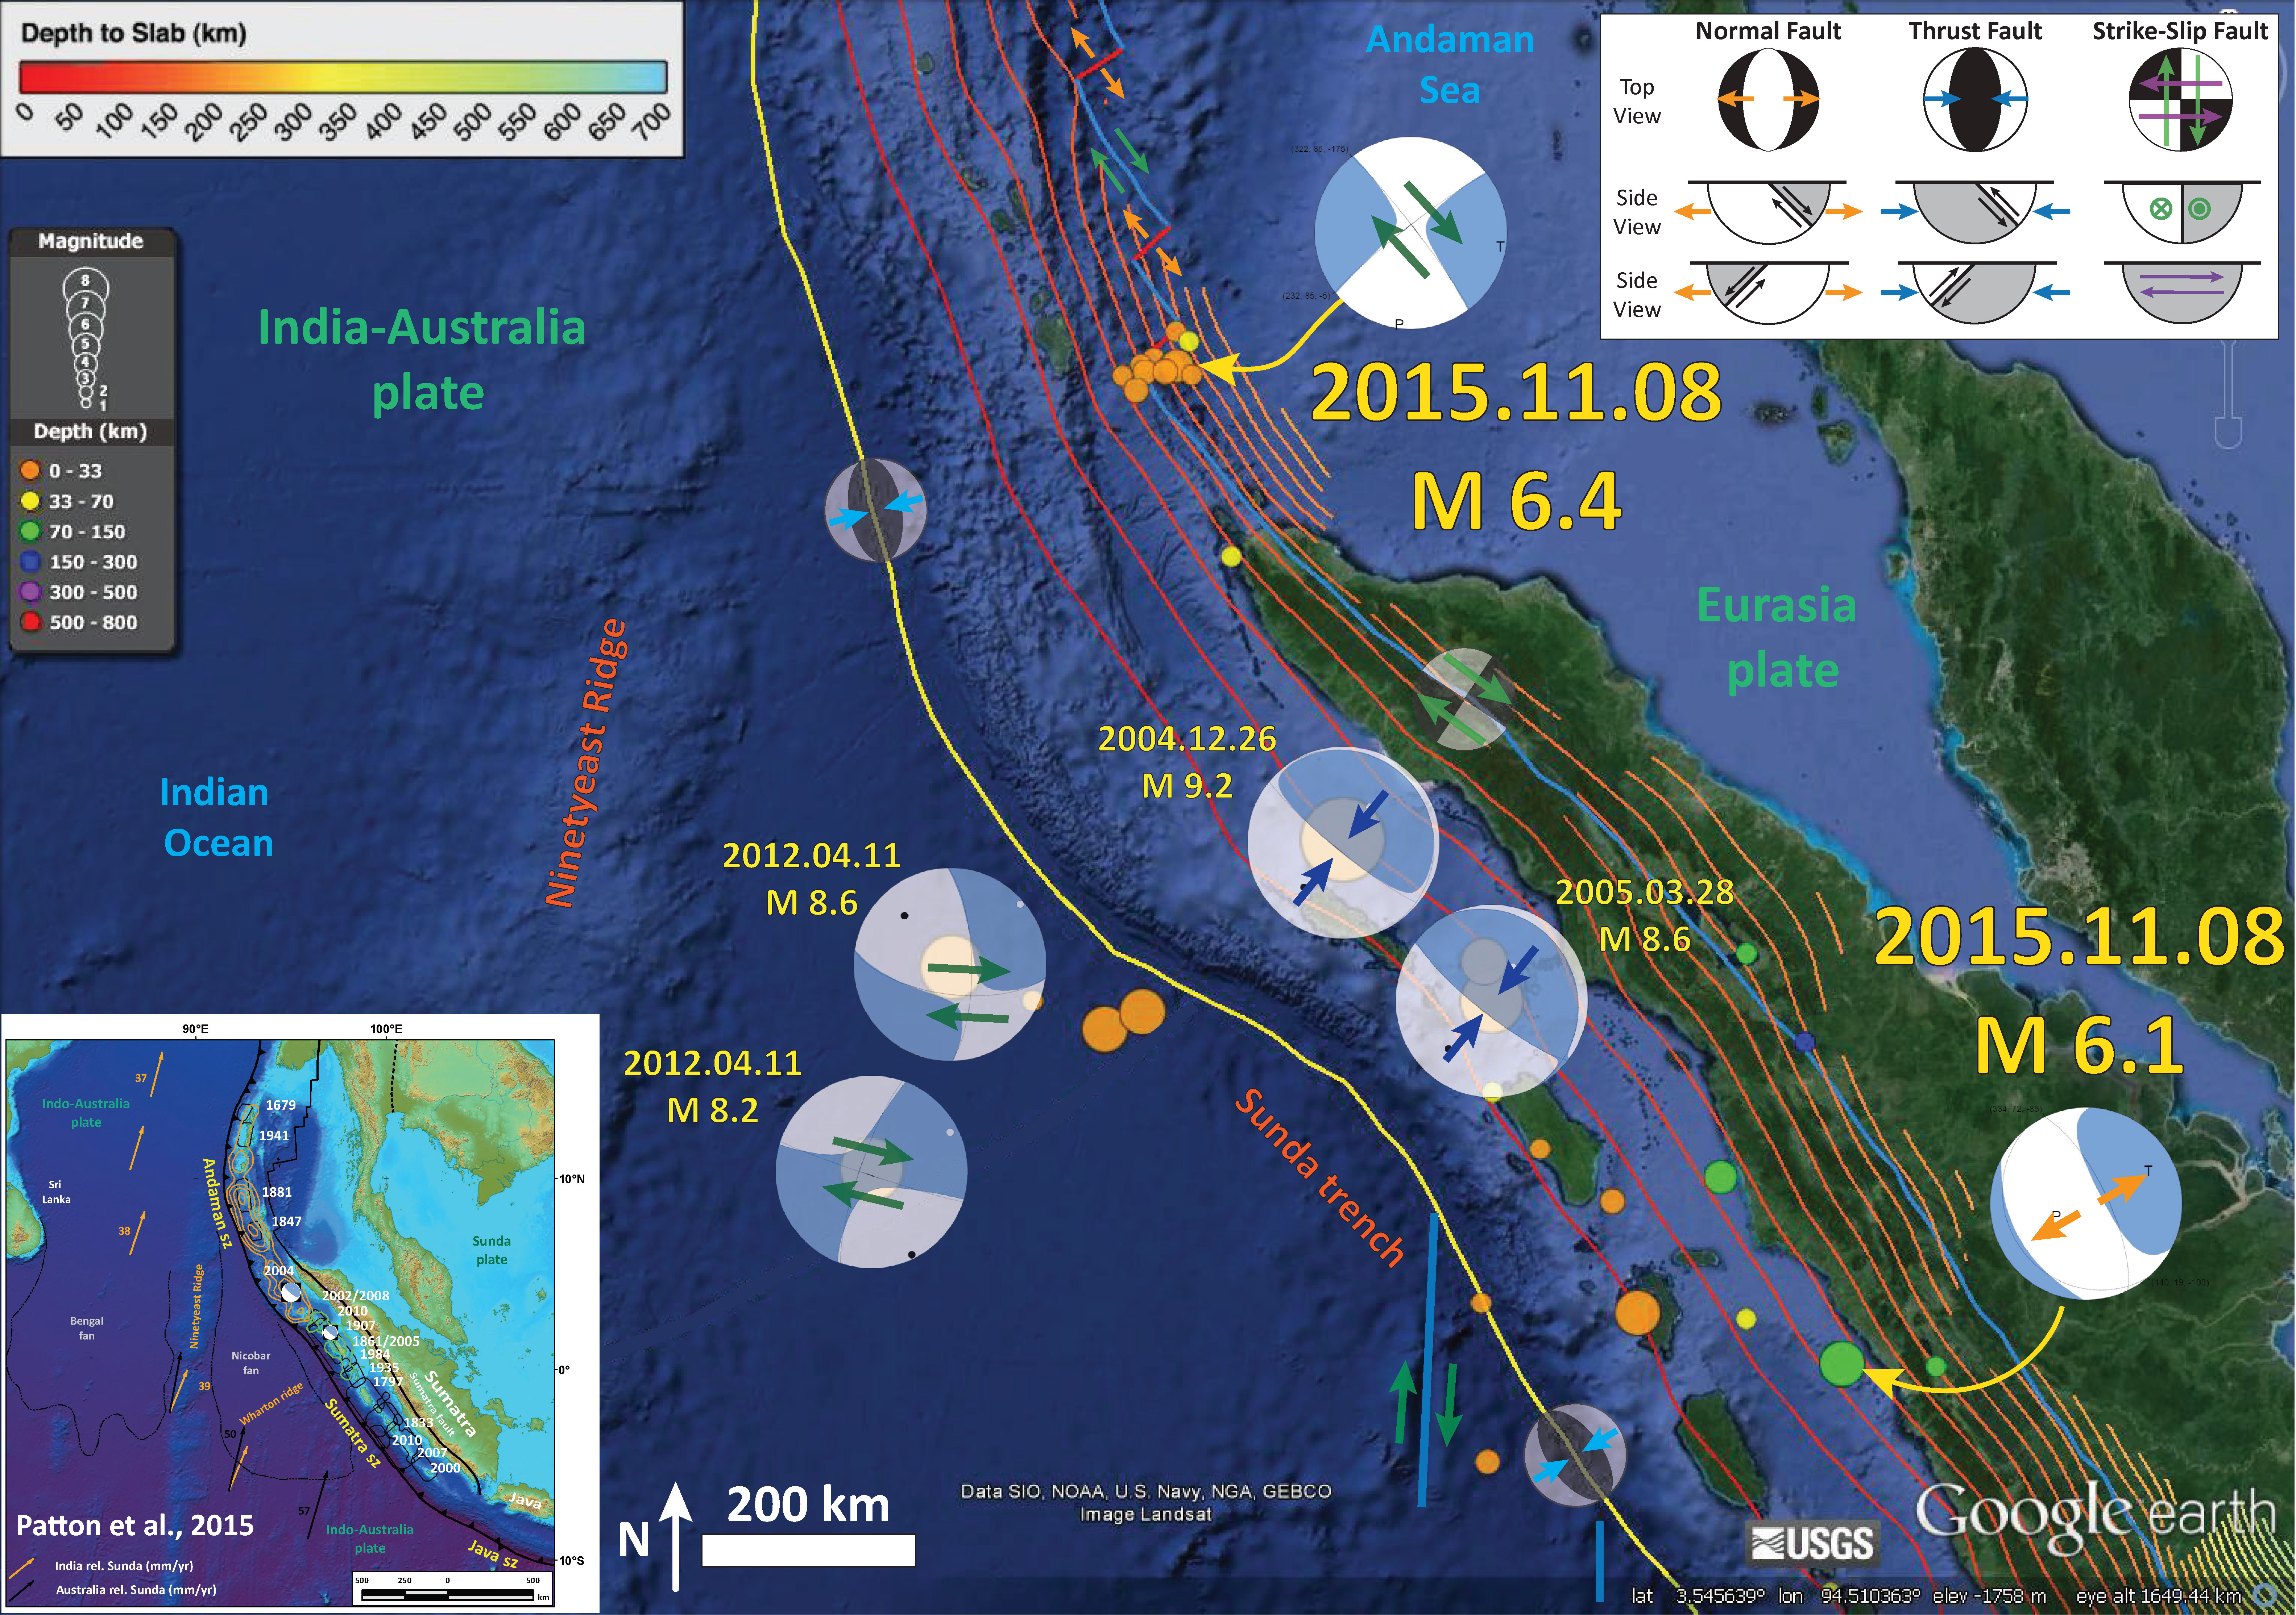
- Here are some interpretive posters from the 2012 Sumatra Outer Rise earthquake sequence.
- I have presented materials related to the 2004 Sumatra-Andaman subduction zone earthquake here and more here.
- I include a map in the upper right corner that shows the historic earthquake rupture areas. There is a figure from Meng et al. (2012) that shows the details about the faults and the seismicity.
- Here is that Meng et al. (2012) figure showing the different faults that ruptured in 2012.
- Here is a poster that shows some earthquakes in the Andaman Sea. This is from my earthquake report from 2015.11.08.
- This map shows the fracture zones in the India-Australia plate.
Review Stuff from my first report.
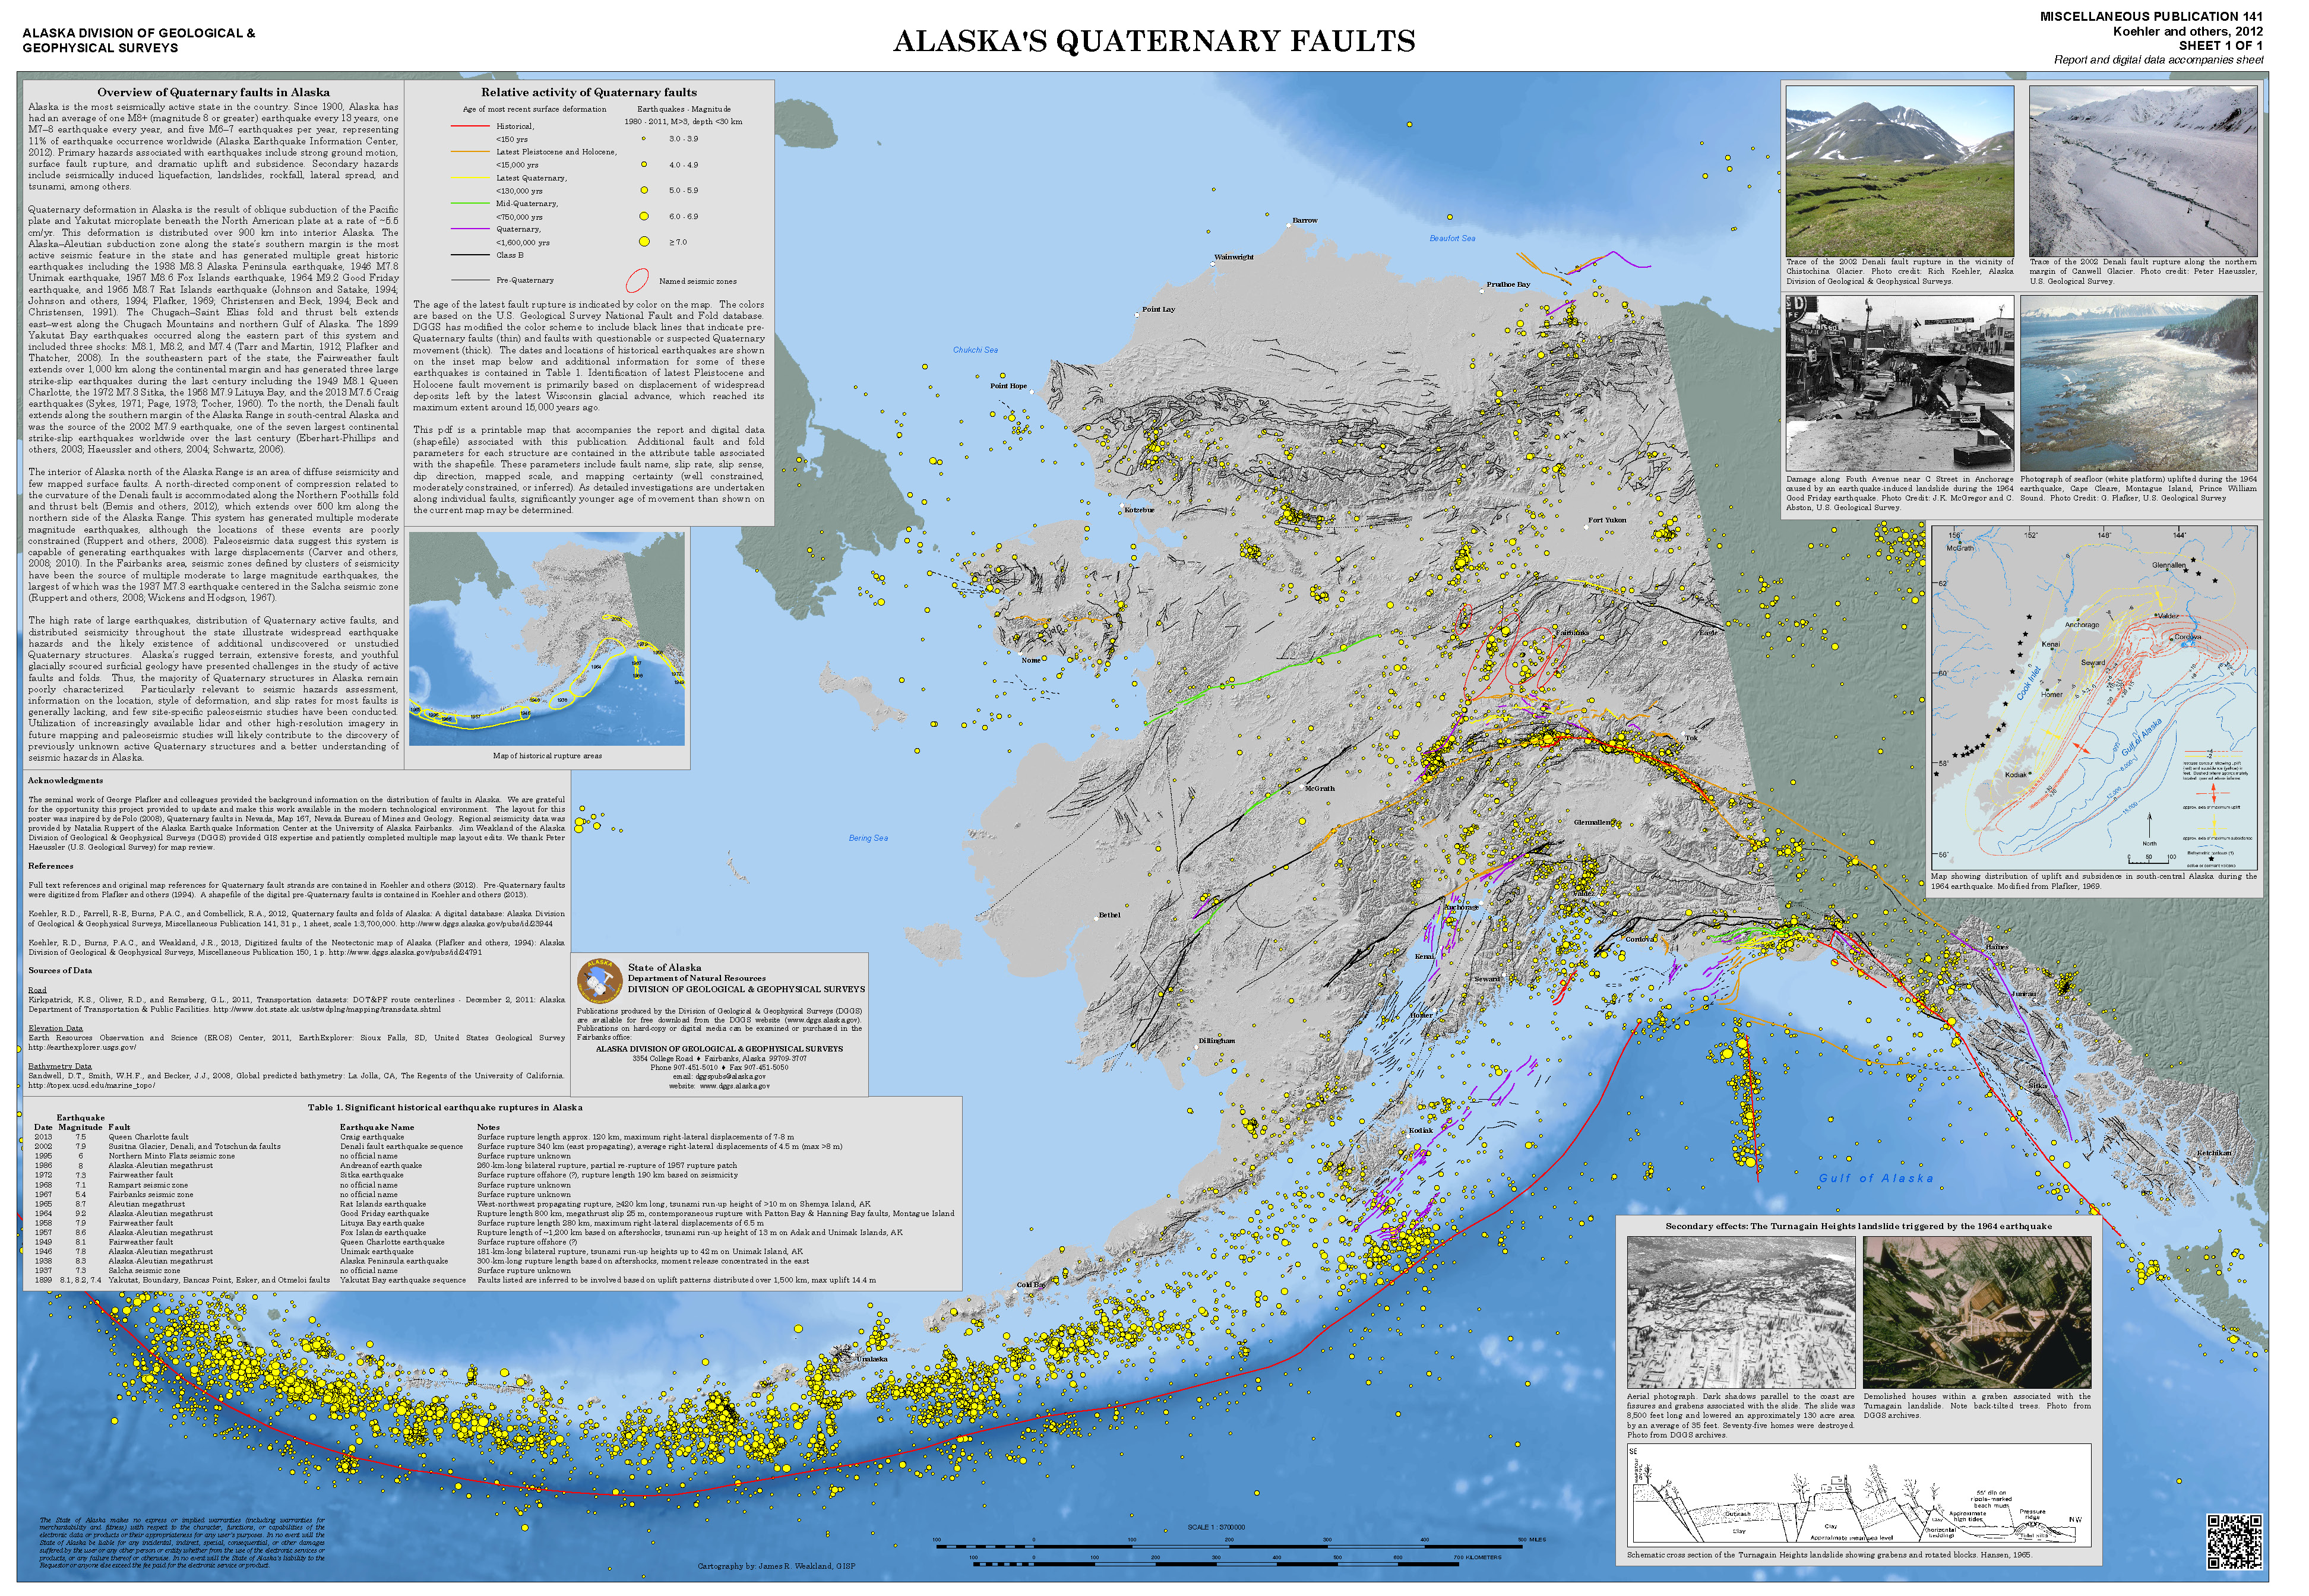
- Here is a map from Michael West at the Alaska Earthquake Center. This shows today’s earthquake in reference to the Quaternary faults and folds in Alaska: A digital database (Koehler et al., 2012). Dr. Rick Koehler is currently at the University of Nevada Reno and The Nevada Bureau of Mines and Geology. This is the map poster from Koehler et al. (2012). The link is to a 63 MB pdf file.
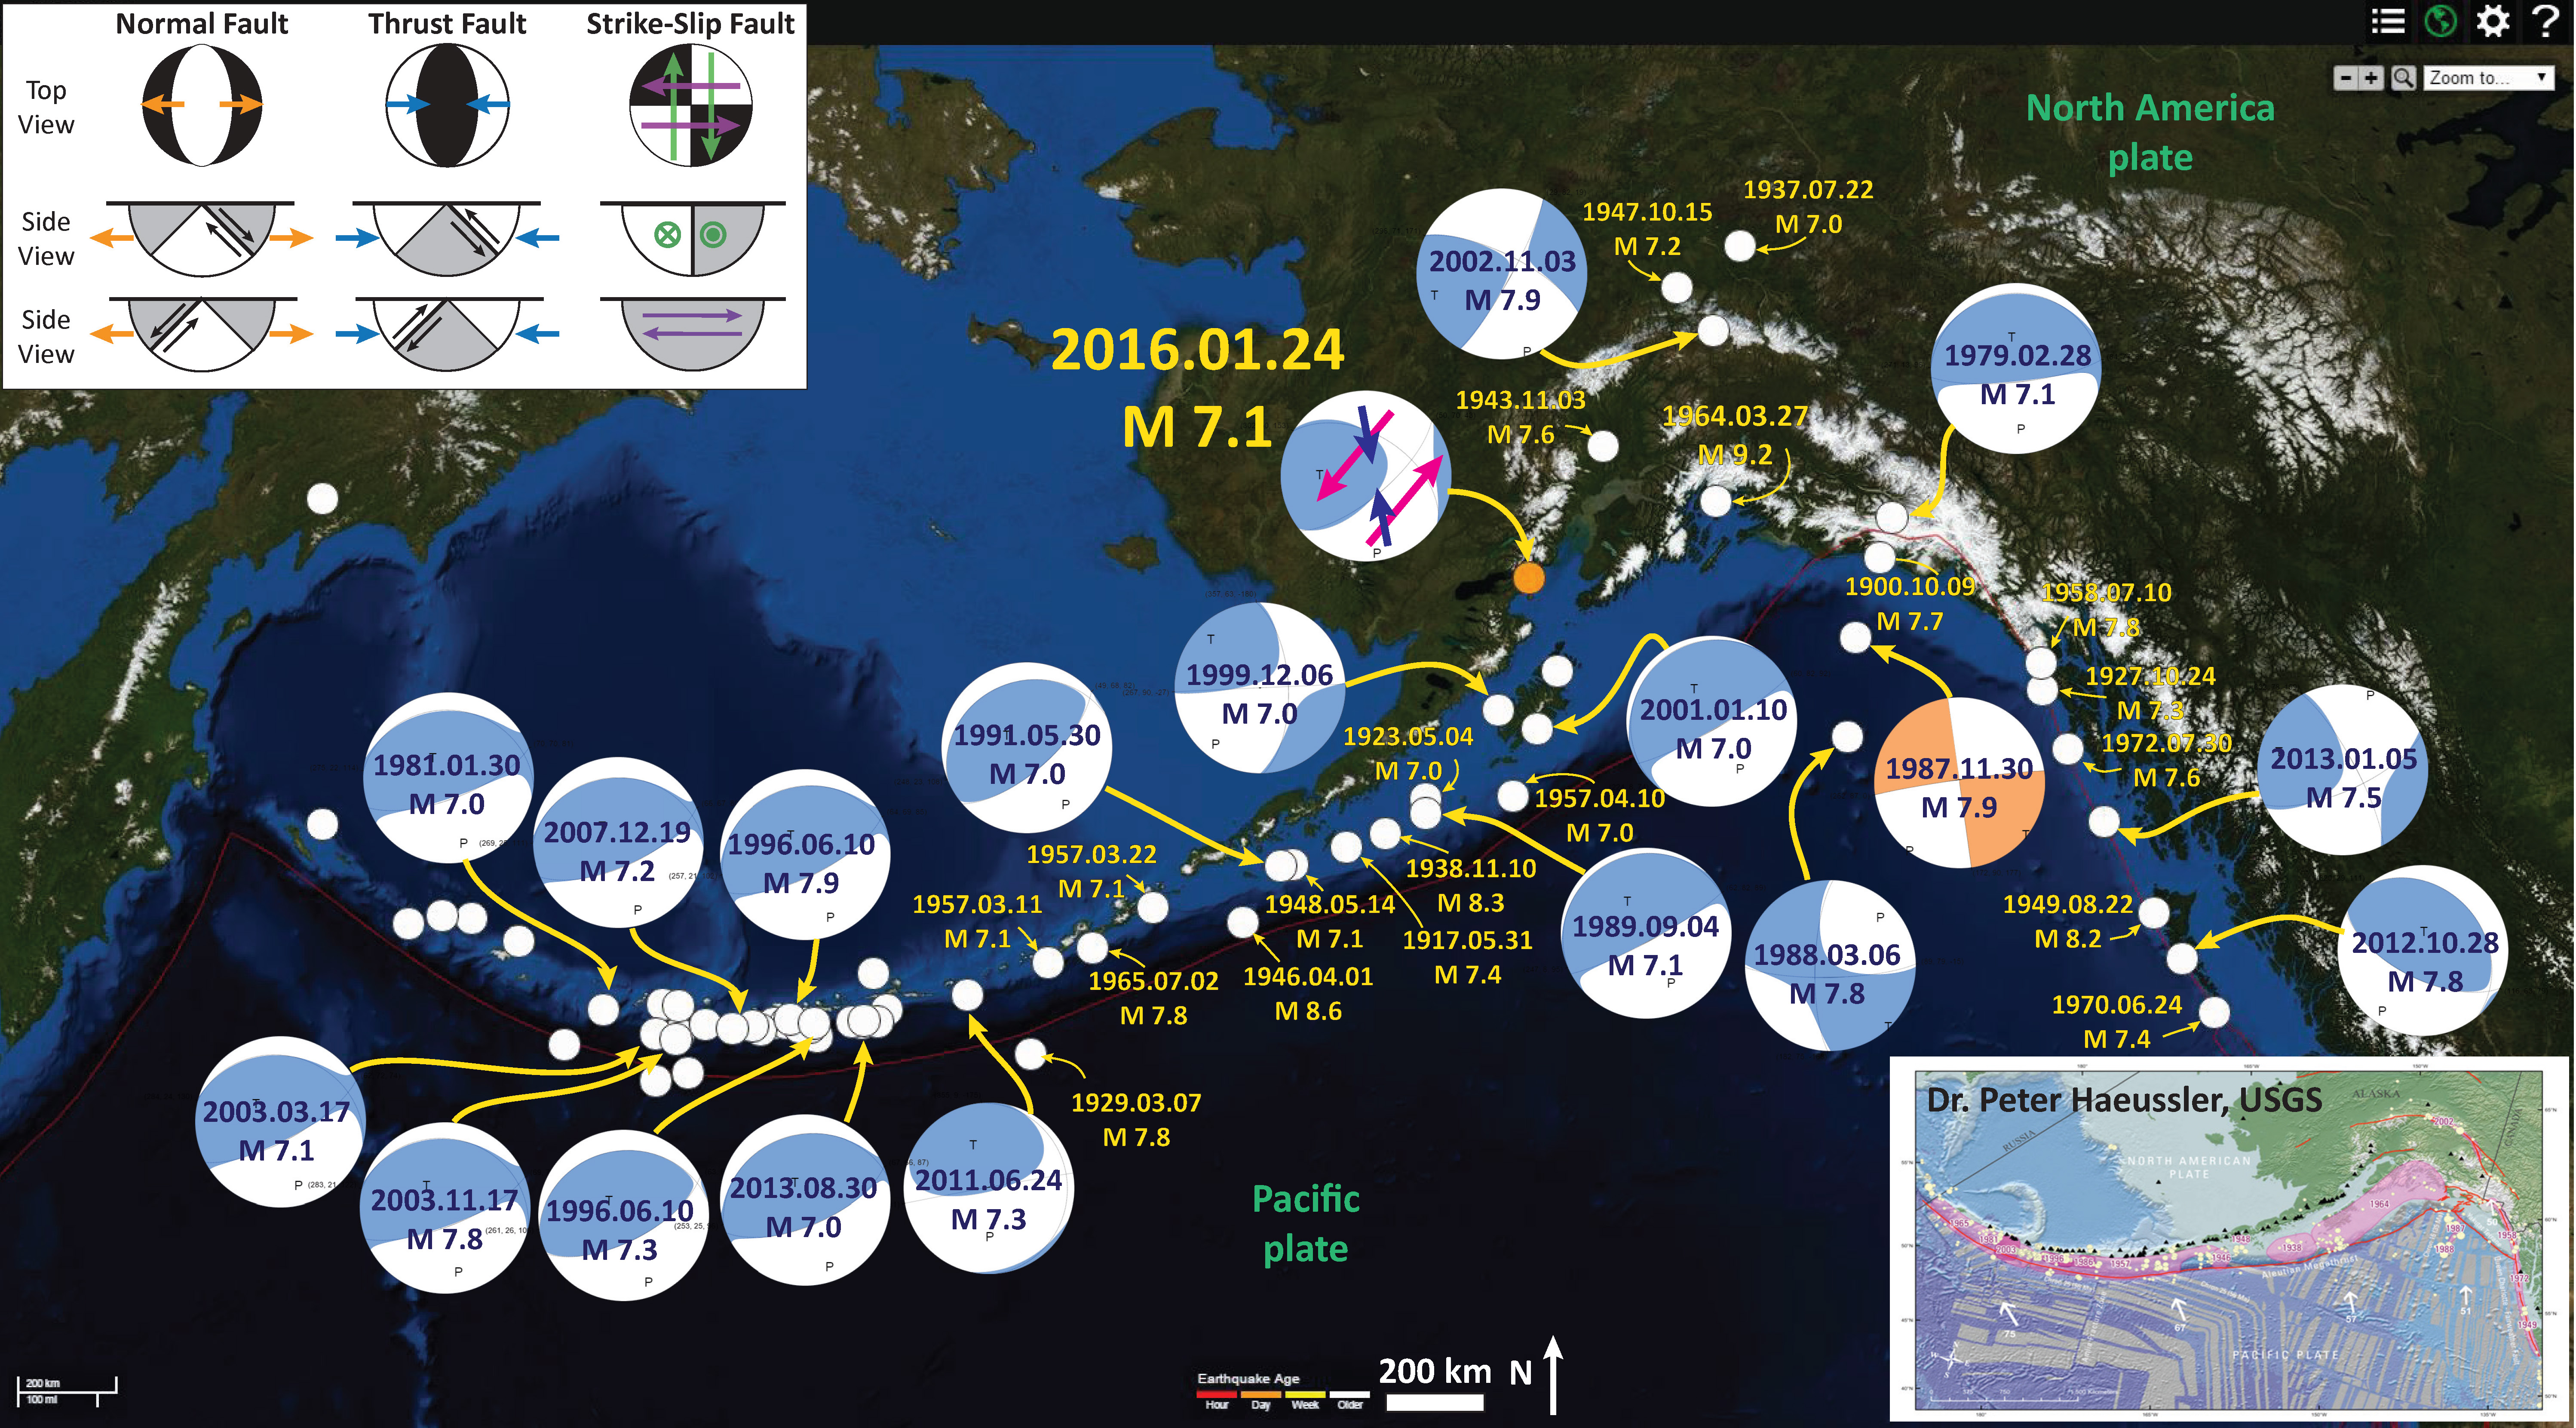
- Here is a map for the earthquakes of magnitude greater than or equal to M 7.0 between 1900 and 2016. This is the USGS query that I used to make this map. One may locate the USGS web pages for all the earthquakes on this map by following that link.
Social Media
Alaska's magnitude 7.9 earthquake rattled Earth's plumbing 3,800 miles away in Florida, where water levels in 2 wells spiked within minutes. How can this happen? Find out at https://t.co/3BvDWHJ3Io pic.twitter.com/PuEV9fngZd
— USGS (@USGS) January 23, 2018
IRIS Special Event page for the M7.9 #AlaskaEarthquake https://t.co/7XDDdb0IBb (Figure from the @USGS) pic.twitter.com/NJKaN3EM7H
— IRIS Earthquake Sci (@IRIS_EPO) January 23, 2018
Check out @UNAVCO’s Data Event Response page for the M7.9 earthquake last night offshore Alaska, excellent access to geodetic info – written by @EatTheCrust: https://t.co/Um6o3YTkdM. pic.twitter.com/rYVZJpmEBO
— SCEC (@SCEC) January 24, 2018
Given apparent similarities to 2012 strike slip quakes off Sumatra (which were even larger) it will be interesting to see if the Gulf of Alaska quake also ruptured a complex system of conjugate faults and how deep the rupture propagated https://t.co/KIaQWEbhS2 pic.twitter.com/YLTa9PoeVj
— Jascha Polet (@CPPGeophysics) January 23, 2018
Many seismic stations in Alaska operate multiple types of instruments to fully record the seismic wavefield. Here are records from the @IRIS_EPO Global Seismographic Network station on Kodiak Island, 280 km from the source. pic.twitter.com/JJAlhUKYSe
— Andy Frassetto (@drrocks1982) January 23, 2018
These are the seismic waves from the M7.9 Alaska earthquake this morning as they rolled through #Victoria. The first arriving wave (P-wave) took ~5 minutes to travel that distance (~2000 km). Tsunami waves take about 4 hours for that same distance. pic.twitter.com/CRSjFrZP8s
— John Cassidy (@earthquakeguy) January 23, 2018
1/ Earthquake armchair quarterbacking. As soon as the M7.9 earthquake occurred, there was an immediate clue suggesting a large tsunami was unlikely.
— Brian Brettschneider (@Climatologist49) January 23, 2018
Still many questions about this morning's unusual Gulf of Alaska M7.9. Lea Gardine made this graphic, overlaying seismic activity on magnetic seafloor data to help us decipher which fracture zone or zones the quake might have happened along. pic.twitter.com/pa3yWSoCIj
— AK Earthquake Center (@AKearthquake) January 24, 2018
- Summary of the 1964 Earthquake
- 2018.01.23 M 7.9 Gulf of Alaska
- 2018.01.23 M 7.9 Gulf of Alaska UPDATE #1
- 2018.01.23 M 7.9 Gulf of Alaska UPDATE #2
- 2017.07.17 M 7.7 Aleutians
- 2017.07.17 M 7.7 Aleutians UPDATE #1
- 2017.06.02 M 6.8 Aleutians
- 2017.05.08 M 6.2 Aleutians
- 2017.05.01 M 6.3 British Columbia
- 2017.03.29 M 6.6 Kamchatka
- 2017.03.02 M 5.5 Alaska
- 2016.09.05 M 6.3 Bering Kresla (west of Aleutians)
- 2016.04.13 M 5.7 & 6.4 Kamchatka
- 2016.04.02 M 6.2 Alaska Peninsula
- 2016.03.27 M 5.7 Aleutians
- 2016.03.12 M 6.3 Aleutians
- 2016.01.29 M 7.2 Kamchatka
- 2016.01.24 M 7.1 Alaska
- 2015.11.09 M 6.2 Aleutians
- 2015.11.02 M 5.9 Aleutians
- 2015.11.02 M 5.9 Aleutians (update)
- 2015.07.27 M 6.9 Aleutians
- 2015.05.29 M 6.7 Alaska Peninsula
- 2015.05.29 M 6.7 Alaska Peninsula (animations)
- 1964.03.27 M 9.2 Good Friday
Alaska | Kamchatka | Kurile
General Overview
Earthquake Reports
- Atwater, B.F., Yamaguchi, D.K., Bondevik, S., Barnhardt, W.A., Amidon, L.J., Benson, B.E., Skjerdal, G., Shulene, J.A., and Nanalyama ,F., 2001. Rapid resetting of an estuarine recorder of the 1964 Alaska earthquake in Geology, v. 113, no. 9, p. 1193-1204.
- Benz, H.M., Tarr, A.C., Hayes, G.P., Villaseñor, Antonio, Hayes, G.P., Furlong, K.P., Dart, R.L., and Rhea, Susan, 2011. Seismicity of the Earth 1900–2010 Aleutian arc and vicinity: U.S. Geological Survey Open-File Report 2010–1083-B, scale 1:5,000,000.
- Frisch, W., Meschede, M., Blakey, R., 2011. Plate Tectonics, Springer-Verlag, London, 213 pp.
- Hayes, G.P., Wald, D.J., and Johnson, R.L., 2012. Slab1.0: A three-dimensional model of global subduction zone geometries in, J. Geophys. Res., 117, B01302, doi:10.1029/2011JB008524
- Haeussler, P., Leith, W., Wald, D., Filson, J., Wolfe, C., and Applegate, D., 2014. Geophysical Advances Triggered by the 1964 Great Alaska Earthquake in EOS, Transactions, American Geophysical Union, v. 95, no. 17, p. 141-142.
- Koehler, R.D., Farrell, Rebecca-Ellen, Burns, P.A.C., and Combellick, R.A., 2012. Quaternary faults and folds in Alaska: A digital database, in Koehler, R.D., Quaternary Faults and Folds (QFF): Alaska Division of Geological & Geophysical Surveys Miscellaneous Publication 141, 31 p., 1 sheet, scale 1:3,700,000. doi:10.14509/23944
- Meng, L., Ampuero, J.-P., Stock, J., Duputel, Z., Luo, Y., and Tsai, V.C., 2012. Earthquake in a Maze: Compressional Rupture Branching During the 2012 Mw 8.6 Sumatra Earthquake in Science, v. 337, p. 724-726.
- Plafker, G., 1969. Tectonics of the March 27, 1964 Alaska earthquake: U.S. Geological Survey Professional Paper 543–I, 74 p., 2 sheets, scales 1:2,000,000 and 1:500,000, http://pubs.usgs.gov/pp/0543i/.
- Plafker, G., 1972. Alaskan earthquake of 1964 and Chilean earthquake of 1960: Implications for arc tectonics in Journal of Geophysical Research, v. 77, p. 901-925.
- Saltus, R.W., and Barnett, A., 2000. Eastern Aleutian Volcanic Arc Digital Model – Version 1.0: U.S. Geological Survey Open-File Report 00
