This year we look back and remember what happened ten years ago in Japan and across the entire Pacific Basin.
There are numerous web experiences focused on this type of reflection. Here is a short list, some of which I have been involved in.
- The Redwood Coast Tsunami Work Group gathered experiences of people who were involved in the Earthquake or Tsunami response. Here is their website We Remember.”.
- The California Geological Survey (CGS) prepared several websites devoted to the Tōhoku-oki Earthquake and Tsunami, focusing on how the tsunami impacted California and what has changed in the state since 2011. The entire tsunami program contributed to these expoeriences. Learn more about this program at the CGS Tsunami Program website.
- Here is the CGS Tōhoku-oki remembrance web page
- Here is a fantastic web page that Nick Graehl put together using an ArcGIS Story Map system. Don’t miss the two multimedia tours, one for observations in Japan and one for observations in California.
Here are all the pages for this earthquake and tsunami:
- 2011.03.11 M 9.0 Japan (Tohoku-Oki) Main Page
- 2011.03.11 M 9.0 Japan (Tōhoku-oki) Earthquake
- 2011.03.11 M 9.0 Japan (Tōhoku-oki) Tsunami
- 2011.03.11 M 9.1 Japan (Tōhoku-oki) Decade Remembrance (this page)
I have several reports from previous years that have reviews of the earthquake and tsunami.
- This is the primary page where I present a comprehensive summary of our findings as of a few years ago.
I focus mostly on new material I prepared for the following report.
Updated Interpretive Poster
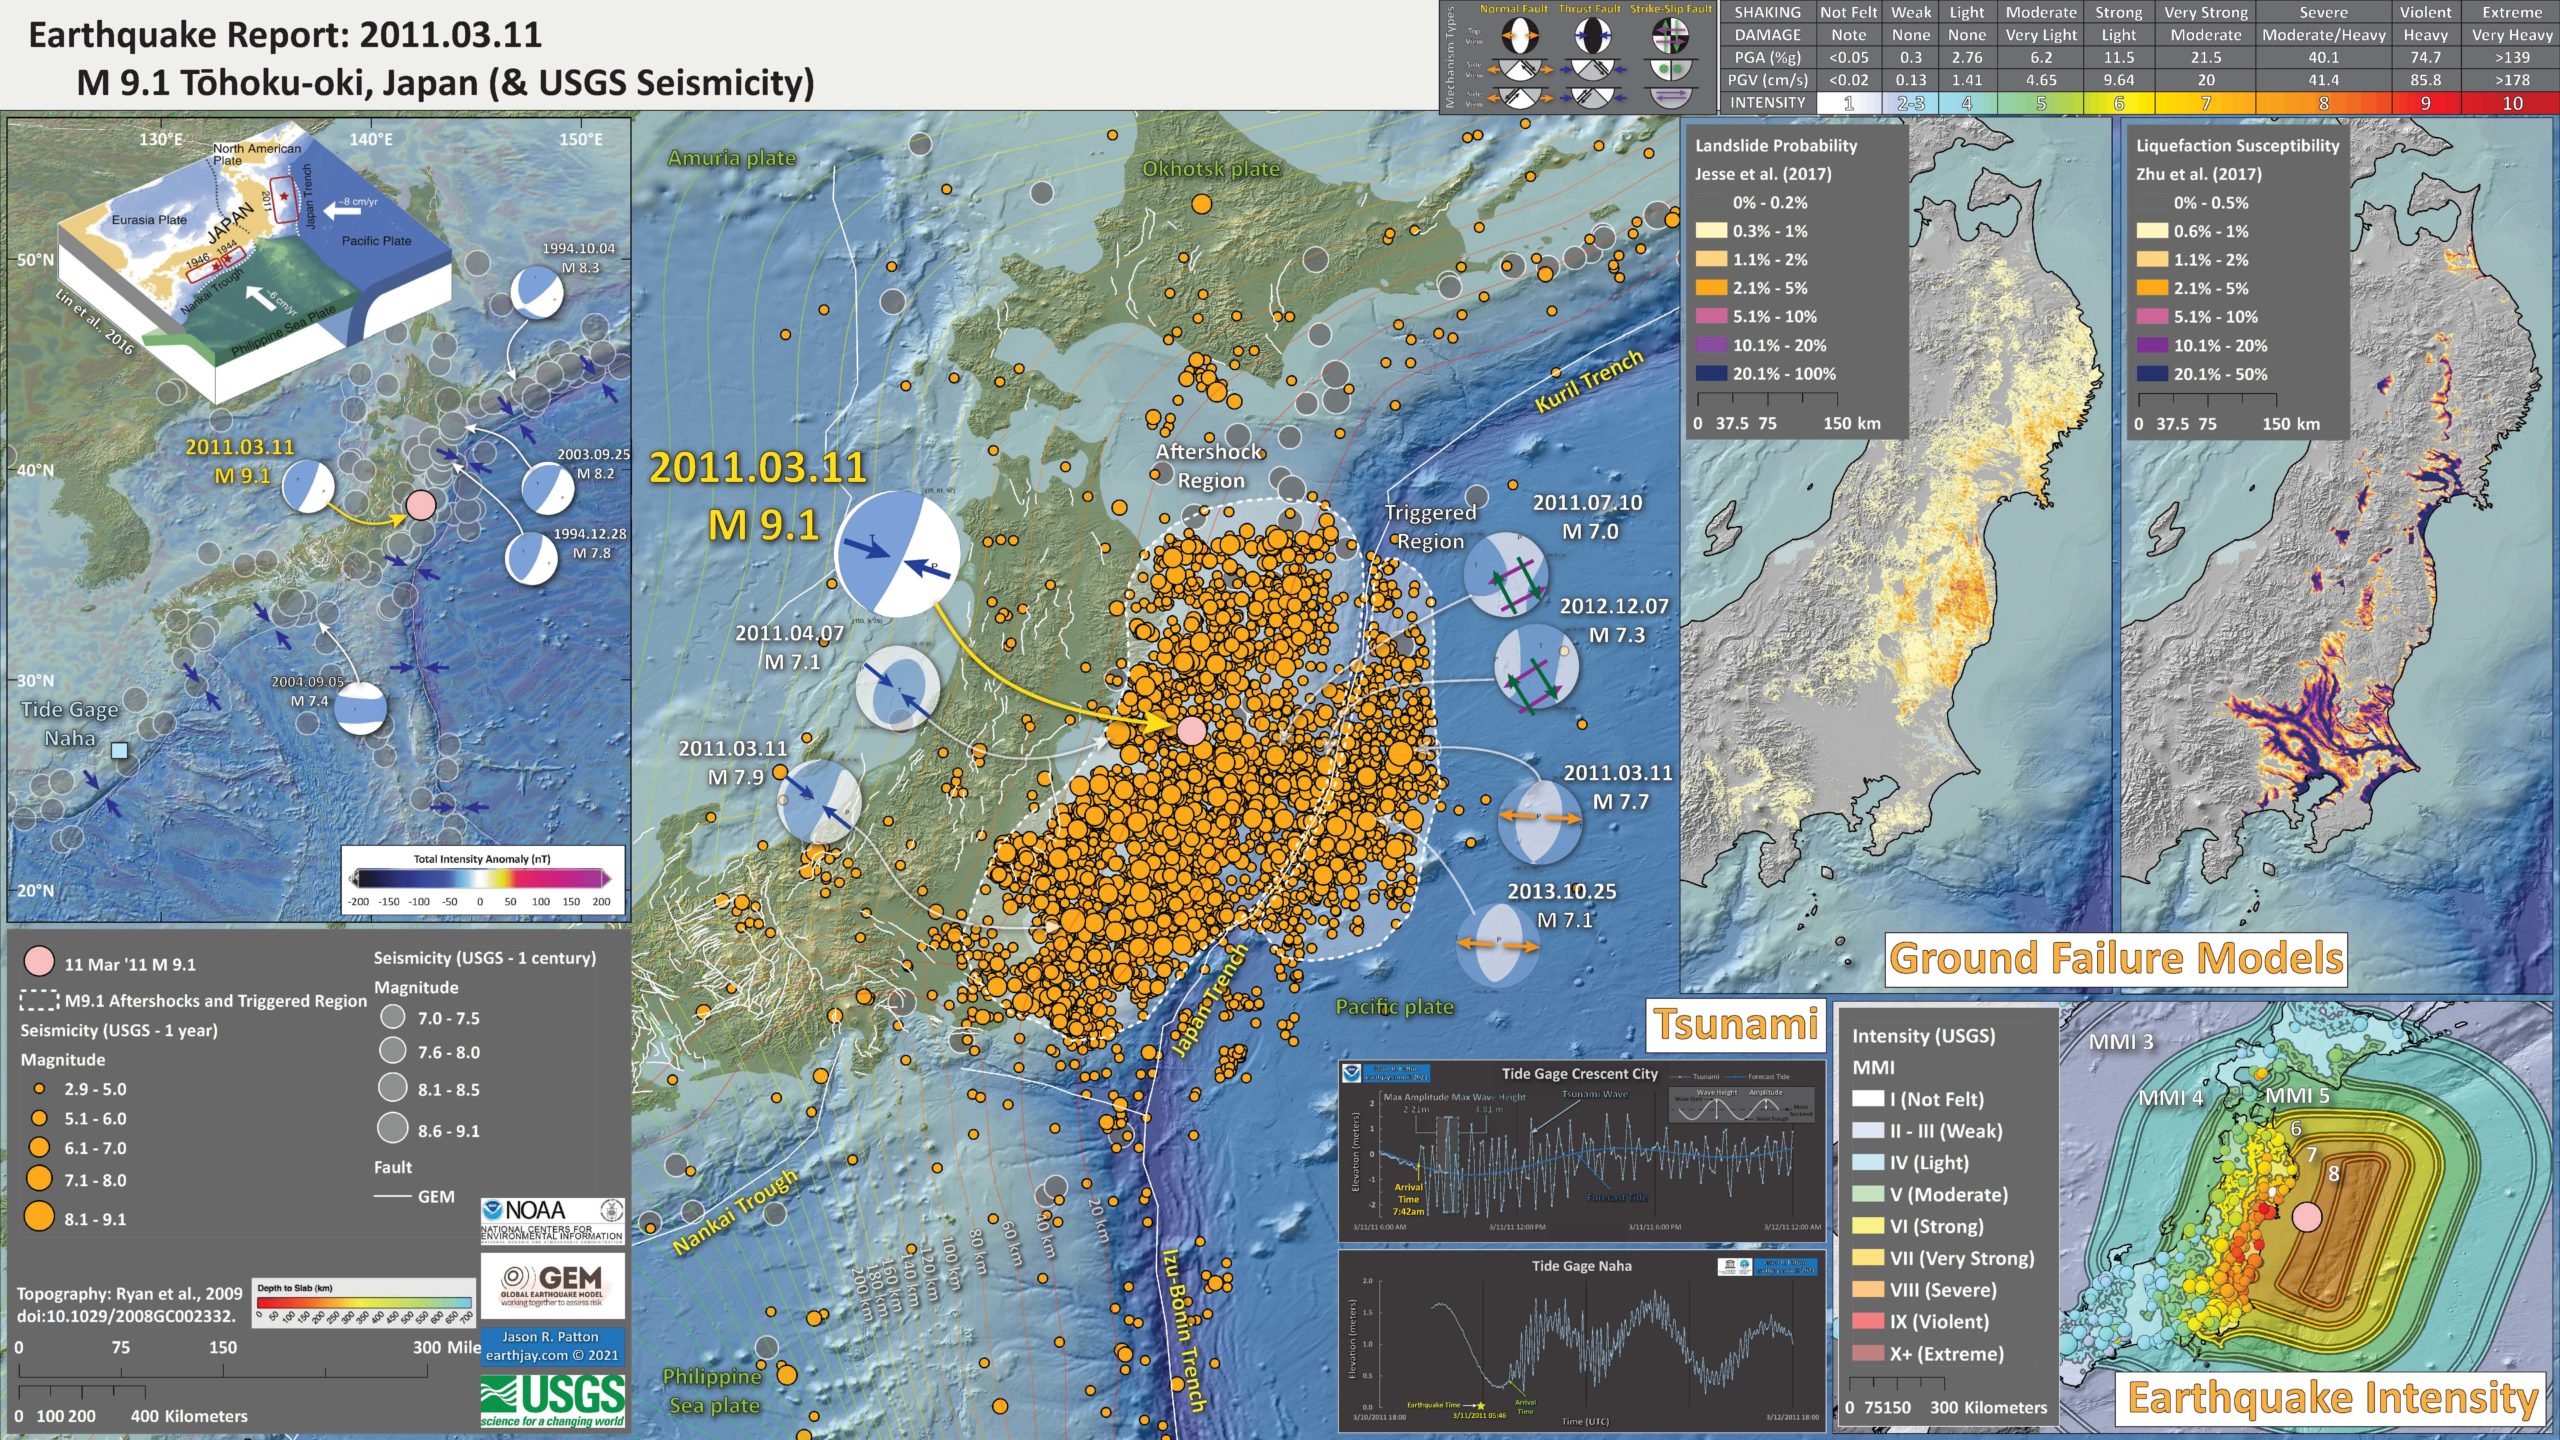
- I plot the seismicity from the year after the M 9.1, as well as large events from the past century, with diameter representing magnitude (see legend).
- I plot the USGS fault plane solutions (moment tensors in blue and focal mechanisms in orange), possibly in addition to some relevant historic earthquakes.
- A review of the basic base map variations and data that I use for the interpretive posters can be found on the Earthquake Reports page. I have improved these posters over time and some of this background information applies to the older posters.
- Some basic fundamentals of earthquake geology and plate tectonics can be found on the Earthquake Plate Tectonic Fundamentals page.
I include some inset figures.
- In the upper left corner is a small scale plate tectonic map showing the plate boundary faults with the magnetic anomalies overlain in transparency. There is an inset low angle oblique illustrative map showing how these plates interact in the subsurface (Lin et al., 2016).
- In the lower right corner is a map that shows a comparison between the USGS modeled earthquake intensity and the USGS Did You Feel It? observations. These data are also included in a web map lower down in this update.
- To the left of the intensity map are two tide gage plots that show a tsunami record. The upper plot is from Crescent City, California. The lower plot is from Naha, a location southwest of the earthquake, labeled on tectonic map. These and other tide gage records are viewable in the tide gage web map below.
- In the upper right corner are two maps displaying the results from ground failure models from the USGS. The map on the left shows the potential for landslides triggered by the M 9.1 earthquake. The map on the right shows the chance that an area may have experienced liquefaction. These are included in a web map below.
- Here is the map with a year’s and century’s seismicity plotted.

Seismicity
Web Map
I include some inset figures.
Web Map
Use this map to see the magnitudes of different earthquakes experienced in Japan. The map shows earthquake epicenters for large-magnitude historic events of the past century. It also includes epicenters for all aftershocks and triggered earthquakes for a year after the M 9.1 earthquake, and an outline of the aftershocks, which illustrates the area of the fault that slipped during the M 9.1 earthquake.
- If you want to see this map in a larger window, click here.
Earthquake Intensity
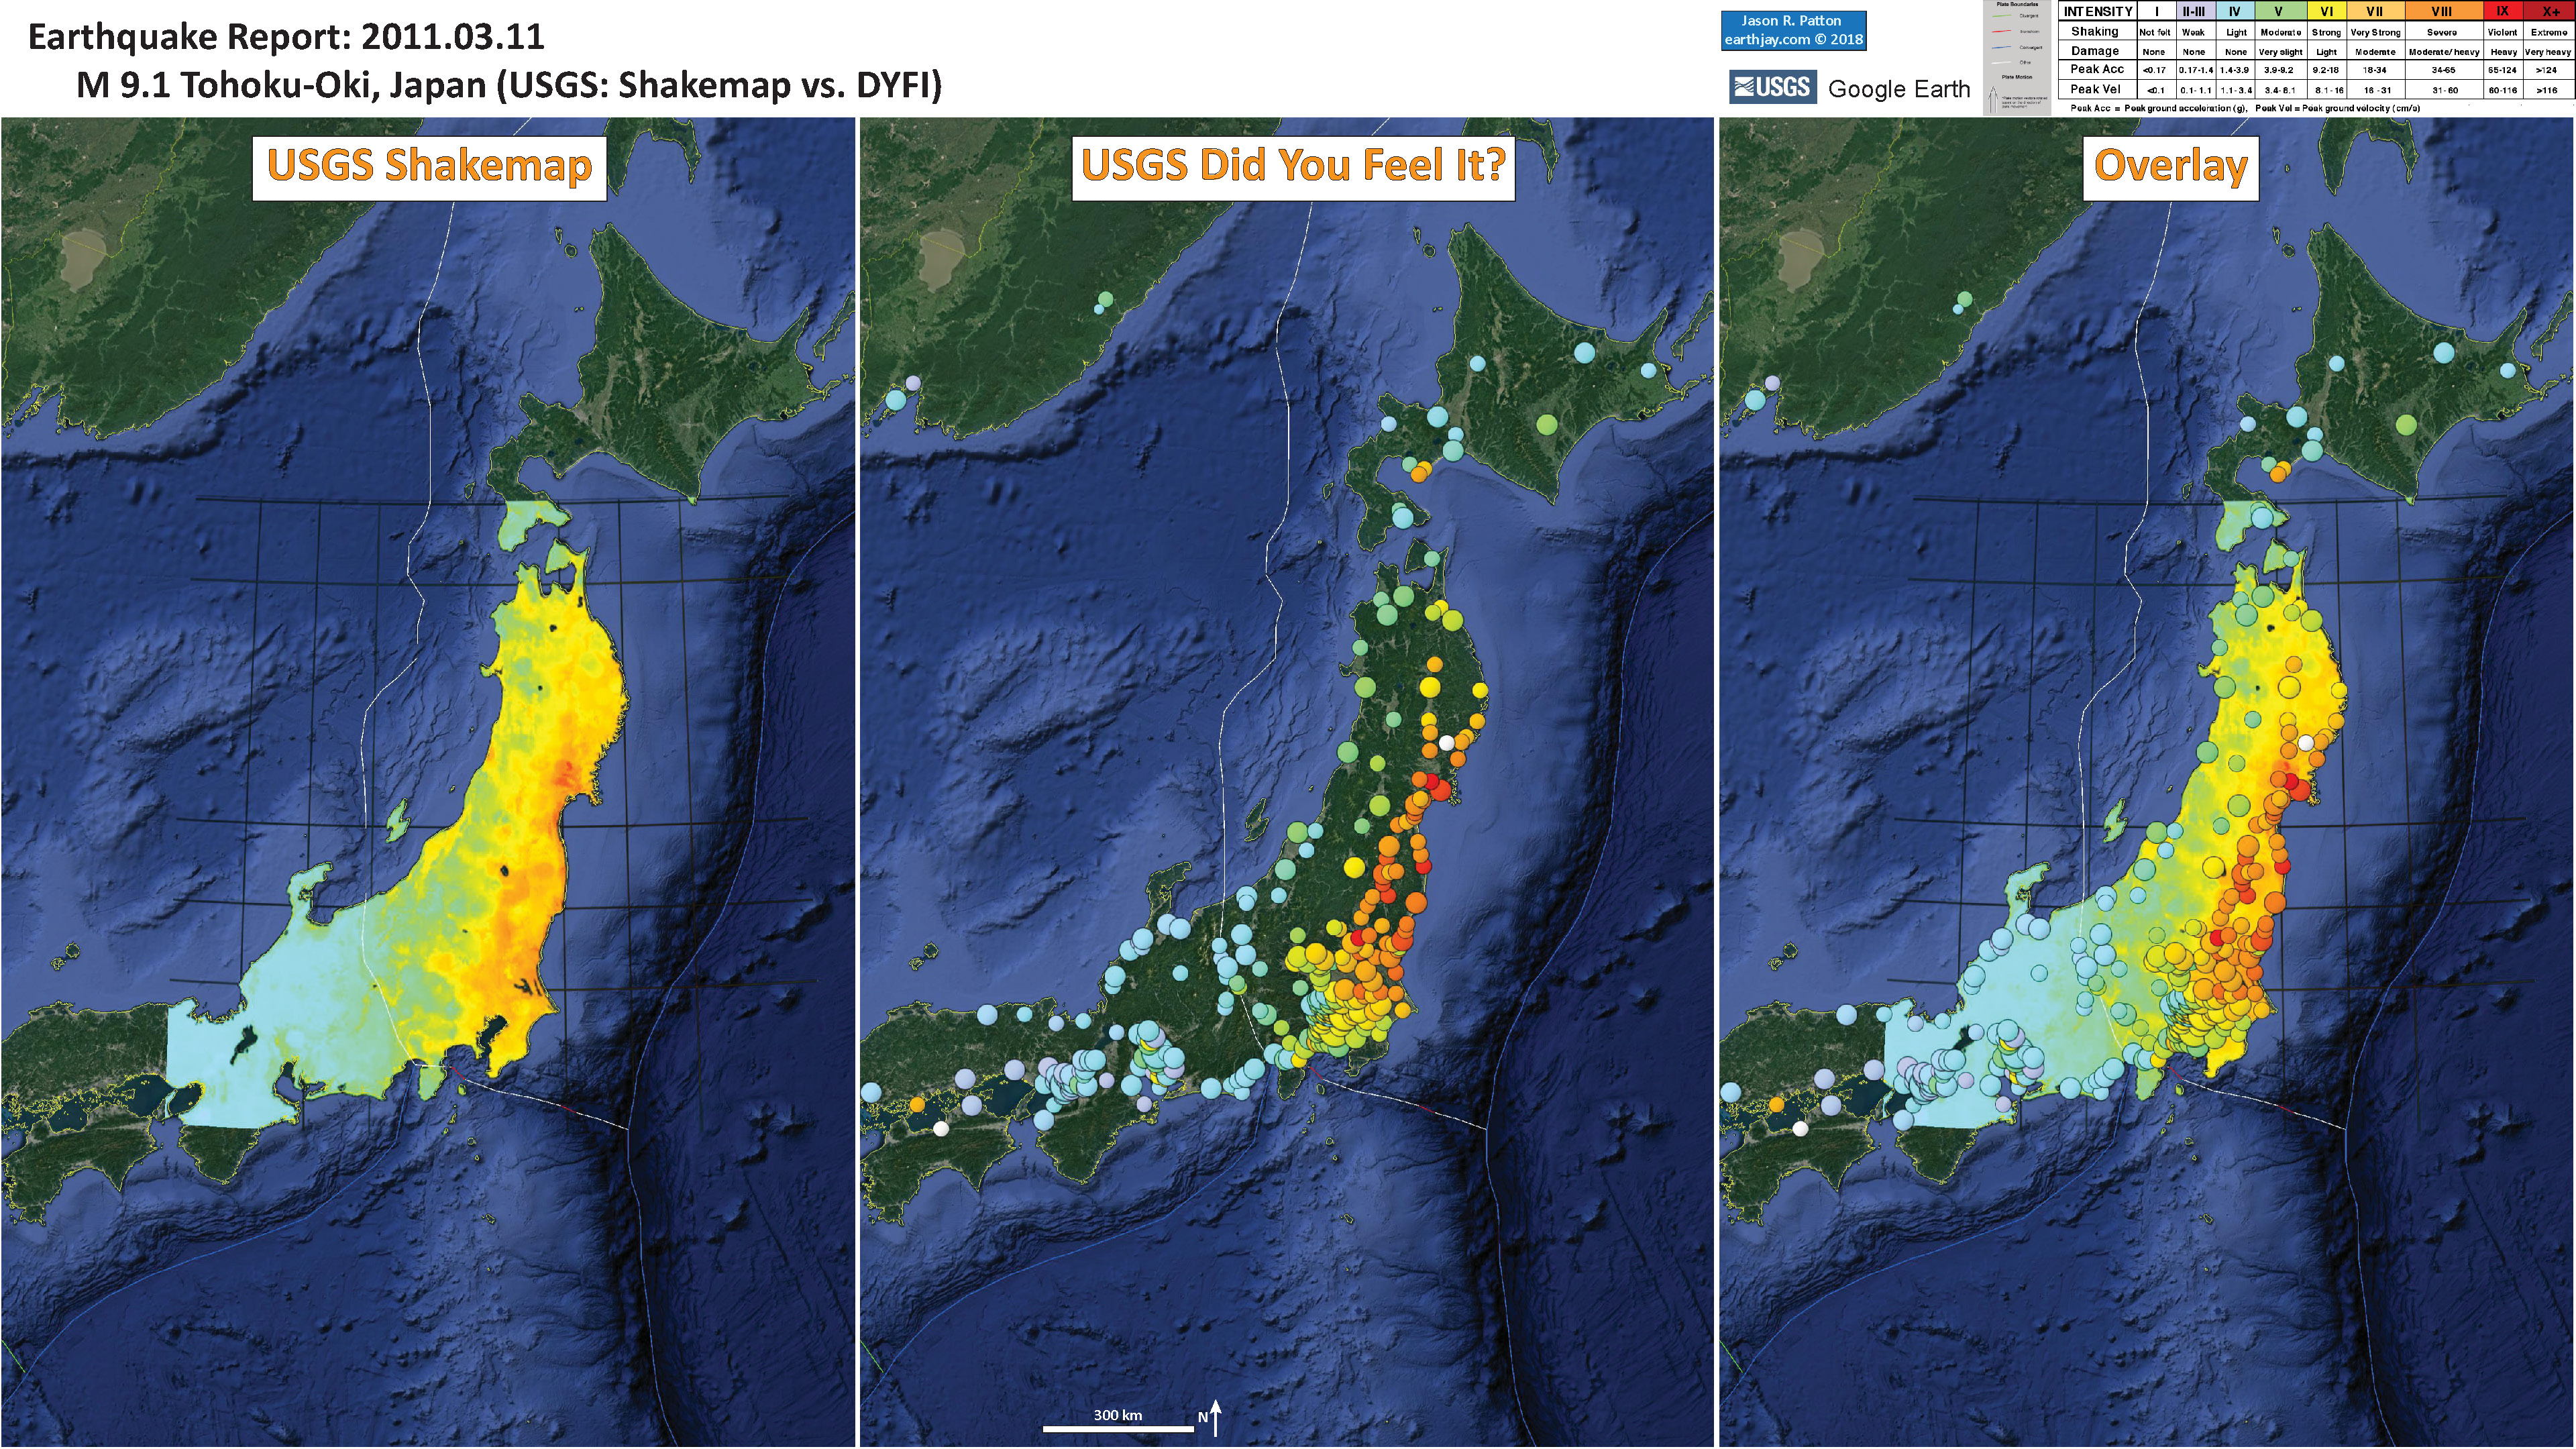
Earthquake intensity is a measure of how strongly earthquake shaking is felt by people and objects. The further away from the epicenter, the lower the earthquake intensity. Seismologists use computer models to estimate what the intensity will be from an earthquake. The U.S. Geological Survey uses its “Did You Feel It?” (DYFI) system to collect observations about how strongly people in different places felt an earthquake.
- Here is a figure that shows a more comparison between the modeled intensity and the reported intensity. Both data use the same color scale, the Modified Mercalli Intensity Scale (MMI). More about this can be found here. The colors and contours on the map are results from the USGS modeled intensity. The DYFI data are plotted as colored dots (color = MMI, diameter = number of reports).
- The 3 panels, from left to right, show the USGS Shakemap (the model estimate), the DYFI reports, and an overlay comparing both of these data.
Web Map
Use this map to see the level of intensity people felt in different parts of Japan. The map displays the USGS intensity model for the M 9.1 earthquake as transparent colors. The map also shows, as colored circles, the “Did You Feel It?” report results from people who experienced shaking from this earthquake.
- If you want to see this map in a larger window, click here.
Tsunami
Tsunami can be caused by a variety of processes, including earthquakes, volcanic eruptions, landslides, and meteorological phenomena. Earthquakes, eruptions, and landslides cause tsunami when these processes displace water in some way. We may typically associate tsunami with subduction zone earthquakes because these earthquakes are the type that generate vertical land motion along the sea floor.
- Here is a great illustration of how a subduction zone earthquake can generate a tsunami (Atwater et al., 2005).
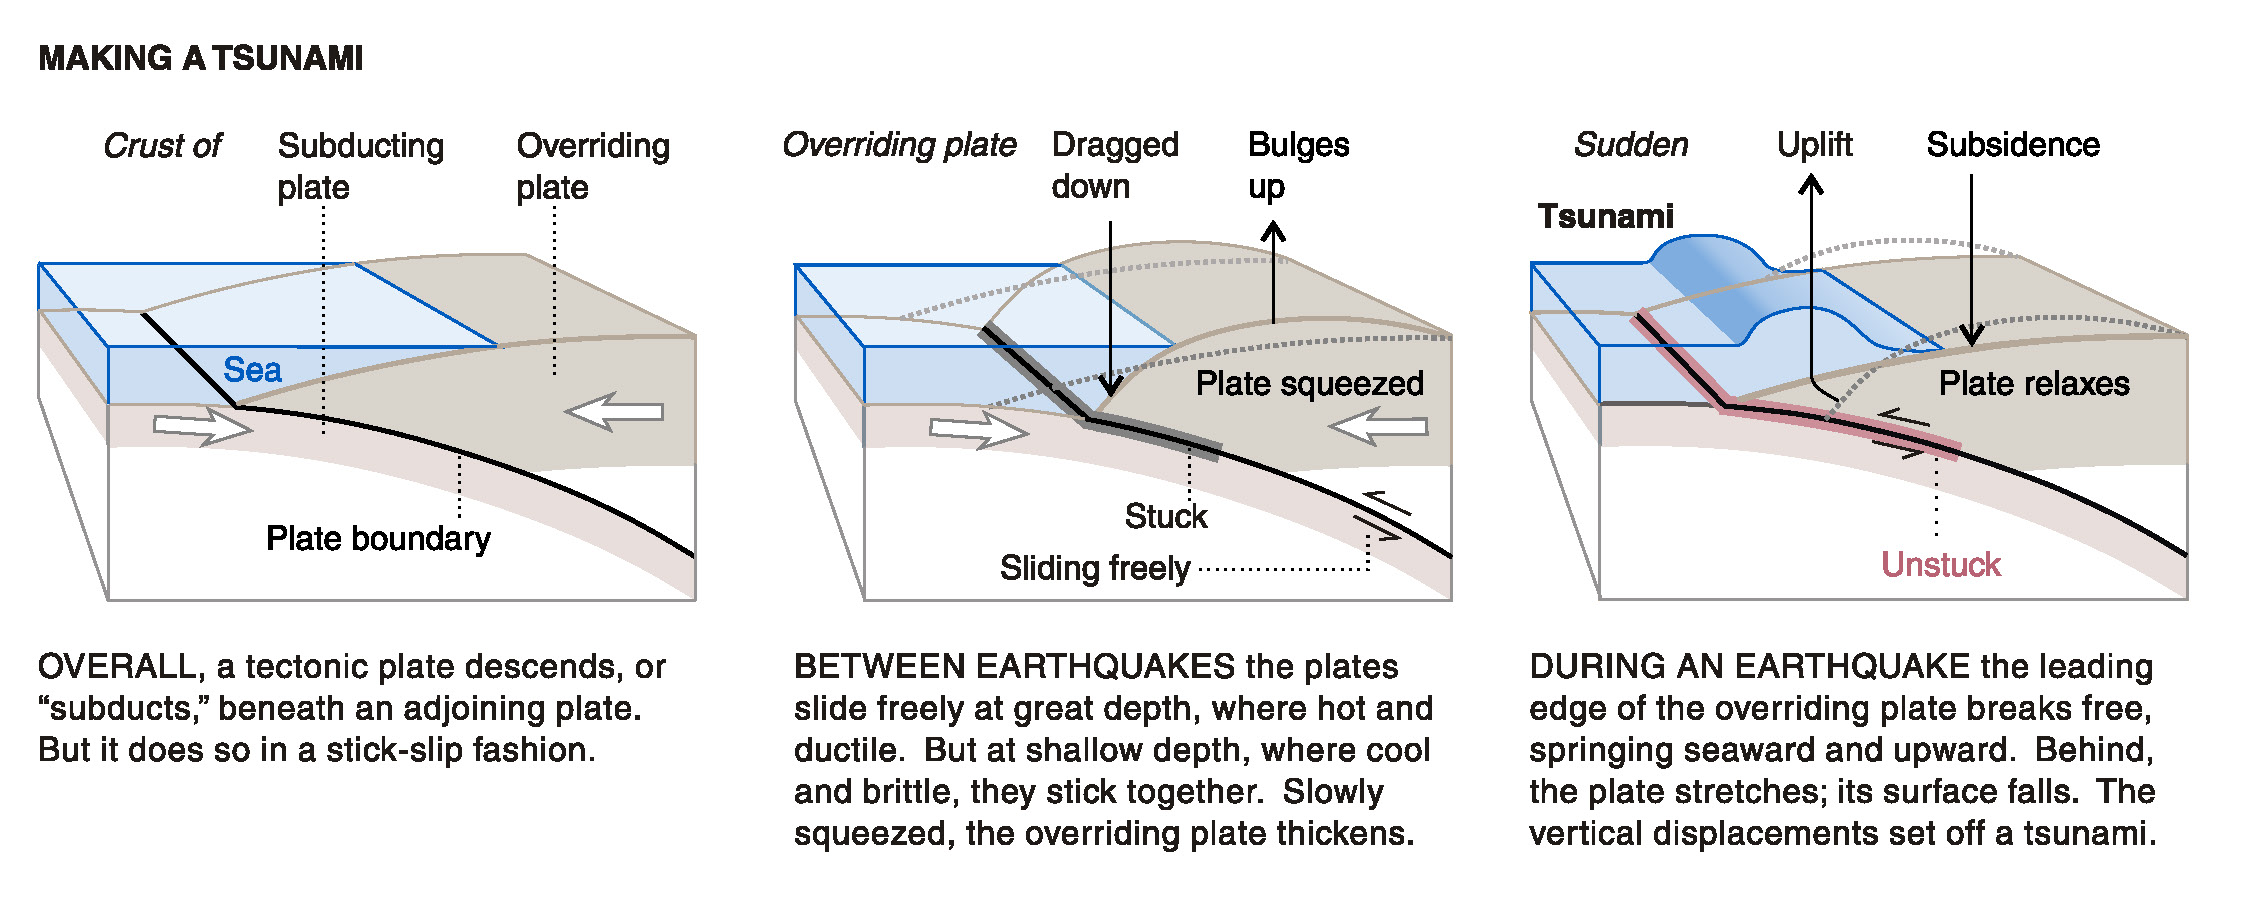
We think that the earthquake slipped at least 50 meters (165 feet) during several minutes. This is the largest coseismic measurement of any subduction zone earthquake (so far).
When the fault slipped, it caused the seafloor to deform and move. This motion also displaced the overlying water column.
As the water column is elevated, it gains potential energy. As this uplifted water expends this energy by oscillating up and down, it radiates energy in the form of tsunami waves.
Tsunami were observed across the entire Pacific Basin, causing extensive damage and casualties in Japan, but also in other places too. There was about $100 million damage to coastal infrastructure in California alone.
This is an animated model of the Great East Japan tsunami of ten years ago. The warmer the colors, the larger the wave. The first surges reached the closest Japan coasts in about 25 minutes. The first surges reached Crescent City in 9.5 hours. (modified text from Dr. Lori Dengler)
This is the same map used as an overlay in the web map below.
-
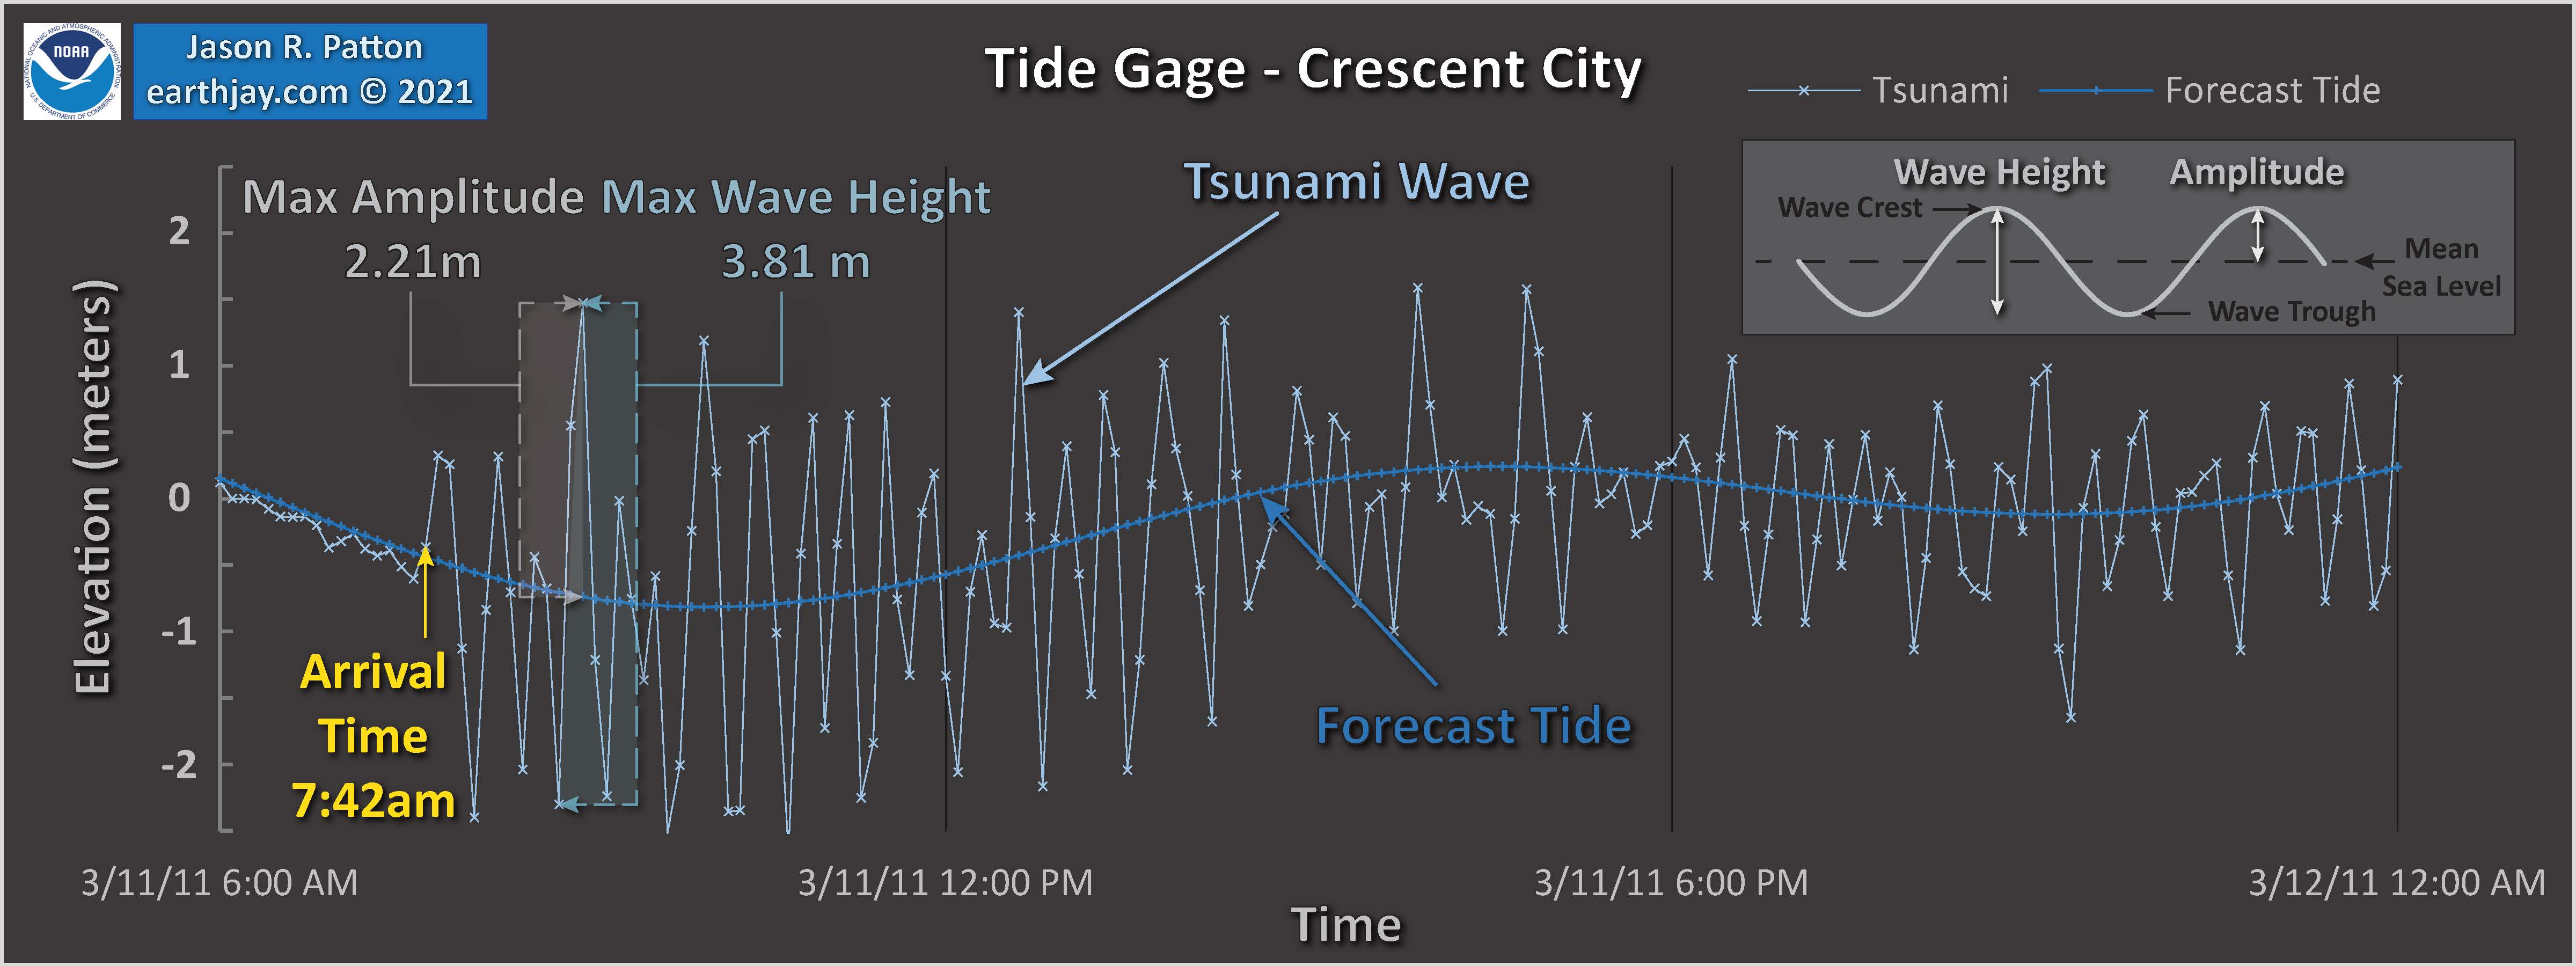
Here is the tide gage record from Crescent City, California, USA.
Time is represented by the horizontal axis and elevation is represented on the vertical axis. The darker blue line in this image represents NOAA’s tidal forecast. The data recorded by the tide gage are represented by the light blue colored lines. Wave height is the distance measured between the wave crest and trough. Wave amplitude is the level of water above sea level.
Some of these data came from the IOC sea level monitoring website.
Web Map
Use this map to see tsunami wave data as recorded by tide gages across the entire Pacific Basin. Click on a white triangle and there is a link to open the tide gage data as a graphic.
There is an overlay of color that represents the size of the tsunami as it travelled across the ocean. Learn more about these data here.
- If you want to see this map in a larger window, click here.
Ground Failure
- Below are a series of maps that show the shaking intensity and potential for landslides and liquefaction. These are all USGS data products.
There are many different ways in which a landslide can be triggered. The first order relations behind slope failure (landslides) is that the “resisting” forces that are preventing slope failure (e.g. the strength of the bedrock or soil) are overcome by the “driving” forces that are pushing this land downwards (e.g. gravity). The ratio of resisting forces to driving forces is called the Factor of Safety (FOS). We can write this ratio like this:
FOS = Resisting Force / Driving Force
When FOS > 1, the slope is stable and when FOS < 1, the slope fails and we get a landslide. The illustration below shows these relations. Note how the slope angle α can take part in this ratio (the steeper the slope, the greater impact of the mass of the slope can contribute to driving forces). The real world is more complicated than the simplified illustration below.

Landslide ground shaking can change the Factor of Safety in several ways that might increase the driving force or decrease the resisting force. Keefer (1984) studied a global data set of earthquake triggered landslides and found that larger earthquakes trigger larger and more numerous landslides across a larger area than do smaller earthquakes. Earthquakes can cause landslides because the seismic waves can cause the driving force to increase (the earthquake motions can “push” the land downwards), leading to a landslide. In addition, ground shaking can change the strength of these earth materials (a form of resisting force) with a process called liquefaction.
Sediment or soil strength is based upon the ability for sediment particles to push against each other without moving. This is a combination of friction and the forces exerted between these particles. This is loosely what we call the “angle of internal friction.” Liquefaction is a process by which pore pressure increases cause water to push out against the sediment particles so that they are no longer touching.
An analogy that some may be familiar with relates to a visit to the beach. When one is walking on the wet sand near the shoreline, the sand may hold the weight of our body generally pretty well. However, if we stop and vibrate our feet back and forth, this causes pore pressure to increase and we sink into the sand as the sand liquefies. Or, at least our feet sink into the sand.
Below is a diagram showing how an increase in pore pressure can push against the sediment particles so that they are not touching any more. This allows the particles to move around and this is why our feet sink in the sand in the analogy above. This is also what changes the strength of earth materials such that a landslide can be triggered.

Below is a diagram based upon a publication designed to educate the public about landslides and the processes that trigger them (USGS, 2004). Additional background information about landslide types can be found in Highland et al. (2008). There was a variety of landslide types that can be observed surrounding the earthquake region. So, this illustration can help people when they observing the landscape response to the earthquake whether they are using aerial imagery, photos in newspaper or website articles, or videos on social media. Will you be able to locate a landslide scarp or the toe of a landslide? This figure shows a rotational landslide, one where the land rotates along a curvilinear failure surface.

- Below is the liquefaction susceptibility and landslide probability map (Jessee et al., 2017; Zhu et al., 2017). Please head over to that report for more information about the USGS Ground Failure products (landslides and liquefaction). Basically, earthquakes shake the ground and this ground shaking can cause landslides. We can see that there is a low probability for landslides. However, we have already seen photographic evidence for landslides and the lower limit for earthquake triggered landslides is magnitude M 5.5 (from Keefer 1984)
- I use the same color scheme that the USGS uses on their website. Note how the areas that are more likely to have experienced earthquake induced liquefaction are in the valleys. Learn more about how the USGS prepares these model results here.

Use this map to see the magnitudes of different earthquakes experienced in Japan. The map shows earthquake epicenters for large-magnitude historic events of the past century. It also includes epicenters for all aftershocks and triggered earthquakes for a year after the M 9.1 earthquake, and an outline of the aftershocks, which illustrates the area of the fault that slipped during the M9.1 earthquake.
Web Map
- If you want to see this map in a larger window, click here.
There are many different ways in which a landslide can be triggered. The first order relations behind slope failure (landslides) is that the “resisting” forces that are preventing slope failure (e.g. the strength of the bedrock or soil) are overcome by the “driving” forces that are pushing this land downwards (e.g. gravity). The ratio of resisting forces to driving forces is called the Factor of Safety (FOS). We can write this ratio like this:
FOS = Resisting Force / Driving Force
When FOS > 1, the slope is stable and when FOS < 1, the slope fails and we get a landslide. The illustration below shows these relations. Note how the slope angle α can take part in this ratio (the steeper the slope, the greater impact of the mass of the slope can contribute to driving forces). The real world is more complicated than the simplified illustration below.
Landslide ground shaking can change the Factor of Safety in several ways that might increase the driving force or decrease the resisting force. Keefer (1984) studied a global data set of earthquake triggered landslides and found that larger earthquakes trigger larger and more numerous landslides across a larger area than do smaller earthquakes. Earthquakes can cause landslides because the seismic waves can cause the driving force to increase (the earthquake motions can “push” the land downwards), leading to a landslide. In addition, ground shaking can change the strength of these earth materials (a form of resisting force) with a process called liquefaction.
Sediment or soil strength is based upon the ability for sediment particles to push against each other without moving. This is a combination of friction and the forces exerted between these particles. This is loosely what we call the “angle of internal friction.” Liquefaction is a process by which pore pressure increases cause water to push out against the sediment particles so that they are no longer touching.
An analogy that some may be familiar with relates to a visit to the beach. When one is walking on the wet sand near the shoreline, the sand may hold the weight of our body generally pretty well. However, if we stop and vibrate our feet back and forth, this causes pore pressure to increase and we sink into the sand as the sand liquefies. Or, at least our feet sink into the sand.
Below is a diagram showing how an increase in pore pressure can push against the sediment particles so that they are not touching any more. This allows the particles to move around and this is why our feet sink in the sand in the analogy above. This is also what changes the strength of earth materials such that a landslide can be triggered.
Below is a diagram based upon a publication designed to educate the public about landslides and the processes that trigger them (USGS, 2004). Additional background information about landslide types can be found in Highland et al. (2008). There was a variety of landslide types that can be observed surrounding the earthquake region. So, this illustration can help people when they observing the landscape response to the earthquake whether they are using aerial imagery, photos in newspaper or website articles, or videos on social media. Will you be able to locate a landslide scarp or the toe of a landslide? This figure shows a rotational landslide, one where the land rotates along a curvilinear failure surface.
- 2018.09.05 M 6.6 Hokkaido, Japan
- 2016.07.29 M 7.7 Mariana
- 2016.11.21 M 6.9 Japan
- 2016.10.19 M 6.2 Japan
- 2016.08.20 M 6.0 Japan
- 2016.04.14 M 6.2 Japan
- 2016.04.01 M 6.0 Japan
- 2015.05.30 M 7.8 Izu Bonin
- 2015.05.31 M 7.8 Izu Bonin Update #1: triggered earthquakes
- 2015.05.31 M 7.8 Izu Bonin Update #2: Historic Seismicity
- 2015.06.09 M 7.8 Izu Bonin Update #3: seismic wave animations
- 2015.02.25 M 6.3 Japan (Sanriku Coast Update #5)
- 2015.02.21 M 6.7 Japan (Sanriku Coast Update #4)
- 2015.02.20 M 6.7 Japan (Sanriku Coast Update #3)
- 2015.02.16 M 6.7 Japan (Sanriku Coast Update #2)
- 2015.02.16 M 6.7 Japan (Sanriku Coast Update #1)
- 2015.02.16 M 6.7 Japan (Sanriku Coast)
- 2013.10.25 M 7.1 Japan (Honshu)
- 2011.03.11 M 9.0 Japan (Tōhoku-oki) Earthquake
- 2011.03.11 M 9.0 Japan (Tōhoku-oki) Tsunami
- 2011.03.11 M 9.1 Japan (Tōhoku-oki) Decade Remembrance
Japan | Izu-Bonin | Mariana
General Overview
Earthquake Reports
Social Media
#EarthquakeReport for #OTD 2011 M9.1 Tōhoku-oki #Earthquake #Tsunami #Landslides
decade remembrance with some updated maps and web maps
check out the tide gage plots, about 50 of themreport here:https://t.co/n5UI6Co1iv
main report w/tectonic details:https://t.co/0jo9XuHxdE pic.twitter.com/MkEAbQkTXe
— Jason "Jay" R. Patton (@patton_cascadia) March 11, 2021
#EarthquakeReport #OTDearthquake 2011.03.11 M 9.0 Tohoku-oki earthquake and tsunami. #JapanEarthquake
first observed 50+ m slip, fault offset at trench, heatflow from fault-slip friction, triggered outer-rise EQs etc. Many discoveries
MORE here:https://t.co/0jo9XuHxdE pic.twitter.com/6gNFZWitDn
— Jason "Jay" R. Patton (@patton_cascadia) March 11, 2018
- Frisch, W., Meschede, M., Blakey, R., 2011. Plate Tectonics, Springer-Verlag, London, 213 pp.
- Hayes, G., 2018, Slab2 – A Comprehensive Subduction Zone Geometry Model: U.S. Geological Survey data release, https://doi.org/10.5066/F7PV6JNV.
- Holt, W. E., C. Kreemer, A. J. Haines, L. Estey, C. Meertens, G. Blewitt, and D. Lavallee (2005), Project helps constrain continental dynamics and seismic hazards, Eos Trans. AGU, 86(41), 383–387, , https://doi.org/10.1029/2005EO410002. /li>
- Jessee, M.A.N., Hamburger, M. W., Allstadt, K., Wald, D. J., Robeson, S. M., Tanyas, H., et al. (2018). A global empirical model for near-real-time assessment of seismically induced landslides. Journal of Geophysical Research: Earth Surface, 123, 1835–1859. https://doi.org/10.1029/2017JF004494
- Kreemer, C., J. Haines, W. Holt, G. Blewitt, and D. Lavallee (2000), On the determination of a global strain rate model, Geophys. J. Int., 52(10), 765–770.
- Kreemer, C., W. E. Holt, and A. J. Haines (2003), An integrated global model of present-day plate motions and plate boundary deformation, Geophys. J. Int., 154(1), 8–34, , https://doi.org/10.1046/j.1365-246X.2003.01917.x.
- Kreemer, C., G. Blewitt, E.C. Klein, 2014. A geodetic plate motion and Global Strain Rate Model in Geochemistry, Geophysics, Geosystems, v. 15, p. 3849-3889, https://doi.org/10.1002/2014GC005407.
- Meyer, B., Saltus, R., Chulliat, a., 2017. EMAG2: Earth Magnetic Anomaly Grid (2-arc-minute resolution) Version 3. National Centers for Environmental Information, NOAA. Model. https://doi.org/10.7289/V5H70CVX
- Müller, R.D., Sdrolias, M., Gaina, C. and Roest, W.R., 2008, Age spreading rates and spreading asymmetry of the world’s ocean crust in Geochemistry, Geophysics, Geosystems, 9, Q04006, https://doi.org/10.1029/2007GC001743
- Pagani,M. , J. Garcia-Pelaez, R. Gee, K. Johnson, V. Poggi, R. Styron, G. Weatherill, M. Simionato, D. Viganò, L. Danciu, D. Monelli (2018). Global Earthquake Model (GEM) Seismic Hazard Map (version 2018.1 – December 2018), DOI: 10.13117/GEM-GLOBAL-SEISMIC-HAZARD-MAP-2018.1
- Silva, V ., D Amo-Oduro, A Calderon, J Dabbeek, V Despotaki, L Martins, A Rao, M Simionato, D Viganò, C Yepes, A Acevedo, N Horspool, H Crowley, K Jaiswal, M Journeay, M Pittore, 2018. Global Earthquake Model (GEM) Seismic Risk Map (version 2018.1). https://doi.org/10.13117/GEM-GLOBAL-SEISMIC-RISK-MAP-2018.1
- Zhu, J., Baise, L. G., Thompson, E. M., 2017, An Updated Geospatial Liquefaction Model for Global Application, Bulletin of the Seismological Society of America, 107, p 1365-1385, https://doi.org/0.1785/0120160198
- Ammon et al., 2011. A rupture model of the 2011 off the Pacific coast of the Tohoku Earthquake in Earth Planets Space, v. 63, p. 693-696.
- Fujitsu et al., 2011
- Gusman et al., 2012. Source model of the great 2011 Tohoku earthquake estimated from tsunami waveforms and crustal deformation data in Earth and Planetary Science Letters, v. 341-344, p. 234-242.
- Hirose et al., 2011. Outline of the 2011 off the Pacific coast of Tohoku Earthquake (Mw 9.0) Seismicity: foreshocks, mainshock, aftershocks, and induced activity in Earth Planets Space, v. 63, p. 655-658
- Iinuma et al., 2012. Coseismic slip distribution of the 2011 off the Pacific Coast of Tohoku Earthquake (M9.0) refined by means of seafloor geodetic data in Journal of Geophysical Research, v. 117, DOI: 10.1029/2012JB009186
- Ikuta et al., 2012. A small persistent locked area associated with the 2011 Mw9.0 Tohoku-Oki earthquake, deduced from GPS data in Journal of Geophysical Research, v. 117, DOI: 10.1029/2012JB009335
- Ito et al., 2011. Slip distribution of the 2011 off the Pacific coast of Tohoku Earthquake inferred from geodetic data in Earth Planets Space, v. 63, p. 627-630
- Koper et al., 2011. Frequency-dependent rupture process of the 2011 Mw 9.0 Tohoku Earthquake: Comparison of short-period P wave back projection images and broadband seismic rupture models in Earth Planets Space, v. 63, p. 599-602.
- Kosuga et al, 2011. Seismic activity around the northern neighbor of the 2011 off the Pacific coast of Tohoku Earthquake with emphasis on a potentially large aftershock in the area in Earth Planets Space, v. 63, p. 719-723.
- Lay et al., 2011 a. The 2011 Mw 9.0 off the Pacific coast of Tohoku Earthquake: Comparison of deep-water tsunami signals with finite-fault rupture model predictions in Earth Planets Space, v. 63, p. 797-801.
- Lay et al., 2011 b. Possible large near-trench slip during the 2011 Mw 9.0 off the Pacific coast of Tohoku Earthquake in Earth Planets Space, v. 63, p. 687-692.
- Lay et al., 2011 c. Outer trench-slope faulting and the 2011 Mw 9.0 off the Pacific coast of Tohoku Earthquake in Earth Planets Space, v. 63, p. 713-718.
- Lee et al., 2011. Evidence of large scale repeating slip during the 2011 Tohoku‐Oki earthquake in Geophysical Research Letters, v. 38, DOI: 10.1029/2011GL049580.
- Newman et al., 2011. Hidden depths in Nature, v. 474, p. 441-443.
- Nishimura et al., 2011. The 2011 off the Pacific coast of Tohoku Earthquake and its aftershocks observed by GEONET in Earth Planets Space, v. 63, p. 631-636.
- Orzawa et al., 2011. Coseismic and postseismic slip of the 2011 magnitude-9 Tohoku-Oki earthquake in Nature, v. 000, p. 1-4.
- Satake et al., 2013. Time and Space Distribution of Coseismic Slip of the 2011 Tohoku Earthquake as Inferred from Tsunami Waveform Data in Bulletin of the Seismological Society of America, v. 1032, p. 1473-1492.
- Shao et al., 2011. Focal mechanism and slip history of the 2011 Mw 9.1 off the Pacific coast of Tohoku Earthquake, constrained with teleseismic body and surface waves in Earth Planets Space, v. 63, p. 559-564.
- Simons et al., 2011. The 2011 Magnitude 9.0 Tohoku-Oki Earthquake: Mosaicking the Megathrust from Seconds to Centuries in Science, v. 332, p. 1421-1425.
- Terakawa et al., 2013. Changes in seismic activity following the 2011 Tohoku-oki earthquake: Effects of pore fluid pressure in Earth and Planetary Science Letters, v. 365, p. 17-24.
- Toda et al., 2011. Using the 2011 Mw 9.0 off the Pacific coast of Tohoku Earthquake to test the Coulomb stress triggering hypothesis and to calculate faults brought closer to failure in Earth Planets Space, v. 63, p. 725-730.
- Uchida and Matsuzawa, 2011. Coupling coefficient, hierarchical structure, and earthquake cycle for the source area of the 2011 off the Pacific coast of Tohoku earthquake inferred from small repeating earthquake data in Earth Planets Space, v. 63, p. 675-679.
- Wang et al., 2013. The 2011 Mw 9.0 Tohoku Earthquake: Comparison of GPS and Strong-Motion Data in Bulletin of the Seismological Society of America, v. 103, p. 1336-1347.
- Yagi and Fukahata, 2011. Rupture process of the 2011 Tohoku‐oki earthquake and absolute elastic strain release in Geophysical Research Letters, v. 38, DOI: 10.1029/2011GL048701
- Yamazaki et al., 2011. Modeling near‐field tsunami observations to improve finite‐fault slip models for the 11 March 2011 Tohoku earthquake in Geophysical Research Letter,s v. 38, DOI: 10.1029/2011GL049130
- Yomogida et al., 2011. Along-dip segmentation of the 2011 off the Pacific coast of Tohoku Earthquake and comparison with other megathrust earthquakes in Earth Planets Space, v. 63, p. 697-701.
- Yue and Lay, 2013. Source Rupture Models for the Mw 9.0 2011 Tohoku Earthquake from Joint Inversions of High-Rate Geodetic and Seismic Data in Bulletin of the Seismological Society of America, v. 103, p. 1242-1255.
References:
Basic & General References
Specific References
Return to the Earthquake Reports page.
- Sorted by Magnitude
- Sorted by Year
- Sorted by Day of the Year
- Sorted By Region