
I put these together earlier this week for my classes and finally have a moment to write about these earthquakes. The Philippines region has been quite active lately, as it frequently is.
I show below a series of earthquakes from the past ~30 days. These earthquakes occurred in 4 different regions and 3 different tectonic settings. These are probably unrelated to each other, but it is difficult to really know without further analyses.
After I made these posters, there was an earthquake with a magnitude of M 5.8 on the island of Mindanao (I include the USGS link below), possibly associated with the Davao River fault (the closest fault mapped in this region).
Here are the USGS websites for these earthquakes.
- 2017-03-14 05:55 M 5.6 – 48km WNW of Lemito, Indonesia
- 2017-03-31 11:21 M 5.6 – 50km SSE of Tinabogan, Indonesia
- 2017-04-04 12:58 M 5.1 – 5km W of Ilijan, Philippines
- 2017-04-08 07:08 M 5.5 – 1km NE of Bagalangit, Philippines
- 2017-04-08 07:09 M 5.9 – 1km SSW of Talaga, Philippines
- 2017-04-10 00:43 M 5.6 – 52km NE of Cabodiongan, Philippines
- 2017-04-10 10:38 M 5.6 – 137km ESE of Pondaguitan, Philippines
- 2017-04-11 14:42 M 5.7 – 124km SE of Pondaguitan, Philippines
- 2017-04-11 21:21 M 5.8 – 7km N of Osias, Philippines
I took a look at the seismicity from the past century. Here are Google Earth kml files from the USGS website for earthquakes from 1917-2017 with magnitudes M ≥ 7.0 and M ≥ 7.5.
Below is my interpretive poster for this earthquake.
I plot the seismicity from the past month, with color representing depth and diameter representing magnitude (see legend). I include the USGS epicenters for earthquakes from 1917-2017 with magnitudes M ≥ 7.5.
- A review of the basic base map variations and data that I use for the interpretive posters can be found on the Earthquake Reports page. I have improved these posters over time and some of this background information applies to the older posters.
- Some basic fundamentals of earthquake geology and plate tectonics can be found on the Earthquake Plate Tectonic Fundamentals page.
- I placed a moment tensor / focal mechanism legend on the poster. There is more material from the USGS web sites about moment tensors and focal mechanisms (the beach ball symbols). Both moment tensors and focal mechanisms are solutions to seismologic data that reveal two possible interpretations for fault orientation and sense of motion. One must use other information, like the regional tectonics, to interpret which of the two possibilities is more likely.
- I also include the shaking intensity contours on the map. These use the Modified Mercalli Intensity Scale (MMI; see the legend on the map). This is based upon a computer model estimate of ground motions, different from the “Did You Feel It?” estimate of ground motions that is actually based on real observations. The MMI is a qualitative measure of shaking intensity. More on the MMI scale can be found here and here. This is based upon a computer model estimate of ground motions, different from the “Did You Feel It?” estimate of ground motions that is actually based on real observations.
- I include the slab contours plotted (Hayes et al., 2012), which are contours that represent the depth to the subduction zone fault. These are mostly based upon seismicity. The depths of the earthquakes have considerable error and do not all occur along the subduction zone faults, so these slab contours are simply the best estimate for the location of the fault.
- In the upper left corner is a figure from Hall, 2011. This shows the plate tectonic configuration in the equatorial Pacific. Note how the upper panel shows a west dipping slab on the east side of the Philippines. Note the contrast in the center panel (Halmahera), where the eastern fault is dipping to the east (westward vergent) and the western fault is dipping to the west (eastward vergent). This region near Halmahera forms the Molucca Strait, one of the most tectonically active areas in this region.
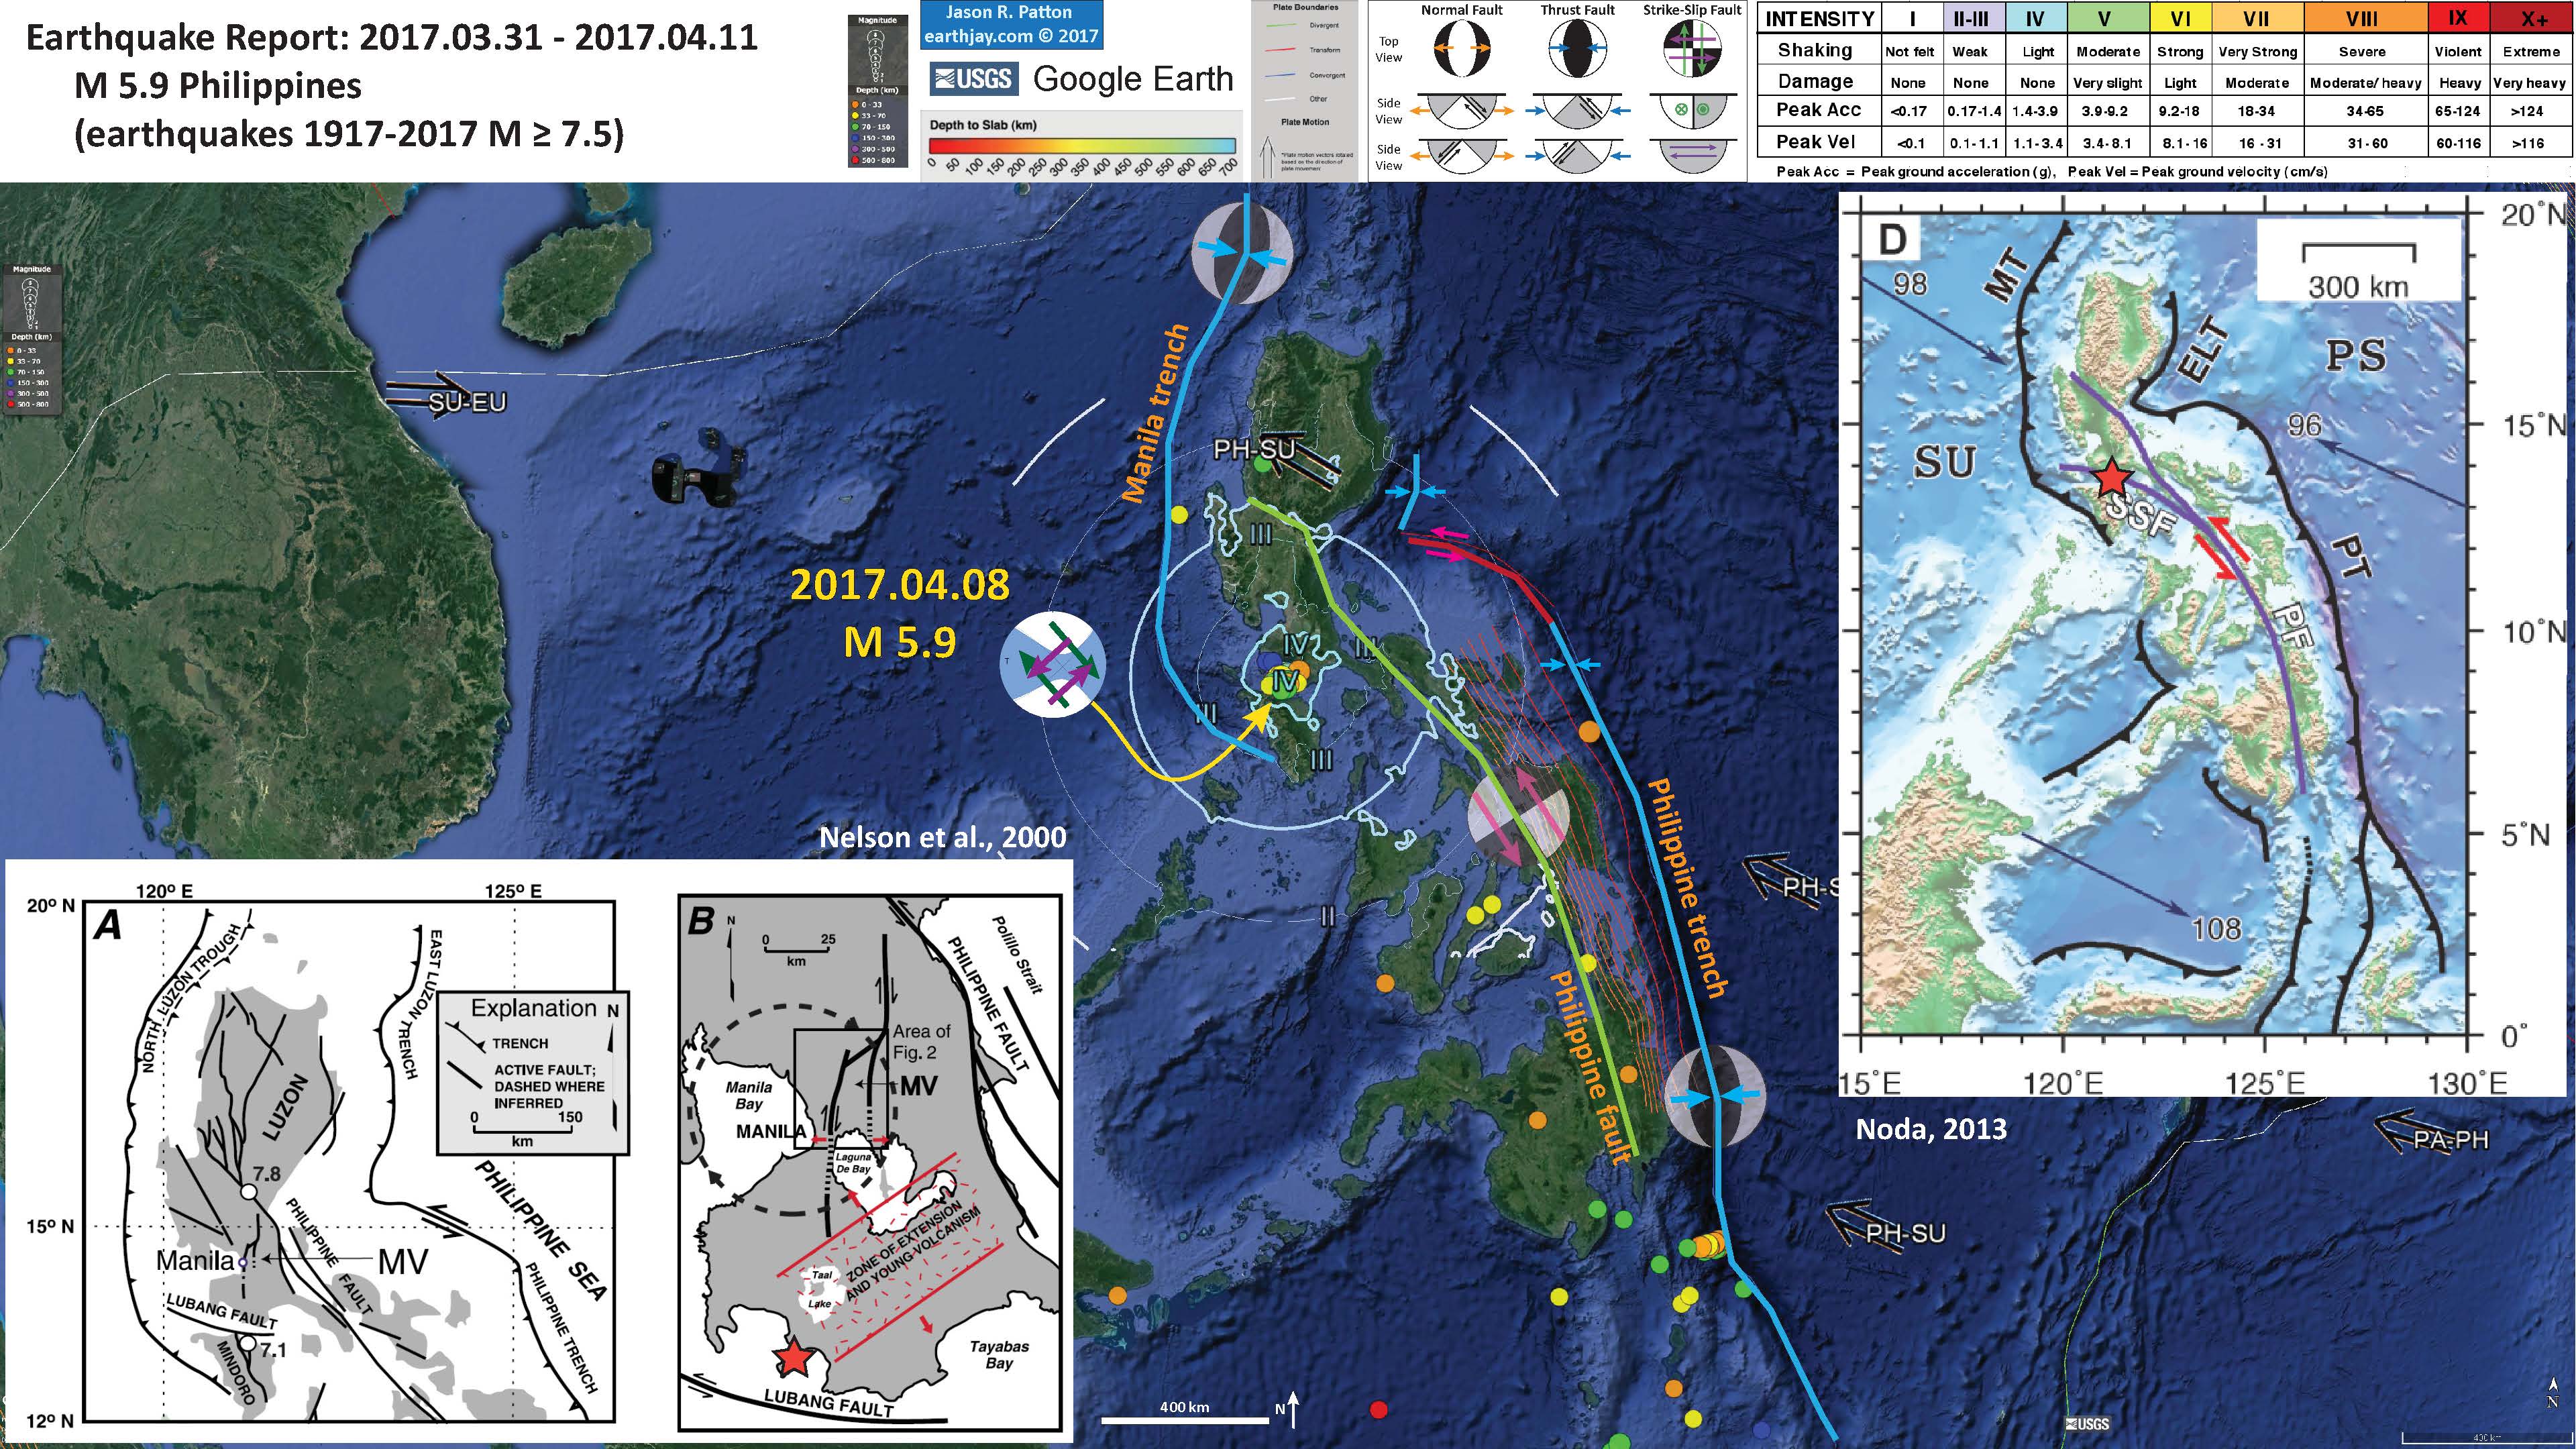
- In the upper right corner is a map showing the regional faults from Noda (2013). The Philippine and Sibuyan Sea faults are “forearc sliver” faults that accommodate oblique convergence between the Philippine Sea and Sunda plates. The M 5.9 epicenter is designated by a red star. The Manila trench (MT; northernmost east-dipping subduction zone) and the Philippine trench (PT; easternmost west-dipping subduction zone) are major players here. The high velocity plate motion vectors (in mm/yr) show the relative plate motions and the possible source of hi frequency seismicity.
- In the lower left corner I include a map showing the seismicity and tectonic plate boundary faults for this region (Smoczyk et al., 2013). Earthquakes are plotted with color representing depth and diameter representing magnitude (see legend).
I include some inset figures in the poster.
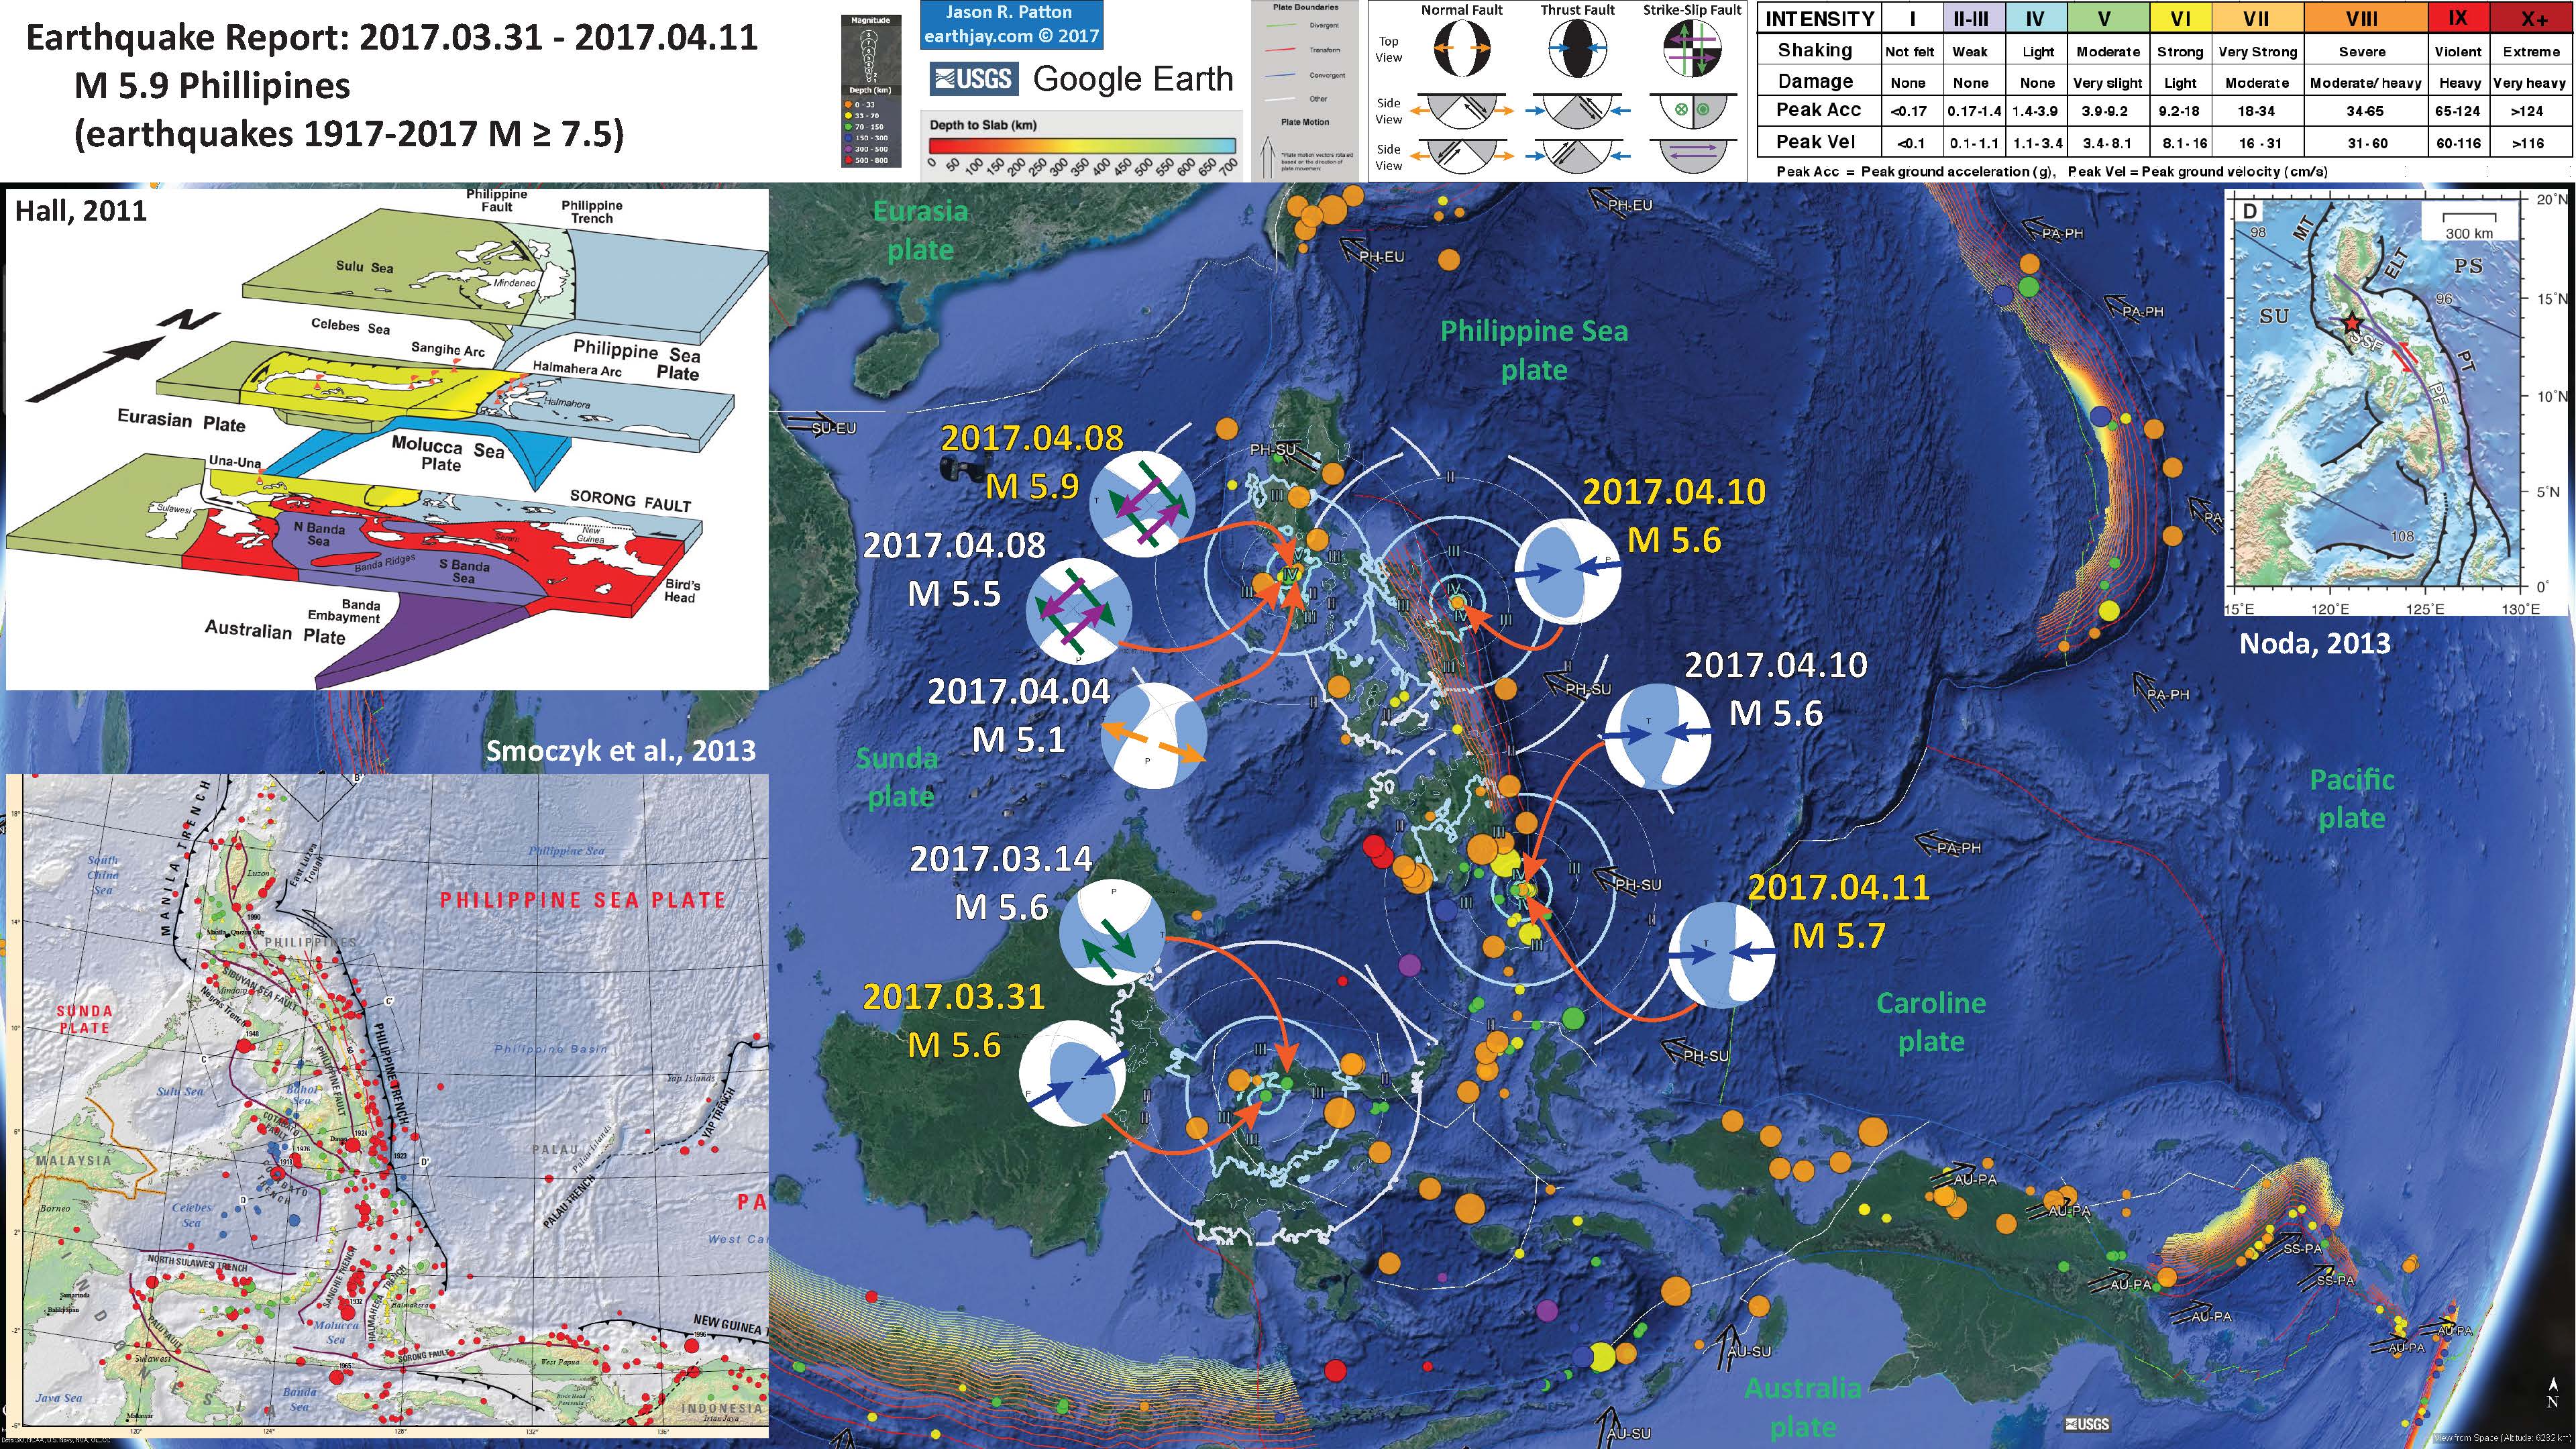
- In the above poster, I choose 4 earthquakes for which to plot the MMI intensity.
- The easternmost two are earthquakes related to the subduction of the Philippine Sea plate.
- The northwesternmost earthquake series (largest M = 5.9) is interesting and mysterious. There is a left-lateral forearc sliver fault (Philippine fault) that parallels the Philippine trench. Internal deformation in the upper plate is accommodated by a complicated series of other strike-slip faults. In the region near Manila, there is a north-south striking right-lateral Mirikina Valley fault system. The MV fault trends south from Manila into the region of the M 5.9 earthquake. This fault seems to terminate in a northeast-southwest trending zone of “extension and young volcanism” (Nelson et al., 2000). Further to the south is an east-west striking left-lateral Lubang fault. This may be an extension of the Sibuyan Sea fault (Noda, 2013), a splay of the Philippine fault. If we look at the moment tensor for the M 5.5 and 5.9 earthquakes, the nodal planes suggest either NE striking left-lateral or NW striking right-lateral motion. This does not fit the orientation nor sense of motion for any of the mapped faults in the region. It is possible that these earthquakes are related to the extensional rifting instead. The moment tensor for the M 5.1 earthquake here shows an extensional beach ball. The orientation is not completely correct based upon the Nelson et al. (2000) figure, but there are no faults shown on their map.
- The southwestern earthquakes from March (both M 5.6) are also interesting. The epicenters show locations on north Sulawesi, part of Indonesia. There is a NW striking left-lateral strike-slip faults mapped to the west and east of these earthquakes. However, the moment tensor shows that this would be a right-lateral fault in that orientation. The NW striking reverse fault is also equally challenging to interpret. Needless to say, this is a tectonically complicated region.
Below is the interpretive poster for the 08 April 2017 M 5.9 earthquake.
- Here is a video shot by some divers who were diving at Anilao Camper, just a few kilometers from the epicenter. This was posted on facebook here by Jan Paul Rodriguez.
- This is the low-angle oblique view of the region (Hall, 2011).
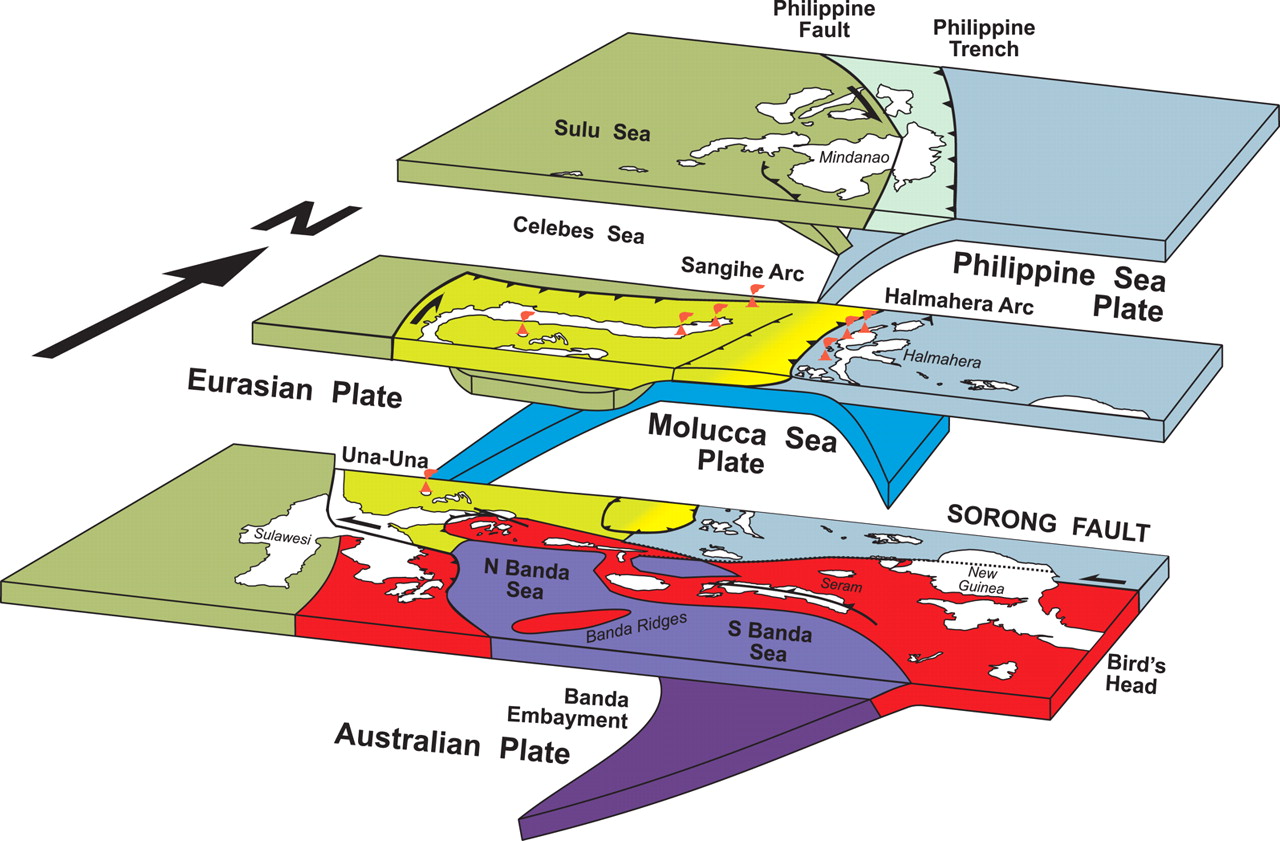
3D cartoon of plate boundaries in the Molucca Sea region modified from Hall et al. (1995). Although seismicity identifies a number of plates there are no continuous boundaries, and the Cotobato, North Sulawesi and Philippine Trenches are all intraplate features. The apparent distinction between different crust types, such as Australian continental crust and oceanic crust of the Philippine and Molucca Sea, is partly a boundary inactive since the Early Miocene (east Sulawesi) and partly a younger but now probably inactive boundary of the Sorong Fault. The upper crust of this entire region is deforming in a much more continuous way than suggested by this cartoon.
- Here is the fault map for the region on the Island of Luzon (where Manila is located) from Nelson et al. (2000). The panel on the right (B) shows the Marikina Valley fault system (MV) and the Lubang fault. The MV is a right-lateral strike slip fault and the Lubang fault is a left-lateral strike-slip fault.
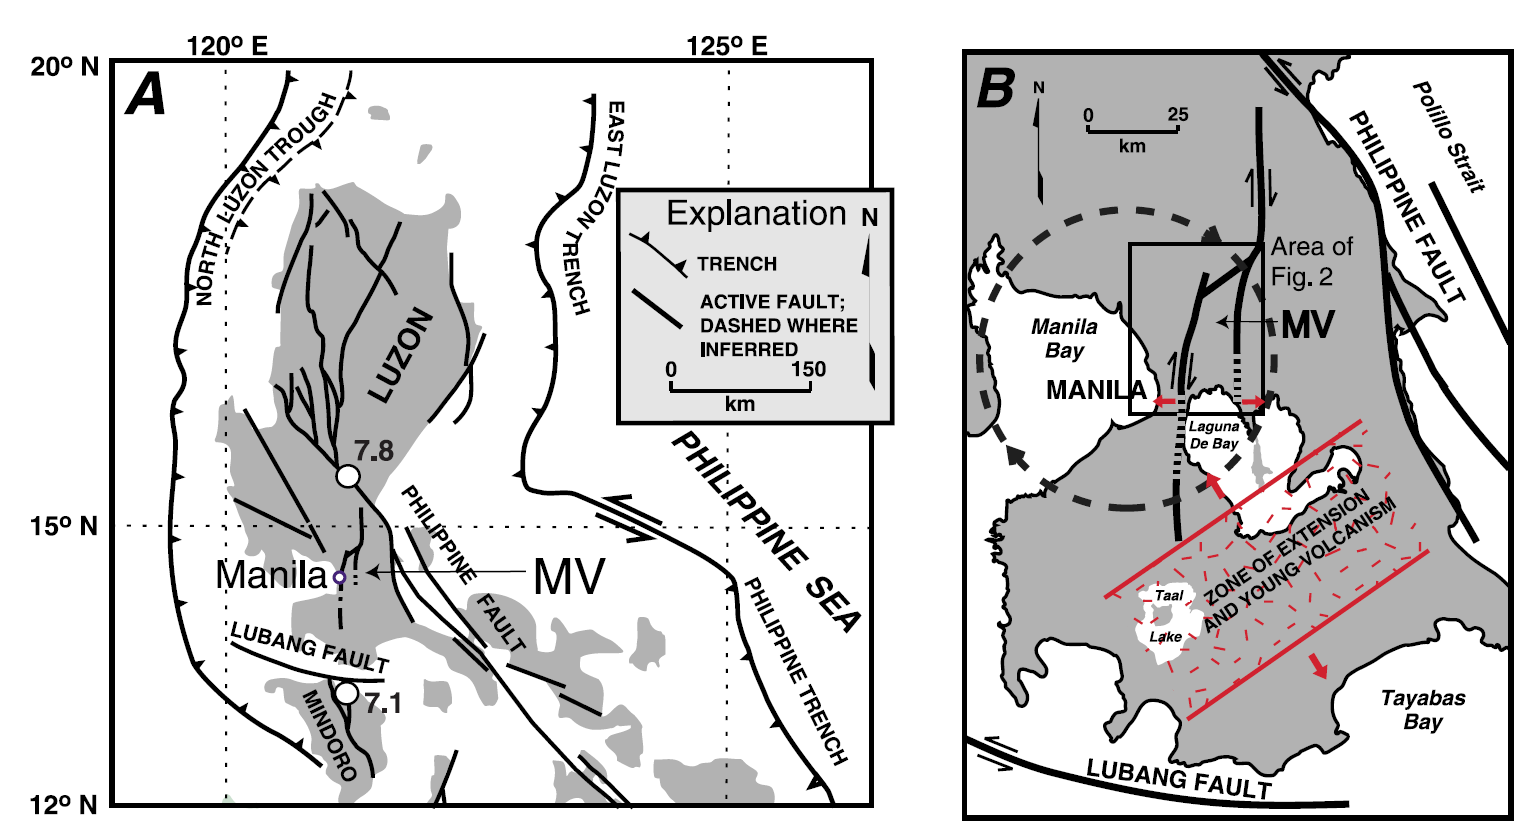
Tectonic setting of the Marikina Valley fault system (MV) in central Luzon, the Philippines. Diagram A shows subduction zone trenches by barbed lines, other faults with high rates of Quaternary activity by heavy black lines. White dots show locations of recent earthquakes on the Philippine fault in Luzon (M 7.8; 1990) and the Aglubang River fault in Mindoro (M 7.1; 1994). Diagram B shows how the Marikina Valley pull-apart basin (MV) may have been formed through extension caused by clockwise rotation (dashed circle) and shearing of central Luzon, which is caught between two active left-lateral strike-slip faults—the Philippine fault (Nakata et al., 1977; Barrier et al., 1991; Ringenbach et al., 1993; Aurelio et al., 1993) and the Lubang fault. A zone of extension and young volcanism south of the fault system has also influenced the structural development of the valley (Fo¨rster et al., 1990; Defant et al., 1988).
- Here is the map from Noda (2013) that shows various strike slip faults associated with subduction zones.
Modern examples of trench-linked strike-slip faults. (A) The Median Tectonic Line (MTL) active fault system in southwestern Japan, related to oblique subduction of the Philippine Sea Plate (PS) along the Nankai Trough (NT). (B) The Great Sumatra Fault system (GSF) along the Java–Sumatra Trench (JST). (C) Strike-slip faults in Alaska. Fault names: DF, Denali; BRF, Boarder Ranges; CSEF, Chugach St. Elias; FF, Fairweather; TF, Transition. (D) The Philippine Fault system (PF). Abbreviations: SSF, Sibuyan Sea Fault; MT, Manila Trench; PT, Philippine Trench; ELT, East Luzon Trough. Plate names: AM, Amur; OK, Okhotsk; PS, Philippine Sea; AU, Australian; SU, Sundaland; NA, North American; PA, Pacific; YMC, Yukutat microcontinent. Black and purple lines are subduction zones and trench-linked strike-slip faults, respectively. All maps were drawn using SRTM and GEBCO with plate boundary data [30]. Blue arrows indicate the direction and velocity of relative plate motion (mm yr-1) based on [31].
The USGS Maps and Cross-Sections
- Here is the map from Smocyk et al., 2013, followed by the legend. The entire poster is here (92 MB pdf).
- Below are two cross sections that show the subduction zone seismicity, followed by the legend. The location of these cross sections are labeled on the map above.
- This map shows the seismic hazard for this region. The color represents the likelihood of any region experiencing ground shaking of a particular magnitude. The scale is “Peak Ground Acceleration.” Units are m/s^2. Purple represents gravitational acceleration of 1 g, gravity at Earth’s surface. Note how most of the earthquakes were in the region of higher likely ground shaking, except for the Sulawesi earthquakes.


- In January of this year, there was an M 7.3 earthquake in the Celebes Sea south of the Philippines. Below is my interpretive map for that earthquake. I also present the same poster with 1917-2017 seismicity for earthquakes M ≥ 6.5. Here is my earthquake report for this M 7.3 earthquake. I include more background information for the Molucca Strait region on this page.
- 2022.07.27 M 7.0 Philippines (poster)
- 2021.08.11 M 7.1 Philippines (poster)
- 2019.11.14 M 7.1 Halmahera
- 2019.07.14 M 7.3 Halmahera
- 2018.12.29 M 7.0 Philippines
- 2017.12.08 M 6.5 Caroline Ridge
- 2017.12.09 M 6.5 Caroline Ridge Update #1
- 2017.08.11 M 6.2 Philippines
- 2017.04.28 M 6.9 Philippines
- 2017.04.08 M 5.9 Philippines
- 2017.01.10 M 7.3 Celebes Sea
- 2016.07.29 M 7.7 Mariana
- 2015.03.17 M 6.2 Molucca Sea
- 2014.11.26 M 6.8 Molucca Sea
- 2014.11.21 M 6.5 Molucca Sea
- 2014.11.15 M 7.1 Molucca Sea
Philippines | Western Pacific
Earthquake Reports
References:
- Frisch, W., Meschede, M., Blakey, R., 2011. Plate Tectonics, Springer-Verlag, London, 213 pp.
- Hayes, G., 2018, Slab2 – A Comprehensive Subduction Zone Geometry Model: U.S. Geological Survey data release, https://doi.org/10.5066/F7PV6JNV.
- Holt, W. E., C. Kreemer, A. J. Haines, L. Estey, C. Meertens, G. Blewitt, and D. Lavallee (2005), Project helps constrain continental dynamics and seismic hazards, Eos Trans. AGU, 86(41), 383–387, , https://doi.org/10.1029/2005EO410002. /li>
- Jessee, M.A.N., Hamburger, M. W., Allstadt, K., Wald, D. J., Robeson, S. M., Tanyas, H., et al. (2018). A global empirical model for near-real-time assessment of seismically induced landslides. Journal of Geophysical Research: Earth Surface, 123, 1835–1859. https://doi.org/10.1029/2017JF004494
- Kreemer, C., J. Haines, W. Holt, G. Blewitt, and D. Lavallee (2000), On the determination of a global strain rate model, Geophys. J. Int., 52(10), 765–770.
- Kreemer, C., W. E. Holt, and A. J. Haines (2003), An integrated global model of present-day plate motions and plate boundary deformation, Geophys. J. Int., 154(1), 8–34, , https://doi.org/10.1046/j.1365-246X.2003.01917.x.
- Kreemer, C., G. Blewitt, E.C. Klein, 2014. A geodetic plate motion and Global Strain Rate Model in Geochemistry, Geophysics, Geosystems, v. 15, p. 3849-3889, https://doi.org/10.1002/2014GC005407.
- Meyer, B., Saltus, R., Chulliat, a., 2017. EMAG2: Earth Magnetic Anomaly Grid (2-arc-minute resolution) Version 3. National Centers for Environmental Information, NOAA. Model. https://doi.org/10.7289/V5H70CVX
- Müller, R.D., Sdrolias, M., Gaina, C. and Roest, W.R., 2008, Age spreading rates and spreading asymmetry of the world’s ocean crust in Geochemistry, Geophysics, Geosystems, 9, Q04006, https://doi.org/10.1029/2007GC001743
- Pagani,M. , J. Garcia-Pelaez, R. Gee, K. Johnson, V. Poggi, R. Styron, G. Weatherill, M. Simionato, D. Viganò, L. Danciu, D. Monelli (2018). Global Earthquake Model (GEM) Seismic Hazard Map (version 2018.1 – December 2018), DOI: 10.13117/GEM-GLOBAL-SEISMIC-HAZARD-MAP-2018.1
- Silva, V ., D Amo-Oduro, A Calderon, J Dabbeek, V Despotaki, L Martins, A Rao, M Simionato, D Viganò, C Yepes, A Acevedo, N Horspool, H Crowley, K Jaiswal, M Journeay, M Pittore, 2018. Global Earthquake Model (GEM) Seismic Risk Map (version 2018.1). https://doi.org/10.13117/GEM-GLOBAL-SEISMIC-RISK-MAP-2018.1
- Zhu, J., Baise, L. G., Thompson, E. M., 2017, An Updated Geospatial Liquefaction Model for Global Application, Bulletin of the Seismological Society of America, 107, p 1365-1385, https://doi.org/0.1785/0120160198
- Bock et al., 2003. Crustal motion in Indonesia from Global Positioning System measurements in JGR, v./ 108, no. B8, 2367, doi:10.1029/2001JB000324
- Hall, R., 2011. Australia–SE Asia collision: plate tectonics and crustal flow in Hall, R., Cottam, M. A. &Wilson, M. E. J. (eds) The SE Asian Gateway: History and Tectonics of the Australia–Asia Collision. Geological Society, London, Special Publications, 355, 75–109.
- Hayes, G.P., Wald, D.J., and Johnson, R.L., 2012. Slab1.0: A three-dimensional model of global subduction zone geometries in, J. Geophys. Res., 117, B01302, doi:10.1029/2011JB008524
- McCaffrey, R., Silver, E.A., and Raitt, R.W., 1980. Crustal Structure of the Molucca Sea Collision Zone, Indonesia in The Tectonic and Geologic Evolution of Southeast Asian Seas and Islands-Geophysical Monograph 23, p. 161-177.
- Nelson, A.R., Personius, S.F., Rimando, R.E., Punongbayan, R.S., Tungol, N, Mirabueno, H., and Rasdas, A., 2000. Multiple Large Earthquakes in the Past 1500 Years on a Fault in Metropolitan Manila, the Philippines in BSSA vol. 90, p. 73-85.
- Noda, A., 2013. Strike-Slip Basin – Its Configuration and Sedimentary Facies in Mechanism of Sedimentary Basin Formation – Multidisciplinary Approach on Active Plate Margins http://www.intechopen.com/books/mechanism-of-sedimentarybasin-formation-multidisciplinary-approach-on-active-plate-margins http://dx.doi.org/10.5772/56593
- Smoczyk, G.M., Hayes, G.P., Hamburger, M.W., Benz, H.M., Villaseñor, Antonio, and Furlong, K.P., 2013. Seismicity of the Earth 1900–2012 Philippine Sea plate and vicinity: U.S. Geological Survey Open-File Report 2010–1083-M, 1 sheet, scale 1:10,000,000.
- Waltham et al., 2008. Basin formation by volcanic arc loading in GSA Special Papers 2008, v. 436, p. 11-26.
- Zahirovic et al., 2014. The Cretaceous and Cenozoic tectonic evolution of Southeast Asia in Solid Earth, v. 5, p. 227-273, doi:10.5194/se-5-227-2014.
Basic & General References
Specific References
Return to the Earthquake Reports page.
- Sorted by Magnitude
- Sorted by Year
- Sorted by Day of the Year
- Sorted By Region
The figure is very great!
Could u tell me these figure was made by GMT?
I use Google Earth and then export the map to Adobe Illustrator.