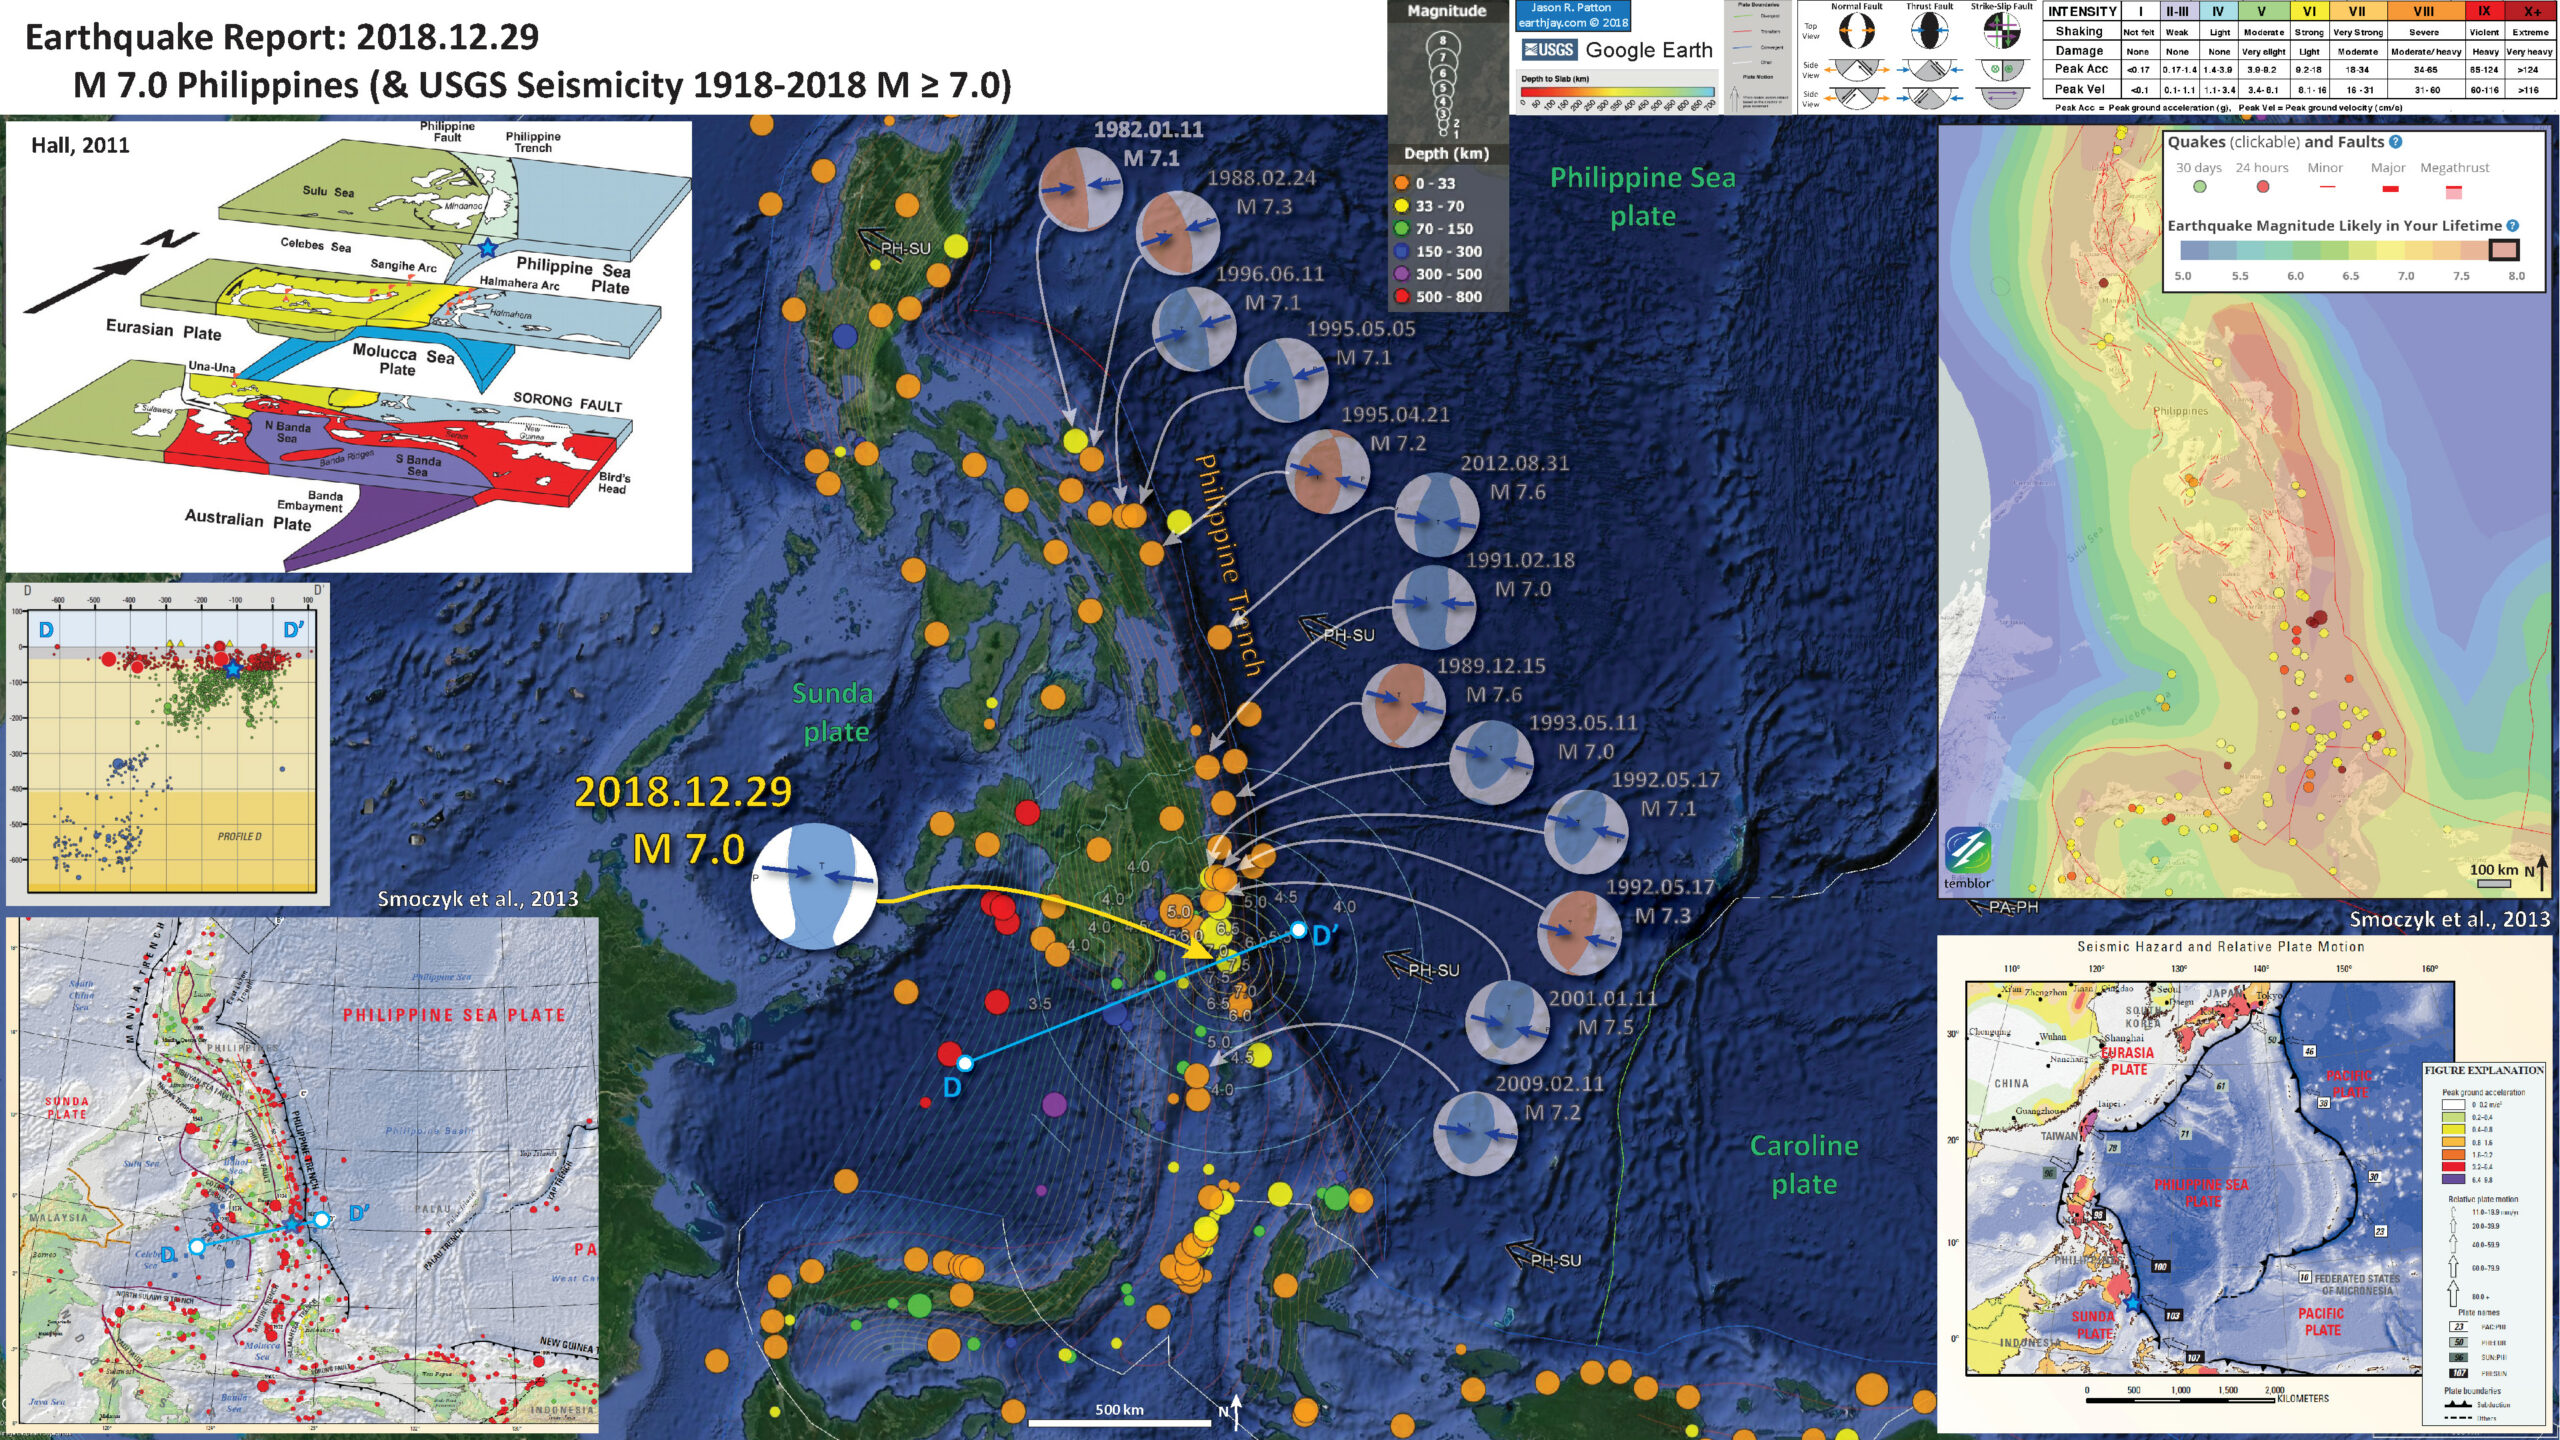
Earlier there was an earthquake in the Philippines. This magnitude M = 7.0 earthquake is related to the subduction zone that forms the Philippine trench (where the Philippine Sea plate subducts beneath the Sunda plate). Here is the USGS website for this earthquake.
The earthquake was quite deep, which makes it less likely to cause damage to people and their belongings (e.g. houses and roads) and also less likely that the earthquake will trigger a trans-oceanic tsunami. There may be a small tsunami in the region, but this is also not very likely.
There have been many large earthquakes in this part of the subduction zone in the 20th and 21st centuries. Based on the historic pattern, it is possible that there may be another earthquake of similar magnitude in the near to distant future (within a year or two). It is also possible that there may be a larger magnitude earthquake.
Look at the pair of earthquakes that occurred on 17 May 2017. The M = 7.1 earthquake preceded the M = 7.3 earthquake by less than an hour. While, the 1995.05.05 M = 7.1 and 1996.06.11 M = 7.1 earthquakes happened about a year from each other.
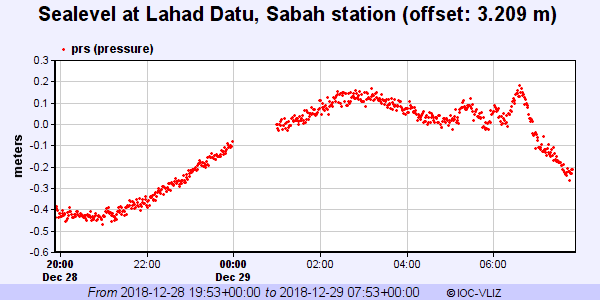
There may have been a small tsunami at Lahad Datu, Sabah (~1,000 km to the west of the earthquake, shown as a yellow square on the poster below). The earthquake happened at about 03:39:09 (UTC) and the plot below uses this same time reference.
The wave begins at around 05:00. A rough estimate using the shallow water equation and an average water depth (Celebes Sea) suggests that the wave might have traveled 712 km/hr (so this 5:00 arrival appears close to the time it might take to get there).
Here are the tidal data:
Below is my interpretive poster for this earthquake
I plot the seismicity from the past month, with color representing depth and diameter representing magnitude (see legend). I include earthquake epicenters from 1918-2018 with magnitudes M ≥ 7.0 in one version.
I plot the USGS fault plane solutions (moment tensors in blue and focal mechanisms in orange), possibly in addition to some relevant historic earthquakes.
- I placed a moment tensor / focal mechanism legend on the poster. There is more material from the USGS web sites about moment tensors and focal mechanisms (the beach ball symbols). Both moment tensors and focal mechanisms are solutions to seismologic data that reveal two possible interpretations for fault orientation and sense of motion. One must use other information, like the regional tectonics, to interpret which of the two possibilities is more likely.
- I also include the shaking intensity contours on the map. These use the Modified Mercalli Intensity Scale (MMI; see the legend on the map). This is based upon a computer model estimate of ground motions, different from the “Did You Feel It?” estimate of ground motions that is actually based on real observations. The MMI is a qualitative measure of shaking intensity. More on the MMI scale can be found here and here. This is based upon a computer model estimate of ground motions, different from the “Did You Feel It?” estimate of ground motions that is actually based on real observations.
- I include the slab 2.0 contours plotted (Hayes, 2018), which are contours that represent the depth to the subduction zone fault. These are mostly based upon seismicity. The depths of the earthquakes have considerable error and do not all occur along the subduction zone faults, so these slab contours are simply the best estimate for the location of the fault.li>
- In the lower left corner is a map from Smoczyk et al. (2013) that shows historic seismicity and the major plate boundaries. I place a blue star in the location of today’s M = 7.0 earthquake.
- Above this map is a cross section showing seismicity associated with the downgoing Philippine sea plate. The location of this cross section D-D’ is shown on the main map as a cyan line. The 3-D location of the earthquake (hypocenter) is shown on the cross section also.
- In the upper left corner is a figure from Hall, 2011. This shows the plate tectonic configuration in the equatorial Pacific. Note how the upper panel shows a west dipping slab on the east side of the Philippines. Note the contrast in the center panel (Halmahera), where the eastern fault is dipping to the east (westward vergent) and the western fault is dipping to the west (eastward vergent). This region near Halmahera forms the Molucca Strait, one of the most tectonically active areas in this region.
- In the lower right corner is a seismic hazard map from Smoczyk et al. (2013) that shows how this region has a high seismic hazard.
- In the upper right corner is the seismic hazard map from Temblor.net. Temblor.net uses the Global Earth Activity Rate (GEAR) model to provide estimates of seismic hazard at a global to local scale (Bird et al., 2015). GEAR blends quakes during the past 41 years with strain of the Earth’s crust as measured using Global Positioning System (GPS) observations. The model shows that this M = 7.0 earthquake (the largest red dot) happened in a region that may experience an earthquake with a magnitude range of 7.75 < M < 8.0.
I include some inset figures. Some of the same figures are located in different places on the larger scale map below.
- Here is the map with a month’s seismicity plotted.

- Here is the map with a century’s seismicity plotted.

Some Relevant Discussion and Figures
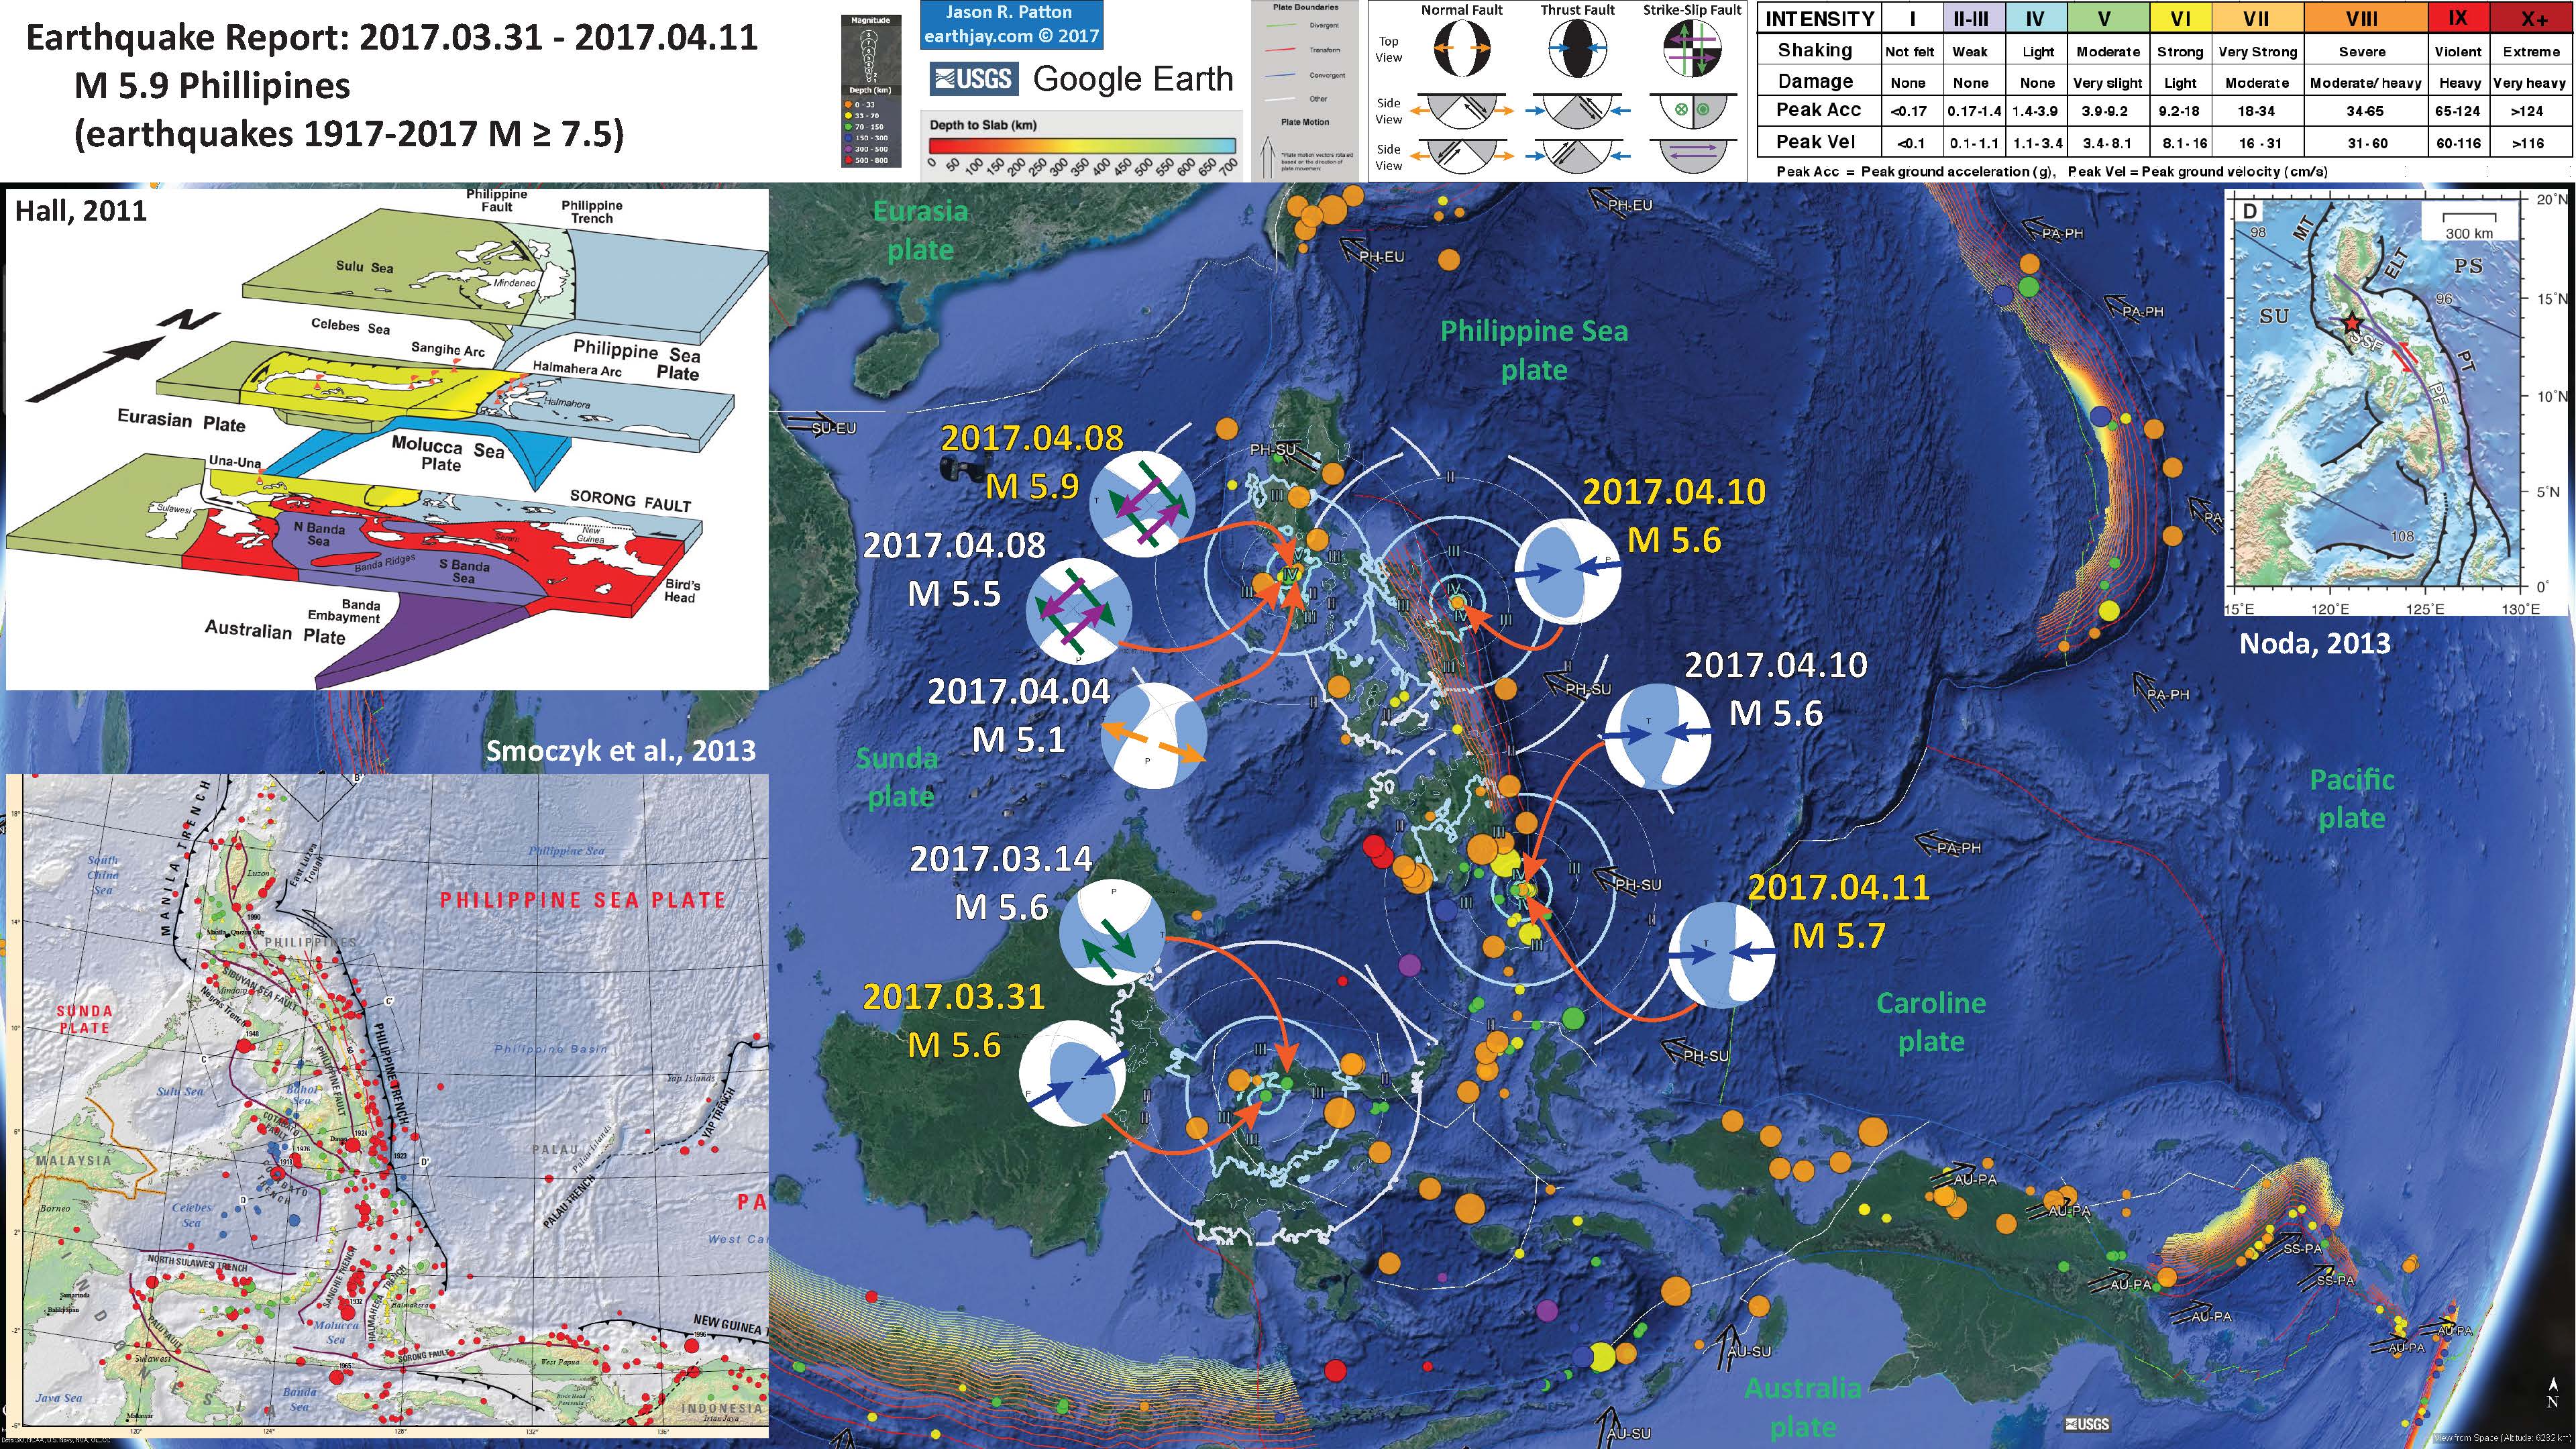
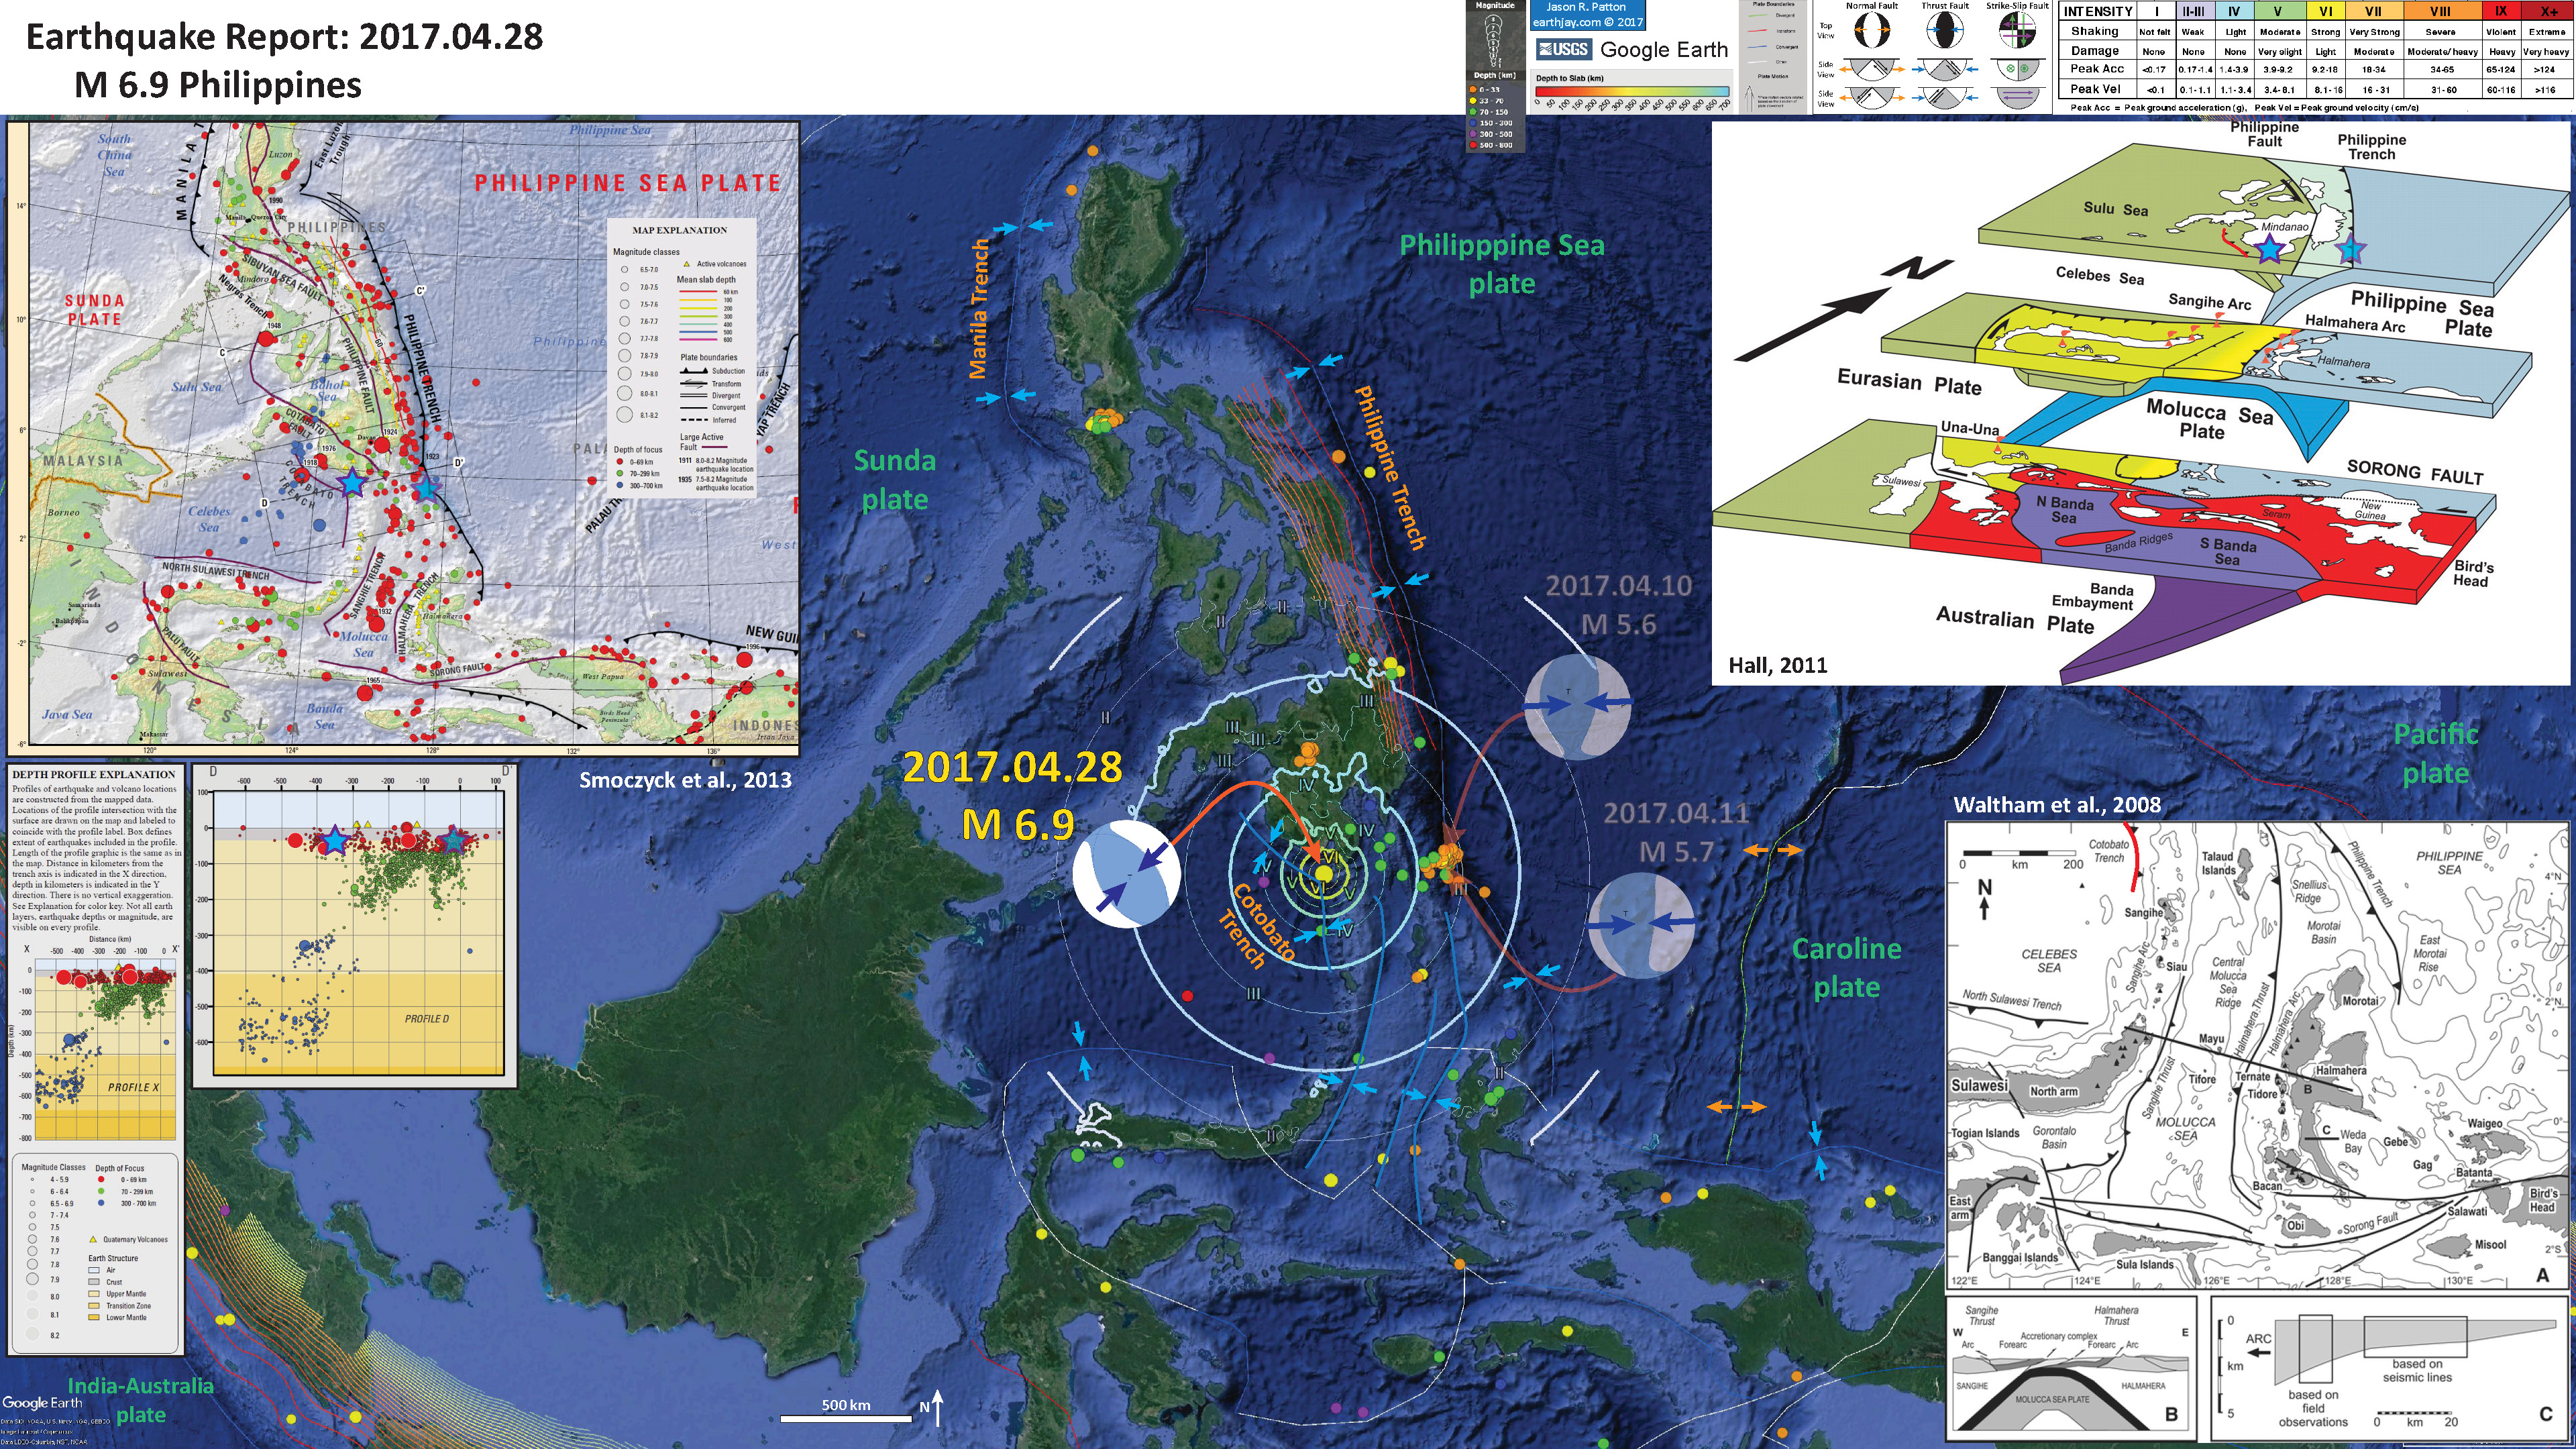
- There was a series of earthquakes in 2017 that spanned the region further to the north, all in the mid M = 5 magnitude range. Here is my earthquake report for that sequence (and a much larger M = 6.9 earthquake later in the year). Below are the posters from these reports.
- Here is a map that shows a simplified version of the subduction zones in the region (Galgana et al., 2007).

Physical map of the Philippines, showing topography and bathymetry. The two opposing subduction zones (the Manila Trench and the Philippine Trench/East Luzon Trough), major plates (SUND and PHSP) and the major Philippine Fault System with splays in Luzon (yellow lines) are mapped (basemap derived from the UNAVCO Jules Verne Navigator).
- This is the low-angle oblique view of the region (Hall, 2011).
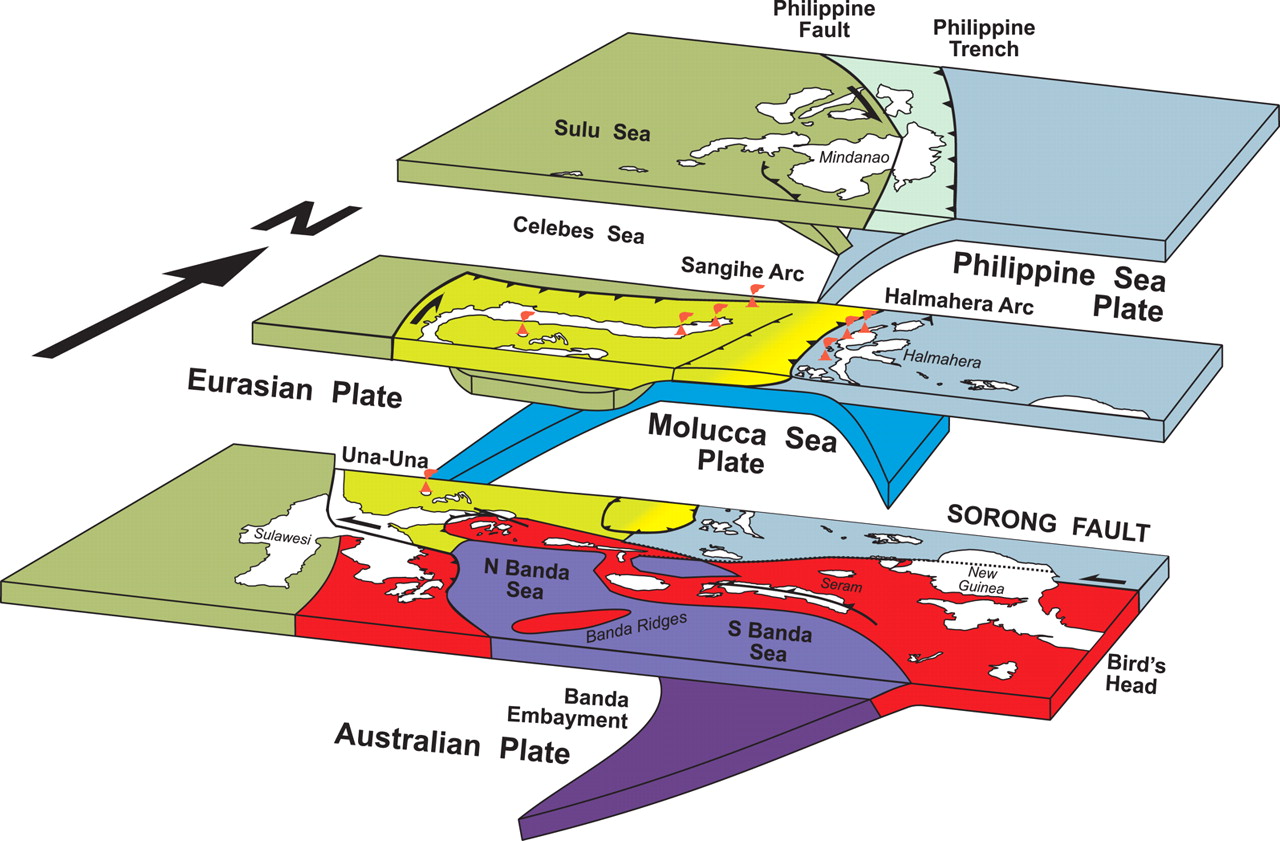
3D cartoon of plate boundaries in the Molucca Sea region modified from Hall et al. (1995). Although seismicity identifies a number of plates there are no continuous boundaries, and the Cotobato, North Sulawesi and Philippine Trenches are all intraplate features. The apparent distinction between different crust types, such as Australian continental crust and oceanic crust of the Philippine and Molucca Sea, is partly a boundary inactive since the Early Miocene (east Sulawesi) and partly a younger but now probably inactive boundary of the Sorong Fault. The upper crust of this entire region is deforming in a much more continuous way than suggested by this cartoon.
- This is smaller scale tectonic map of the region (Zahirovic et al., 2014).

Regional tectonic setting with plate boundaries (MORs/transforms = black, subduction zones = teethed red) from Bird (2003) and ophiolite belts representing sutures modified from Hutchison (1975) and Baldwin et al. (2012). West Sulawesi basalts are from Polvé et al. (1997), fracture zones are from Matthews et al. (2011) and basin outlines are from Hearn et al. (2003). ANI – Andaman and Nicobar Islands, BD– Billiton Depression, Ba – Bangka Island, BI – Belitung (Billiton) Island, BiS – Bismarck Sea, BP – Benham Plateau, CaR – Caroline Ridge, CS – Celebes Sea, DG– Dangerous Grounds, EauR – Eauripik Ridge, FIN – Finisterre Terrane, GoT – Gulf of Thailand, GR– Gagua Ridge, HAL– Halmahera, HBa – Huatung Basin, KB–Ketungau Basin, KP – Khorat Platform, KT – Kiilsgaard Trough, LS – Luconia Shoals, MacB – Macclesfield Bank, ManTr – Manus Trench, MaTr – Mariana Trench, MB– Melawi Basin, MDB– Minami Daito Basin, MG– Mangkalihat, MIN – Mindoro, MN– Mawgyi Nappe, MoS – Molucca Sea, MS– Makassar Straits, MTr – Mussau Trench, NGTr – New Guinea Trench, NI – Natuna Islands, ODR– Oki Daito Ridge, OJP –Ontong Java Plateau, OSF – Owen Stanley Fault, PAL – Palawan, PhF – Philippine Fault, PT – Paternoster Platform, PTr – Palau Trench, PVB – Parece Vela Basin, RB – Reed Bank, RMF– Ramu-Markham Fault, RRF – Red River fault, SEM– Semitau, ShB – Shikoku Basin, Sol. Sea – Solomon Sea, SPK – Sepik, SPT – abah–Palawan Trough, STr – Sorol Trough, Sul – Sulawesi, SuS – Sulu Sea, TPAA– Torricelli–Prince Alexander Arc, WB–West Burma, WCT–W Caroline Trough, YTr –Yap Trough.
- This is a map and series of cross sections showing subducting plates in blue (Zahirovic et al., 2014). The cross sections are based upon seismic wave tomography, which is similar to CT scans (Computed Tomography of X-Rays). These two processes use the same general methods to investigate the 3-dimensional views of internal structures (bodies vs. the Earth). More can be found in their paper, but basically, the blue regions represent areas that have higher seismic velocity. Oceanic lithosphere has higher seismic velocities than the surrounding mantle. So, the subducting oceanic slabs show up as blue. The corss section G-G’ is at about the same latitude as the M = 7.0 earthquake. Note that the Philippine sea plate subducting at the Philippine trench (dipping to the west/left) is evident, while the slab associated with the Cotobato trench does not appear visible. Compare this with the seismicity cross section from Smoczyck et al. (2013), where the Cotobato trench seismicity is much more shallow than the Philippine trench.

Vertical sections from MIT-P (Li et al., 2008) and GyPSuM-S (Simmons et al., 2009) seismic tomography models along profiles A to E (magenta lines). The first-order differences between the P- and S-wave models is that the amplitude of the positive seismic velocity anomalies significantly diminishes away from continental coverage (e.g., dashed lines in profiles A and B). A depth slice at 746 km from MIT-P isprovided for reference with super-imposed present-day coastlines and plate boundaries. Interpreted slab sources are labeled: GI-BA= Greater India–Neo-Tethyan back-arc slab, M/N-T – Meso- and Neo-Tethyan slabs, W-S –Woyla–Sunda slabs, S – Sunda slab, PSCS – proto-South China Sea slab, PAC – Pacific slab, PMOL– proto-Molucca slab, PSOL – proto-Solomon slab, CS – Caroline slab, PSP – Philippine Sea Plate slab, S-C = Sulu–Celebes slabs.
- However, here is a figure that shows isosurfaces from their tomography models (Zahirovic et al., 2014). This shows what may be slabs related to the Cotobato trench (western part of G-G’ cross section). These slabs show up better on the lower figure.

3-D visualization of +0.2% seismic velocity anomaly isosurfaces in MIT-P (top) and +0.9% seismic velocity perturbation in GyPSuM-S (bottom) models. Profiles A to G represent the vertical profiles (see Fig. 10) that capture the convergence and subduction histories of the region since the Cretaceous. Present-day coastlines are translucent grey shades, and present-day plate boundaries are translucent black lines. Slab volumes are colored by their depth, while the light blue color represents the interior surface of these slabs. PSCS – proto-South China Sea slab.
- This map shows the seismic hazard for this region. The color represents the likelihood of any region experiencing ground shaking of a particular magnitude. The scale is “Peak Ground Acceleration.” Units are m/s^2. Purple represents gravitational acceleration of 1 g, gravity at Earth’s surface. Note how most of the earthquakes were in the region of higher likely ground shaking, except for the Sulawesi earthquakes.

Geologic Fundamentals
- For more on the graphical representation of moment tensors and focal mechnisms, check this IRIS video out:
- Here is a fantastic infographic from Frisch et al. (2011). This figure shows some examples of earthquakes in different plate tectonic settings, and what their fault plane solutions are. There is a cross section showing these focal mechanisms for a thrust or reverse earthquake. The upper right corner includes my favorite figure of all time. This shows the first motion (up or down) for each of the four quadrants. This figure also shows how the amplitude of the seismic waves are greatest (generally) in the middle of the quadrant and decrease to zero at the nodal planes (the boundary of each quadrant).

- Here is another way to look at these beach balls.
The two beach balls show the stike-slip fault motions for the M6.4 (left) and M6.0 (right) earthquakes. Helena Buurman's primer on reading those symbols is here. pic.twitter.com/aWrrb8I9tj
— AK Earthquake Center (@AKearthquake) August 15, 2018
- There are three types of earthquakes, strike-slip, compressional (reverse or thrust, depending upon the dip of the fault), and extensional (normal). Here is are some animations of these three types of earthquake faults. The following three animations are from IRIS.
Strike Slip:
Compressional:
Extensional:
- This is an image from the USGS that shows how, when an oceanic plate moves over a hotspot, the volcanoes formed over the hotspot form a series of volcanoes that increase in age in the direction of plate motion. The presumption is that the hotspot is stable and stays in one location. Torsvik et al. (2017) use various methods to evaluate why this is a false presumption for the Hawaii Hotspot.
- Here is a map from Torsvik et al. (2017) that shows the age of volcanic rocks at different locations along the Hawaii-Emperor Seamount Chain.

A cutaway view along the Hawaiian island chain showing the inferred mantle plume that has fed the Hawaiian hot spot on the overriding Pacific Plate. The geologic ages of the oldest volcano on each island (Ma = millions of years ago) are progressively older to the northwest, consistent with the hot spot model for the origin of the Hawaiian Ridge-Emperor Seamount Chain. (Modified from image of Joel E. Robinson, USGS, in “This Dynamic Planet” map of Simkin and others, 2006.)

Hawaiian-Emperor Chain. White dots are the locations of radiometrically dated seamounts, atolls and islands, based on compilations of Doubrovine et al. and O’Connor et al. Features encircled with larger white circles are discussed in the text and Fig. 2. Marine gravity anomaly map is from Sandwell and Smith.
- 2018.12.29 M 7.0 Philippines
- 2017.12.08 M 6.5 Caroline Ridge
- 2017.12.09 M 6.5 Caroline Ridge Update #1
- 2017.08.11 M 6.2 Philippines
- 2017.04.28 M 6.9 Philippines
- 2017.04.08 M 5.9 Philippines
- 2017.01.10 M 7.3 Celebes Sea
- 2016.07.29 M 7.7 Mariana
- 2015.03.17 M 6.2 Molucca Sea
- 2014.11.26 M 6.8 Molucca Sea
- 2014.11.21 M 6.5 Molucca Sea
- 2014.11.15 M 7.1 Molucca Sea
Philippines | Western Pacific
Earthquake Reports
Social Media
Mw=7.0, MINDANAO, PHILIPPINES (Depth: 60 km), 2018/12/29 03:39:09 UTC – Full details here: https://t.co/ZyLgsLFzDT pic.twitter.com/ManNjVQxOL
— Earthquakes (@geoscope_ipgp) December 29, 2018
Estimated population in the felt area: 50 millions inhabitants pic.twitter.com/YNcIvucPd7
— EMSC (@LastQuake) December 29, 2018
— patton_cascadia (@patton_cascadia) December 29, 2018
#Earthquake_alert #TSUNAMI WARNING – Earthquake M7.0, #Hypocenter: 60 km, MINDANAO, PHILIPPINES, Sat 29 Dec 2018 – 11:39:10 UTC+00:00, witnesses' testimonies and pics https://t.co/pqq7B70Ubb
*RT if you think this information is helpful. Thank you!#Philippines #earthquake pic.twitter.com/lKgruapBTP
— Desianto F. Wibisono (@TDesiantoFW) December 29, 2018
- Bird, P., Jackson, D. D., Kagan, Y. Y., Kreemer, C., and Stein, R. S., 2015. GEAR1: A global earthquake activity rate model constructed from geodetic strain rates and smoothed seismicity, Bull. Seismol. Soc. Am., v. 105, no. 5, p. 2538–2554, DOI: 10.1785/0120150058
- Galgana, G., Hamburger, M., McCaffrey, R., Corpuz, E., and Chen, Q., 2007. Analysis of crustal deformation in Luzon, Philippines using geodetic observations and earthquake focal mechanisms in Tectonophysics, v. 432, p. 63-67., doi:10.1016/j.tecto.2006.12.001
- Hall, R., 2011. Australia–SE Asia collision: plate tectonics and crustal flow in Hall, R., Cottam, M. A. &Wilson, M. E. J. (eds) The SE Asian Gateway: History and Tectonics of the Australia–Asia Collision. Geological Society, London, Special Publications, 355, 75–109.
- Hayes, G., 2018, Slab2 – A Comprehensive Subduction Zone Geometry Model: U.S. Geological Survey data release, https://doi.org/10.5066/F7PV6JNV.
- Noda, A., 2013. Strike-Slip Basin – Its Configuration and Sedimentary Facies in Mechanism of Sedimentary Basin Formation – Multidisciplinary Approach on Active Plate Margins http://www.intechopen.com/books/mechanism-of-sedimentarybasin-formation-multidisciplinary-approach-on-active-plate-margins http://dx.doi.org/10.5772/56593
- Smoczyk, G.M., Hayes, G.P., Hamburger, M.W., Benz, H.M., Villaseñor, Antonio, and Furlong, K.P., 2013. Seismicity of the Earth 1900–2012 Philippine Sea plate and vicinity: U.S. Geological Survey Open-File Report 2010–1083-M, 1 sheet, scale 1:10,000,000.
- Waltham et al., 2008. Basin formation by volcanic arc loading in GSA Special Papers 2008, v. 436, p. 11-26.
- Zahirovic et al., 2014. The Cretaceous and Cenozoic tectonic evolution of Southeast Asia in Solid Earth, v. 5, p. 227-273, doi:10.5194/se-5-227-2014.
References:
Return to the Earthquake Reports page.