Well, there was an earthquake this morning (my time) that may help us select a fault plane solution. Recall that these fault plane solutions (moment tensors and focal mechanisms) have two possible fault planes. We need additional information (like fault maps for the region, or aftershock patterns, etc.) in order to choose the more likely potential fault plane. Because we are scientists and we cannot make direct observations (the key part of the scientific method), we cannot ever know which fault plane is the correct one. However, we can be very certain based upon some basic reasoning.
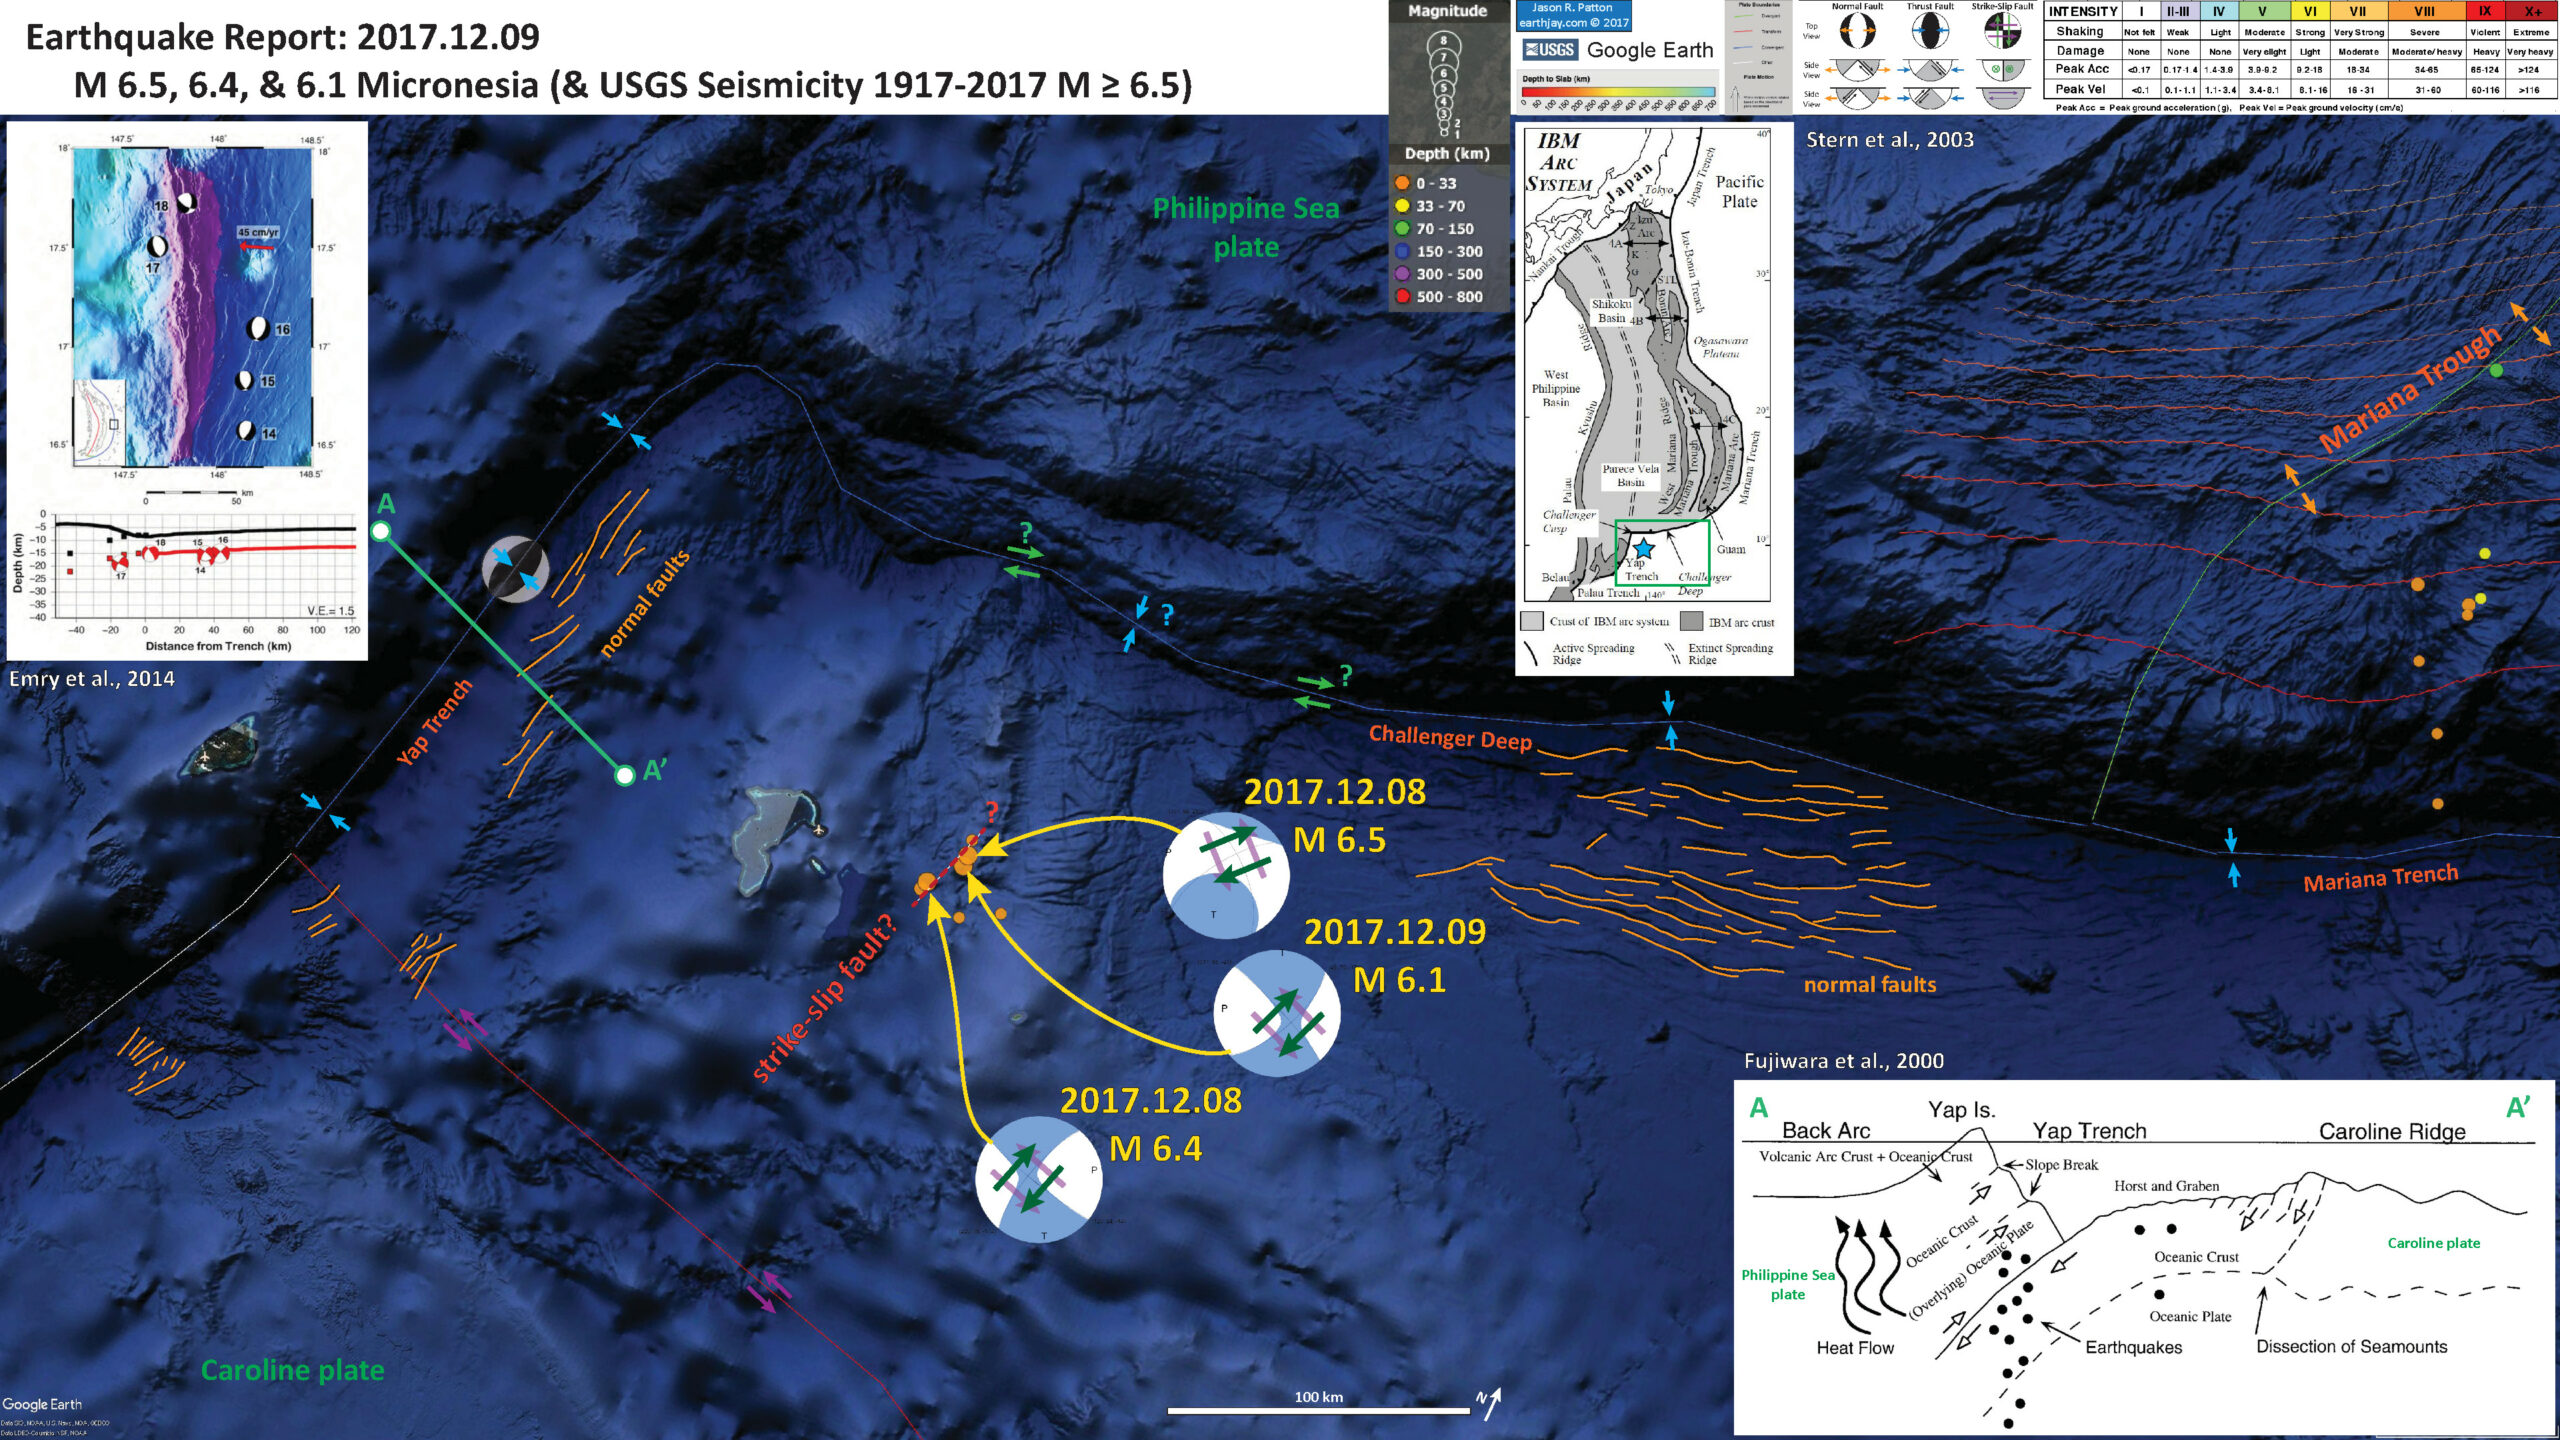
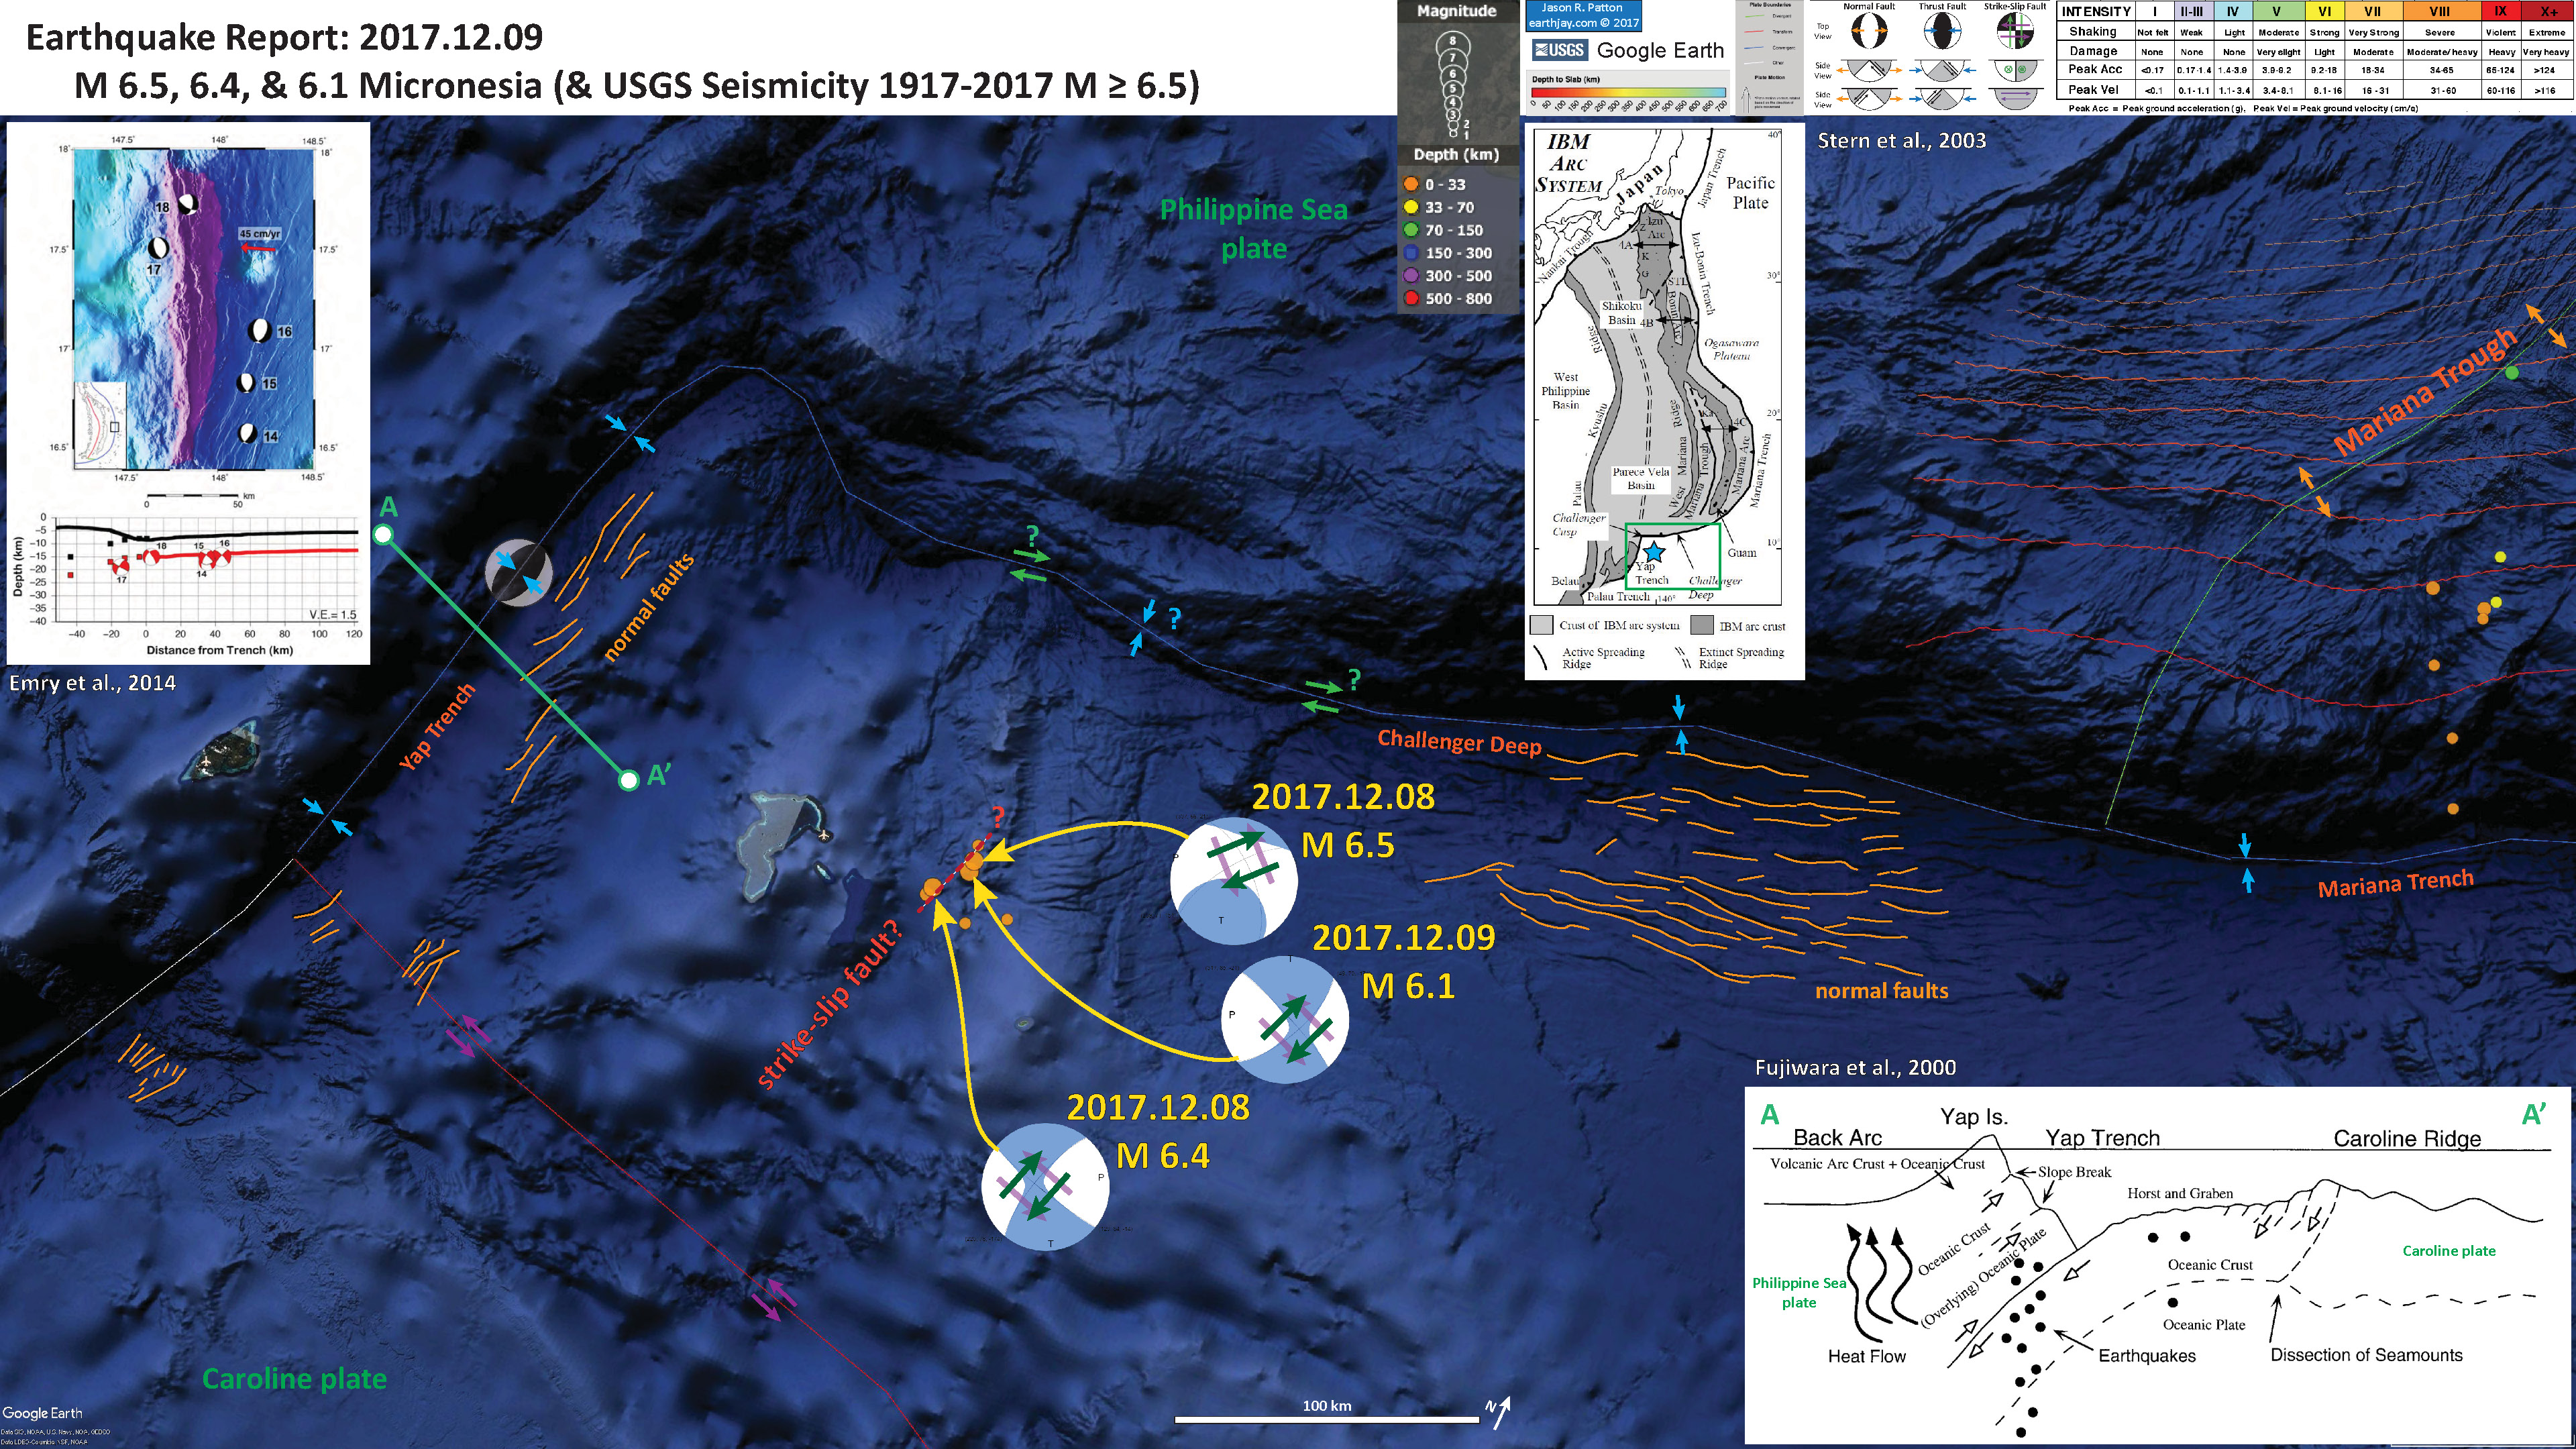
I speculated in my initial Earthquake Report here, that the M 6.5 and M 6.4 seemed to align along a north-northeast orientation, slightly favoring the NE striking right-lateral strike slip fault plane as the principal fault plane. Today’s M 6.1 earthquake provides additional corroborating evidence to support this initial interpretation.
In the interpretive poster, I draw a dashed red line connecting the earthquake epicenters along a hypothetical fault. This is pure conjecture, other than the aftershock pattern. However, these earthquakes are aligned in a way that is sub-parallel to a submarine mountain range (oriented ~north-south; note this range to the north of the epicenters). This range could be formed by faulting in the region. If this structure is related to these earthquakes, it might be a right-lateral strike-slip fault.
I also highlight some normal faults in the subducting Caroline plate to the east of these earthquakes. As the subducting plate flexes downward (during and preceding to subduction), this causes extension in the upper part of the plate. This extension leads to normal faulting as evidenced in the bathymetry. I simply digitized these faults here as a test bed to suggest that there are similar faults along the Yap Trench to the west of the earthquakes (tho the higher resolution multibeam bathymetry here is more spotty, so more difficult to interpret).
The subduction zone associated with the Mariana Trench may continue as the Challenger Deep and then as the Yap Trench, but there may be some strike-slip motion for part of this plate boundary fault (based upon the Fujiwara et al. (2000) hypothesis mentioned in my initial report. However, this strike-slip motion may be located on a separate fault system (often plate boundary motion can be partitioned between separate fault systems, e.g. the Sumatra-Andaman subduction zone and the Sumatra forearc sliver fault). It is not altogether clear what is happening here. There is a lineament to the north of the plate boundary mapped by the USGS here, but we really need some seismic reflection data to confirm this as a possibility.
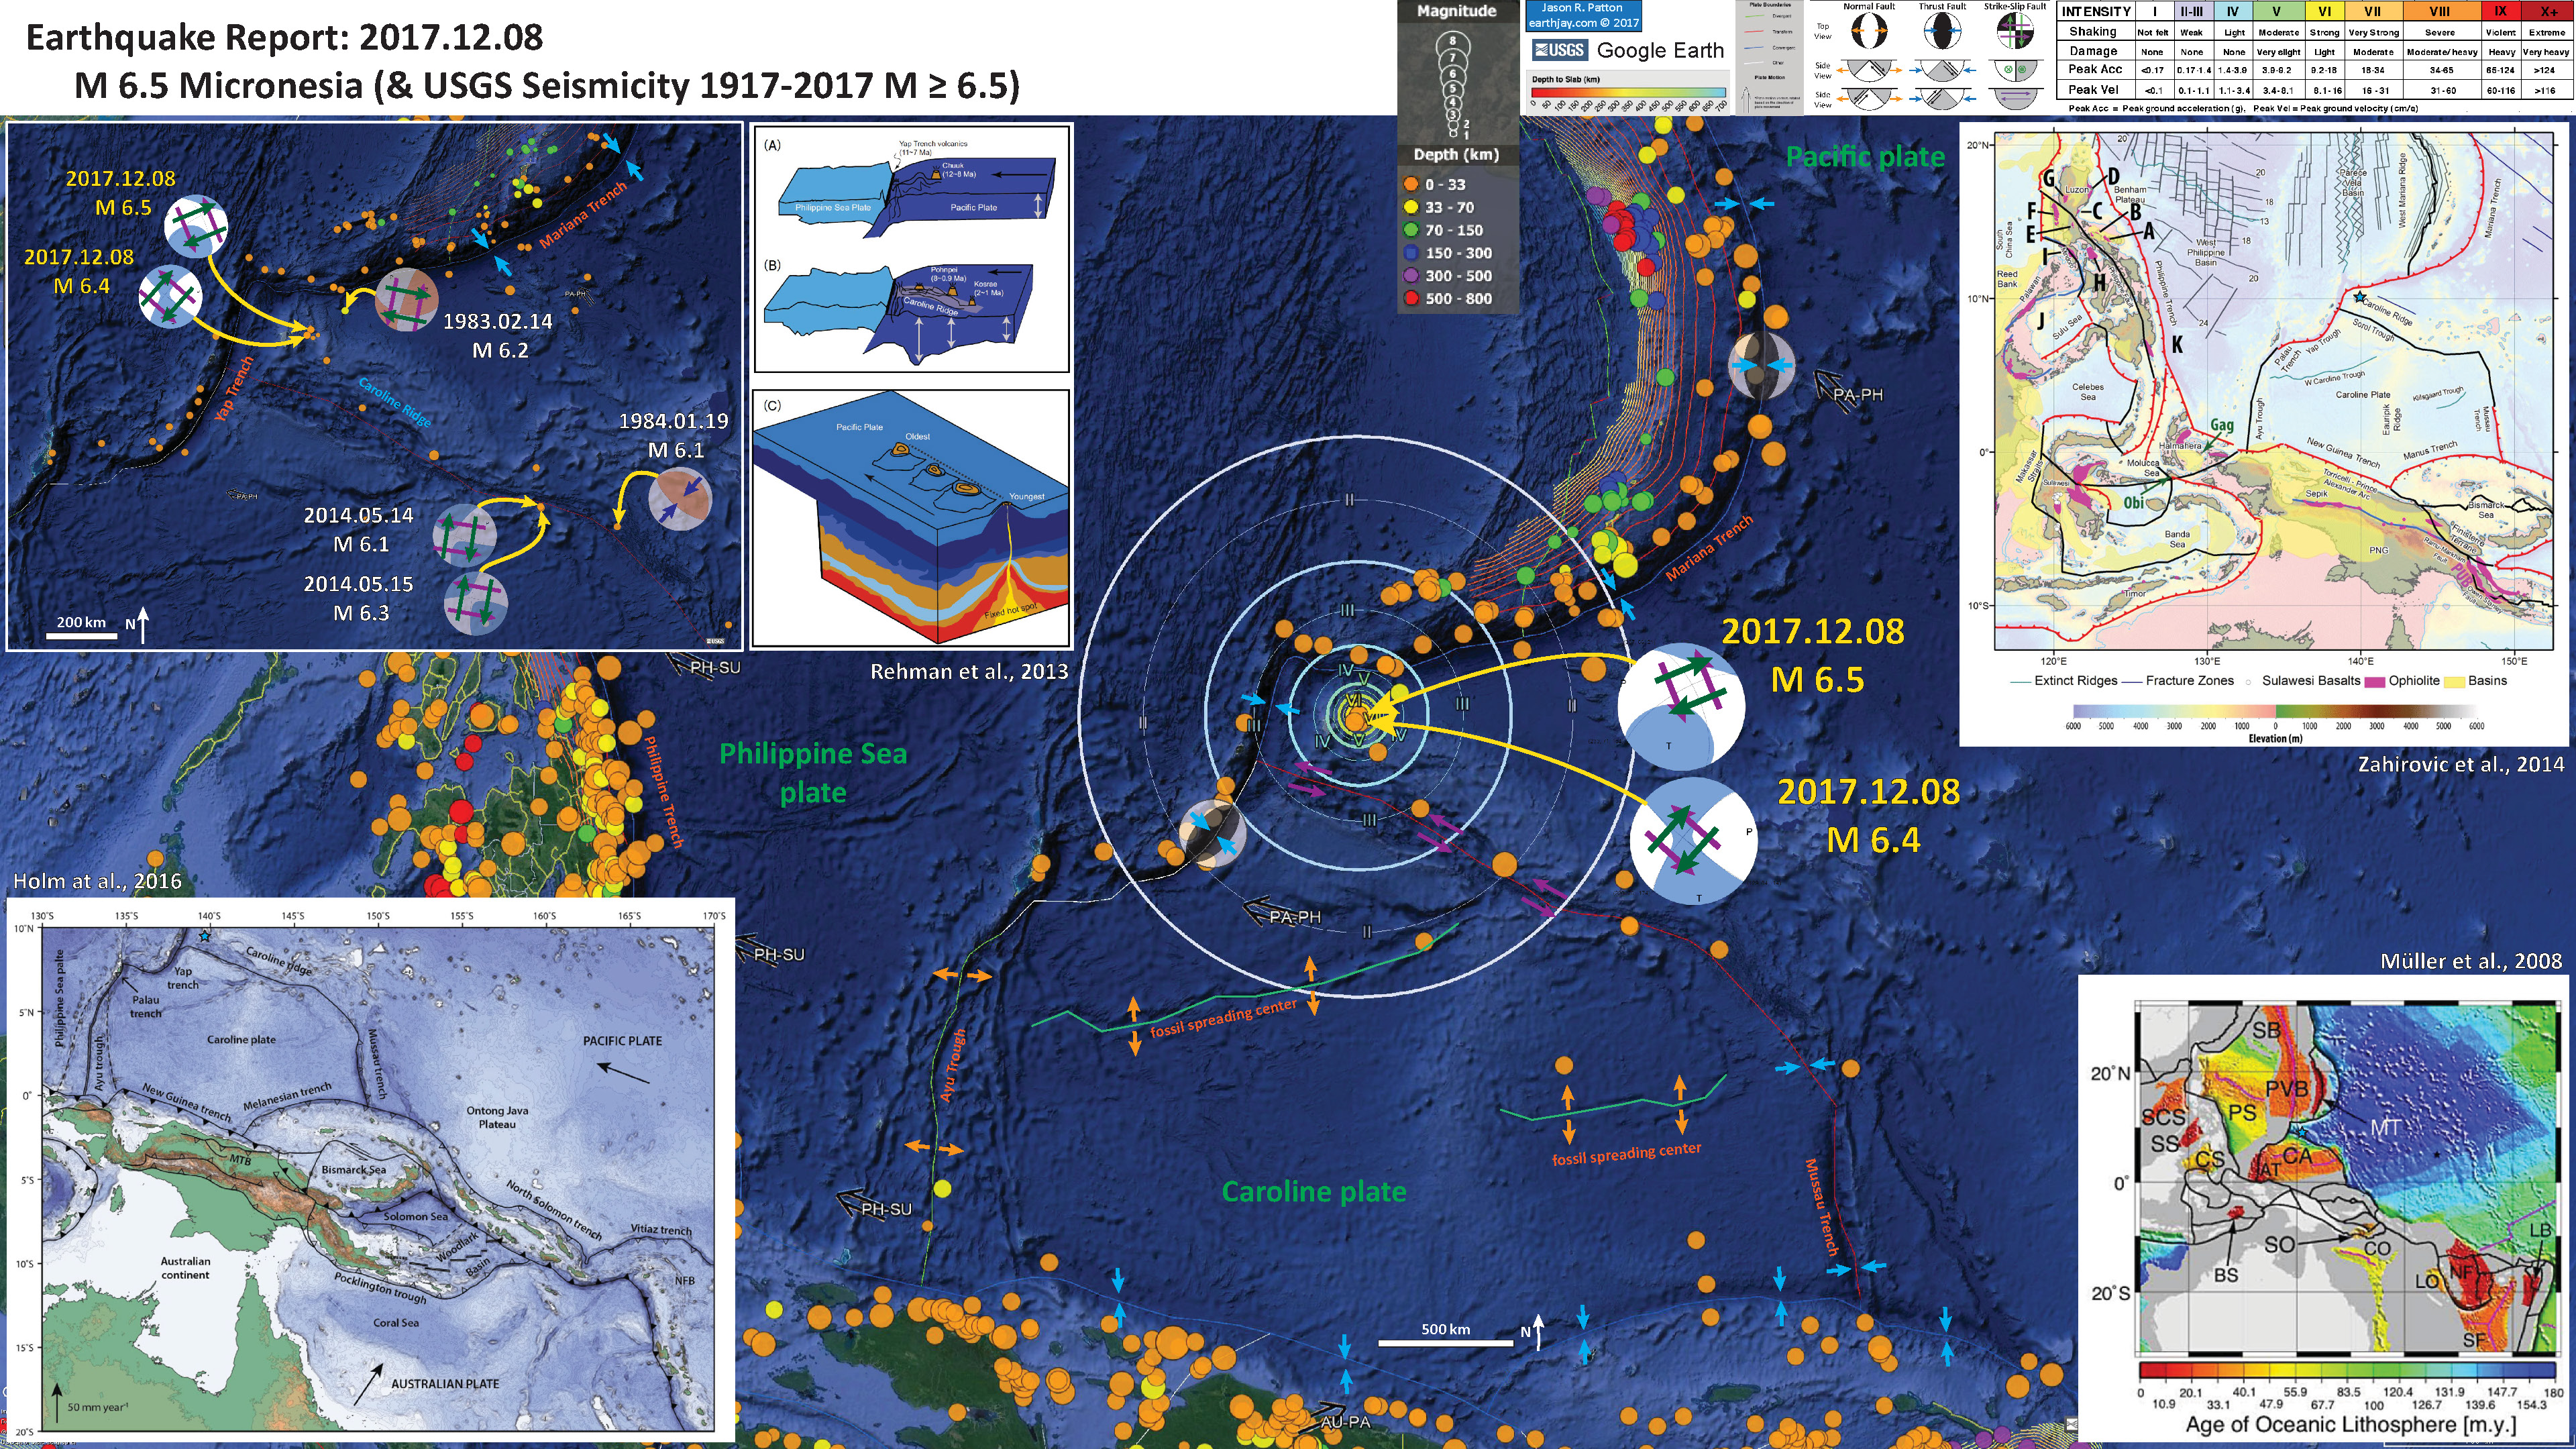
Below is my interpretive poster for this earthquake.
I plot the seismicity from the past month, with color representing depth and diameter representing magnitude (see legend). I include earthquake epicenters from 1917-2017 with magnitudes M > 6.5 (though there are not many historic earthquakes in this small region).
I plot the USGS fault plane solutions (moment tensors in blue) for the M 6.5, M 6.4, and M 6.1 earthquakes.
- I placed a moment tensor / focal mechanism legend on the poster. There is more material from the USGS web sites about moment tensors and focal mechanisms (the beach ball symbols). Both moment tensors and focal mechanisms are solutions to seismologic data that reveal two possible interpretations for fault orientation and sense of motion. One must use other information, like the regional tectonics, to interpret which of the two possibilities is more likely.
- I also include the shaking intensity contours on the map. These use the Modified Mercalli Intensity Scale (MMI; see the legend on the map). This is based upon a computer model estimate of ground motions, different from the “Did You Feel It?” estimate of ground motions that is actually based on real observations. The MMI is a qualitative measure of shaking intensity. More on the MMI scale can be found here and here. This is based upon a computer model estimate of ground motions, different from the “Did You Feel It?” estimate of ground motions that is actually based on real observations.
- I include the slab contours plotted (Hayes et al., 2012), which are contours that represent the depth to the subduction zone fault. These are mostly based upon seismicity. The depths of the earthquakes have considerable error and do not all occur along the subduction zone faults, so these slab contours are simply the best estimate for the location of the fault. The hypocentral depth plots this close to the location of the fault as mapped by Hayes et al. (2012).
- Here are the USGS pages for the main earthquake in this sequence.
- 2017.12.08 M 6.5
- 2017.12.08 M 6.4
- 2017.12.09 M 6.1
-
I include some inset figures.
- In the upper center I include a map showing the tectonics of the region to the north of these earthquakes (Stern et al., 2003). I place a blue star where these earthquakes are located and a green rectangle showing the general limit of this interpretive poster.
- In the lower right corner I include the tectonic model from Fujuwara et al. (2000) for the subduction of the Caroline Ridge (they hypothesize that the Yap Trench was part of the Mariana Trench, but has been offset due to the attempted (and succeeded?) subduction of the Caroline Ridge).
- In the upper left corner I include a figure from Emry et al. (2014) that shows how the bending moment normal faults (I mention these above, as outlined in orange in the interpretive poster) are evidenced by normal fault plate solutions.
- Here is the interpretive poster from my original Earthquake Report.
- This shows the arc and backarc tectonic elements in this region (Stern et al., 2003).

Generalized locality map for the Izu-Bonin-Mariana Arc system. Dashed line labeled STL = Sofugan Tectonic Line.
- This shows, in cross-section form, the magmatic evolution of the Back-Arc along the Mariana Trench (Stern et al., 2003).

Simplified history of the IBM arc system. Shaded areas are magmatically inactive, cross-hatched areas are magmatically active.
- Here is a map showing the fault plane solutions used by Emry et al. (2014) to evaluate the faulting related to the Mariana Trench.
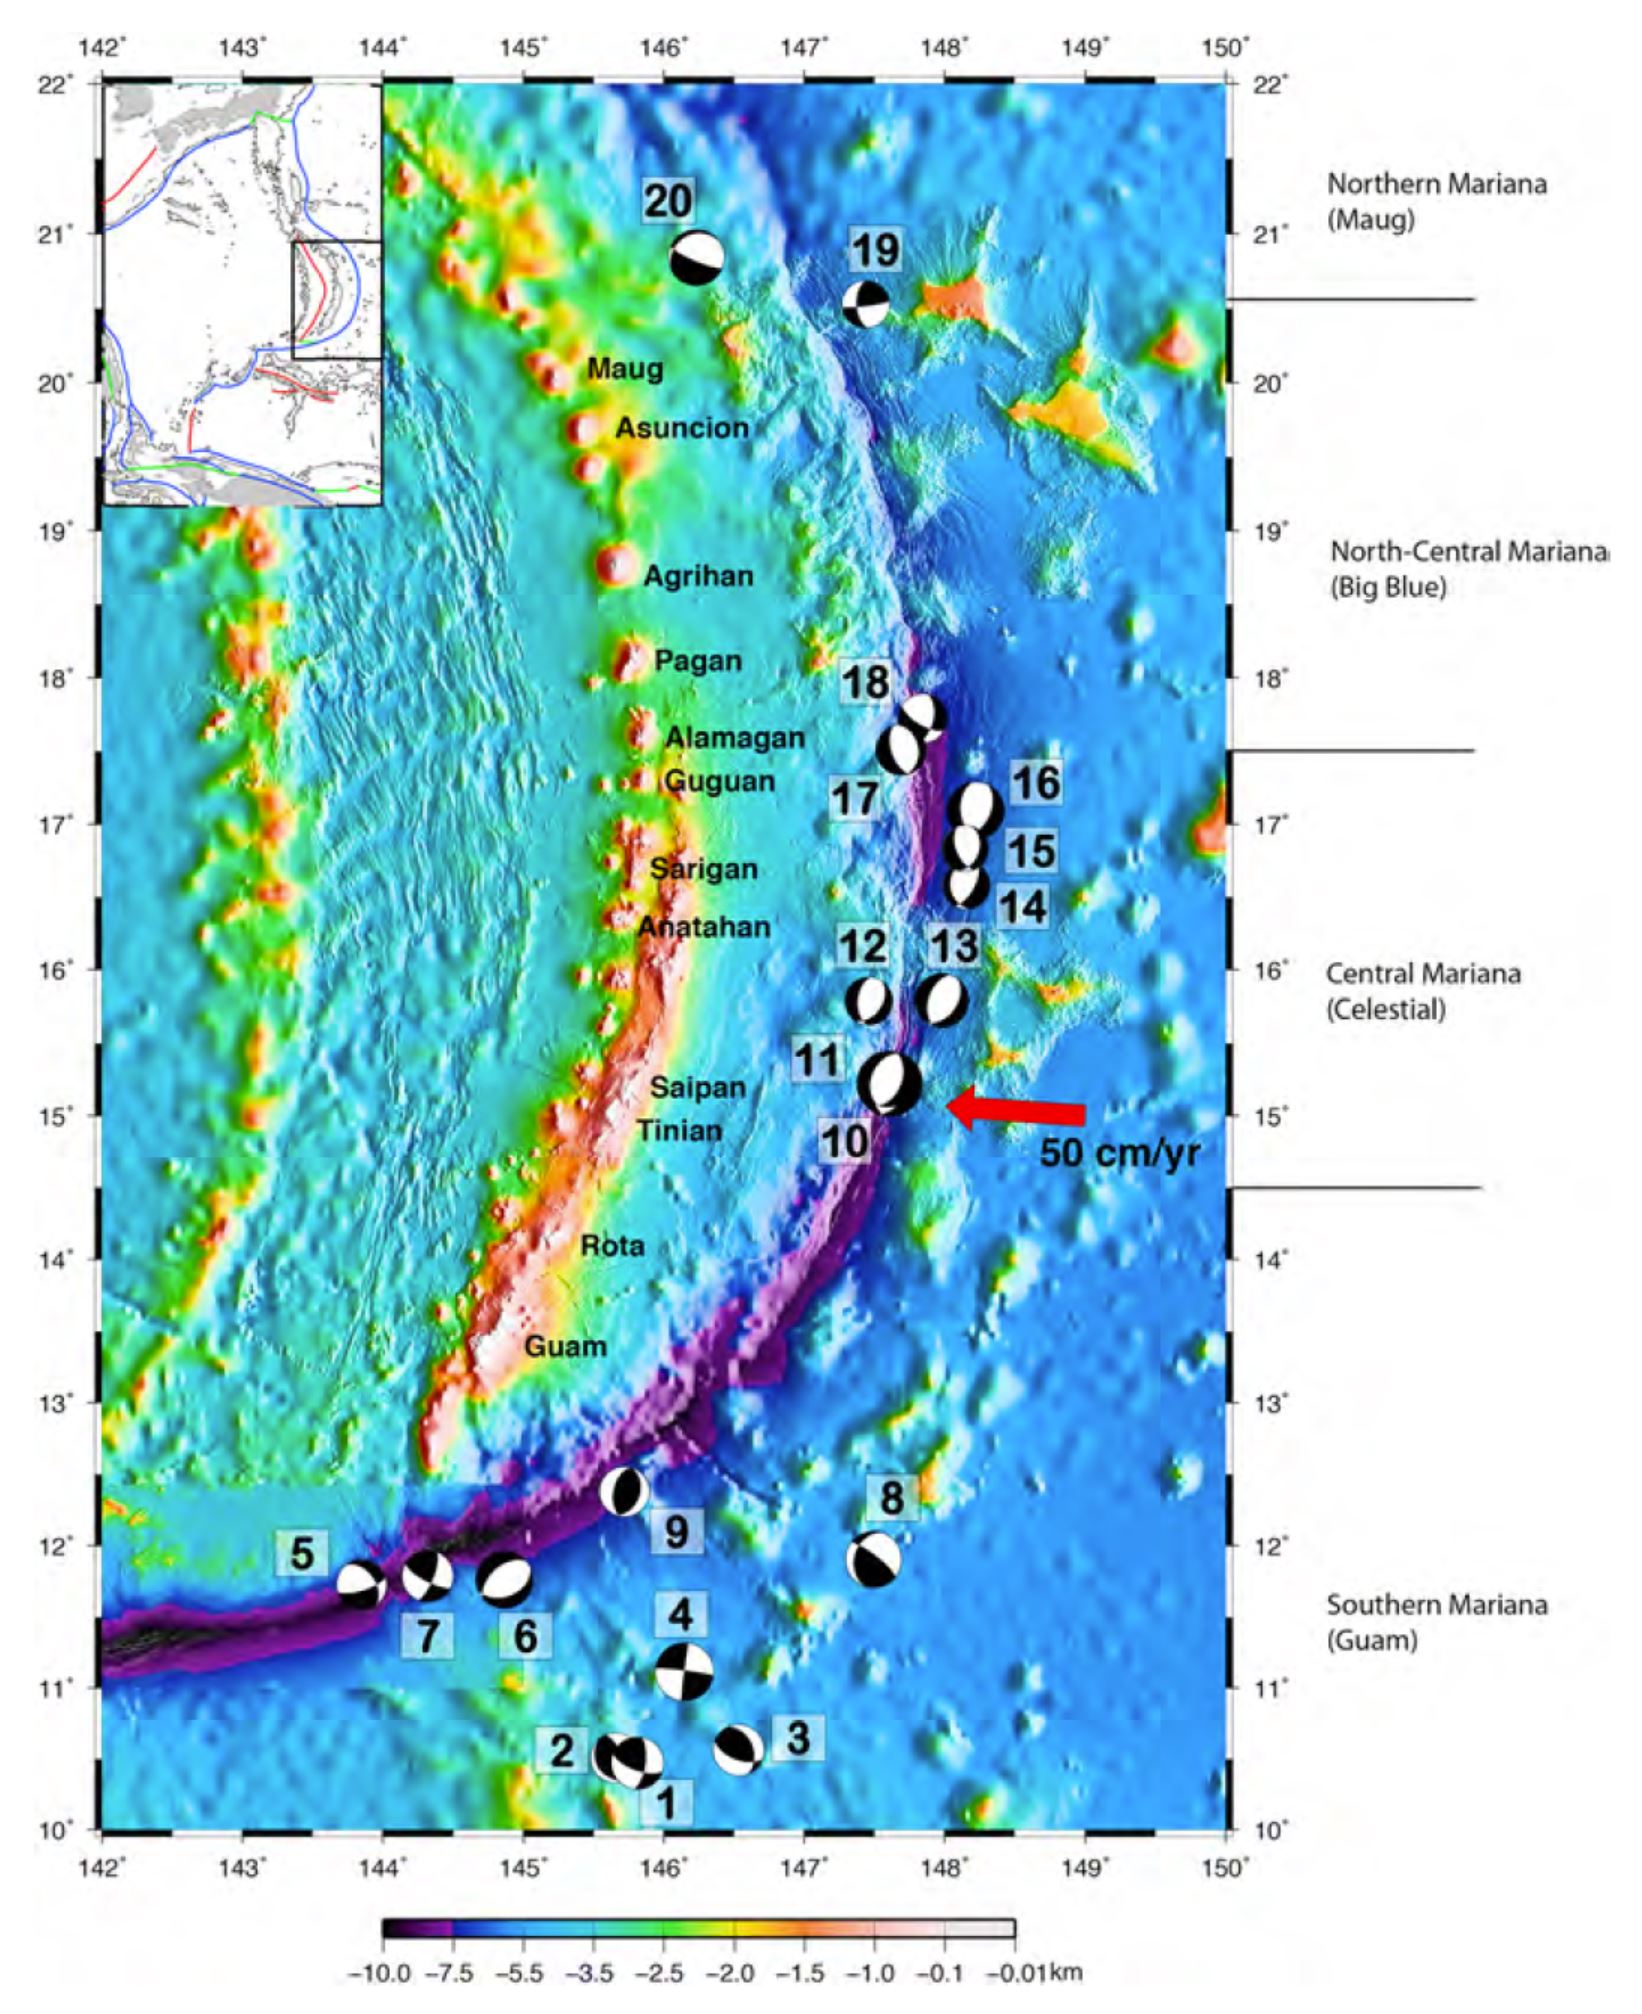
Relocated GCMT earthquakes in map view. Lower hemisphere stereographic projections for earthquakes are shown with compressional P wave quadrants (containing the T axis in black) and dilatational P wave quadrants (containing the P axis in white). The event numbers next to each focal mechanism correspond to Tables 2 and 4. The red arrow shows the angle of convergence of the Pacific plate relative to the Mariana fore arc as determined by Kato et al. [2003]. High-resolution bathymetry data in Northern and Central Mariana are from 2010 Mariana Law of the Sea Cruise [Gardner, 2010] and high-resolution bathymetry data in Southern Mariana are courtesy of F.Martinez. The color scale for bathymetry is positioned below and is the same for all bathymetric maps in the paper. (inset) Tectonic setting of the Philippine Sea. Bathymetry contours are shown by thin black lines. Subduction trenches are shown in blue; spreading centers are shown in red; transforms are shown in green.
- Here is the larger scale map from Emry et al. (2014) showing some moment tensors and high resolution multibeam bathymetry, revealing fault geomorphology. Below the map is a cross section, showing how these normal faulting earthquakes occur in the downgoing Pacific plate, beneath the subduction zone fault.
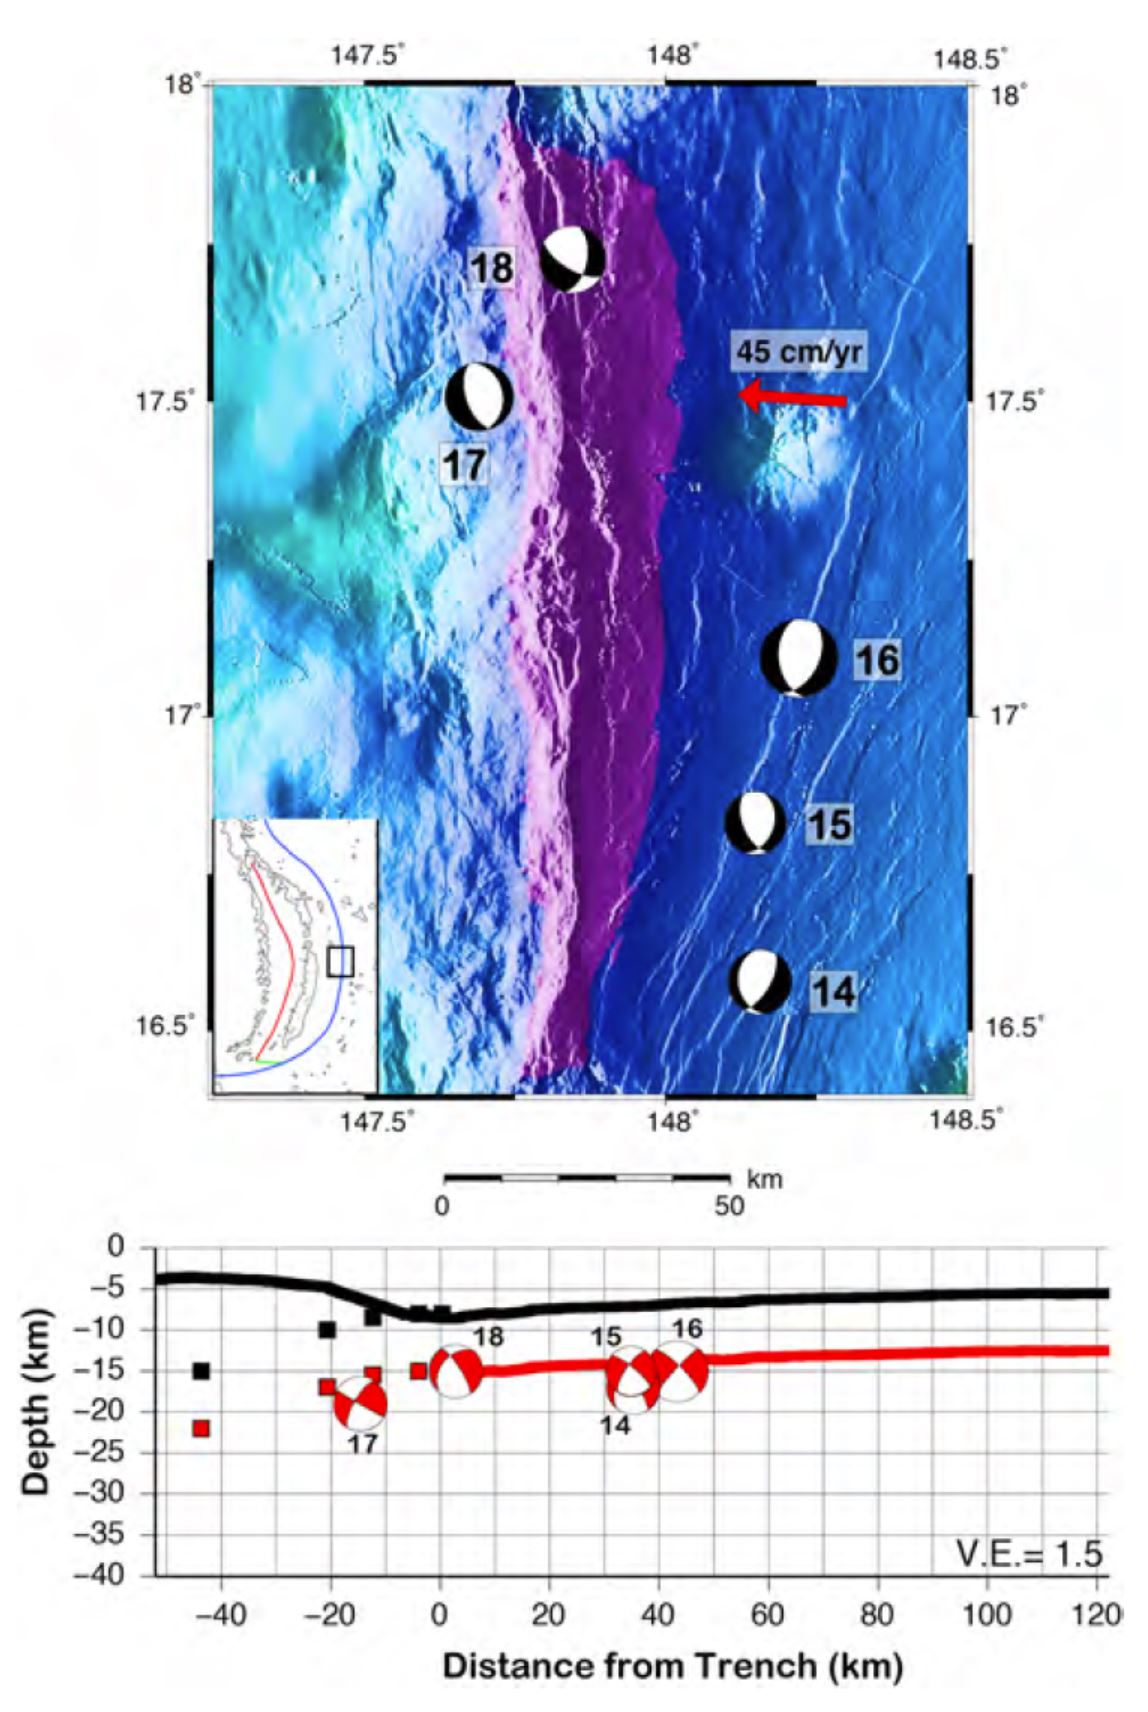
(top) Relocated GCMT earthquake locations in mapview. Lower hemisphere stereographic projections for earthquakes are shown with compressional quadrants (in black) and dilatational quadrants (in white). Event numbers next to each focal mechanism correspond to Tables 2 and 4. The red arrow shows the angle and rate of Pacific plate convergence relative to the fore arc as determined by Kato et al. [2003]. High-resolution bathymetry data are from Gardner [2010]. The bathymetry scale is the same as in Figure 1. Inset shows the tectonic setting of the Mariana Islands. Bathymetry contours are shown by thin black lines. The trench axis is shown in blue; back-arc spreading center is in red; transform is in green. (bottom) Trench perpendicular cross section with the location of the subduction trench at 0 km; negative distances indicate the distance landward (or west of the trench) and positive distances indicate seaward distances (or east of the trench). Thick black lines show the bathymetry along (17.25°N, 147.3577°E) to (17.2752°N, 148.9311°E). Thick red lines show depth to the Moho used in our waveform inversion. Black squares show the depth to the plate interface at ~17°N from Oakley et al. [2008]; red squares indicate the continuation of the Moho landward from the trench. Focal mechanisms for the region are rotated 90° into cross section. Dilatational quadrants are indicated by white while compressional quadrants are indicated by red. The event numbers next to each focal mechanism correspond to Tables 2 and 4. Vertical exaggeration (VE) is 1.5.
- This is a cross section showing how Fujiwara et al. (2000) interpret how the Pacific plate (Caroline Ridge) subducts beneath the Philippine Sea plate at the Yap Trench.
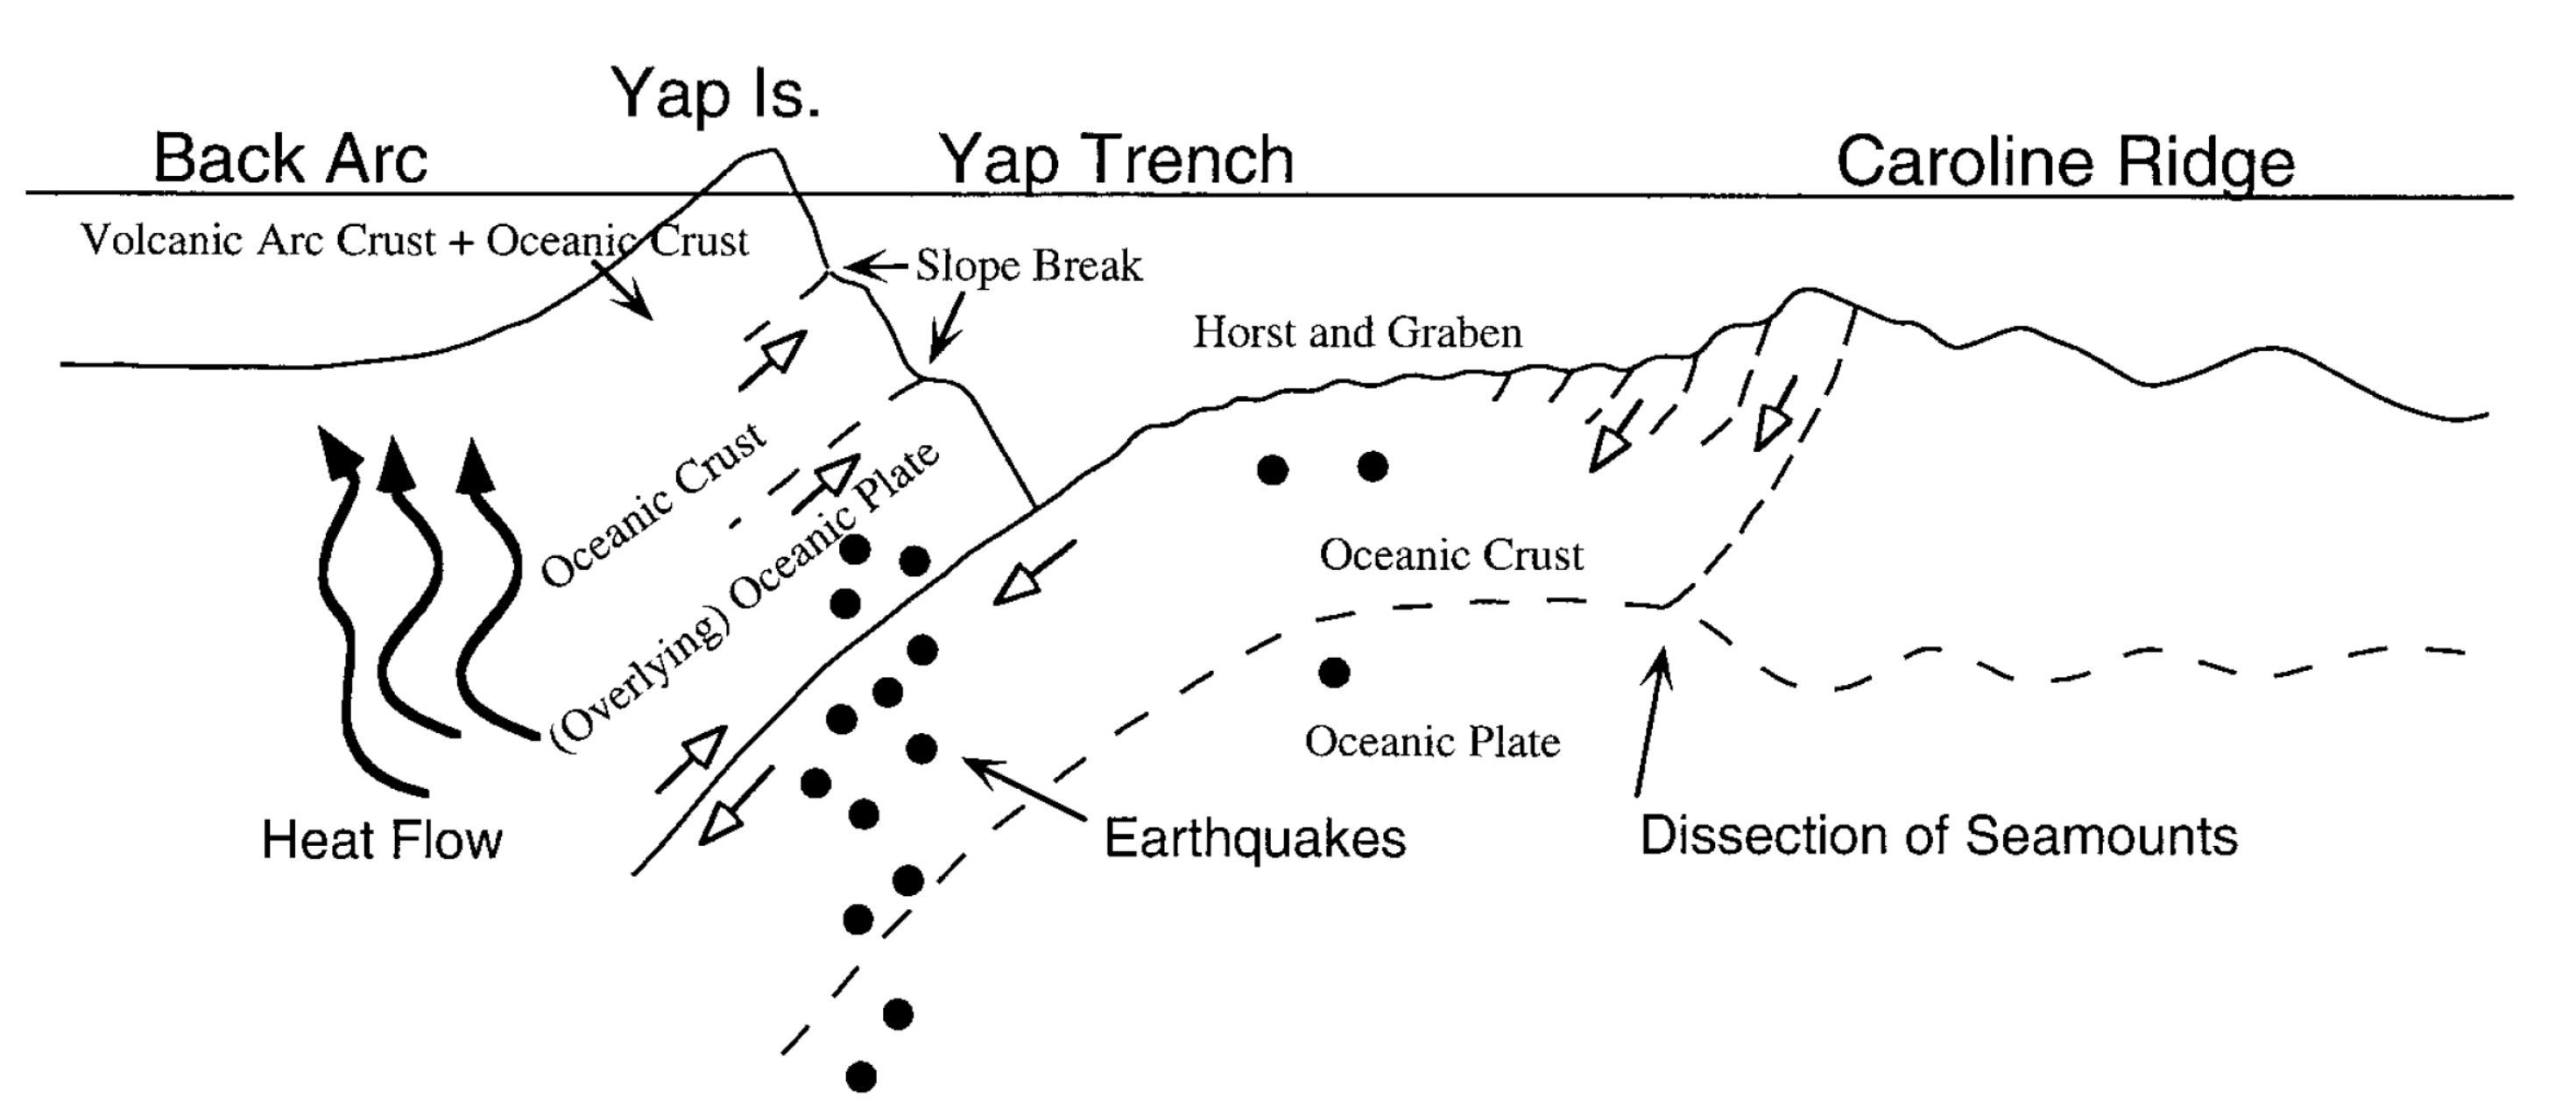
Schematic across the axis cross section of the northern part of the Yap Trench and its tectonic interpretation.
- This illustration shows four time steps in the evolution of the plate boundary in this area.

Proposed scenario of the evolution of the Yap Trench.
- 2017.12.08 M 6.5 Caroline Ridge
- 2017.12.09 M 6.5 Caroline Ridge Update #1
- 2017.08.11 M 6.2 Philippines
- 2017.04.28 M 6.9 Philippines
- 2017.04.08 M 5.9 Philippines
- 2017.01.10 M 7.3 Celebes Sea
- 2016.07.29 M 7.7 Mariana
- 2015.03.17 M 6.2 Molucca Sea
- 2014.11.26 M 6.8 Molucca Sea
- 2014.11.21 M 6.5 Molucca Sea
- 2014.11.15 M 7.1 Molucca Sea
Philippines | Western Pacific
Earthquake Reports
- Bird, P., 2003. An updated digital model of plate boundaries in Geochemistry, Geophysics, Geosystems, v. 4, doi:10.1029/2001GC000252, 52 p.
- Emry, E. L., Wiens, D. A., and Garcia-Castellanos, D., 2014. Faulting within the Pacific plate at the Mariana Trench: Implications for plate interface coupling and subduction of hydrous minerals, J. Geophys. Res. Solid Earth, 119, 3076–3095, doi:10.1002/2013JB010718. Fujiwara, T., Tamura, C., Nishizawa, A., Fujioka, K., Kobayashi, K., and Iwabuschi, Y., 2000. Morphology and tectonics of the Yap Trench in Marine Geophysical Researches, v. 21, p. 69-86
- Gaina, C. and Müller, R.D., 2007. Cenozoic tectonic and depth/age evolution of the Indonesian gateway and associated back-arc basins in Earth-Science Reviews v. 83, p. 177-203
- Hayes, G. P., D. J. Wald, and R. L. Johnson (2012), Slab1.0: A three-dimensional model of global subduction zone geometries, J. Geophys. Res., 117, B01302, doi:10.1029/2011JB008524.
- Holm, R.J., Rosenbaum, G., Richards, S.W., 2016. Post 8 Ma reconstruction of Papua New Guinea and Solomon Islands: Microplate tectonics in a convergent plate boundary setting in Eartth Science Reviews, v. 156, p. 66-81.
- Müller, R.D., Sdrolias, M., Gaina, C., and Roest, W.R., 2008. Age, spreading rates, and spreading asymmetry of the world’s ocean crust in Geochemistry, Geophysics, Geosystems, v. 9, no. 3. Q04006, doi:10.1029/2007GC001743
- Okino, K., Ohara, Y., Fujiwara, T., Lee, S-M., Koizumi, K., Nakamura, Y., and Wu., S., 2009. Tectonics of the southern tip of the Parece Vela Basin, Philippine Sea Plate in Tectonophysics, v. 466, p. 213-228.
- Richards, S., Holm, R., Barber, G., 2011. When slabs collide: A tectonic assessment of deep earthquakes in the Tonga-Vanuatu region in Geology, v. 39, no. 8., p. 787-790
- Smoczyk, G.M., Hayes, G.P., Hamburger, M.W., Benz, H.M., Villaseñor, Antonio, and Furlong, K.P., 2013, Seismicity of the Earth 1900–2012 Philippine Sea Plate and vicinity: U.S. Geological Survey Open-File Report 2010–1083-M, scale 1:10,000,000, https://dx.doi.org/10.3133/ofr20101083m.
- Stern, R.J., 2010. The anatomy and ontogeny of modern intra-oceanic arc systems in Kusky, T. M., Zhai, M.-G. & Xiao, W. (eds) The Evolving Continents: Understanding Processes of Continental Growth. Geological Society, London, Special Publications, 338, 7–34.
- Stern, R. J., Fouch, M. J. & Klemperer, S. 2003. An overview of the Izu–Bonin–Mariana subduction factory. In: Eiler, J. (ed.) Inside the Subduction Factory. American Geophysical Union, Geophysical Monograph, 138, 175–222.
- Uyeda and Kanamori, 1979. Back-Arc Opening and the Mode of Subduction in JGR, v. 84, no. B3, p. 1049-1061.
- Zahirovic et al., 2014. The Cretaceous and Cenozoic tectonic evolution of Southeast Asia in Solid Earth, v. 5, p. 227-273, doi:10.5194/se-5-227-2014.