
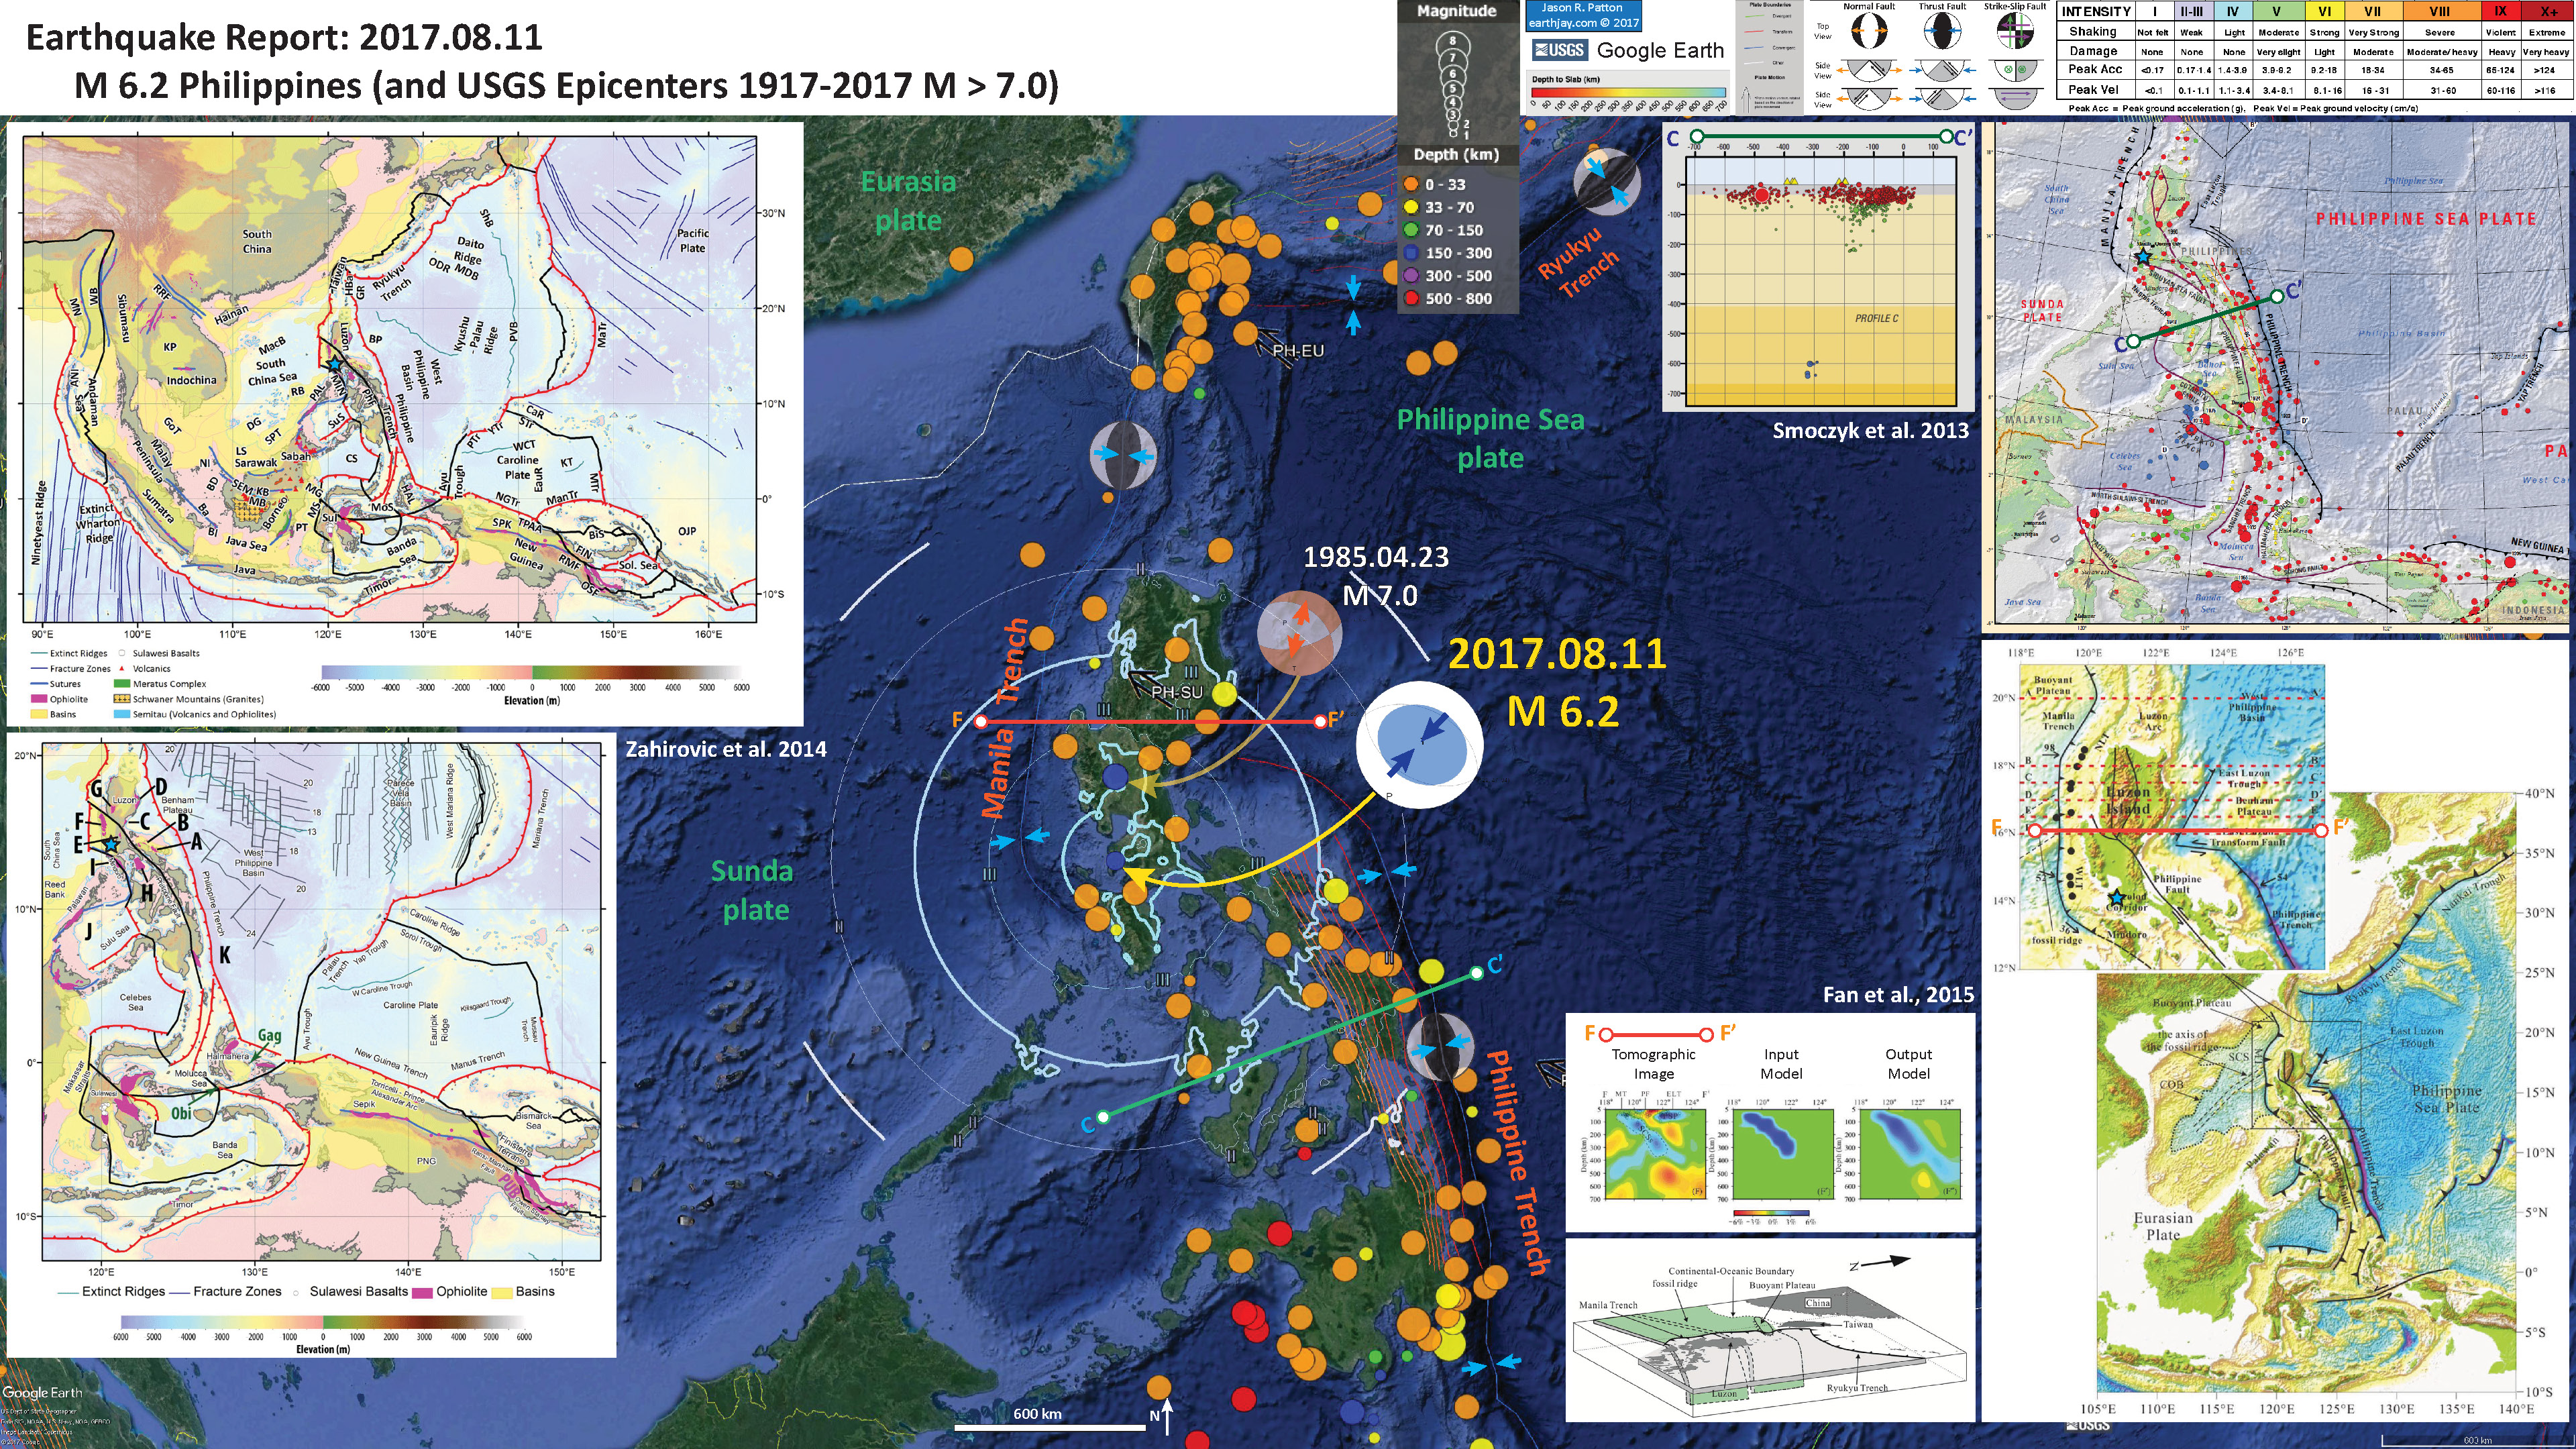
There was a deep focus earthquake in the Philippines today. This shaker was located near the city of Manila (I live in Manila. Manila, California). The hypocenter was quite deep (168 km) so (a) had lesser shaking due to the distance to the earthquake from Earth’s surface and (b) was not related to the subduction zone fault. Seismicity associated with the megathrust fault is typically less than 40 km or so. As the oceanic lithosphere dives into the upper mantle, there are lots of processes that can lead to earthquakes (e.g. internal deformation due to bending of the slab). Many are familiar with extensional earthquakes in this region (e.g. the 2001 Nisqually Earthquake in Washington, USA). But, today’s earthquake is compressional.
Here is the USGS website for today’s M 6.2 earthquake.
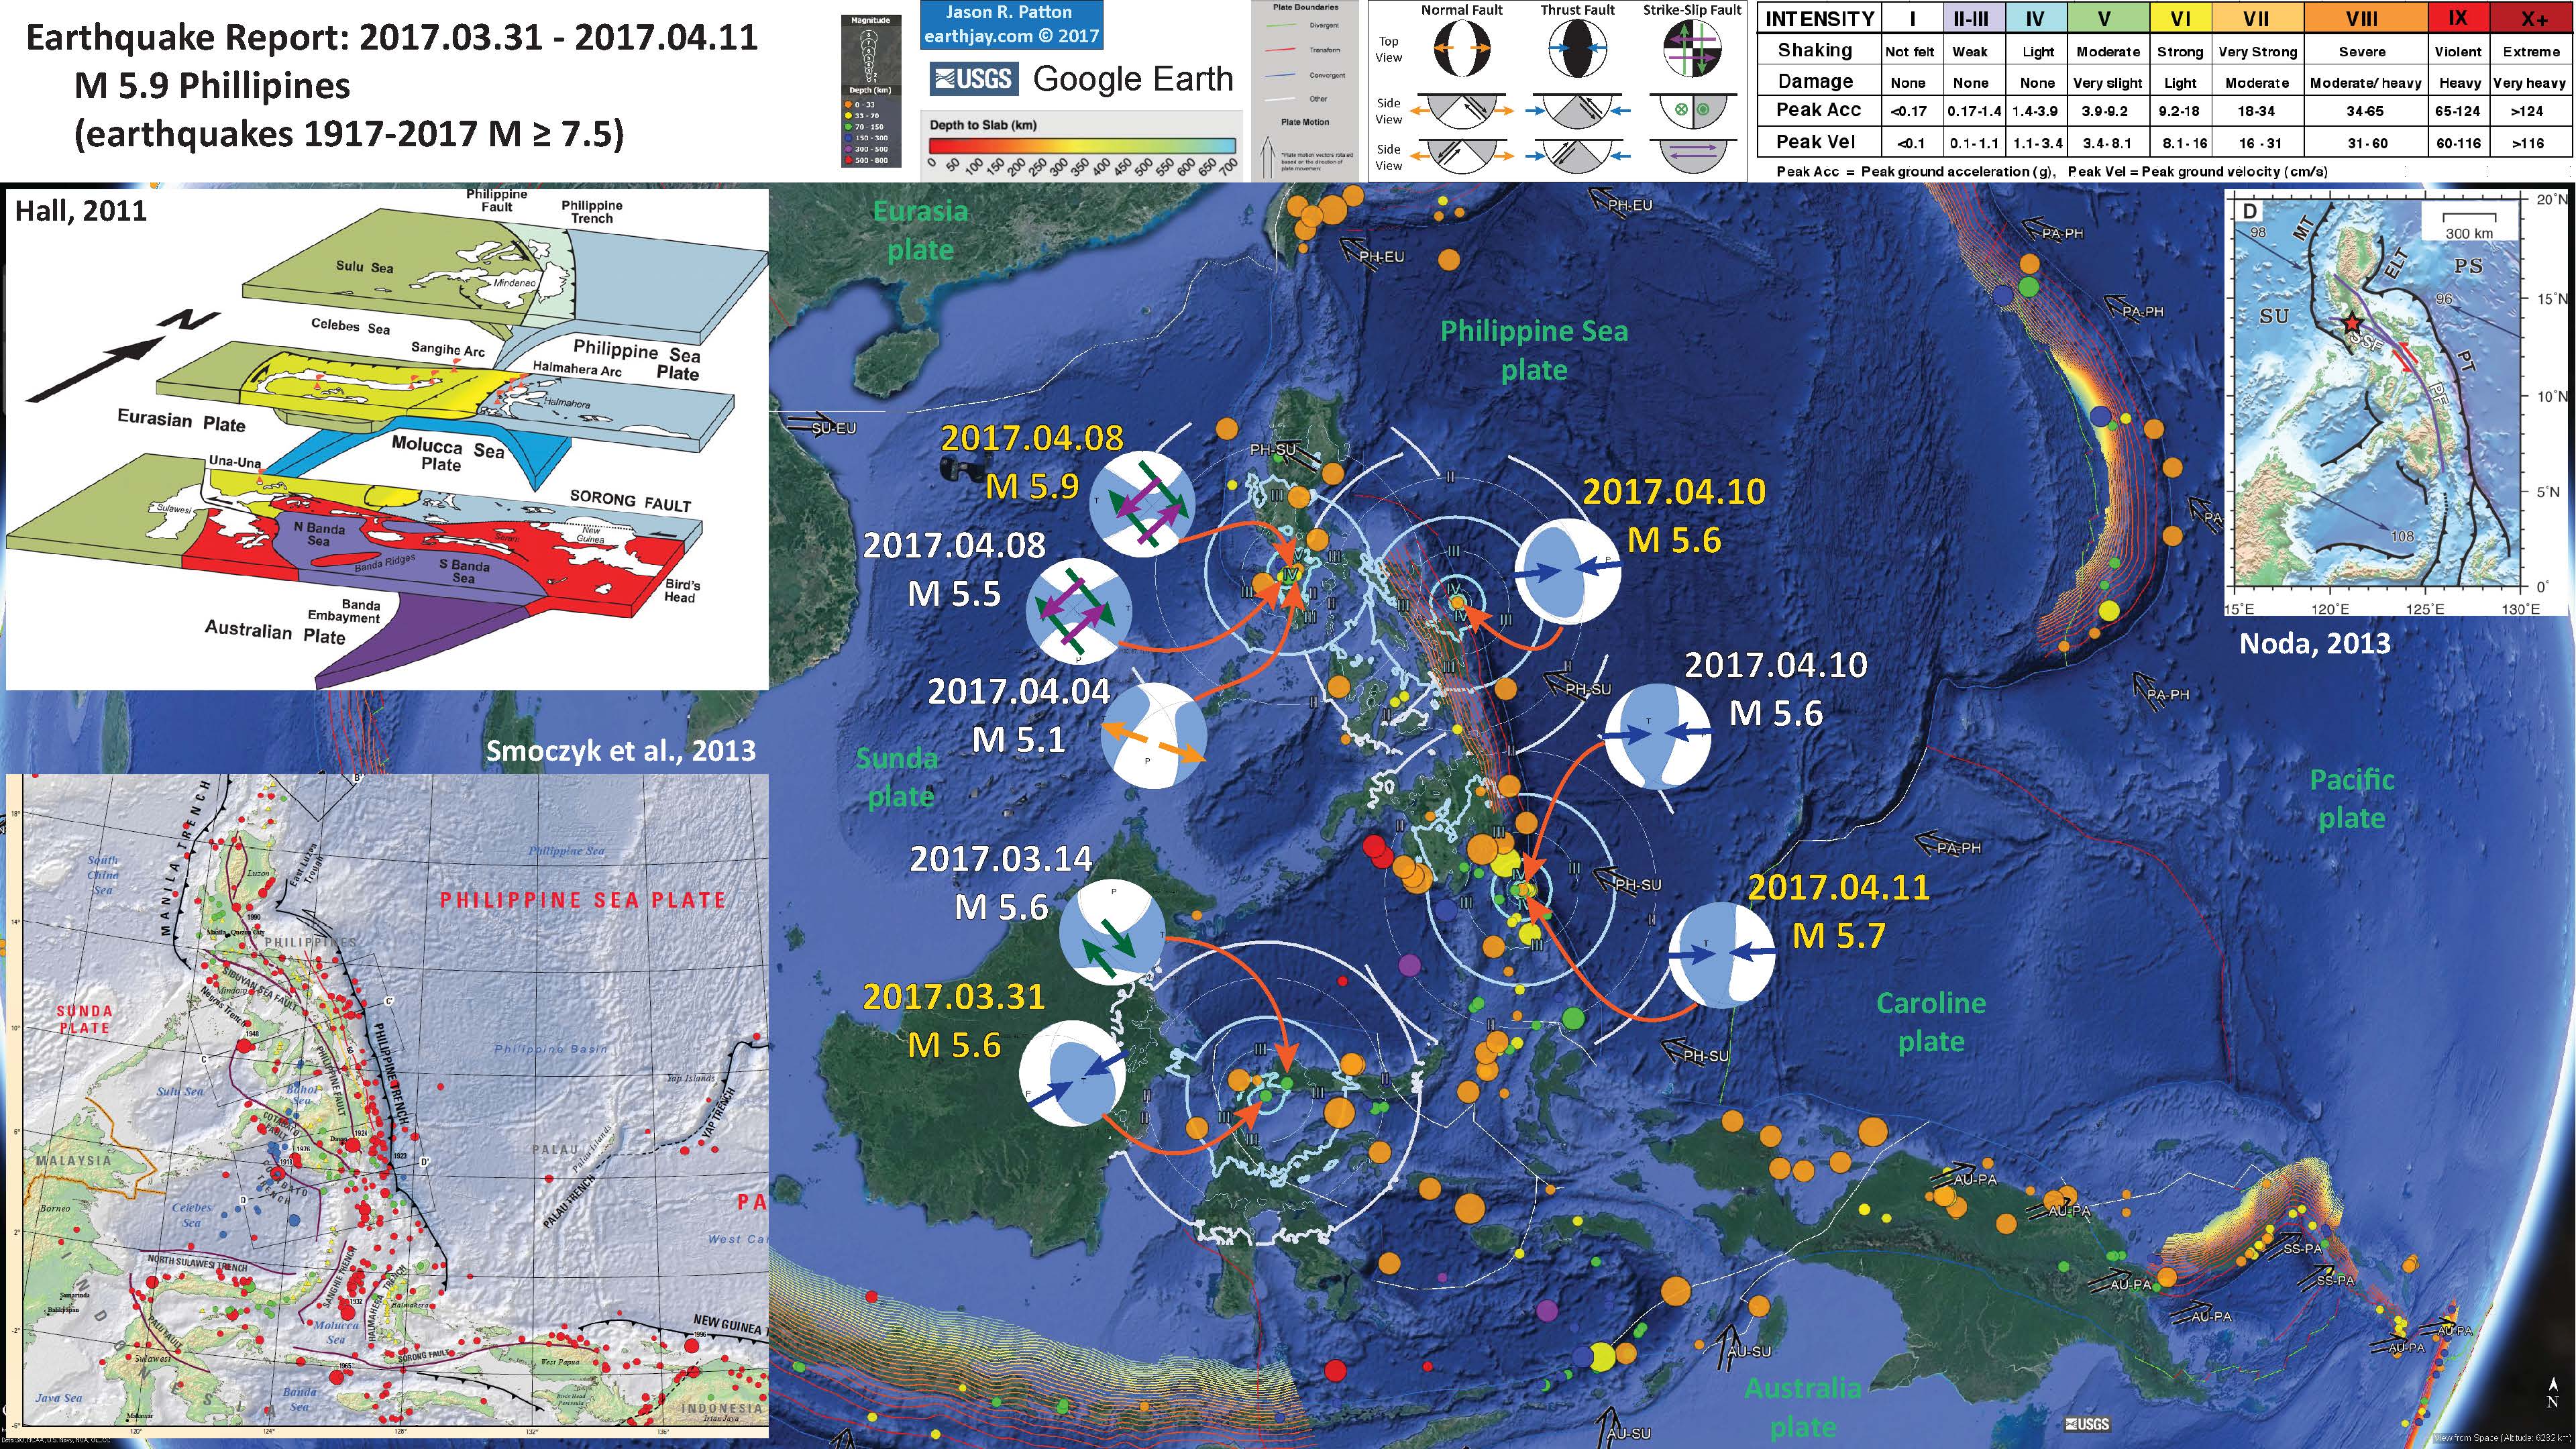
There was a series of earthquakes earlier this year and here is my earthquake report for those earthquakes.
Below is my interpretive poster for this earthquake
I plot the seismicity from the past month, with color representing depth and diameter representing magnitude (see legend). I also include USGS epicenters from 1917-2017 for magnitudes M ≥ 7.
I also include the USGS moment tensor for today’s earthquake, as well as for the other historic earthquake in the region that had a similarly deep focus (the 1985.04.23 M 7.0 earthquake). The 1985 earthquake was an extensional earthquake and slightly deeper (188 km).
- I placed a moment tensor / focal mechanism legend on the poster. There is more material from the USGS web sites about moment tensors and focal mechanisms (the beach ball symbols). Both moment tensors and focal mechanisms are solutions to seismologic data that reveal two possible interpretations for fault orientation and sense of motion. One must use other information, like the regional tectonics, to interpret which of the two possibilities is more likely.
- I also include the shaking intensity contours on the map. These use the Modified Mercalli Intensity Scale (MMI; see the legend on the map). This is based upon a computer model estimate of ground motions, different from the “Did You Feel It?” estimate of ground motions that is actually based on real observations. The MMI is a qualitative measure of shaking intensity. More on the MMI scale can be found here and here. This is based upon a computer model estimate of ground motions, different from the “Did You Feel It?” estimate of ground motions that is actually based on real observations.
- I include the slab contours plotted (Hayes et al., 2012), which are contours that represent the depth to the subduction zone fault. These are mostly based upon seismicity. The depths of the earthquakes have considerable error and do not all occur along the subduction zone faults, so these slab contours are simply the best estimate for the location of the fault.
- On the left side of the poster I include a small scale (upper panel) and a large scale (bottom panel) view of the regional tectonics (Zahirovic et al., 2014). Plate boundary fault symbology (and other features, like fracture zones) is shown in the legend. I place a blue star on the map in the general location of this earthquake epicenter.
- In the upper right corner I include a map showing the seismicity and tectonic plate boundary faults for this region (Smoczyk et al., 2013). Earthquakes are plotted with color representing depth and diameter representing magnitude (see legend). To the left of the map I include the cross section C-C’ that shows the earthquake hypocenters.
- In the lower right corner is another tectonic map (Fan et al., 2015) that shows a seismic tomographic cross section. Seismic Tomography is a way of using seismic waves (like X-Rays in a CT scan) to peer into Earth’s interior. Based upon how seismic waves travel at different velocities depending upon the type of material (e.g. oceanic crust or the asthenospheric mantle), we can deduce the location of subducted slabs inside the Earth. To the left of the map is a tomographic cross section with the subducting Sunda plate colored blue as it subducts to the east, forming the Manila Trench. This cross section F-F’ is 2 degrees north of today’s M 6.2 earthquake. Below the cross section is an illustration showing how the authors interpret the subducting slab to be configured beneath the Philippines.
I include some inset figures in the poster.
- Here is the poster from the earthquakes that happened earlier this year.
- Below is a series of figures from Wu et al., 2016). These figures reveal information about the subduction zone forming the Manila Trench west of the northern Philippines. I will include their original figure caption in blockquote beneath the figures.
- Here is a map showing the regional topography/bathymetry, along with the relative plate motions (in the inset map, note the vector for scale).
- This map shows the magnetic anomalies for the crust in the western Pacific. These magnetic anomalies help us interpret the age of the crust and the history of plate motion. As new oceanic crust is formed at mid ocean ridges, when Earth’s magnetic polarity flips, anomalies from parallel to the oceanic ridges. There is an inset map showing the plate age in colors. (Wu et al., 2016)
- Here is a tomographic cross section in the region just north of the 2017.08.11 M 6.2 earthquake. Note the downgoing “Eurasia slab” highlighted showing the subducting Sunda plate. The Sunda plate is part of Eurasia, but is oceanic crust. There is also a larger scale cross section for the Mariana Trench. (Wu et al., 2016)
- Here are some more tomographic cross sections in the region. Cross section E-E’ is south of the 2017.08.11 M 6.2 earthquake and section D-D’ is just to the north of this earthquake. Section D-D’ is probably most representative of the subduction zone near this M 6.2 earthquake. (Wu et al., 2016)
- This figure shows details about the megathrust that forms the Philippine Trench to the southeast of the 2017.08.11 M 6.2 earthquake. I include this figure to show that the Philippine Trench subduction zone is unlikely to be responsible for today’s M 6.2 earthquake. (Wu et al., 2016)
- Here is the money shot, showing the subducting Sunda plate (labeled “Eurasia slab”) beneath the northern Philippines. h/t to JD Dianala for pointing out this figure in a Twitversation online. This is a fantastic paper that discusses the tectonics of the Philippine Sea plate and surrounding regions. (Wu et al., 2016)
- This is a compilation of their (Wu et al., 2016) plate tectonic reconstruction. This is not important to interpret today’s earthquake, but it is interesting to know an alternate view of how the modern plate boundary configuration formed. (Wu et al., 2016)

(a) Present-day Philippine Sea and East Asian tectonic setting. Plate motion azimuths in Figure 1a are shown relative to stable Eurasia from the MORVEL model [deMets et al., 2010]. Paleomagnetic sample locations in Figure 3 are shown by the colored symbols. (b) Present-day differential velocities across the Philippine Sea plate boundaries calculated from MORVEL. The southeast Philippine Sea plate is strongly edge coupled to the Pacific plate through the Caroline Sea, which has Pacific-like velocities. HB, Huatung Basin; AP, Amami Plateau; DR, Daito Ridge; ODR, Oki-Daito Ridge; BR, Benham Rise; KPR, Kyushu-Palau ridge; MS, Molucca Sea minor plate; BH, Bird’s Head minor plate; Hal, Halmahera.

(a) EMAG2 gridded magnetic anomalies for the Philippine Sea and East Asia [Maus et al., 2009]. Plate motion azimuths as in Figure 1. (b) Philippine Sea gridded seafloor spreading model used in this study (modified from Müller et al. [2008] and Seton et al. [2012]). WPB, West Philippine Basin; SB, Shikoku Basin; PVB, Parece Vela Basin; MT, Mariana Trough; DRP, Daito ridges province; PB, Palau Basin; L, Luzon; KPR, Kyushu-Palau ridge; HB, Huatung Basin.

(a) MITP08 tomographic cross section oriented along the mean 0 to 50Ma Pacific convergence direction showing the subvertical Pacific “slab wall” under the central Marianas. (b) Maximum E-W width of the Pacific slab wall anomaly under the northern and central Marianas calculated from a 0% dVp cutoff along three transects. (c) Pacific slab wall from Figure 15a shown undistorted within spherical Earth model. Three possible Pacific slab areas A to C (dashed colored lines) were picked from the tomographic section that were guided by dVp cutoffs of 0.2% to 0%, respectively. We measured unfolded slab lengths between 3041 km and 4447 km for areas A to C using cross-sectional area unfolding (for method, see Figure 8). Our unfolded slab lengths were corrected for PREM density-depth changes [Dziewonski and Anderson, 1981] and assumed an incoming 100 km thick Pacific slab. (d) Total Pacific slab subduction times for slab areas A to C was 48 ± 10 Ma, based on a comparison of unfolded Pacific slab lengths to the Pacific convergence rate at the central Marianas from Seton et al. [2012].

(a to f) Interpreted slabs and mantle structure under East Asia from MITP08 tomography vertical cross sections. The study area is dominated by subhorizontal, relatively lower amplitude detached slabs at 500 to 1100 km depths that we call the East Asian Sea slabs. Inset map shows section locations. Seismicity shown by red dots. AUS, Australian craton; Ayu, deep Ayu Trough slab; BMS, Bismarck Sea; MS, Molucca Sea slab; NH, New Hebrides slab; OR, Ordos block; Pac, Pacific slabs; PP, proto-Pacific slabs; PSCS, proto-South China Sea slabs; PSP, Philippine Sea plate; PT, Philippine Trench slab; Ryu, Philippine Sea Ryukyu slab; SCS, South China Sea and Eurasian slabs; Shk, Philippine Sea Shikoku slab; SMar, southern Marianas detached slab; SolE, Solomon east slab; SolW, Solomon west slab; SolS, Solomon south slab; SS, Solomon Sea plate; Sulu, Sulu Sea slab; Su, Sunda slabs.

Slab constraints for the SW Philippine Sea and surrounding areas. (a) Philippine Trench slab, Molucca Sea slabs, and detached “deep Ayu Trough” midslab maps. (b) Three-dimensional oblique view from west showing projected seismicity within 50 km of the Philippine Trench and Molucca Sea west midslab surfaces. (c) Unfolded Philippine Trench and Molucca Sea slabs colored by their dVp midslab seismic velocities. (d and e) MITP08 vertical tomographic cross sections and Benioff zone seismicity (red spheres) showing the interpreted fast-slab anomalies. Section locations are shown in Figure 21a. Note that the unfolded Molucca Sea slab in Figure 21c was the minimumlength model. A longer unfolded Molucca Sea slab is possible based on possible deeper (>900 km) anomalies in Figure 21b and the slab buckling in Figure 21e. PSP, Philippine Sea plate; Phil, Philippines; MS, Molucca Sea.

Eurasian slab constraints shown by (a) map of Benioff zone seismicity within 50 km of the midslab surface, (b) Eurasia midslab depth map. (c) Unfolded Eurasian slab colored by its intraslab seismic velocity dVp. The unfolded Eurasian slab has a 400 to 500 km E-W width and has an eastern edge that terminates near Ishigaki at the Ryukyu Islands. Similarly, the unfolded northern proto-South China Sea detached slabs shown by the purple dashed line also have a similar eastern limit. This suggests a linked origin, namely, that the South China Sea opened as a back-arc basin through subduction of the proto-South China Sea. (d) Three dimensional visualization of the subvertical Eurasian midslab surface between Taiwan and Palawan. Coastlines in white.

Preferred Philippine Sea plate reconstruction Model 1 showing its origin near the Manus mantle plume (yellow dot). Stippled areas show the unfolded slab constraints from this study. Purple polygons show oceanic plateaus from Ishizuka et al. [2013] and the UTIG University of Texas LIPs database [Coffin, 2011]. HB, Huatung Basin.
- Here is another view of the megathrust at the Manila Trench. This figure shows how the slab is more shallowly dipping in the north and more steeply dipping in the south (where the 2017.08.11 M 6.2 earthquake happened).

- Here is a figure from Wang and Bilek (2014) that shows what proportion of the fault is creeping vs. being seismogenically coupled. Typically, people present figures like this and display the coupling ratio (what % of the plate motion is contributing to elastic strain), but this paper is about creeping faults, so they plot the opposite. One may look at it like this: a 20% creeping ratio = a 80% coupling ratio.

Creeping state and seismicity of the Manila Trench. Megathrust creeping ratio was determined by Hsu et al. (2012) by inverting GPS data from shown sites (triangles); Galgana et al. (2007) reported almost 100% creeping based on similar data.
- This is an interesting figure to compare to the last one. Particularly in panel a, which shows the convergence rate as constrained by Global Positioning Systems (GPS) observations (Hsu et al., 2012). Note how the southern margin has a lower convergence rate (where the megathrust is creeping more).

Plate boundary deformation and trench parallel gravity anomaly along the Manila subduction zone. (a) Black vectors are GPS station velocities in the Sunda fixed reference frame. Error ellipses indicate 95% confidence intervals of GPS velocities. Blue vectors are velocities corrected for fault locking effect on the Philippine Fault (PHF in (b)). The yellow–red color scale indicates plate convergence rate. Bathymetry is shown in grey scale. The inset shows the regional geography with a red box indicating the study area (b) The seismicity is in the time period between 1973 and 2010 from NEIC (the US Geological Survey National Earthquake Information Center). The moment magnitude is in the range between 4.6 and 7.7. Color scale indicates focal depth. (c) The shaded relief topography and estimated free-air TPGA on the Manila subduction zone (Sandwell and Smith, 2009). The color bar indicates the amplitude of TPGA values. The black barbed and dashed lines denote the Manila Trench and 50 km slab iso-depth, respectively. (d) The Bouguer TPGA at the Manila subduction zone.
- 2017.08.11 M 6.2 Philippines
- 2017.04.28 M 6.9 Philippines
- 2017.04.08 M 5.9 Philippines
- 2017.01.10 M 7.3 Celebes Sea
- 2015.03.17 M 6.2 Molucca Sea
- 2014.11.26 M 6.8 Molucca Sea
- 2014.11.21 M 6.5 Molucca Sea
- 2014.11.15 M 7.1 Molucca Sea
Philippines
Earthquake Reports
References:
- Bock et al., 2003. Crustal motion in Indonesia from Global Positioning System measurements in JGR, v./ 108, no. B8, 2367, doi:10.1029/2001JB000324
- Hall, R., 2011. Australia–SE Asia collision: plate tectonics and crustal flow in Hall, R., Cottam, M. A. &Wilson, M. E. J. (eds) The SE Asian Gateway: History and Tectonics of the Australia–Asia Collision. Geological Society, London, Special Publications, 355, 75–109.
- Fan, J-k., Wu, S-g., Spence, G., 2015. Tomographic evidence for a slab tear induced by fossil ridge subduction at Manila Trench, South China Sea in International Geology Review, v. 57, p. 998-1013, DOI: 10.1080/00206814.2014.929054
- Hayes, G.P., Wald, D.J., and Johnson, R.L., 2012. Slab1.0: A three-dimensional model of global subduction zone geometries in, J. Geophys. Res., 117, B01302, doi:10.1029/2011JB008524
- Hsu, Y-J., Yu, S-B., Song, T-R.A., and Bacolcol, T., 2012. Plate coupling along the Manila subduction zone between Taiwan and northern Luzo in Journal of Asian Earth Sciences, v. 51, p. 98-108
- McCaffrey, R., Silver, E.A., and Raitt, R.W., 1980. Crustal Structure of the Molucca Sea Collision Zone, Indonesia in The Tectonic and Geologic Evolution of Southeast Asian Seas and Islands-Geophysical Monograph 23, p. 161-177.
- Noda, A., 2013. Strike-Slip Basin – Its Configuration and Sedimentary Facies in Mechanism of Sedimentary Basin Formation – Multidisciplinary Approach on Active Plate Margins http://www.intechopen.com/books/mechanism-of-sedimentarybasin-formation-multidisciplinary-approach-on-active-plate-margins http://dx.doi.org/10.5772/56593
- Smoczyk, G.M., Hayes, G.P., Hamburger, M.W., Benz, H.M., Villaseñor, Antonio, and Furlong, K.P., 2013. Seismicity of the Earth 1900–2012 Philippine Sea plate and vicinity: U.S. Geological Survey Open-File Report 2010–1083-M, 1 sheet, scale 1:10,000,000.
- Waltham et al., 2008. Basin formation by volcanic arc loading in GSA Special Papers 2008, v. 436, p. 11-26.
- Wang, K., and Bilek, S.L., 2014. Invited review paper: Fault creep caused by subduction of rough seafloor relief in Tectonophysics, v. 610, p./ 1-24.
- Wu, J., J. Suppe, R. Lu, and R. Kanda, 2016. Philippine Sea and East Asian plate tectonics since 52 Ma constrained by new subducted slab reconstruction methods, J. Geophys. Res. Solid Earth, 121, doi:10.1002/2016JB012923.
- Zahirovic et al., 2014. The Cretaceous and Cenozoic tectonic evolution of Southeast Asia in Solid Earth, v. 5, p. 227-273, doi:10.5194/se-5-227-2014.