We just had a small earthquake in northern California. Here is the USGS website for the M = 3.4 earthquake. If you felt it, please go to the USGS “Did You Feel It?” website to fill out a report!
This small earthquake is due to deformation in the downgoing Gorda plate. The lower plate (which is the Juan de Fuca plate in your part of the world) deforms in various ways as it descends.
Today’s M 3.4 does nothing to affect the likelihood of a larger Cascadia subduction zone earthquake. It is simply interesting to those of us who felt it….
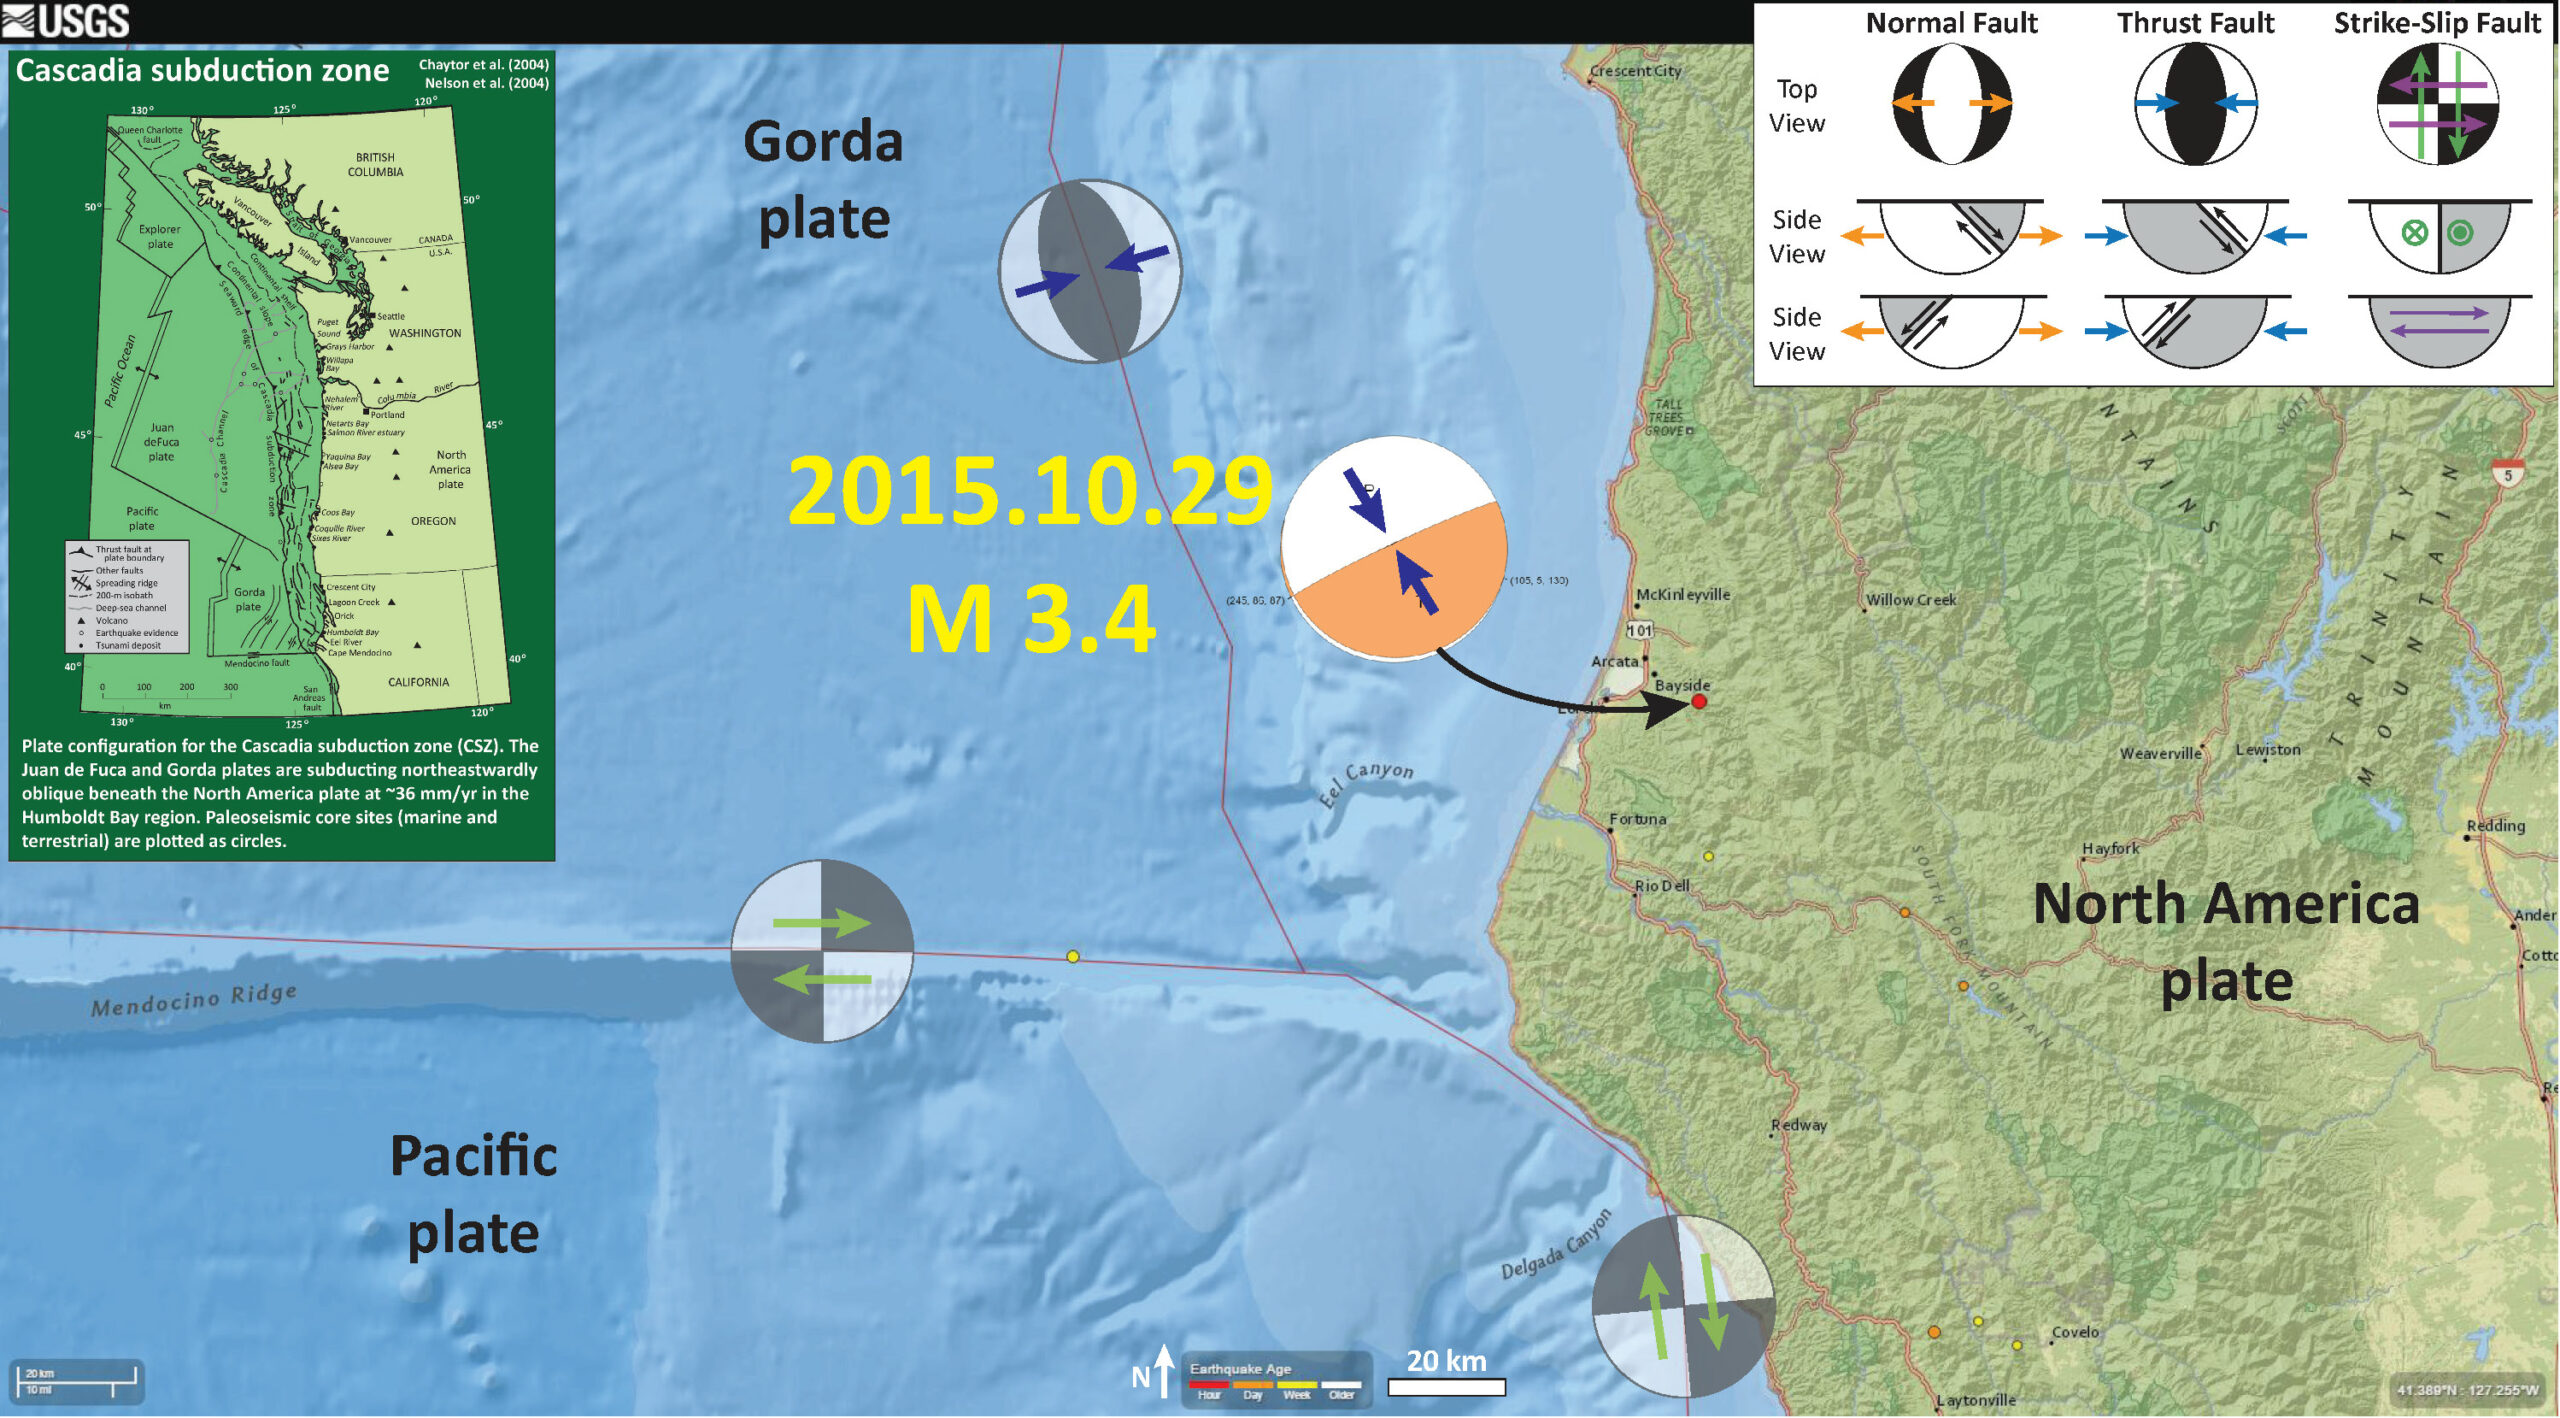
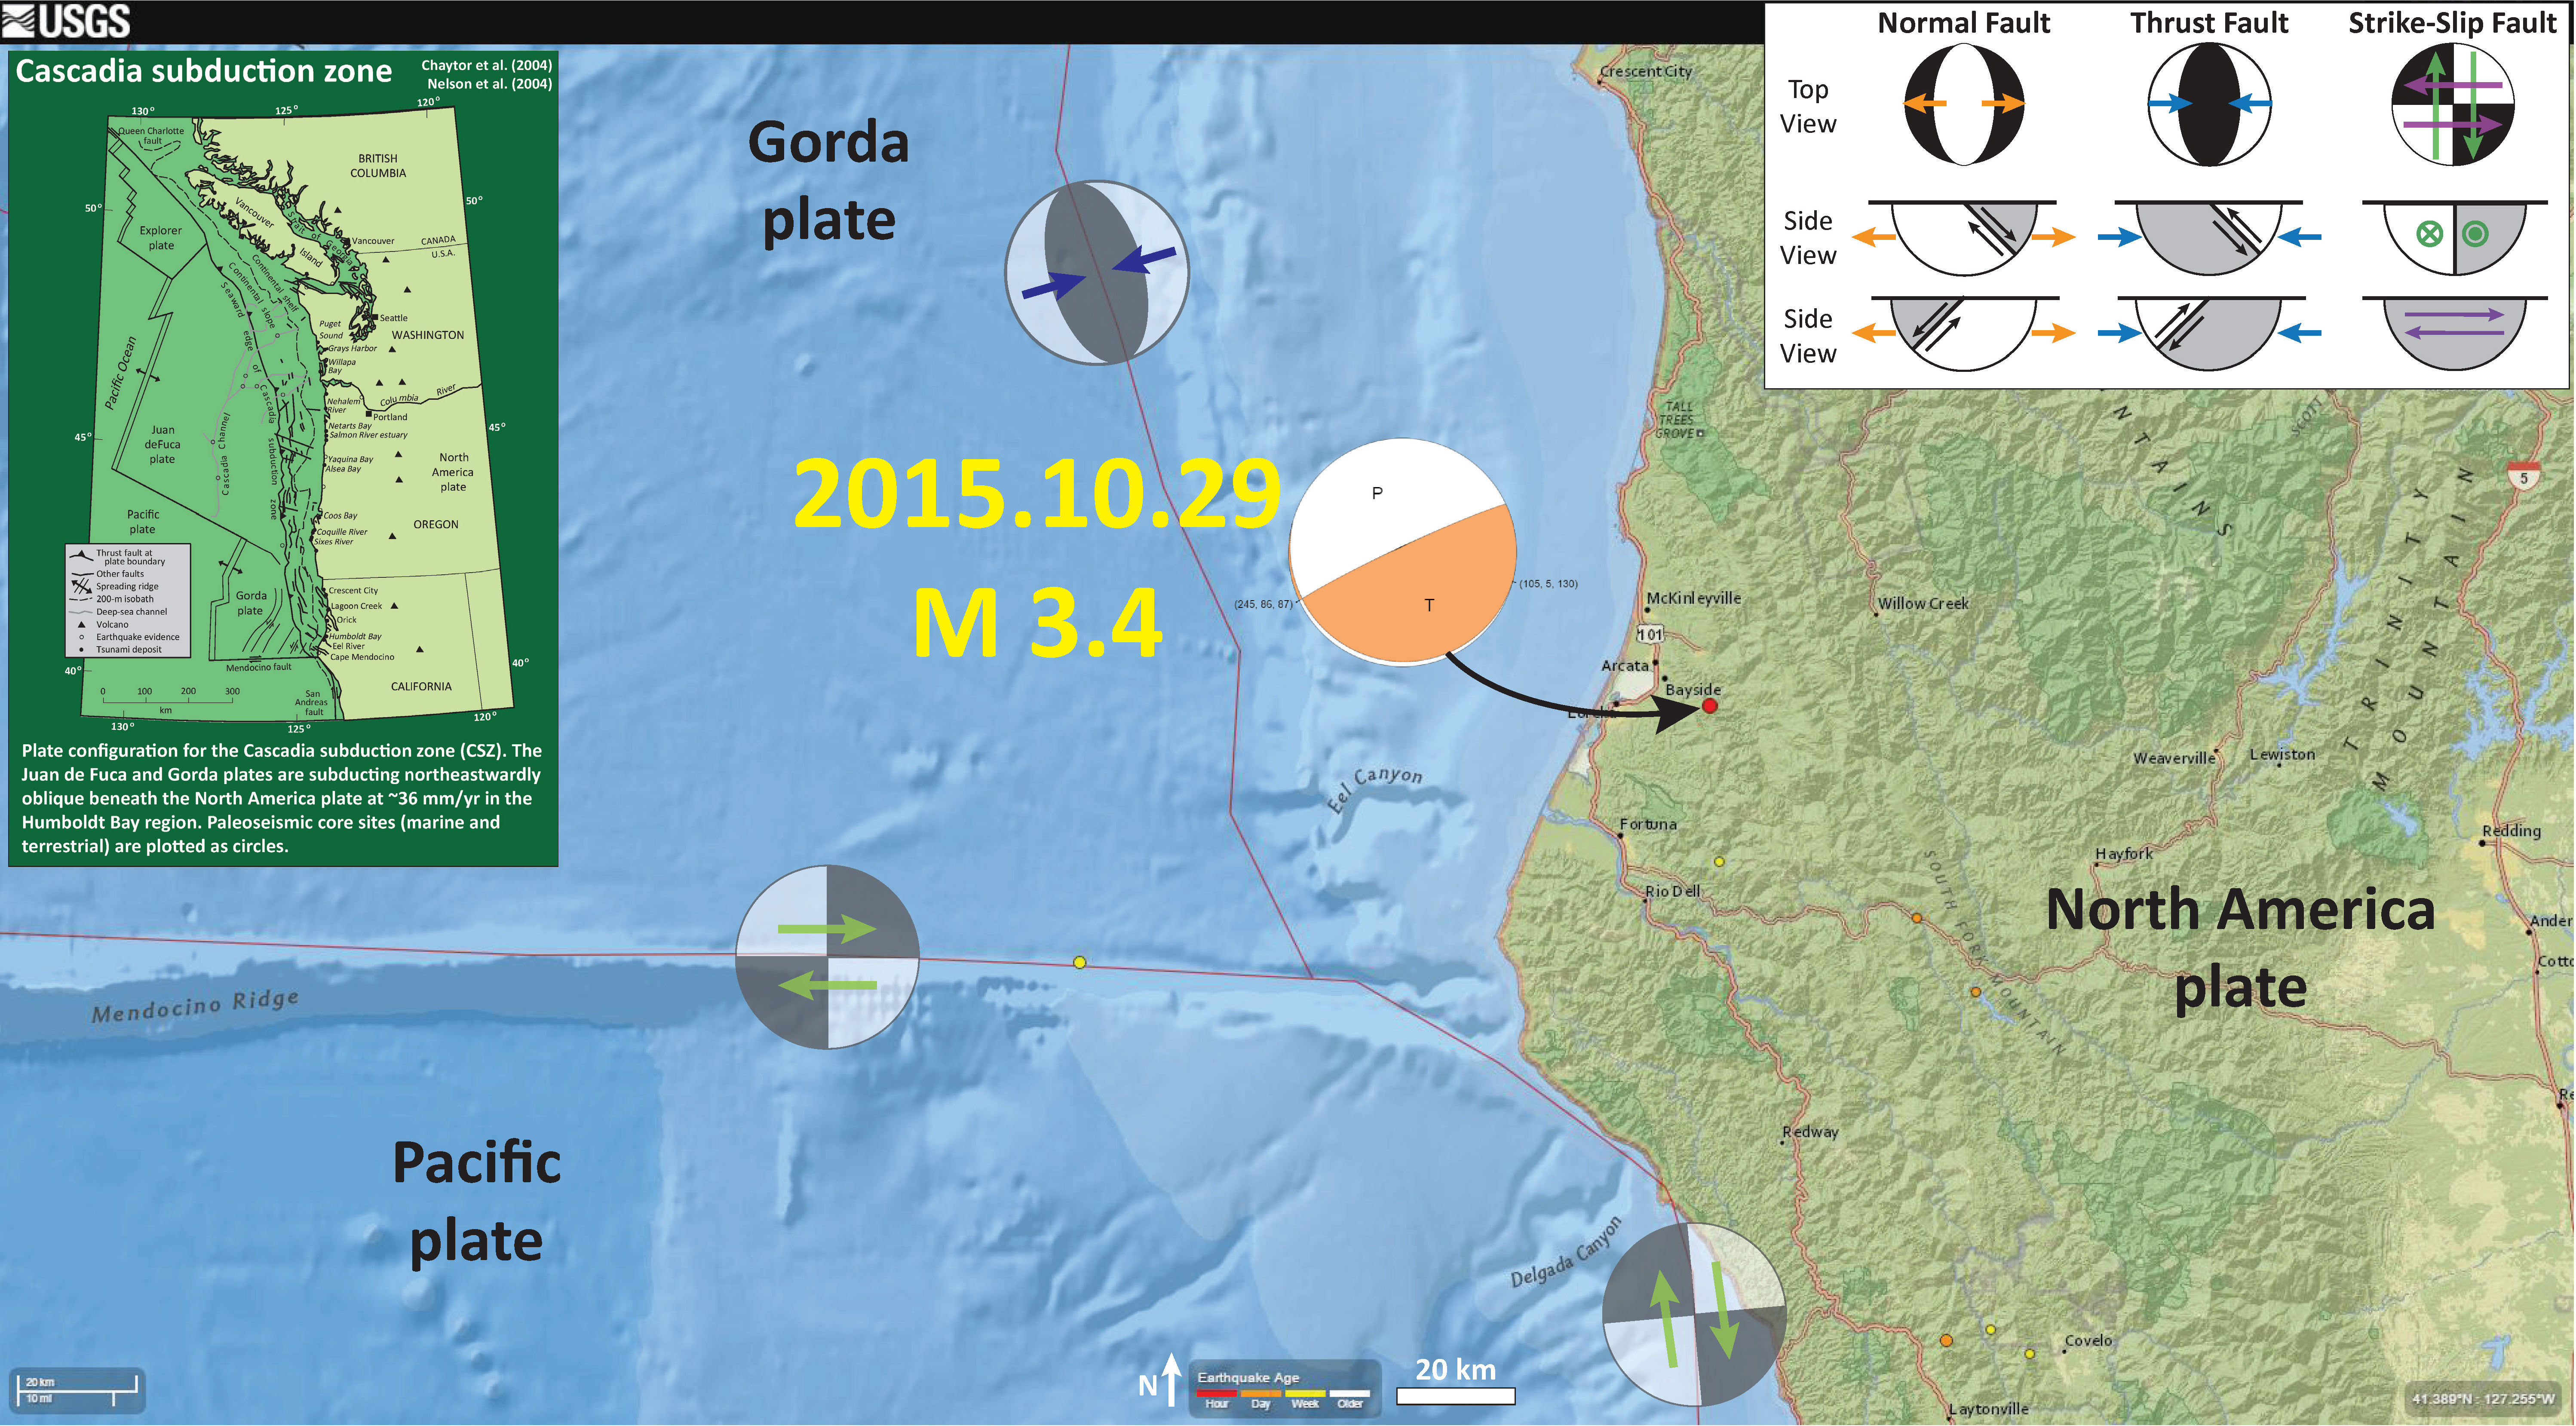
Here is a map showing the epicenter as a small red dot. I placed one of the focal mechanisms on the map. The earthquake strikes east-northeast, oblique to most of the other seismicity. The hypocentral depth plots deeper than the subduction zone fault (which is about 15-20 km in this region), so this earthquake is probably in the Gorda plate.
I placed a moment tensor / focal mechanism legend in the upper right corner of the map. There is more material from the USGS web sites about moment tensors and focal mechanisms (the beach ball symbols). Both moment tensors and focal mechanisms are solutions to seismologic data that reveal two possible interpretations for fault orientation and sense of motion. One must use other information, like the regional tectonics, to interpret which of the two possibilities is more likely.
Provided by Dr. Mark Hemphill-Haley, here is a plot from the new USGS broadband seismometer. From Mark:
Jacob Crummey (USGS) and Steve Tillinghast (HSU) had just completed installation of a new broadband seismometer in Founders Hall. We got the 3 component waveform and it looks great! Top is vertical, middle is horizontal north and bottom is horizontal east.

-
There are several sources of seismicity in northern California, The Cascadia subduction zone, the Gorda plate, the Mendocino fault, the San Andreas fault, the Blanco fracture zone, and within the North America plate. Below are some pages that discuss earthquakes with these different sources.
- 2015.01.28 M 5.7 Mendocino fault
- 2014.03.10 M 6.8 Gorda plate
- 2015.05.26 M 4.3 Gorda plate
- 2015.06.10 M 5.9 Blanco fracture zone
- 2015.04.12 M 4.2 Blanco fracture zone
-
This page has some maps that show earthquake summaries for various sources.
- Gorda plate and Mendocino fault
-
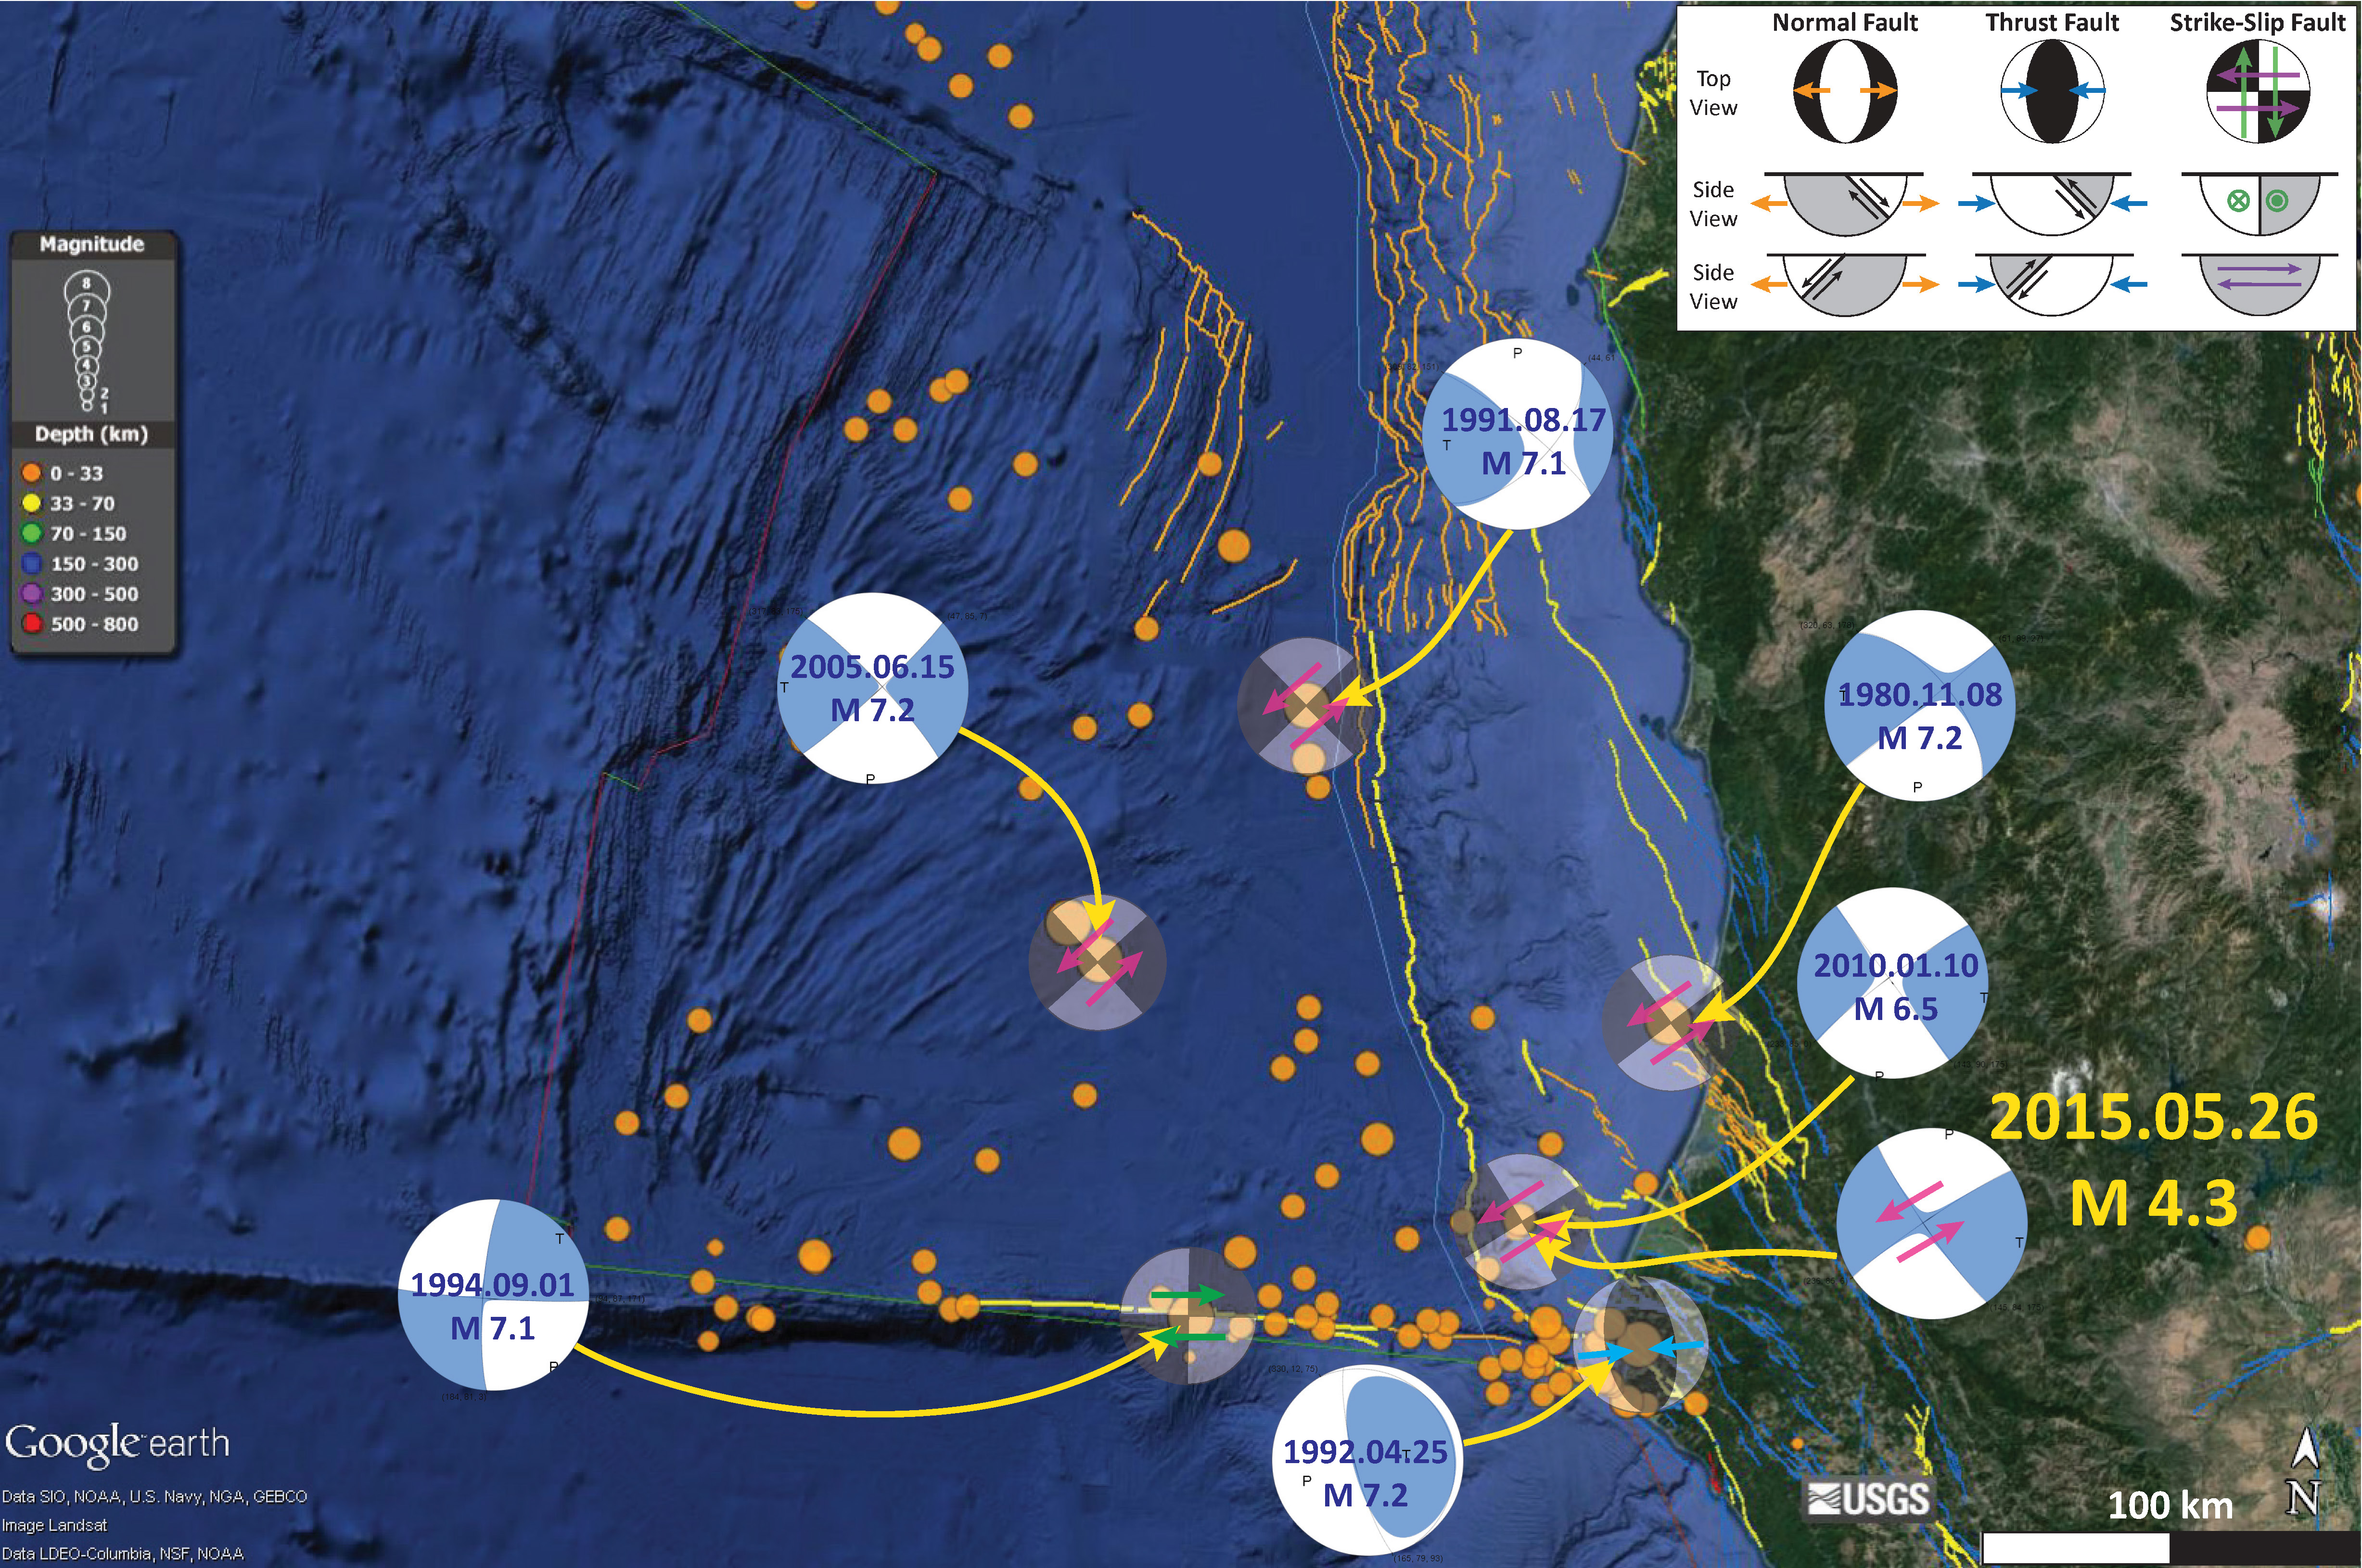
The larger earthquakes plotted in the map below probably do more to load strain along the Cascadia subduction zone fault (than the M 3.4). The map below shows some of these larger magnitude earthquakes. Here is a post about this earthquake from May 2015.
This shows how broadly this M = 3.4 earthquake was felt.
.jpg)
This is a plot showing how the ground motions attenuate (lessen) with distance from the earthquake. The orange line is an estimate of the intensity of ground motions based on a numerical model. This numerical model is based on a regression of hundreds of earthquakes (distance vs. magnitude/intensity). These regressions form the basis for Ground Motion Prediction Equations (GMPEs). The blue dots are the actual observations made by real people (using the DYFI form that I posted above). These model based estimates of ground shaking intensity are used, especially for larger earthquakes, to determine what damage might be expected. See my post about the recent post about the M 7.5 earthquake in Afghanistan, where I show a PAGER report adjacent to the DYFI map. The PAGER report is the report that lists the probable extent of damage to people and their belongings. Aid organizations and governments can estimate what scope disaster efforts might need to be based upon these PAGER reports (note the USAID logo).
.jpg)
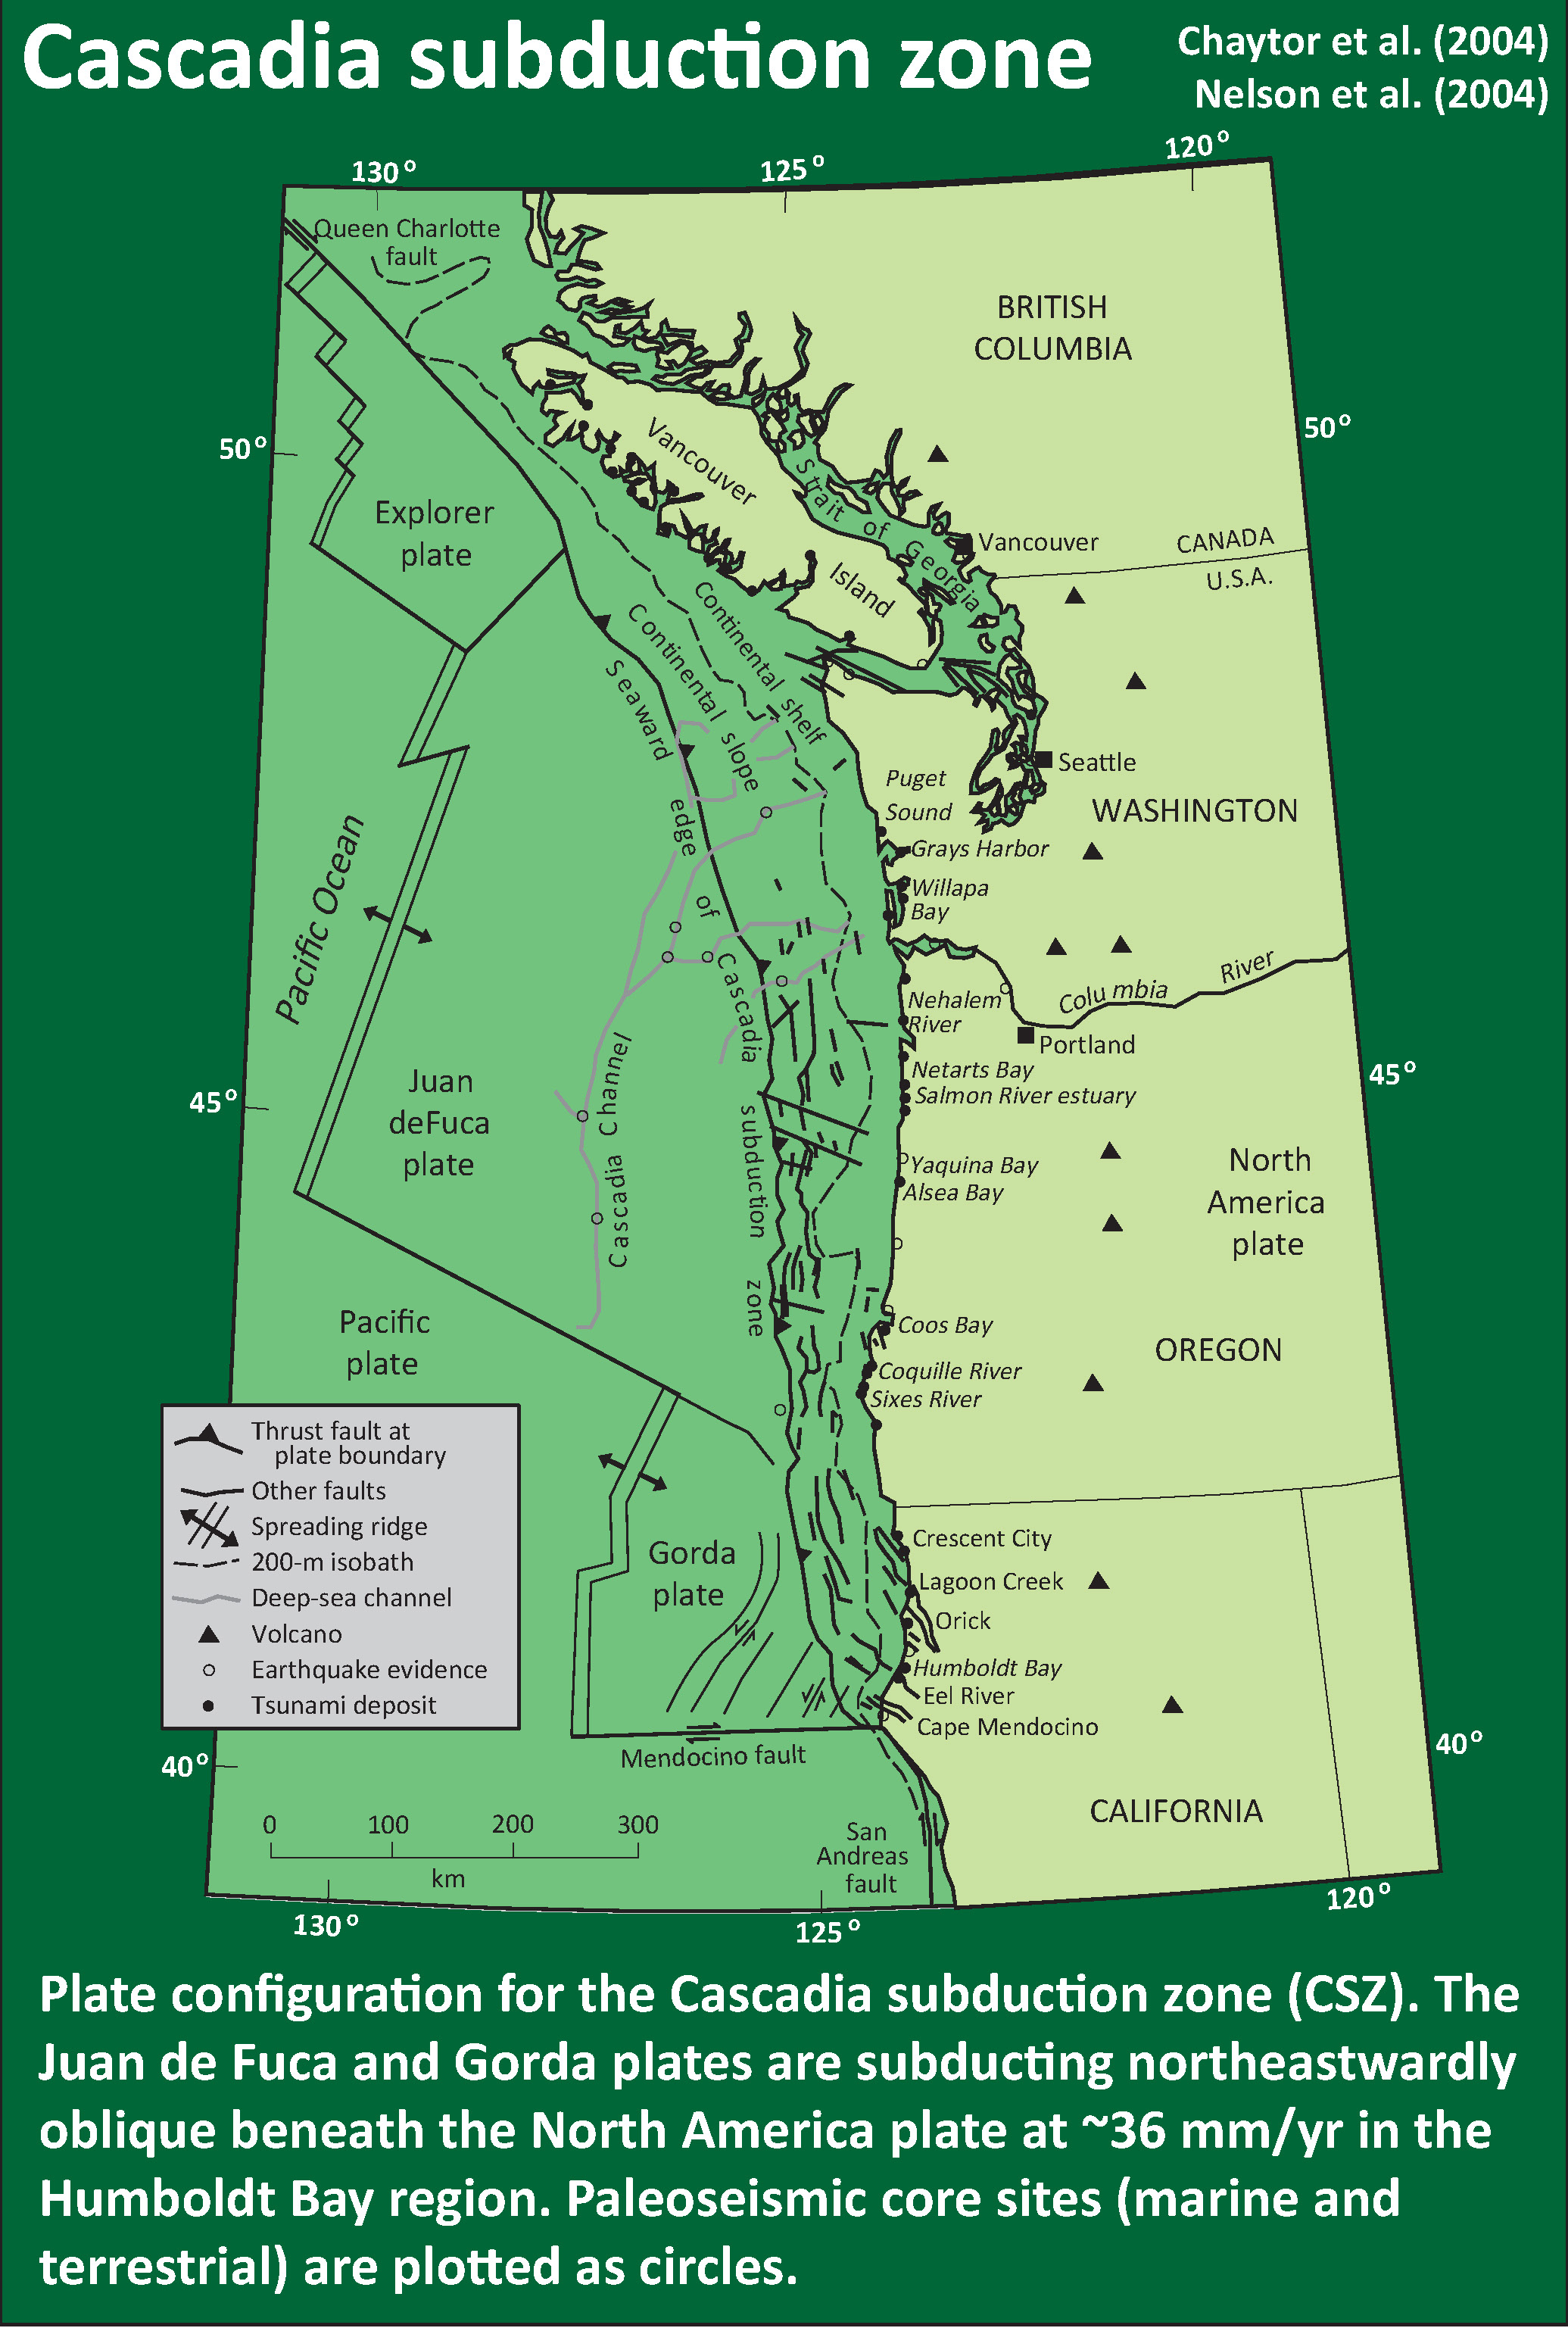
Here is a map of the Cascadia subduction zone, modified from Nelson et al. (2004). The Juan de Fuca and Gorda plates subduct norteastwardly beneath the North America plate at rates ranging from 29- to 45-mm/yr. Sites where evidence of past earthquakes (paleoseismology) are denoted by white dots. Where there is also evidence for past CSZ tsunami, there are black dots. These paleoseismology sites are labeled (e.g. Humboldt Bay). Some submarine paleoseismology core sites are also shown as grey dots. The two main spreading ridges are not labeled, but the northern one is the Juan de Fuca ridge (where oceanic crust is formed for the Juan de Fuca plate) and the southern one is the Gorda rise (where the oceanic crust is formed for the Gorda plate).
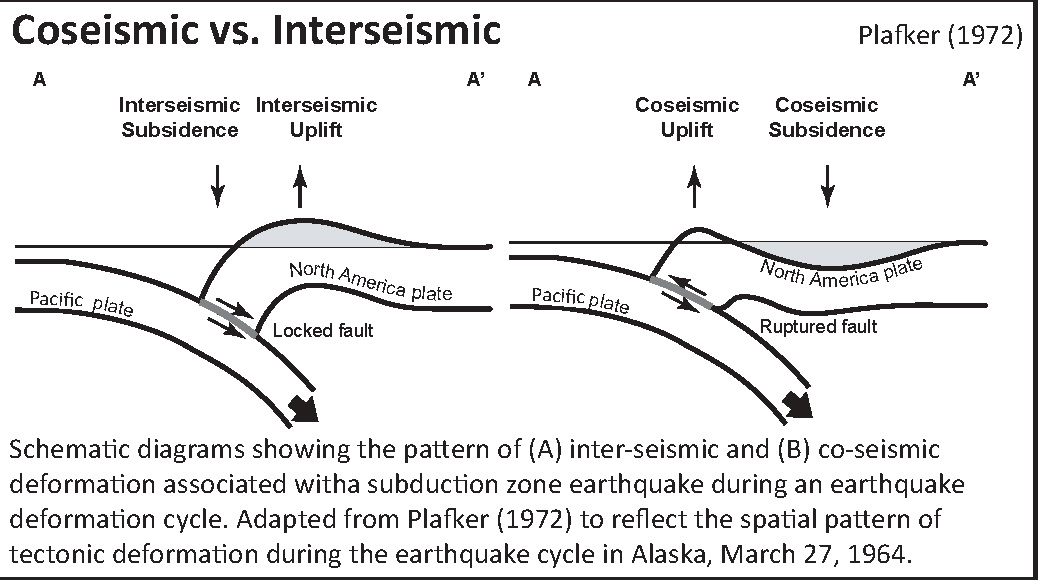
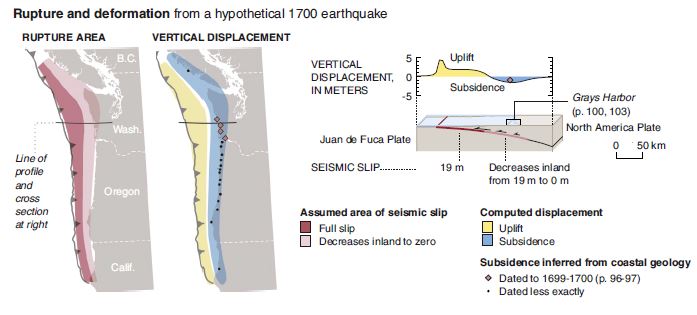
Here is a version of the CSZ cross section alone (Plafker, 1972). This shows two parts of the earthquake cycle: the interseismic part (between earthquakes) and the coseismic part (during earthquakes). Regions that experience uplift during the interseismic period tend to experience subsidence during the coseismic period.
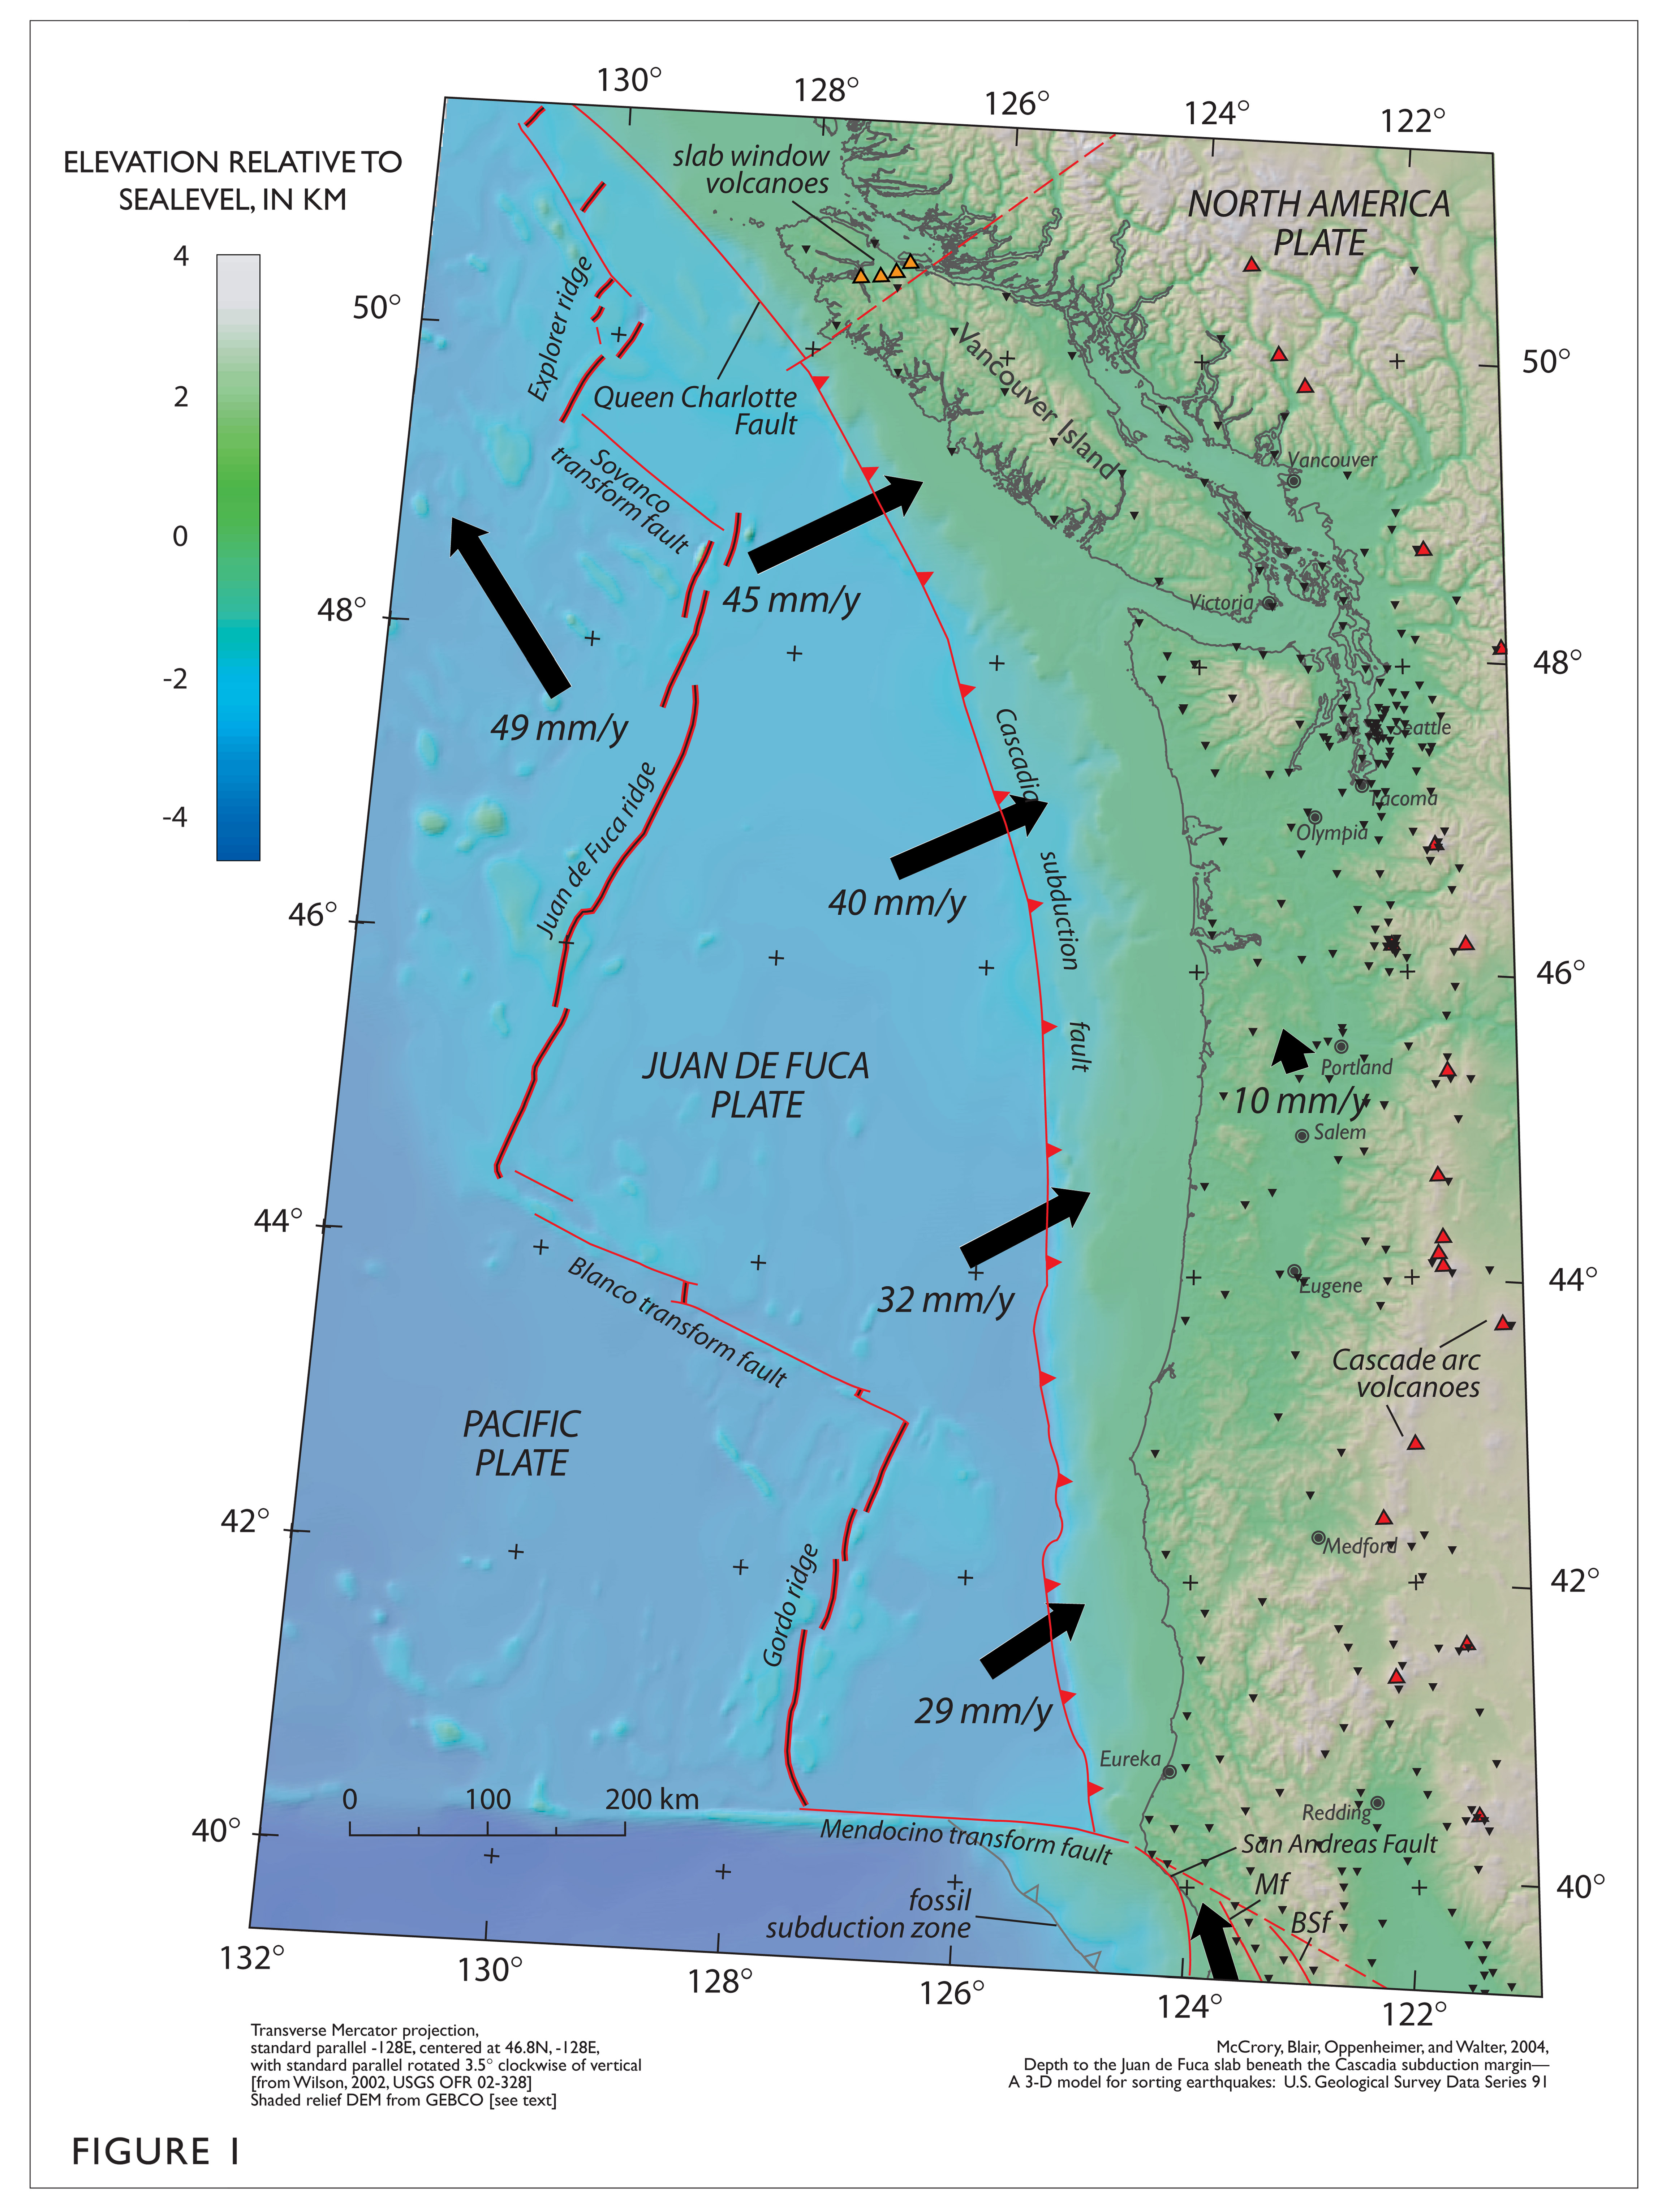
This map (McCrory et al., 2006) shows the secular (ongoing modern) rates of motion for the Juan de Fuca and Gorda plates relative to the North America plate (Wilson, 1998; McCrory, 2000). Red triangles denote active arc volcanoes.
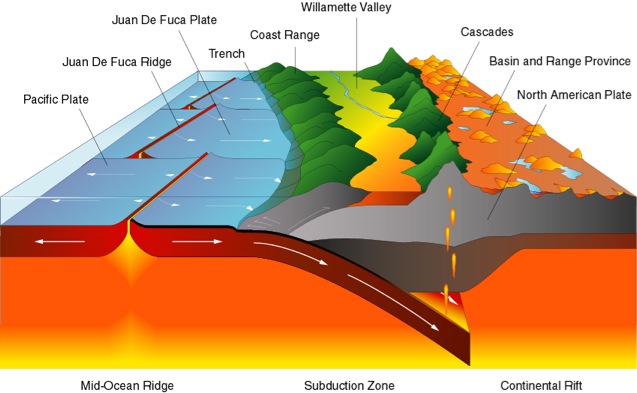
Here is a view of the subduction zone showing the landscape and the plate configuration within the Earth. The cross section is located near the southern Willamette Valley. This is schematic and does not completely match the real geography. Note how the downgoing plate melts and the rising magma leads to volcanism of the Cascade volcanoes (a volcanic arc).
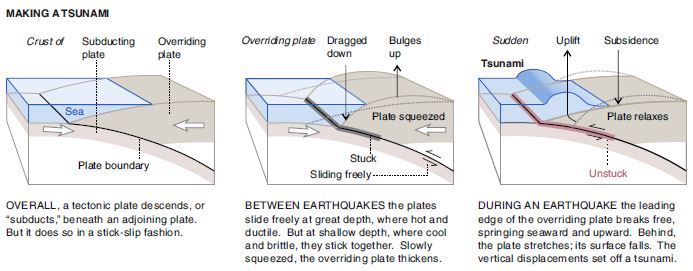
This figure shows how a subduction zone deforms between (interseismic) and during (coseismic) earthquakes. We also can see how a subduction zone generates a tsunami. Atwater et al., 2005.
Here is an animation produced by the folks at Cal Tech following the 2004 Sumatra-Andaman subduction zone earthquake. I have several posts about that earthquake here and here. One may learn more about this animation, as well as download this animation here.
This figure shows the regions that participate in this interseismic and coseismic deformation at Cascadia. Atwater et al., 2005. Black dots on the map show sites where evidence for coseismic subsidence has been found in coastal marshes, lakes, and estuaries.
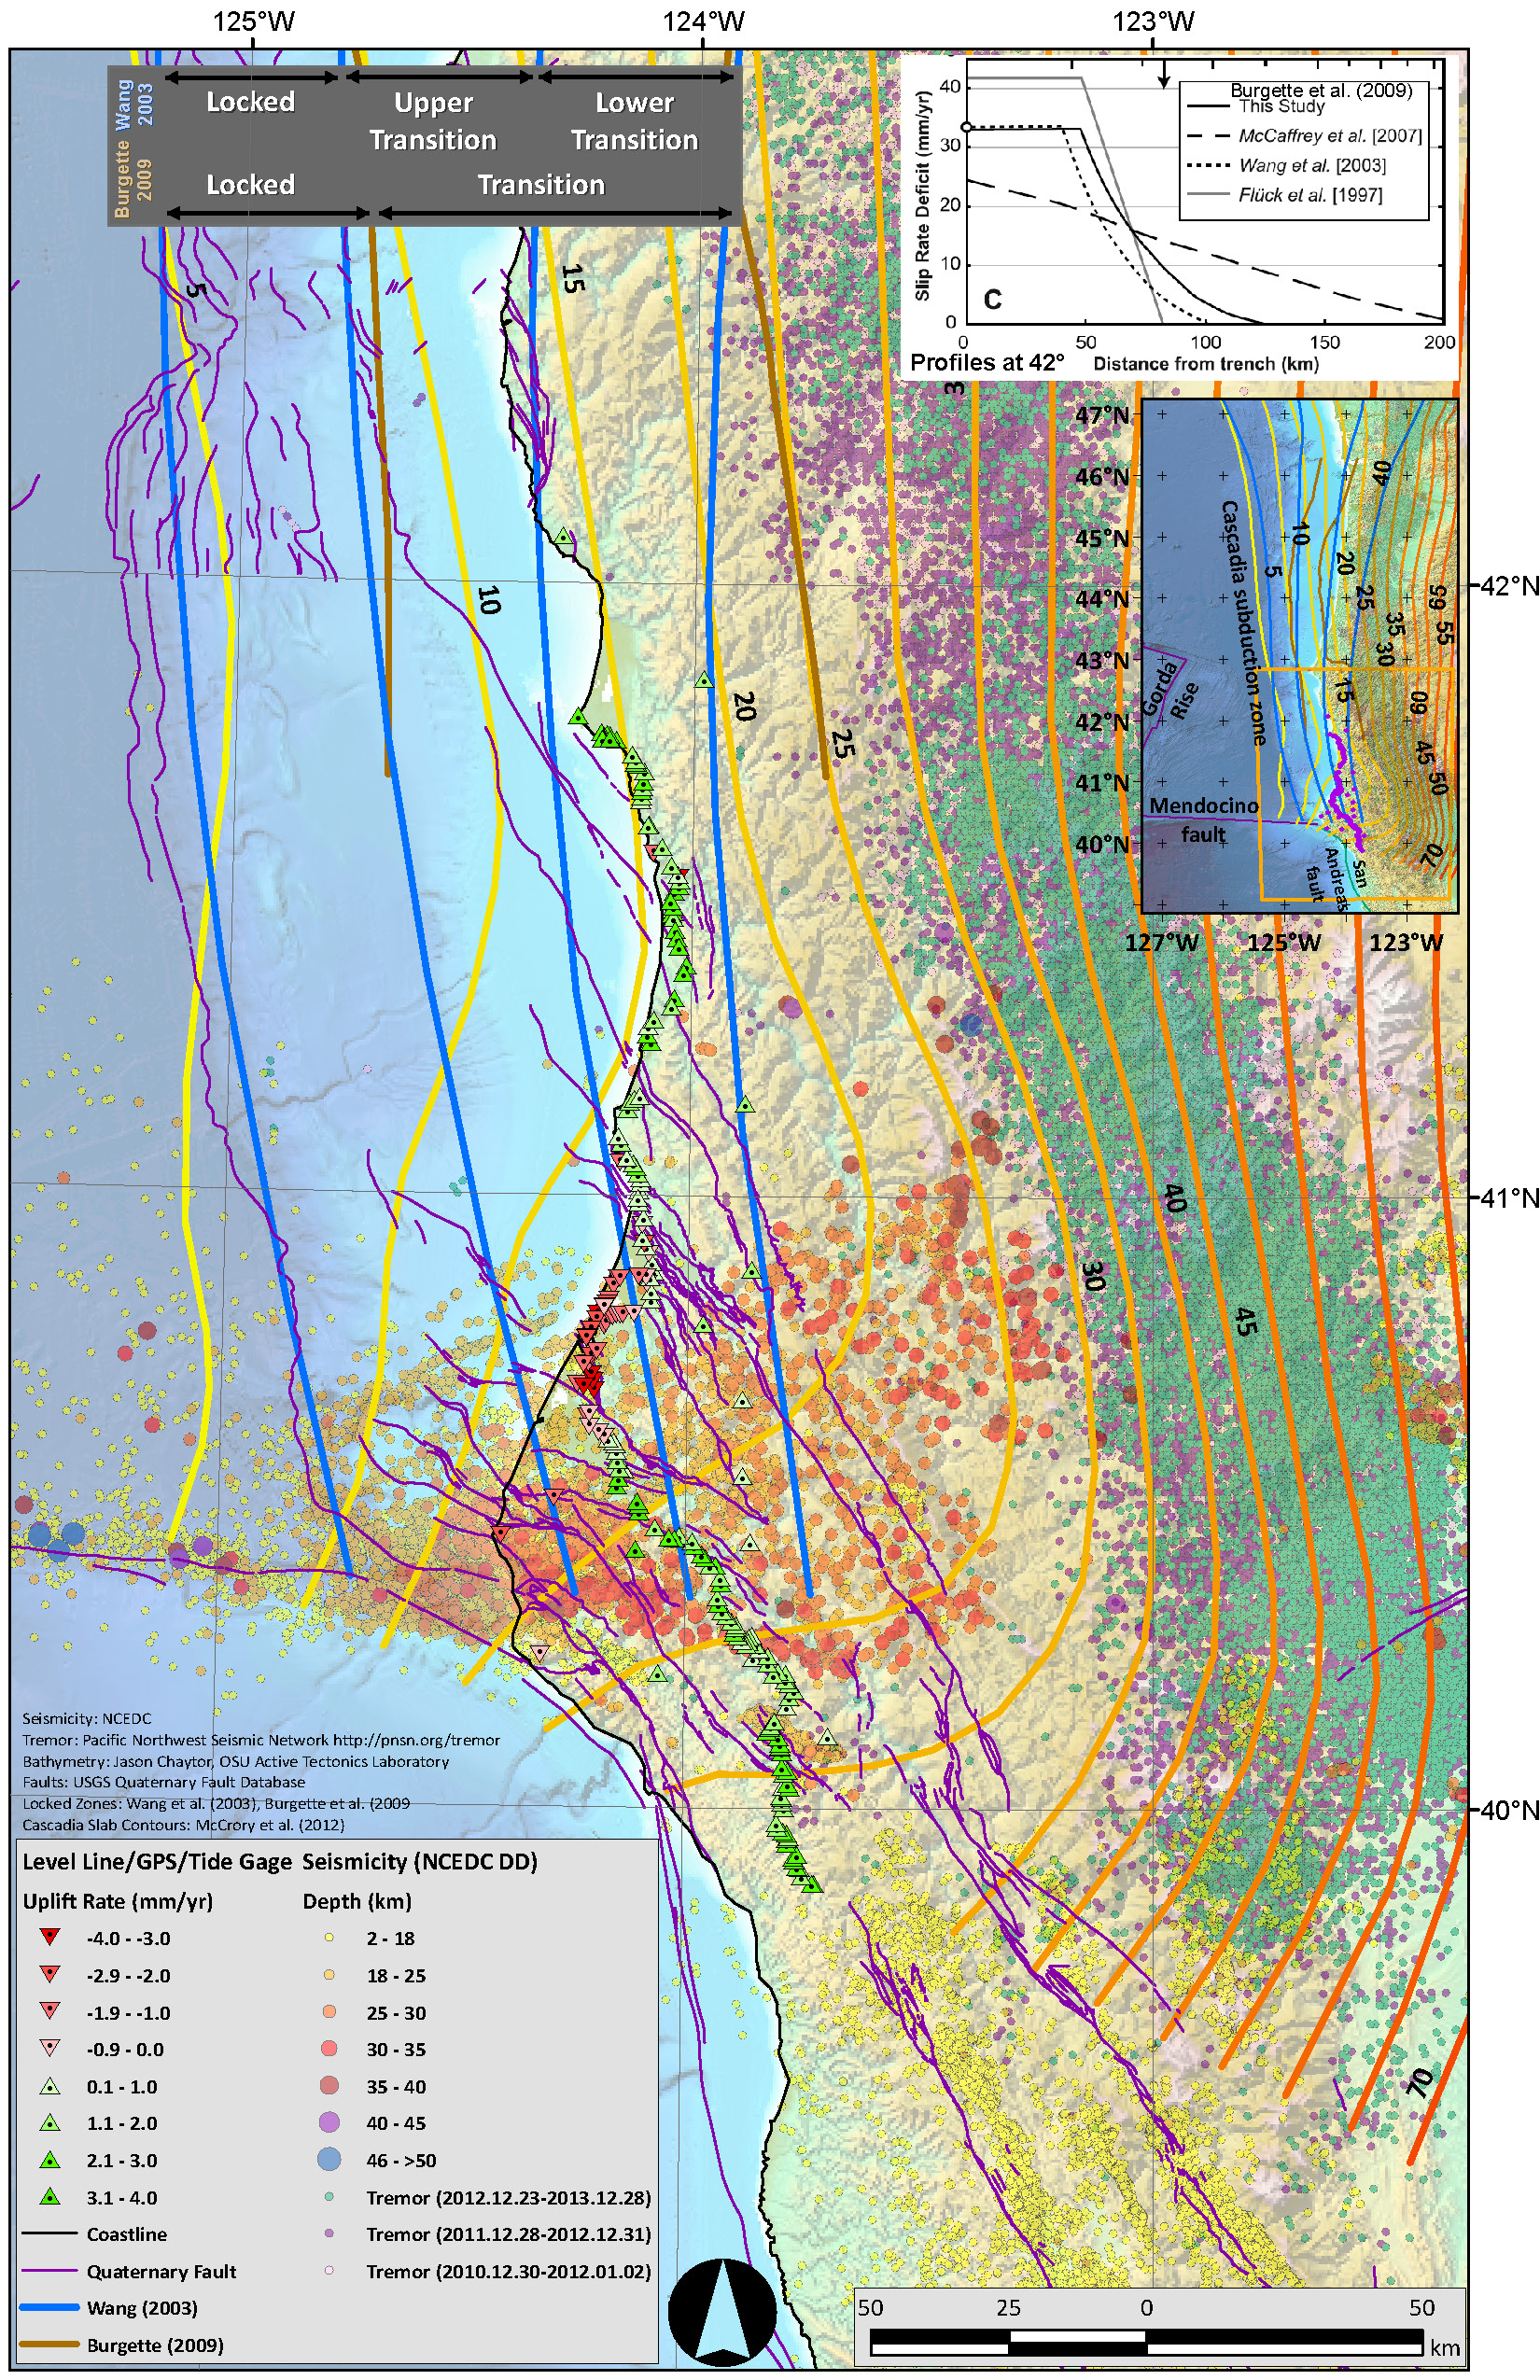
Here is a map showing a number of data sets. Seismicity is plotted versus depth (NCEDC). Tremor is plotted (Pacific Northwest Seismic Network). Vertical Deformation rates are plotted (unpublished). Slab depth contours (km) are plotted (McCrory et al., 2006). Fault locking zones are plotted (Wang et al., 2003; Burgette et al., 2009). Bob McPherson (Humboldt State University, Department of Geology) is currently working on a research paper where he will discuss how the seismicity reveals the location of the seismogenically locked fault zone.
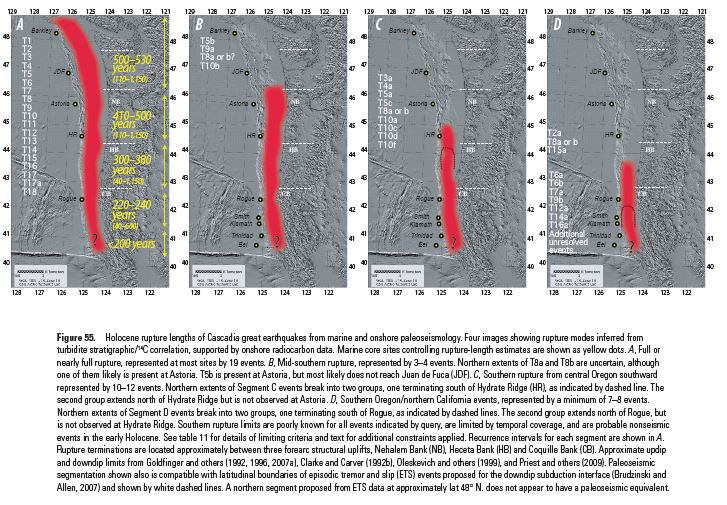
This map shows the various possible prehistoric earthquake rupture regions (patches) for the past 10,000 years. Goldfinger et al., 2012. These rupture scenarios have been adopted by the USGS hazards team that determines the seismic hazards for the USA.
-
References:
- Atwater, B.F., Musumi-Rokkaku, S., Satake, K., Tsuju, Y., Eueda, K., and Yamaguchi, D.K., 2005. The Orphan Tsunami of 1700—Japanese Clues to a Parent Earthquake in North America, USGS Professional Paper 1707, USGS, Reston, VA, 144 pp.
- Burgette, R. et al., 2009. Interseismic uplift rates for western Oregon and along-strike variation in locking on the Cascadia subduction zone in Journal of Geophysical Research, v. 114, B01408, doi:10.1029/2008JB005679
- Chaytor, J.D., Goldfinger, C., Dziak, R.P., and Fox, C.G., 2004. Active deformation of the Gorda plate: Constraining deformation models with new geophysical data: Geology v. 32, p. 353-356
- Goldfinger, C., Nelson, C.H., Morey, A., Johnson, J.E., Gutierrez-Pastor, J., Eriksson, A.T., Karabanov, E., Patton, J., Gràcia, E., Enkin, R., Dallimore, A., Dunhill, G., and Vallier, T., 2012. Turbidite Event History: Methods and Implications for Holocene Paleoseismicity of the Cascadia Subduction Zone, USGS Professional Paper # 1661F. U.S. Geological Survey, Reston, VA, 184 pp.
- McCrory, P. A., Blair, J. L., Oppenheimer, D. H., and Walter, S. R., 2006. Depth to the Juan de Fuca slab beneath the Cascadia subduction margin; a 3-D model for sorting earthquakes U. S. Geological Survey
- Nelson, A.R., Kelsey, H.M., and Witter, R.C., 2006. Great earthquakes of variable magnitude at the Cascadia subduction zone: Quaternary Research, doi:10.1016/j.yqres.2006.02.009, p. 354-365.
- Plafker, G., 1972. Alaskan earthquake of 1964 and Chilean earthquake of 1960: Implications for arc tectonics in Journal of Geophysical Research, v. 77, p. 901-925.
- USGS Quaternary Fault Database: http://earthquake.usgs.gov/hazards/qfaults/
- Wang, K., Wells, R., Mazzotti, S., Hyndman, R. D., and Sagiya, T., 2003. A revised dislocation model of interseismic deformation of the Cascadia subduction zone Journal of Geophysical Research, B, Solid Earth and Planets v. 108, no. 1.
Sitting in Grief group tonight talking about the instability of form.
I was driving. Axis perpendicular to the regional trend. Nearly perfect normal faulting, relatively deep (in the descending slab?) this is an odd bird.
looks more compressional… but i removed the arrows plotted above the focal mechanism… too bad that there is no moment tensor. we would have a better idea.