Well, last weekend I was working on a house, so did not have the time to write this up until now. (2023 update: the magnitude is now M 6.5)
https://earthquake.usgs.gov/earthquakes/eventpage/us700098qd/executive
The eastern Mediterranean Sea region is dominated by plate tectonics (no surprise, right?). The plate boundary fault system that is responsible for this earthquake near Crete is a convergent plate boundary called a subduction zone.
Convergent means that one plate is moving towards another plate. One of the largest plate boundary systems in the world is a convergent plate boundary that extends from between the north side of Australia and Indonesia, through southern Asia forming the Himalayan Mountains, through the Middle East, into Europe and west past the Mediterranean.
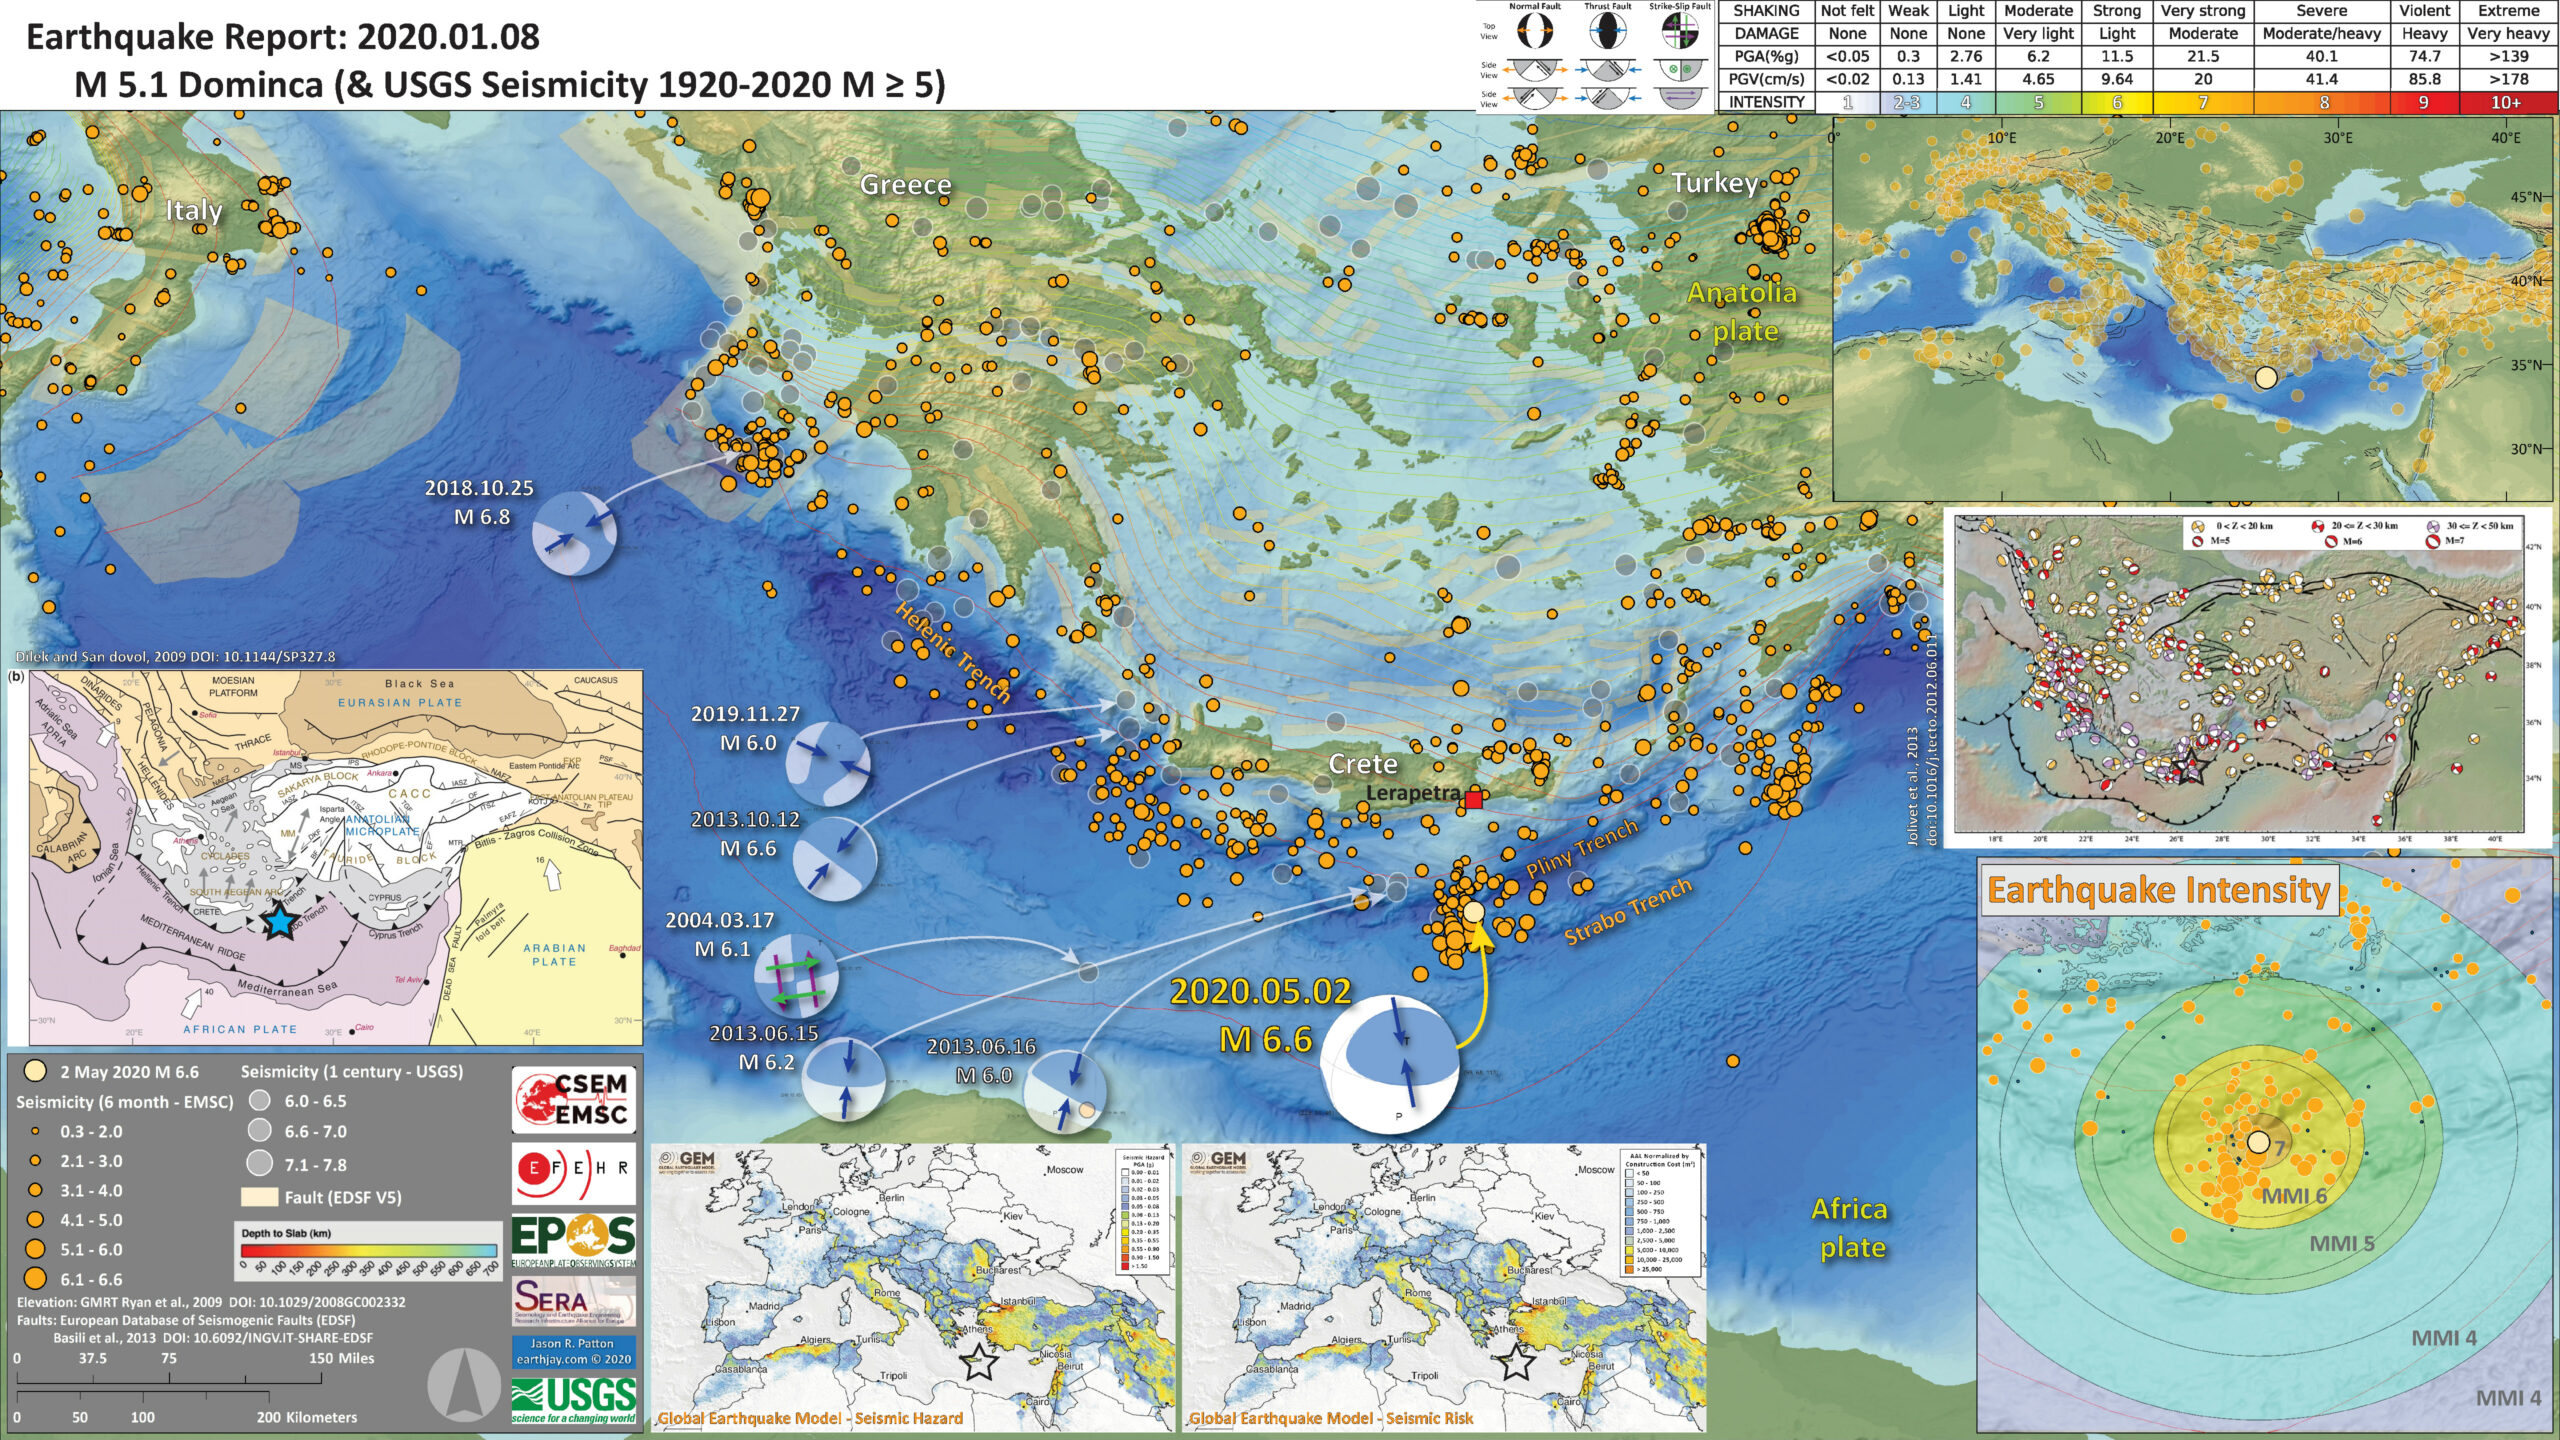
Near Crete the Africa plate is diving (northwards) beneath the Anatolia plate (a sliver of the Eurasia plate). The 2 May magnitude M 6.6 earthquake appears to have been an earthquake on the subduction zone megathrust fault interface (a subduction zone earthquake).
The earthquake was felt across the region with intensity as high as MMI 6 in Crete, to around MMI 4 in Cairo, Egypt.
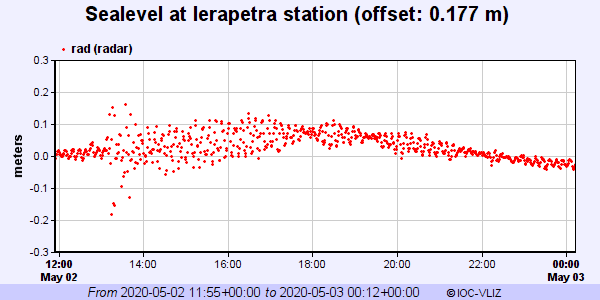
The earthquake even caused a tsunami that was recorded at teh Lerapetra tide gage in Crete, Greece. The wave was small at about 40 cm peak to trough (measured vertically from the highest part of the wave, the peak, to the lowest part of the wave, the trough).
Here are the tide gage data downloaded from the IOC website here. The tsunami starts at around 13:00 hours.
Below is my interpretive poster for this earthquake
- I plot the seismicity from the past 6 months, with diameter representing magnitude (see legend). I include earthquake epicenters from 1920-2020 with magnitudes M ≥ 6.0 in one version.
- I plot the USGS fault plane solutions (moment tensors in blue and focal mechanisms in orange), possibly in addition to some relevant historic earthquakes.
- A review of the basic base map variations and data that I use for the interpretive posters can be found on the Earthquake Reports page.
- Some basic fundamentals of earthquake geology and plate tectonics can be found on the Earthquake Plate Tectonic Fundamentals page.
- In the center left is an inset map from Dilek and Sandovol (2009) that shows the tectonic plates and the plate boundary faults in the region. There is a blue star in the general location of the M 6.6 earthquake.
- In the upper right corner is a smaller scale view of the region with 6 months of seismicity plotted.
- In the lower right corner is a map that shows a model estimate of the shaking intensity from this M 6.6 earthquake.
- Above the intensity map is a map that shows earthquake mechanisms for historic earthquakes in the region.
- In the bottom center are seismic hazard and seismic risk maps for the European area. There is more about hazard and risk later in this report.
I include some inset figures. Some of the same figures are located in different places on the larger scale map below.
- Here is the map with 6 month’s seismicity plotted.

Other Report Pages
Some Relevant Discussion and Figures
- Here is the tectonic map from Dilek and Sandvol (2009).
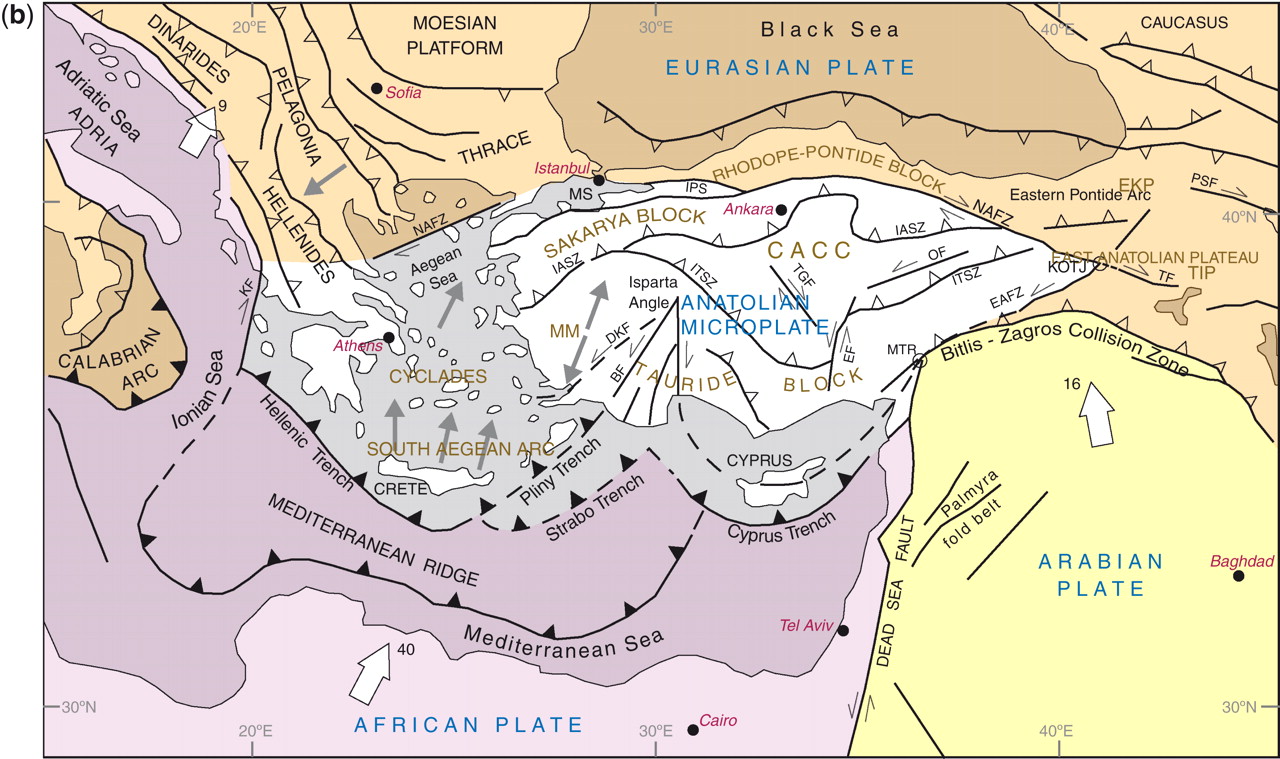
Tectonic map of the Aegean and eastern Mediterranean region showing the main plate boundaries, major suture zones, fault systems and tectonic units. Thick, white arrows depict the direction and magnitude (mm a21) of plate convergence; grey arrows mark the direction of extension (Miocene–Recent). Orange and purple delineate Eurasian and African plate affinities, respectively. Key to lettering: BF, Burdur fault; CACC, Central Anatolian Crystalline Complex; DKF, Datc¸a–Kale fault (part of the SW Anatolian Shear Zone); EAFZ, East Anatolian fault zone; EF, Ecemis fault; EKP, Erzurum–Kars Plateau; IASZ, Izmir–Ankara suture zone; IPS, Intra–Pontide suture zone; ITS, Inner–Tauride suture; KF, Kefalonia fault; KOTJ, Karliova triple junction; MM, Menderes massif; MS, Marmara Sea; MTR, Maras triple junction; NAFZ, North Anatolian fault zone; OF, Ovacik fault; PSF, Pampak–Sevan fault; TF, Tutak fault; TGF, Tuzgo¨lu¨ fault; TIP, Turkish–Iranian plateau (modified from Dilek 2006).
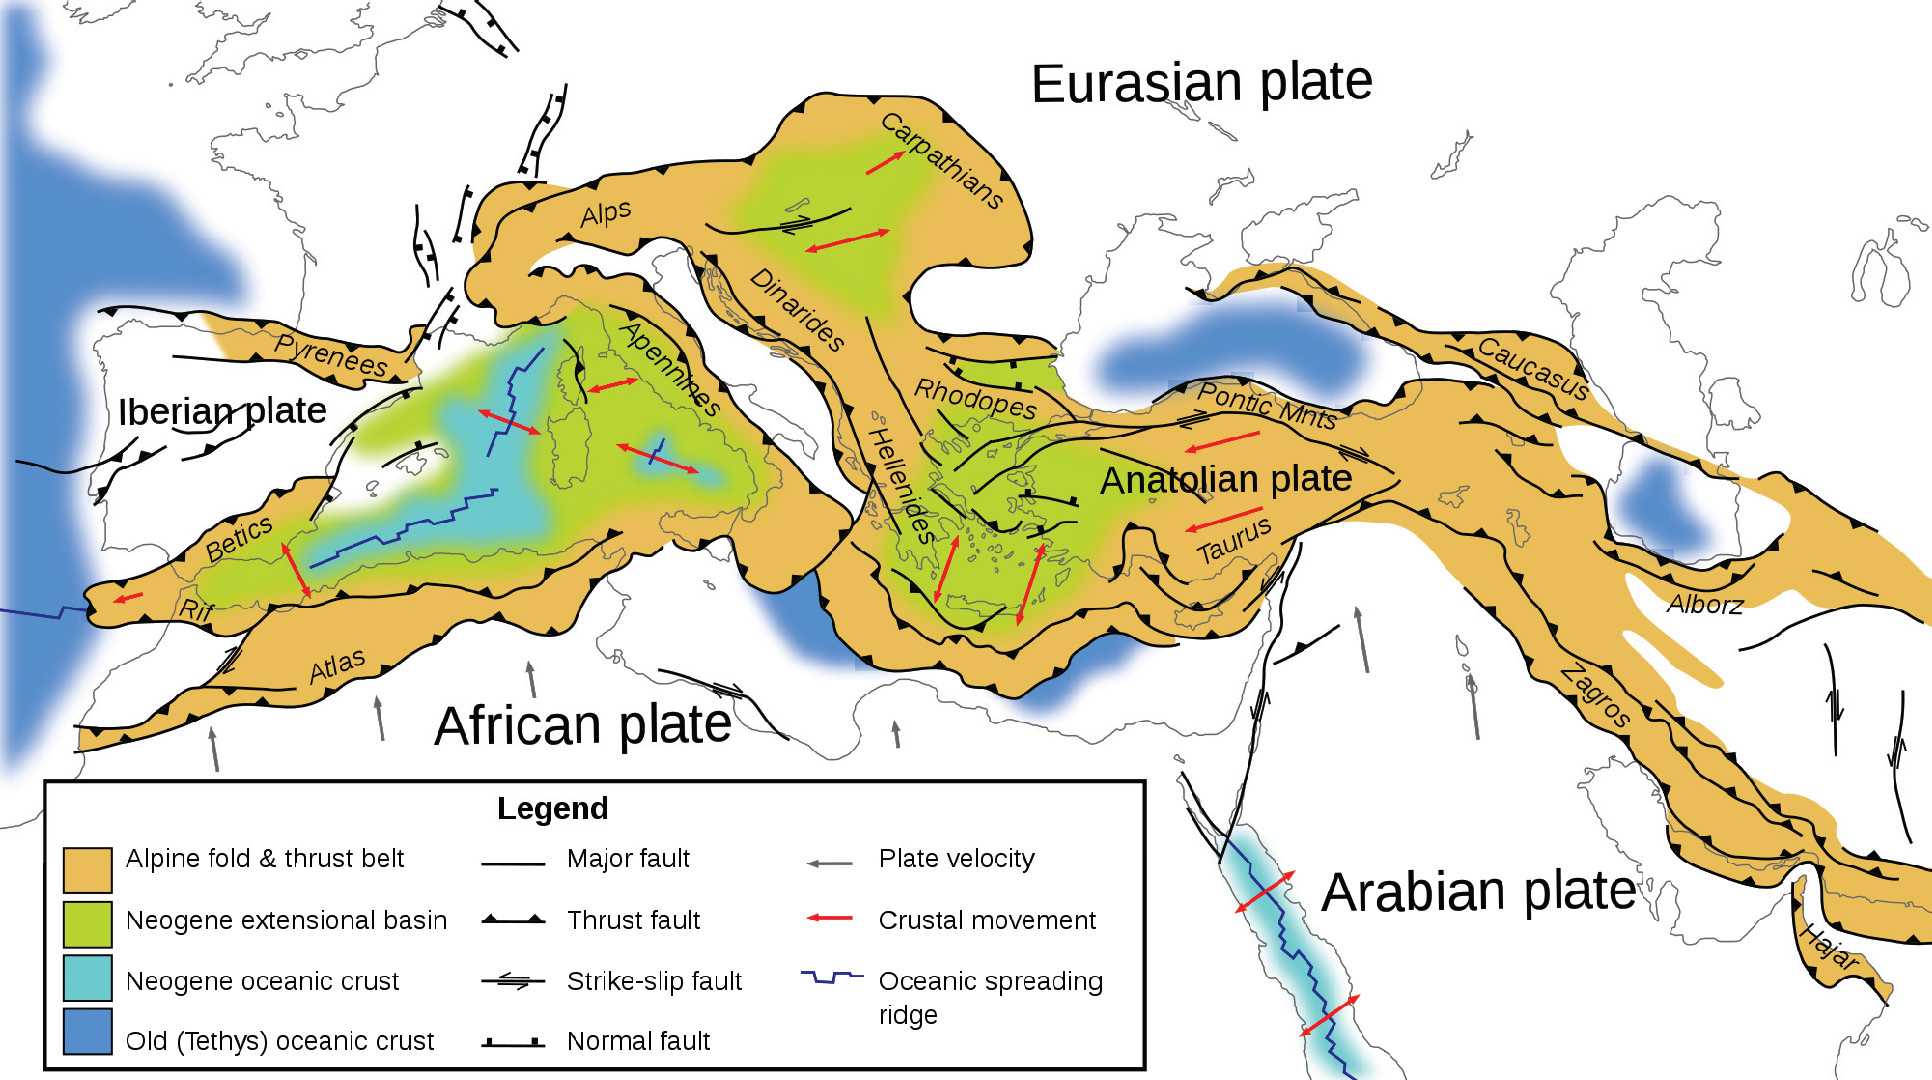
- This is the Wouldloper (2009) tectonic map of the Mediterranean Sea.
- Here is the large scale tectonic setting map (Taymaz et al., 2007) with their figure below.

Summary sketch map of the faulting and bathymetry in the Eastern Mediterranean region, compiled from our observations and those of Le Pichon & Angelier (1981), Taymaz (1990), Taymaz et al. (1990, 1991a, b); S¸arogˇlu et al. (1992), Papazachos et al. (1998), McClusky et al. (2000) and Tan & Taymaz (2006). Large black arrows show relative motions of plates with respect to Eurasia (McClusky et al. 2003). Bathymetry data are derived from GEBCO/97–BODC, provided by GEBCO (1997) and Smith & Sandwell (1997a, b). Shaded relief map derived from the GTOPO-30 Global Topography Data taken after USGS. NAF, North Anatolian Fault; EAF, East Anatolian Fault; DSF, Dead Sea Fault; NEAF, North East Anatolian Fault; EPF, Ezinepazarı Fault; PTF, Paphos Transform Fault; CTF, Cephalonia Transform Fault; PSF, Pampak–Sevan Fault; AS, Apsheron Sill; GF, Garni Fault; OF, Ovacık Fault; MT, Mus¸ Thrust Zone; TuF, Tutak Fault; TF, Tebriz Fault; KBF, Kavakbas¸ı Fault; MRF, Main Recent Fault; KF, Kagˇızman Fault; IF, Igˇdır Fault; BF, Bozova Fault; EF, Elbistan Fault; SaF, Salmas Fault; SuF, Su¨rgu¨ Fault; G, Go¨kova; BMG, Bu¨yu¨k Menderes Graben; Ge, Gediz Graben; Si, Simav Graben; BuF, Burdur Fault; BGF, Beys¸ehir Go¨lu¨ Fault; TF, Tatarlı Fault; SuF, Sultandagˇ Fault; TGF, Tuz Go¨lu¨ Fault; EcF, Ecemis¸ Fau; ErF, Erciyes Fault; DF, Deliler Fault; MF, Malatya Fault; KFZ, Karatas¸–Osmaniye Fault Zone.
- This figure shows GPS velocities in the region (Taymaz et al., 2007).

GPS horizontal velocities and their 95% confidence ellipses in a Eurasia-fixed reference frame for the period 1988–1997 superimposed on a shaded relief map derived from the GTOPO-30 Global Topography Data taken after USGS. Bathymetry data are derived from GEBCO/97–BODC, provided by GEBCO (1997) and Smith & Sandwell (1997a, b). Large arrows designate generalized relative motions of plates with respect to Eurasia (in mm a21) (recompiled after McClusky et al. 2000). NAF, North Anatolian Fault; EAF, East Anatolian Fault; DSF, Dead Sea Fault; NEAF, North East Anatolian Fault; EPF, Ezinepazarı Fault; CTF, Cephalonia Transform Fault; PTF, Paphos Transform Fault; CMT, Caucasus Main Thrust; MRF, Main Recent Fault.
- Finally their summary figure showing the tectonic regimes (Taymaz et al., 2007).

Schematic map of the principal tectonic settings in the Eastern Mediterranean. Hatching shows areas of coherent motion and zones of distributed deformation. Large arrows designate generalized regional motion (in mm a21) and errors (recompiled after McClusky et al. (2000, 2003). NAF, North Anatolian Fault; EAF, East Anatolian Fault; DSF, Dead Sea Fault; NEAF, North East Anatolian Fault; EPF, Ezinepazarı Fault; CTF, Cephalonia Transform Fault; PTF, Paphos Transform Fault.
- This is a tectonic summary figure from Kokkalas et al. (2006).

Simplified map showing the main structural features along the Hellenic arc and trench system, as well as the main active structures in the Aegean area. The mean GPS horizontal velocities in the Aegean plate, with respect to a Eurasia-fixed reference frame, are shown (after Kahle et al., 1998; McClusky et al., 2000). The lengths of vectors are
proportional to the amount of movement. The thick black arrows indicate the mean motion vectors of the plates. The polygonal areas on the map (dashed lines) define the approximate borders of the five different structural regions discussed in the text. The borders between structural regions are not straightforward, and wide transitional zones probably exist between them. The inset shows a schematic map with the geodynamic framework in the eastern Mediterranean area (modified from McClusky et al., 2000). DSF—Dead Sea fault; EAF—East Anatolia fault; HT—Hellenic trench; KFZ— Kefallonia fault zone; MRAC—Mediterranean Ridge accretionary complex; NAF—North Anatolia fault; NAT—North Aegean trough.
- The following three figures are from Dilek and Sandvol, 2006. The locations of the cross sections are shown on the map as orange lines. Cross section G-G’ is located in the region of today’s earthquake.
- Here is the map (Dilek and Sandvol, 2006). I include the figure caption below in blockquote.
- Here are cross sections A-D (Dilek and Sandvol, 2006). I include the figure caption below in blockquote.
- (A) Eastern Alps. The collision of Adria with Europe produced a bidivergent crustal architecture with both NNW- and SSE-directed nappe structures that involved Tertiary molasse deposits, with deep-seated thrust faults that exhumed lower crustal rocks. The Austro-Alpine units north of the Peri-Adriatic lineament represent the allochthonous outliers of the Adriatic upper crust tectonically resting on the underplating European crust. The Penninic ophiolites mark the remnants of the Mesozoic ocean basin (Meliata). The Oligocene granitoids between the Tauern window and the Peri-Adriatic lineament represent the postcollisional intrusions in the eastern Alps. Modified from Castellarin et al. (2006), with additional data from Coward and Dietrich (1989); Lüschen et al. (2006); Ortner et al. (2006).
- (B) Northern Apennines. Following the collision of Adria with the Apenninic platform and Europe in the late Miocene, the westward subduction of the Adriatic lithosphere and the slab roll-back (eastward) produced a broad extensional regime in the west (Apenninic back-arc extension) affecting the Alpine orogenic crust, and also a frontal thrust belt to the east. Lithospheric-scale extension in this broad back-arc environment above the west-dipping Adria lithosphere resulted in the development of a large boudinage structure in the European (Alpine) lithosphere. Modified from Doglioni et al. (1999), with data from Spakman and Wortel (2004); Zeck (1999).
- (C) Western Mediterranean–Southern Apennines–Calabria. The westward subduction of the Ionian seafloor as part of Adria since ca. 23 Ma and the associated slab roll-back have induced eastward-progressing extension and lithospheric necking through time, producing a series of basins. Rifting of Sardinia from continental Europe developed the Gulf of Lion passive margin and the Algero-Provencal basin (ca. 15–10 Ma), then the Vavilov and Marsili sub-basins in the broader Tyrrhenian basin to the east (ca. 5 Ma to present). Eastward-migrating lithospheric-scale extension and
necking and asthenospheric upwelling have produced locally well-developed alkaline volcanism (e.g., Sardinia). Slab tear or detachment in the Calabria segment of Adria, as imaged through seismic tomography (Spakman and Wortel, 2004), is probably responsible for asthenospheric upwelling and alkaline volcanism in southern Calabria and eastern Sicily (e.g., Mount Etna). Modified from Séranne (1999), with additional data from Spakman et al. (1993); Doglioni et al. (1999); Spakman and Wortel (2004); Lentini et al. (this volume). - (D) Southern Apennines–Albanides–Hellenides. Note the break where the Adriatic Sea is located between the western and eastern sections along this traverse. The Adria plate and the remnant Ionian oceanic lithosphere underlie the Apenninic-Maghrebian orogenic belt. The Alpine-Tethyan and Apulian platform units are telescoped along ENE-vergent thrust faults. The Tyrrhenian Sea opened up in the latest Miocene as a back-arc basin behind the Apenninic-Maghrebian mountain belt. The Aeolian volcanoes in the Tyrrhenian Sea represent the volcanic arc system in this subduction-collision zone environment. Modified from Lentini et al. (this volume). The eastern section of this traverse across the Albanides-Hellenides in the northern Balkan Peninsula shows a bidivergent crustal architecture, with the Jurassic Tethyan ophiolites (Mirdita ophiolites in Albania and Western Hellenic ophiolites in Greece) forming the highest tectonic nappe, resting on the Cretaceous and younger flysch deposits of the Adria affinity to the west and the Pelagonia affinity to the east. Following the emplacement of the Mirdita- Hellenic ophiolites onto the Pelagonian ribbon continent in the Early Cretaceous, the Adria plate collided with Pelagonia-Europe obliquely starting around ca. 55 Ma. WSW-directed thrusting, developed as a result of this oblique collision, has been migrating westward into the peri-Adriatic depression. Modified from Dilek et al. (2005).
- (E) Dinarides–Pannonian basin–Carpathians. The Carpathians developed as a result of the diachronous collision of the Alcapa and Tsia lithospheric blocks, respectively, with the southern edge of the East European platform during the early to middle Miocene (Nemcok et al., 1998; Seghedi et al., 2004). The Pannonian basin evolved as a back-arc basin above the eastward retreating European platform slab (Royden, 1988). Lithospheric-scale necking and boudinage development occurred synchronously with this extension and resulted in the isolation of continental fragments (e.g., the Apuseni mountains) within a broadly extensional Pannonian basin separating the Great Hungarian Plain and the Transylvanian subbasin. Steepening and tearing of the west-dipping slab may have caused asthenospheric flow and upwelling, decompressional melting, and alkaline volcanism (with an ocean island basalt–like mantle source) in the Eastern Carpathians. Modified from Royden (1988), with additional data from Linzer (1996); Nemcok et al. (1998); Doglioni et al. (1999); Seghedi et al. (2004).
- (F) Arabia-Eurasia collision zone and the Turkish-Iranian plateau. The collision of Arabia with Eurasia around 13 Ma resulted in (1) development of a thick orogenic crust via intracontinental convergence and shortening and a high plateau and (2) westward escape of a lithospheric block (the Anatolian microplate) away from the collision front. The Arabia plate and the Bitlis-Pütürge ribbon continent were probably amalgamated earlier (ca. the Eocene) via a separate collision event within the Neo-Tethyan realm. BSZ—Bitlis suture zone; EKP—Erzurum-Kars plateau. A slab break-off and the subsequent removal of the lithospheric mantle (lithospheric delamination) beneath the eastern Anatolian accretionary complex caused asthenospheric upwelling and extensive melting, leading to continental volcanism and regional uplift, which has contributed to the high mean elevation of the Turkish-Iranian plateau. The Eastern Turkey Seismic Experiment results have shown that the crustal thickness here is ~ 45–48 km and that the Turkish-Iranian plateau is devoid of mantle lithosphere. The collision-induced convergence has been accommodated by active diffuse north-south shortening and oblique-slip faults dispersing crustal blocks both to the west and the east. The late Miocene through Plio-Quaternary volcanism appears to have become more alkaline toward the south in time. The Pleistocene Karacadag shield volcano in the Arabian foreland represents a local fissure eruption associated with intraplate extension. Data from Pearce et al. (1990); Keskin (2003); Sandvol et al. (2003); S¸engör et al. (2003).
- (G) Africa-Eurasia collision zone and the Aegean extensional province. The African lithosphere is subducting beneath Eurasia at the Hellenic trench. The Mediterranean Ridge represents a lithospheric block between the Africa and Eurasian plate (Hsü, 1995). The Aegean extensional province straddles the Anatolide-Tauride and Sakarya continental blocks, which collided in the Eocene. NAF—North Anatolian fault. South-transported Tethyan ophiolite nappes were derived from the suture zone between these two continental blocks. Postcollisional granitic intrusions (Eocone and Oligo-Miocene, shown in red) occur mainly north of the suture zone and at the southern edge of the Sakarya continent. Postcollisional volcanism during the Eocene–Quaternary appears to have migrated southward and to have changed from calc-alkaline to alkaline in composition through time. Lithospheric-scale necking, reminiscent of the Europe-Apennine-Adria collision system, and associated extension are also important processes beneath the Aegean and have resulted in the exhumation of core complexes, widespread upper crustal attenuation, and alkaline and mid-ocean ridge basalt volcanism. Slab steepening and slab roll-back appear to have been at work resulting in subduction zone magmatism along the Hellenic arc.

Simplified tectonic map of the Mediterranean region showing the plate boundaries, collisional zones, and directions of extension and tectonic transport. Red lines A through G show the approximate profile lines for the geological traverses depicted in Figure 2. MHSZ—mid-Hungarian shear zone; MP—Moesian platform; RM—Rhodope massif; IAESZ— Izmir-Ankara-Erzincan suture zone; IPS—Intra-Pontide suture zone; ITS—inner Tauride suture zone; NAFZ—north Anatolian fault zone; KB—Kirsehir block; EKP—Erzurum-Kars plateau; TIP—Turkish-Iranian plateau.


Simplified tectonic cross-sections across various segments of the broader Alpine orogenic belt.
- Here is another cross section that shows the temporal evolution of the tectonics of this region in the area of cross section G-G’ above (Dilek and Sandvol, 2009).
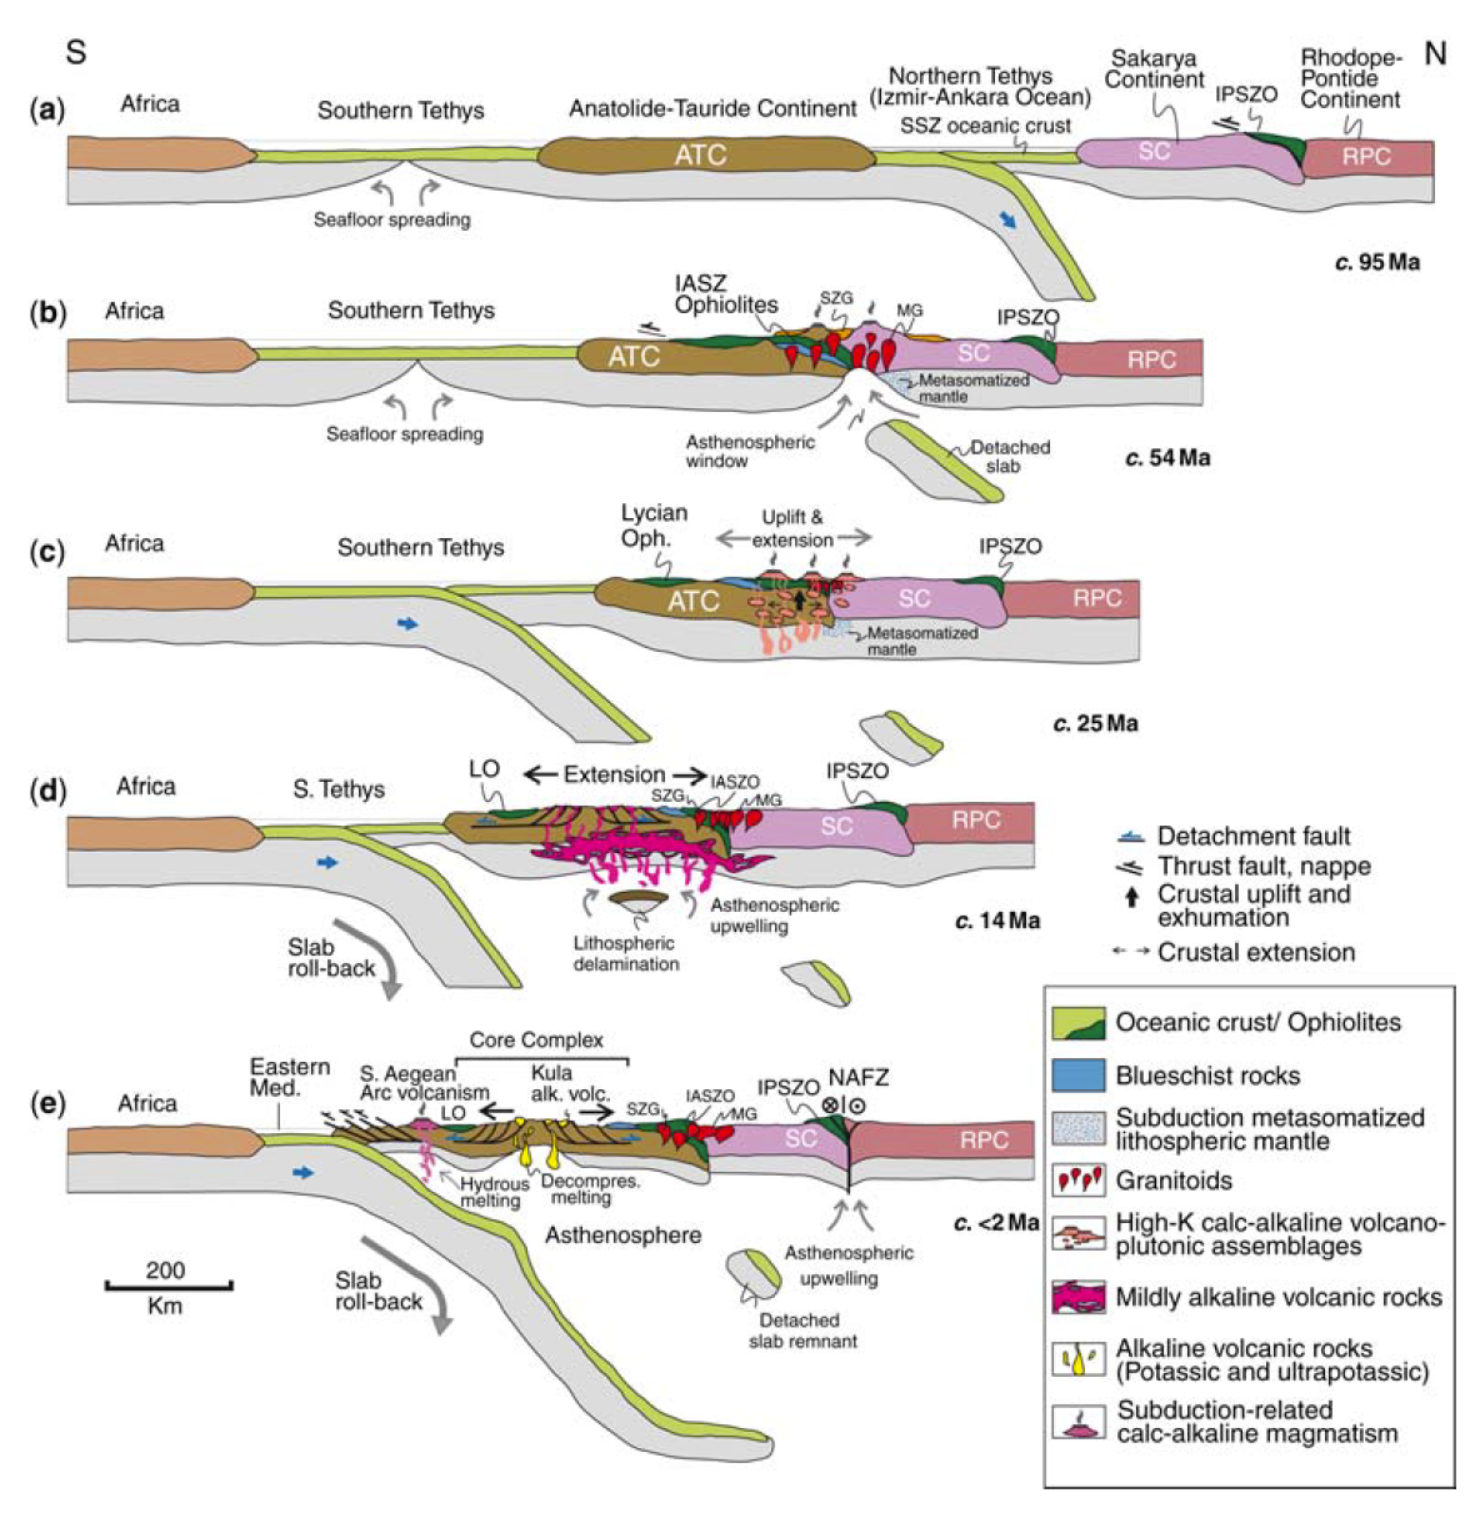
Late Mesozoic–Cenozoic geodynamic evolution of the western Anatolian orogenic belt as a result of collisional
and extensional processes in the upper plate of north-dipping subduction zone(s) within the Tethyan realm. See text
for discussion.
- Here is the map showing the historic earthquake mechanisms from Jolivet et al. (2013).

Focal mechanisms of earthquakes over the Aegean Anatolian region.
Seismic Hazard and Seismic Risk
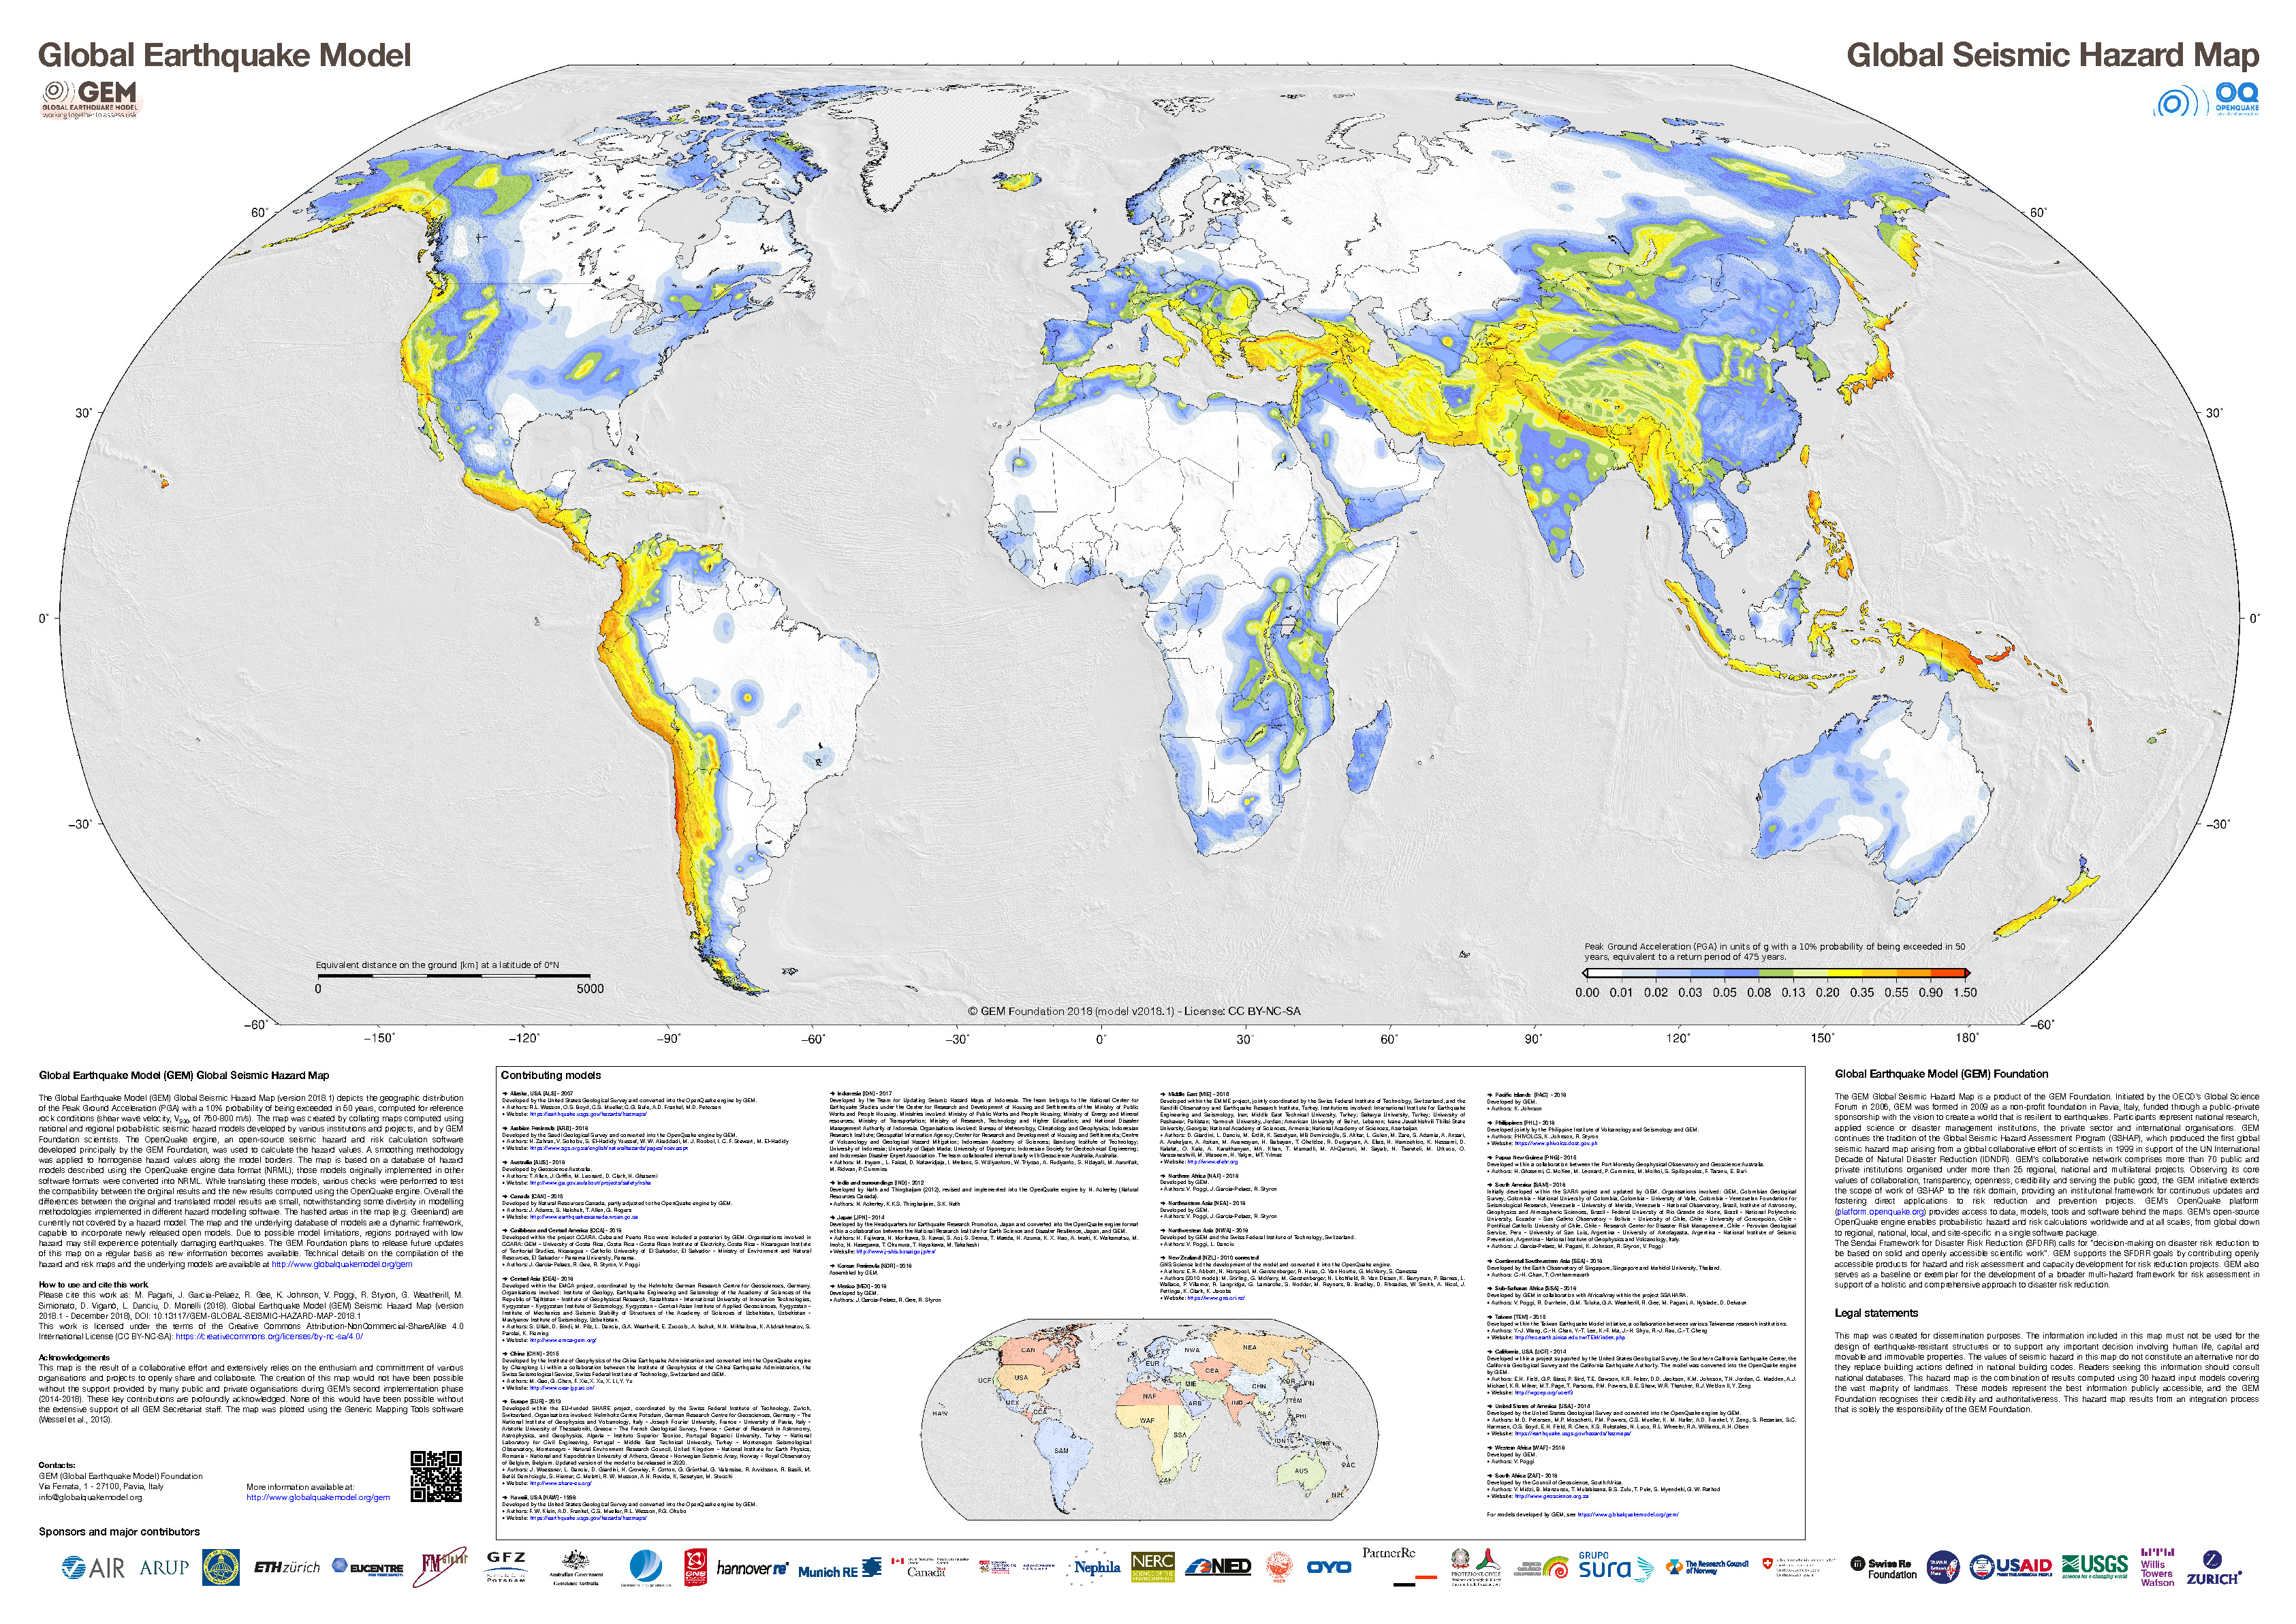
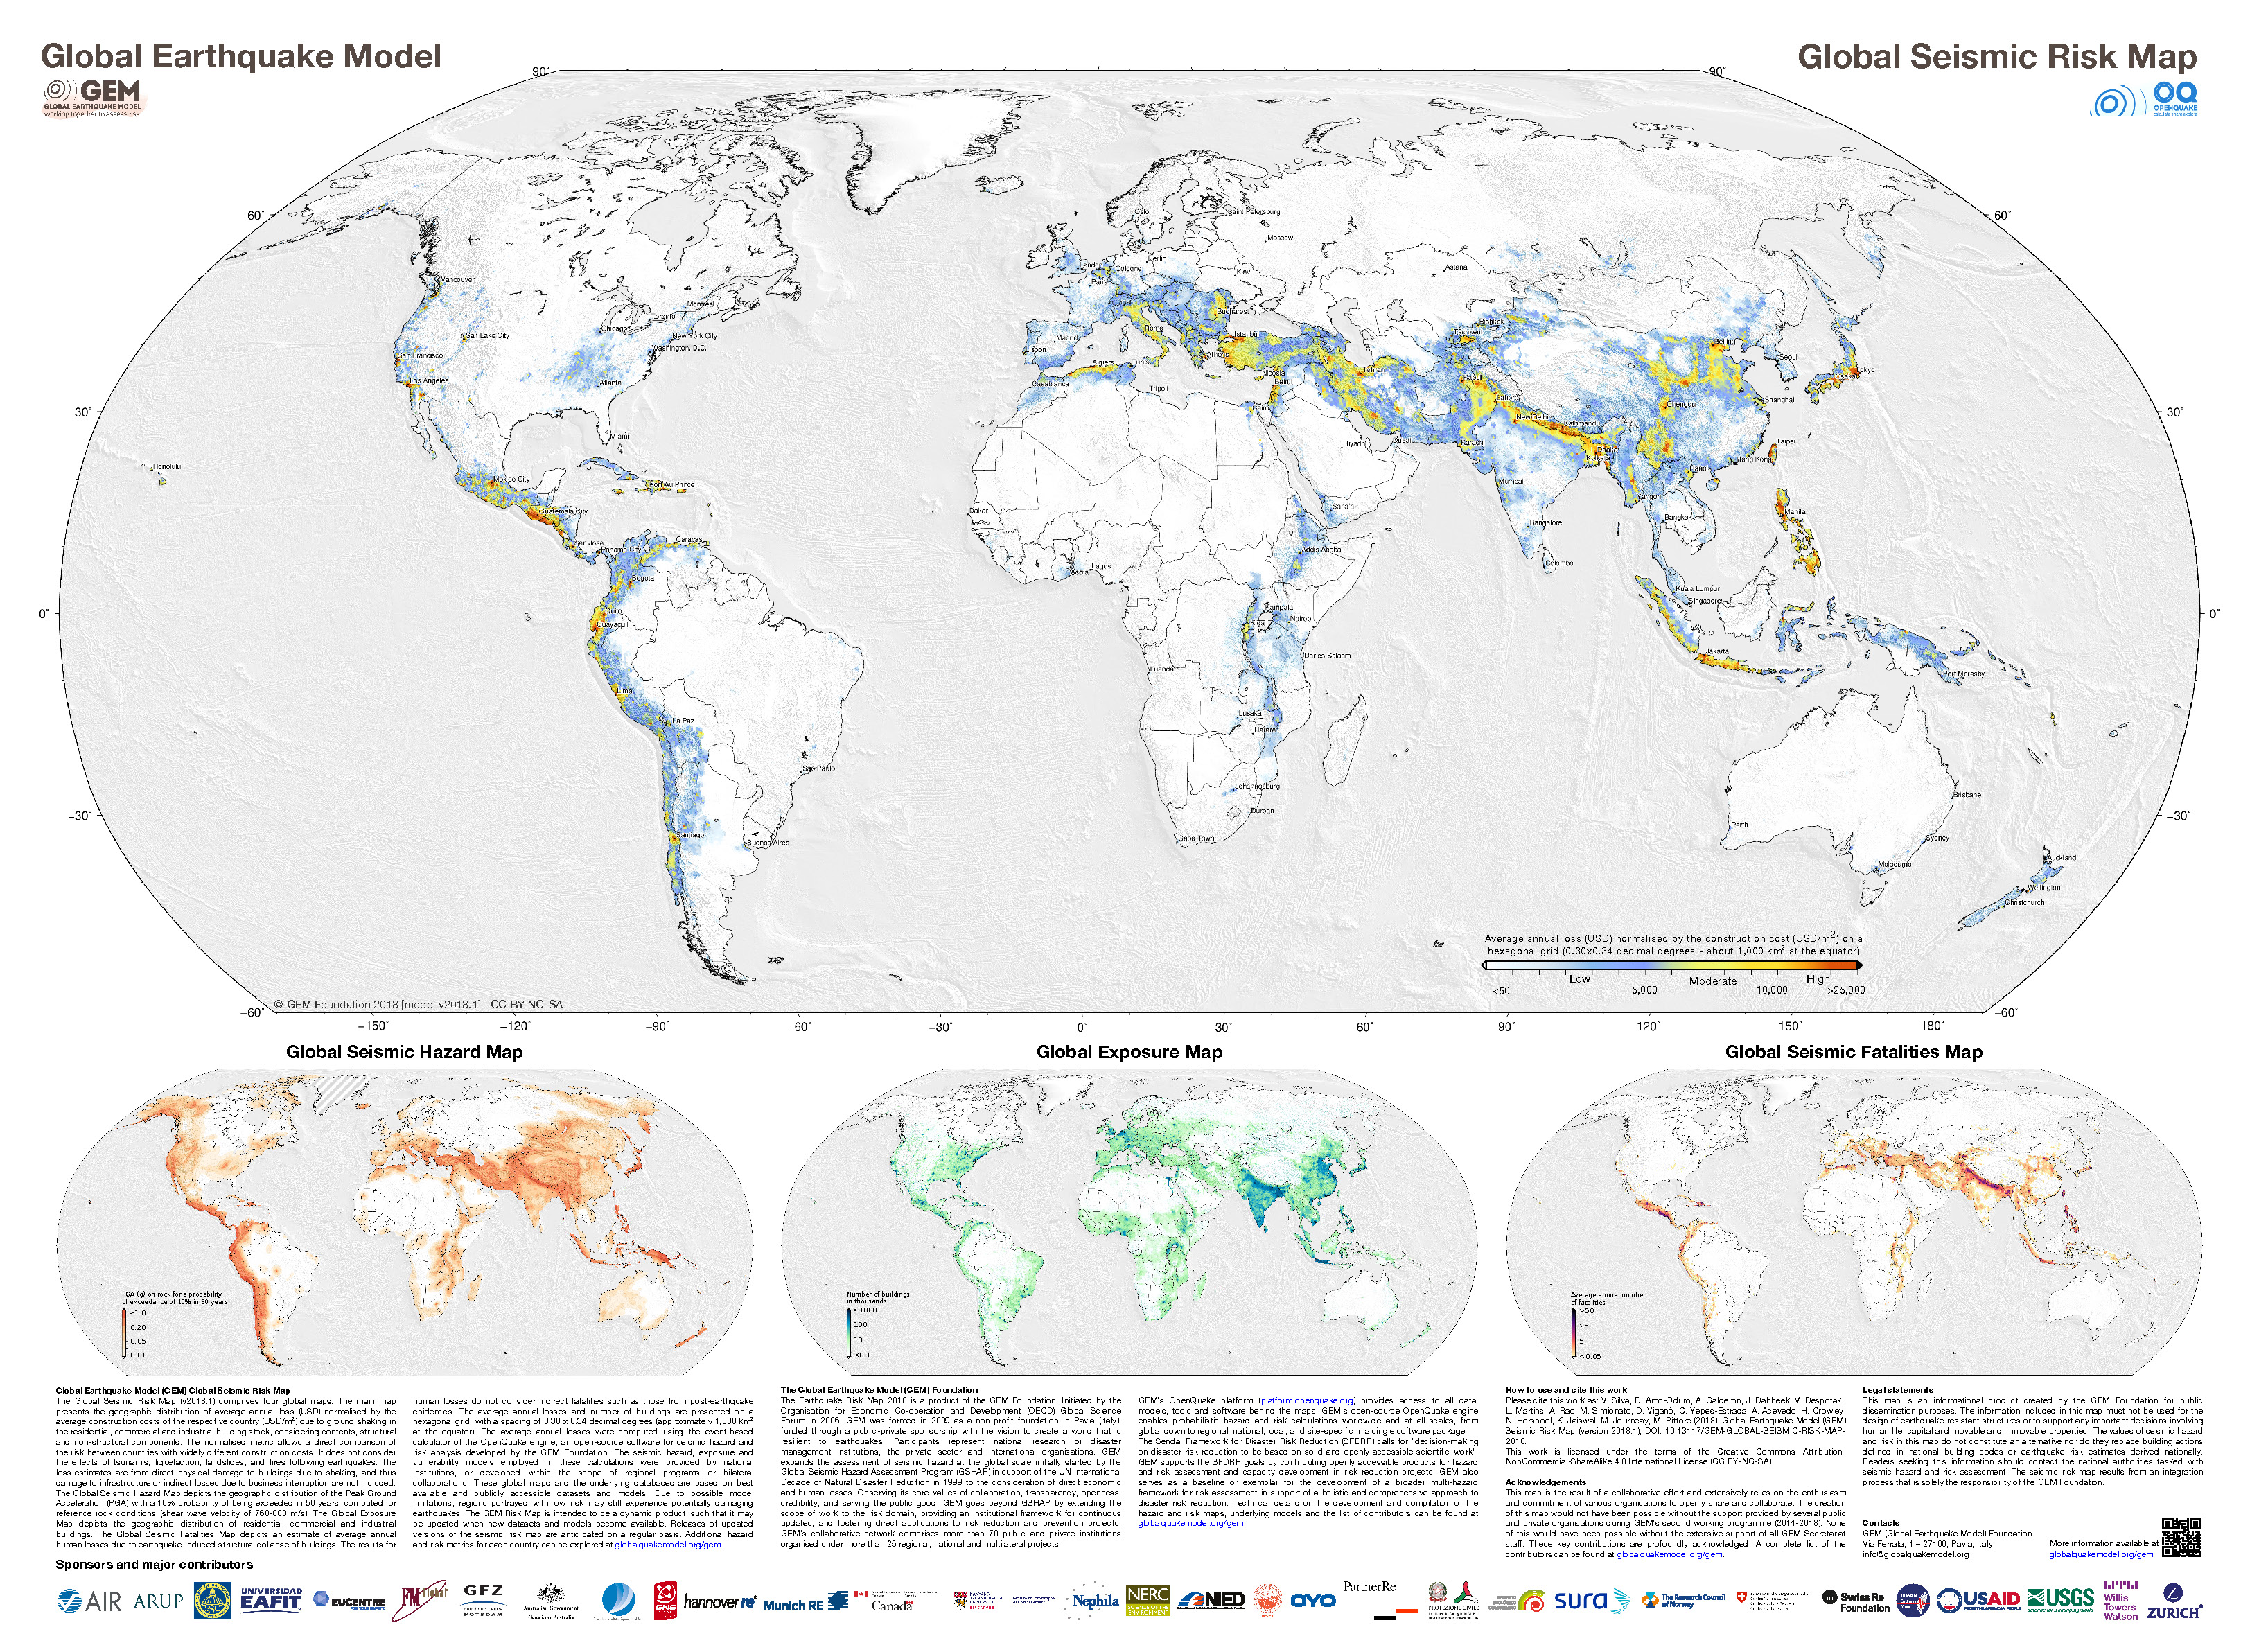
- These are the two maps shown in the map above, the GEM Seismic Hazard and the GEM Seismic Risk maps from Pagani et al. (2018) and Silva et al. (2018).
- The GEM Seismic Hazard Map:
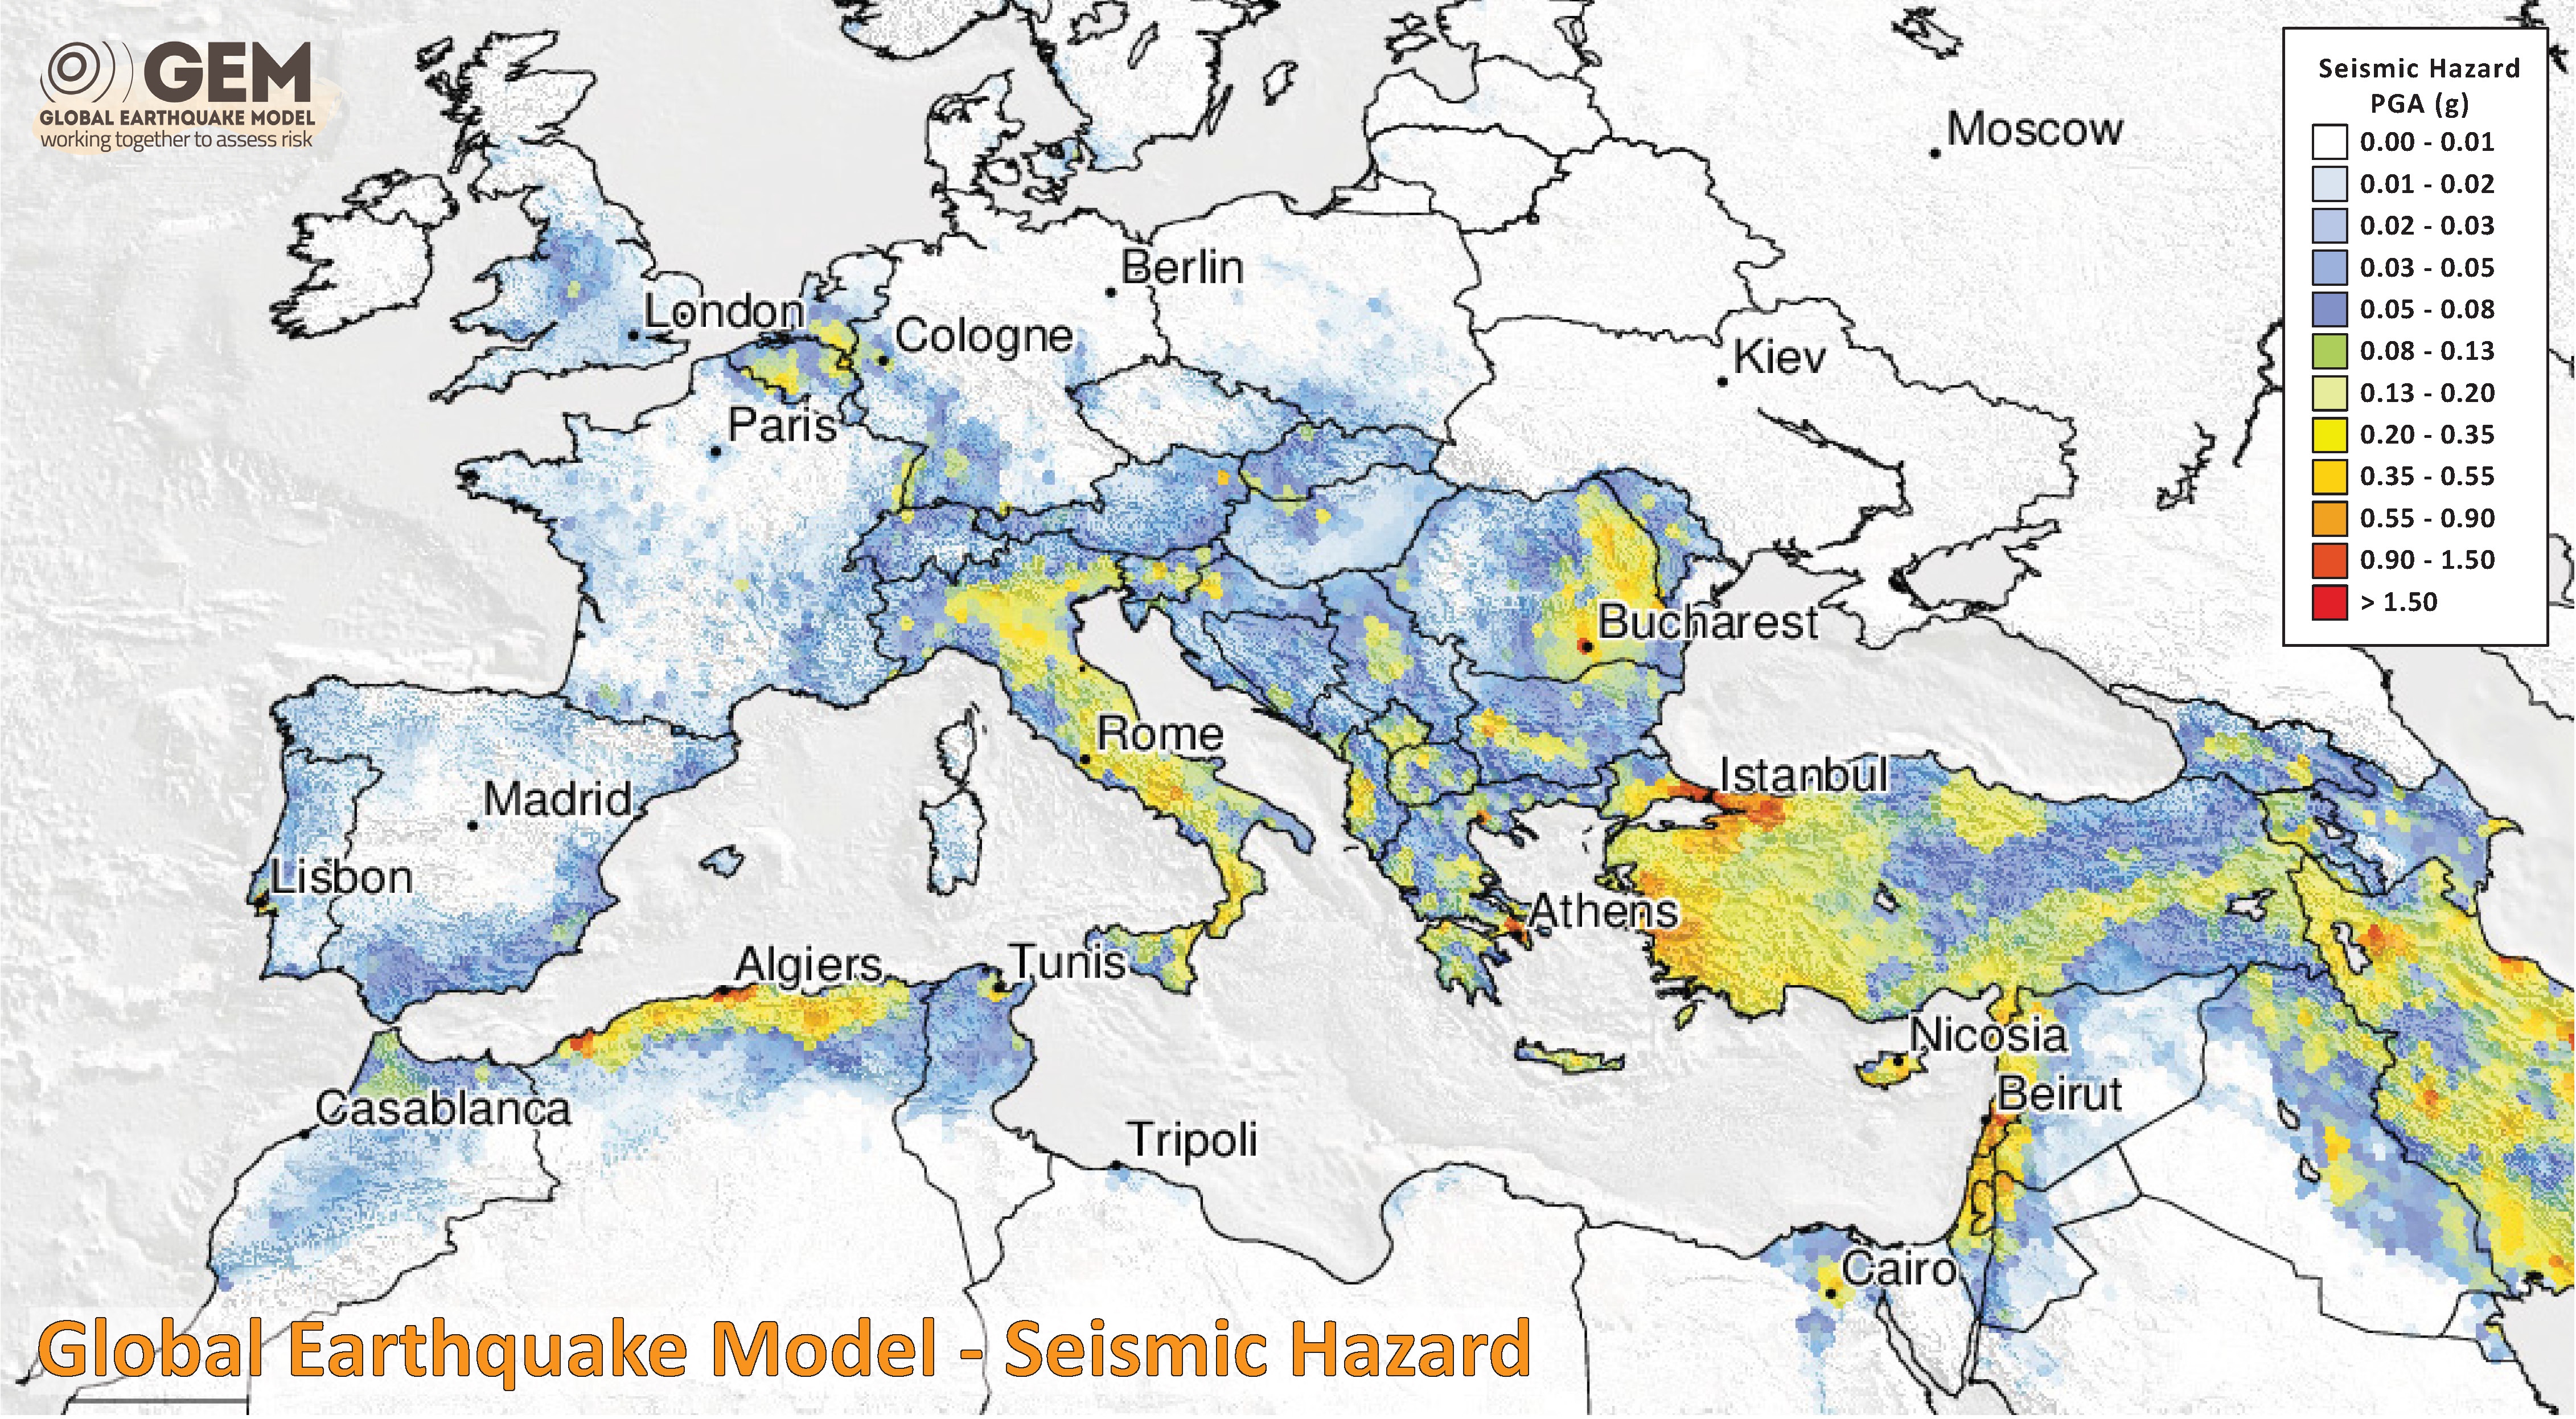
- The Global Earthquake Model (GEM) Global Seismic Hazard Map (version 2018.1) depicts the geographic distribution of the Peak Ground Acceleration (PGA) with a 10% probability of being exceeded in 50 years, computed for reference rock conditions (shear wave velocity, VS30, of 760-800 m/s). The map was created by collating maps computed using national and regional probabilistic seismic hazard models developed by various institutions and projects, and by GEM Foundation scientists. The OpenQuake engine, an open-source seismic hazard and risk calculation software developed principally by the GEM Foundation, was used to calculate the hazard values. A smoothing methodology was applied to homogenise hazard values along the model borders. The map is based on a database of hazard models described using the OpenQuake engine data format (NRML). Due to possible model limitations, regions portrayed with low hazard may still experience potentially damaging earthquakes.
- Here is a view of the GEM seismic hazard map for Europe, the western Middle East, and Northern Africa.
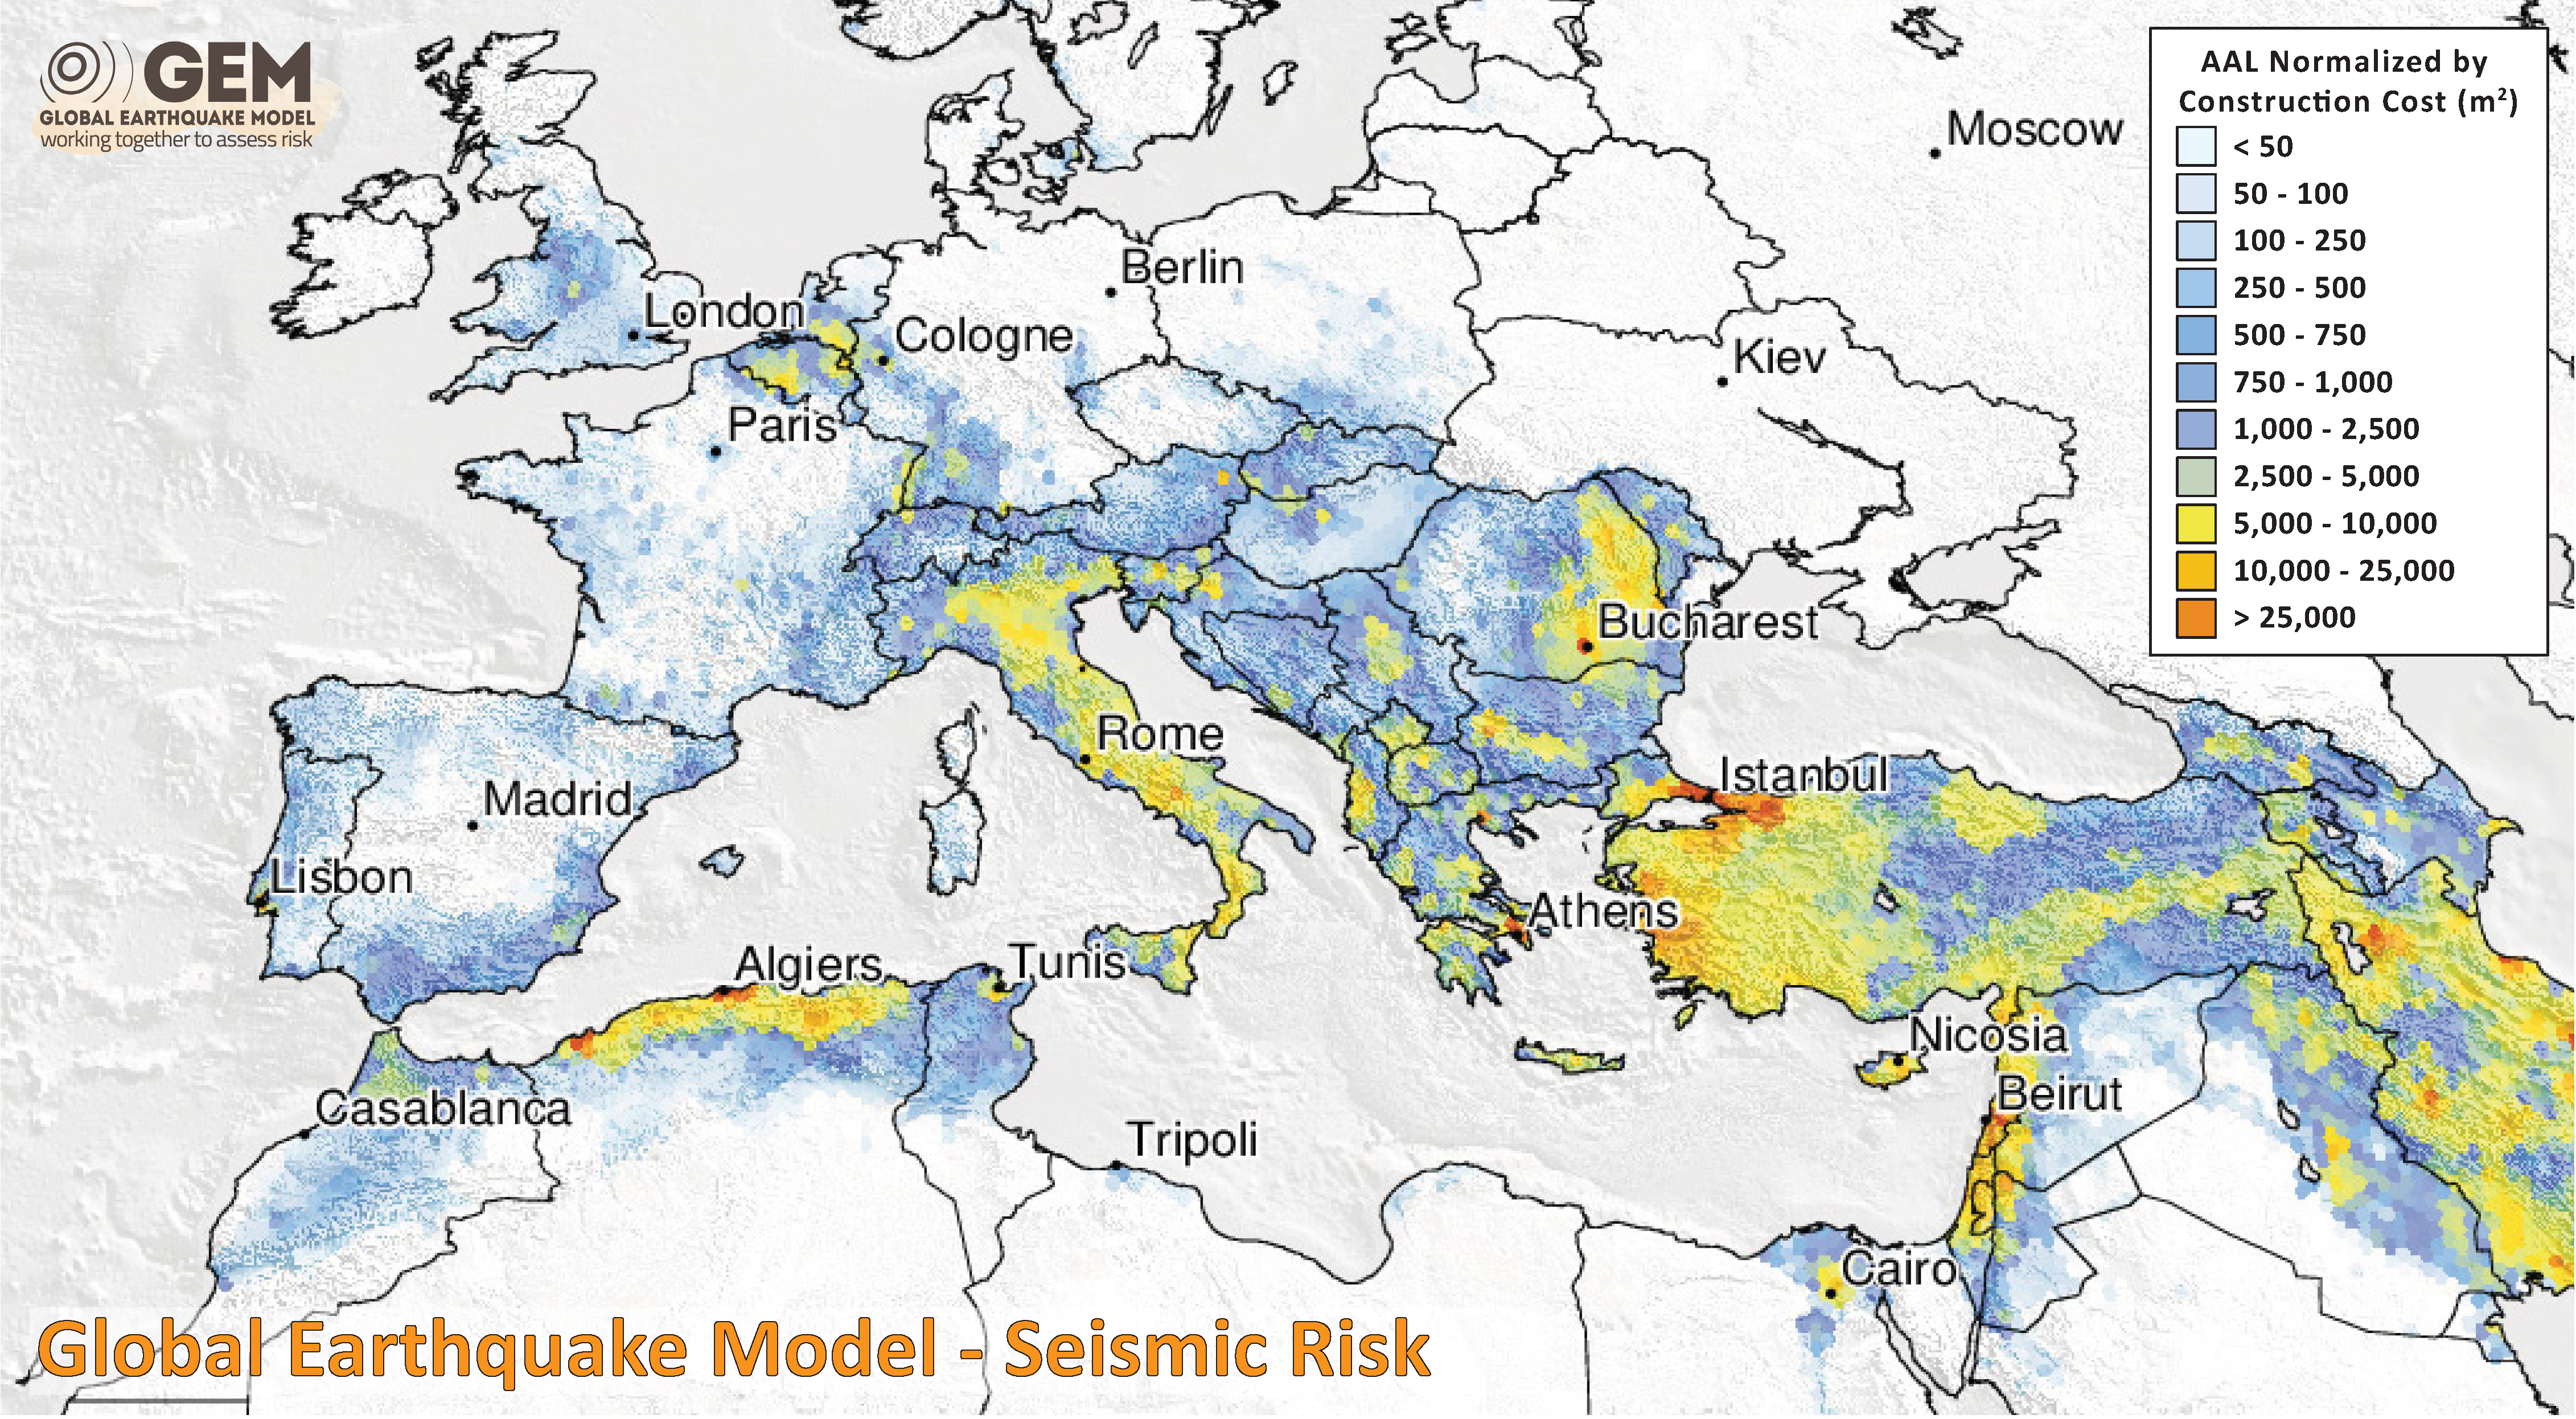
- The GEM Seismic Risk Map:
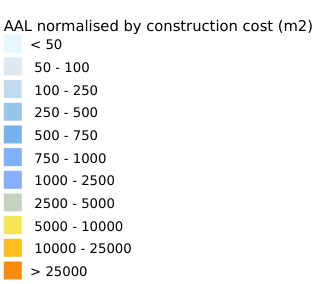
- The Global Seismic Risk Map (v2018.1) presents the geographic distribution of average annual loss (USD) normalised by the average construction costs of the respective country (USD/m2) due to ground shaking in the residential, commercial and industrial building stock, considering contents, structural and non-structural components. The normalised metric allows a direct comparison of the risk between countries with widely different construction costs. It does not consider the effects of tsunamis, liquefaction, landslides, and fires following earthquakes. The loss estimates are from direct physical damage to buildings due to shaking, and thus damage to infrastructure or indirect losses due to business interruption are not included. The average annual losses are presented on a hexagonal grid, with a spacing of 0.30 x 0.34 decimal degrees (approximately 1,000 km2 at the equator). The average annual losses were computed using the event-based calculator of the OpenQuake engine, an open-source software for seismic hazard and risk analysis developed by the GEM Foundation. The seismic hazard, exposure and vulnerability models employed in these calculations were provided by national institutions, or developed within the scope of regional programs or bilateral collaborations.
- Here is a view of the GEM seismic risk map for Europe, the western Middle East, and Northern Africa.

- 2020.05.02 M 6.6 Crete, Greece
- 2020.01.24 M 6.7 Turkey
- 2019.11.26 M 6.4 Albania
- 2018.10.25 M 6.8 Greece
- 2017.07.20 M 6.7 Turkey
- 2017.06.12 M 6.3 Turkey/Greece
- 2016.10.30 M 6.6 Italy
- 2016.10.30 M 6.6 Italy Update #1
- 2016.10.28 M 5.8 Tyrrhenian Sea
- 2016.10.26 M 6.1 Italy
- 2016.10.16 M 5.3 Greece/Albania
- 2016.08.23 M 6.2 Italy
- 2016.01.24 M 6.1 Mediterranean
- 2015.11.17 M 6.5 Greece
- 2015.04.16 M 6.0 Crete
Europe
General Overview
Earthquake Reports
Social Media
- Frisch, W., Meschede, M., Blakey, R., 2011. Plate Tectonics, Springer-Verlag, London, 213 pp.
- Hayes, G., 2018, Slab2 – A Comprehensive Subduction Zone Geometry Model: U.S. Geological Survey data release, https://doi.org/10.5066/F7PV6JNV.
- Holt, W. E., C. Kreemer, A. J. Haines, L. Estey, C. Meertens, G. Blewitt, and D. Lavallee (2005), Project helps constrain continental dynamics and seismic hazards, Eos Trans. AGU, 86(41), 383–387, , https://doi.org/10.1029/2005EO410002. /li>
- Jessee, M.A.N., Hamburger, M. W., Allstadt, K., Wald, D. J., Robeson, S. M., Tanyas, H., et al. (2018). A global empirical model for near-real-time assessment of seismically induced landslides. Journal of Geophysical Research: Earth Surface, 123, 1835–1859. https://doi.org/10.1029/2017JF004494
- Kreemer, C., J. Haines, W. Holt, G. Blewitt, and D. Lavallee (2000), On the determination of a global strain rate model, Geophys. J. Int., 52(10), 765–770.
- Kreemer, C., W. E. Holt, and A. J. Haines (2003), An integrated global model of present-day plate motions and plate boundary deformation, Geophys. J. Int., 154(1), 8–34, , https://doi.org/10.1046/j.1365-246X.2003.01917.x.
- Kreemer, C., G. Blewitt, E.C. Klein, 2014. A geodetic plate motion and Global Strain Rate Model in Geochemistry, Geophysics, Geosystems, v. 15, p. 3849-3889, https://doi.org/10.1002/2014GC005407.
- Meyer, B., Saltus, R., Chulliat, a., 2017. EMAG2: Earth Magnetic Anomaly Grid (2-arc-minute resolution) Version 3. National Centers for Environmental Information, NOAA. Model. https://doi.org/10.7289/V5H70CVX
- Müller, R.D., Sdrolias, M., Gaina, C. and Roest, W.R., 2008, Age spreading rates and spreading asymmetry of the world’s ocean crust in Geochemistry, Geophysics, Geosystems, 9, Q04006, https://doi.org/10.1029/2007GC001743
- Pagani,M. , J. Garcia-Pelaez, R. Gee, K. Johnson, V. Poggi, R. Styron, G. Weatherill, M. Simionato, D. Viganò, L. Danciu, D. Monelli (2018). Global Earthquake Model (GEM) Seismic Hazard Map (version 2018.1 – December 2018), DOI: 10.13117/GEM-GLOBAL-SEISMIC-HAZARD-MAP-2018.1
- Silva, V ., D Amo-Oduro, A Calderon, J Dabbeek, V Despotaki, L Martins, A Rao, M Simionato, D Viganò, C Yepes, A Acevedo, N Horspool, H Crowley, K Jaiswal, M Journeay, M Pittore, 2018. Global Earthquake Model (GEM) Seismic Risk Map (version 2018.1). https://doi.org/10.13117/GEM-GLOBAL-SEISMIC-RISK-MAP-2018.1
- Zhu, J., Baise, L. G., Thompson, E. M., 2017, An Updated Geospatial Liquefaction Model for Global Application, Bulletin of the Seismological Society of America, 107, p 1365-1385, https://doi.org/0.1785/0120160198
- Basili R., G. Valensise, P. Vannoli, P. Burrato, U. Fracassi, S. Mariano, M.M. Tiberti, E. Boschi (2008), The Database of Individual Seismogenic Sources (DISS), version 3: summarizing 20 years of research on Italy’s earthquake geology, Tectonophysics, doi:10.1016/j.tecto.2007.04.014
- Brun, J.-P., Sokoutis, D., 2012. 45 m.y. of Aegean crust and mantle flow driven by trench retreat. Geol. Soc. Am., v. 38, p. 815–818.
- Caputo, R., Chatzipetros, A., Pavlides, S., and Sboras, S., 2012. The Greek Database of Seismogenic Sources (GreDaSS): state-of-the-art for northern Greece in Annals of Geophysics, v. 55, no. 5, doi: 10.4401/ag-5168
- Dilek, Y. and Sandvol, E., 2006. Collision tectonics of the Mediterranean region: Causes and consequences in Dilek, Y., and Pavlides, S., eds., Postcollisional tectonics and magmatism in the Mediterranean region and Asia: Geological Society of America Special Paper 409, p. 1–13
- DISS Working Group (2015). Database of Individual Seismogenic Sources (DISS), Version 3.2.0: A compilation of potential sources for earthquakes larger than M 5.5 in Italy and surrounding areas. http://diss.rm.ingv.it/diss/, Istituto Nazionale di Geofisica e Vulcanologia; DOI:10.6092/INGV.IT-DISS3.2.0.
- Ersoy, E.Y., Cemen, I., Helvaci, C., and Billor, Z., 2014. Tectono-stratigraphy of the Neogene basins in Western Turkey: Implications for tectonic evolution of the Aegean Extended Region in Tectonophysics v. 635, p. 33-58.
- Ganas, A., and T. Parsons (2009), Three-dimensional model of Hellenic Arc deformation and origin of the Cretan uplift, J. Geophys. Res., 114, B06404, doi:10.1029/2008JB005599
- Ganas, A., Oikonomou, I.A., and Tsimi, C., 2013. NOAFAULTS: A Digital Database for Active Faults in Greece in Bulletin of the Geological Society of Greece, v. XLVII, Proceedings fo the 13th International Cogfress, Chania, Sept, 2013
- Kokkalas, S., Xypolias, P., Koukouvelas, I., and Doutsos, T., 2006, Postcollisional contractional and extensional deformation in the Aegean region, in Dilek, Y., and Pavlides, S., eds., Postcollisional tectonics and magmatism in the Mediterranean region and Asia: Geological Society of America Special Paper 409, p. 97–123, doi: 10.1130/2006.2409(06)
- Papazachos, B.C., Papadimitrious, E.E., Kiratzi, A.A., Papazachos, C.B., and Louvari, E.k., 1998. Fault Plane Solutions in the Aegean Sea and the Surrounding Area and their Tectonic Implication, in Bollettino Di Geofisica Terorica Ed Applicata, v. 39, no. 3, p. 199-218.
- Taymaz, T. , Yilmaz, Y., and Dilek, Y., 2007. The geodynamics of the Aegean and Anatolia: introduction in TAYMAZ, T., YILMAZ, Y. & DILEK, Y. (eds) The Geodynamics of the Aegean and Anatolia. Geological Society, London, Special Publications, 291, 1–16. DOI: 10.1144/SP291.1 0305-8719/07
- Wouldloper, 2009. Tectonic map of southern Europe and the Middle East, showing tectonic structures of the western Alpide mountain belt. Only Alpine (tertiary) structures are shown.
References:
Basic & General References
Specific References
Return to the Earthquake Reports page.
- Sorted by Magnitude
- Sorted by Year
- Sorted by Day of the Year
- Sorted By Region