This M 6.7 earthquake was the result of slip probably along a left-lateral strike-slip fault associated with the East Anatolia fault zone (EAF). The event was shallow and produced strong ground shaking in the region.
https://earthquake.usgs.gov/earthquakes/eventpage/us60007ewc/executive
As I write this, there have been about 5 building collapses and 22 deaths. The high number of deaths may be due to the building design used in the region.
The EAF accommodates the relative plate motion between the Anatolia and Arabia plates. Because the northern motion of the Arabia plate is oblique to the plate boundary, the tectonic strain (deformation of the Earth) is proportioned on different fault types. We call this strain partitioning.
The lateral strain is localized along the EAF in the form of strike-slip faults. The compressive strain formed the Southeast Anatolia fault zone, a series of imbricate thrust faults south and east of the EAF.
Further to the west, this north-south compression results in the subduction of the Africa plate northwards beneath the Anatolia and Eurasia plates. This subduction forms the Hellenic trench.
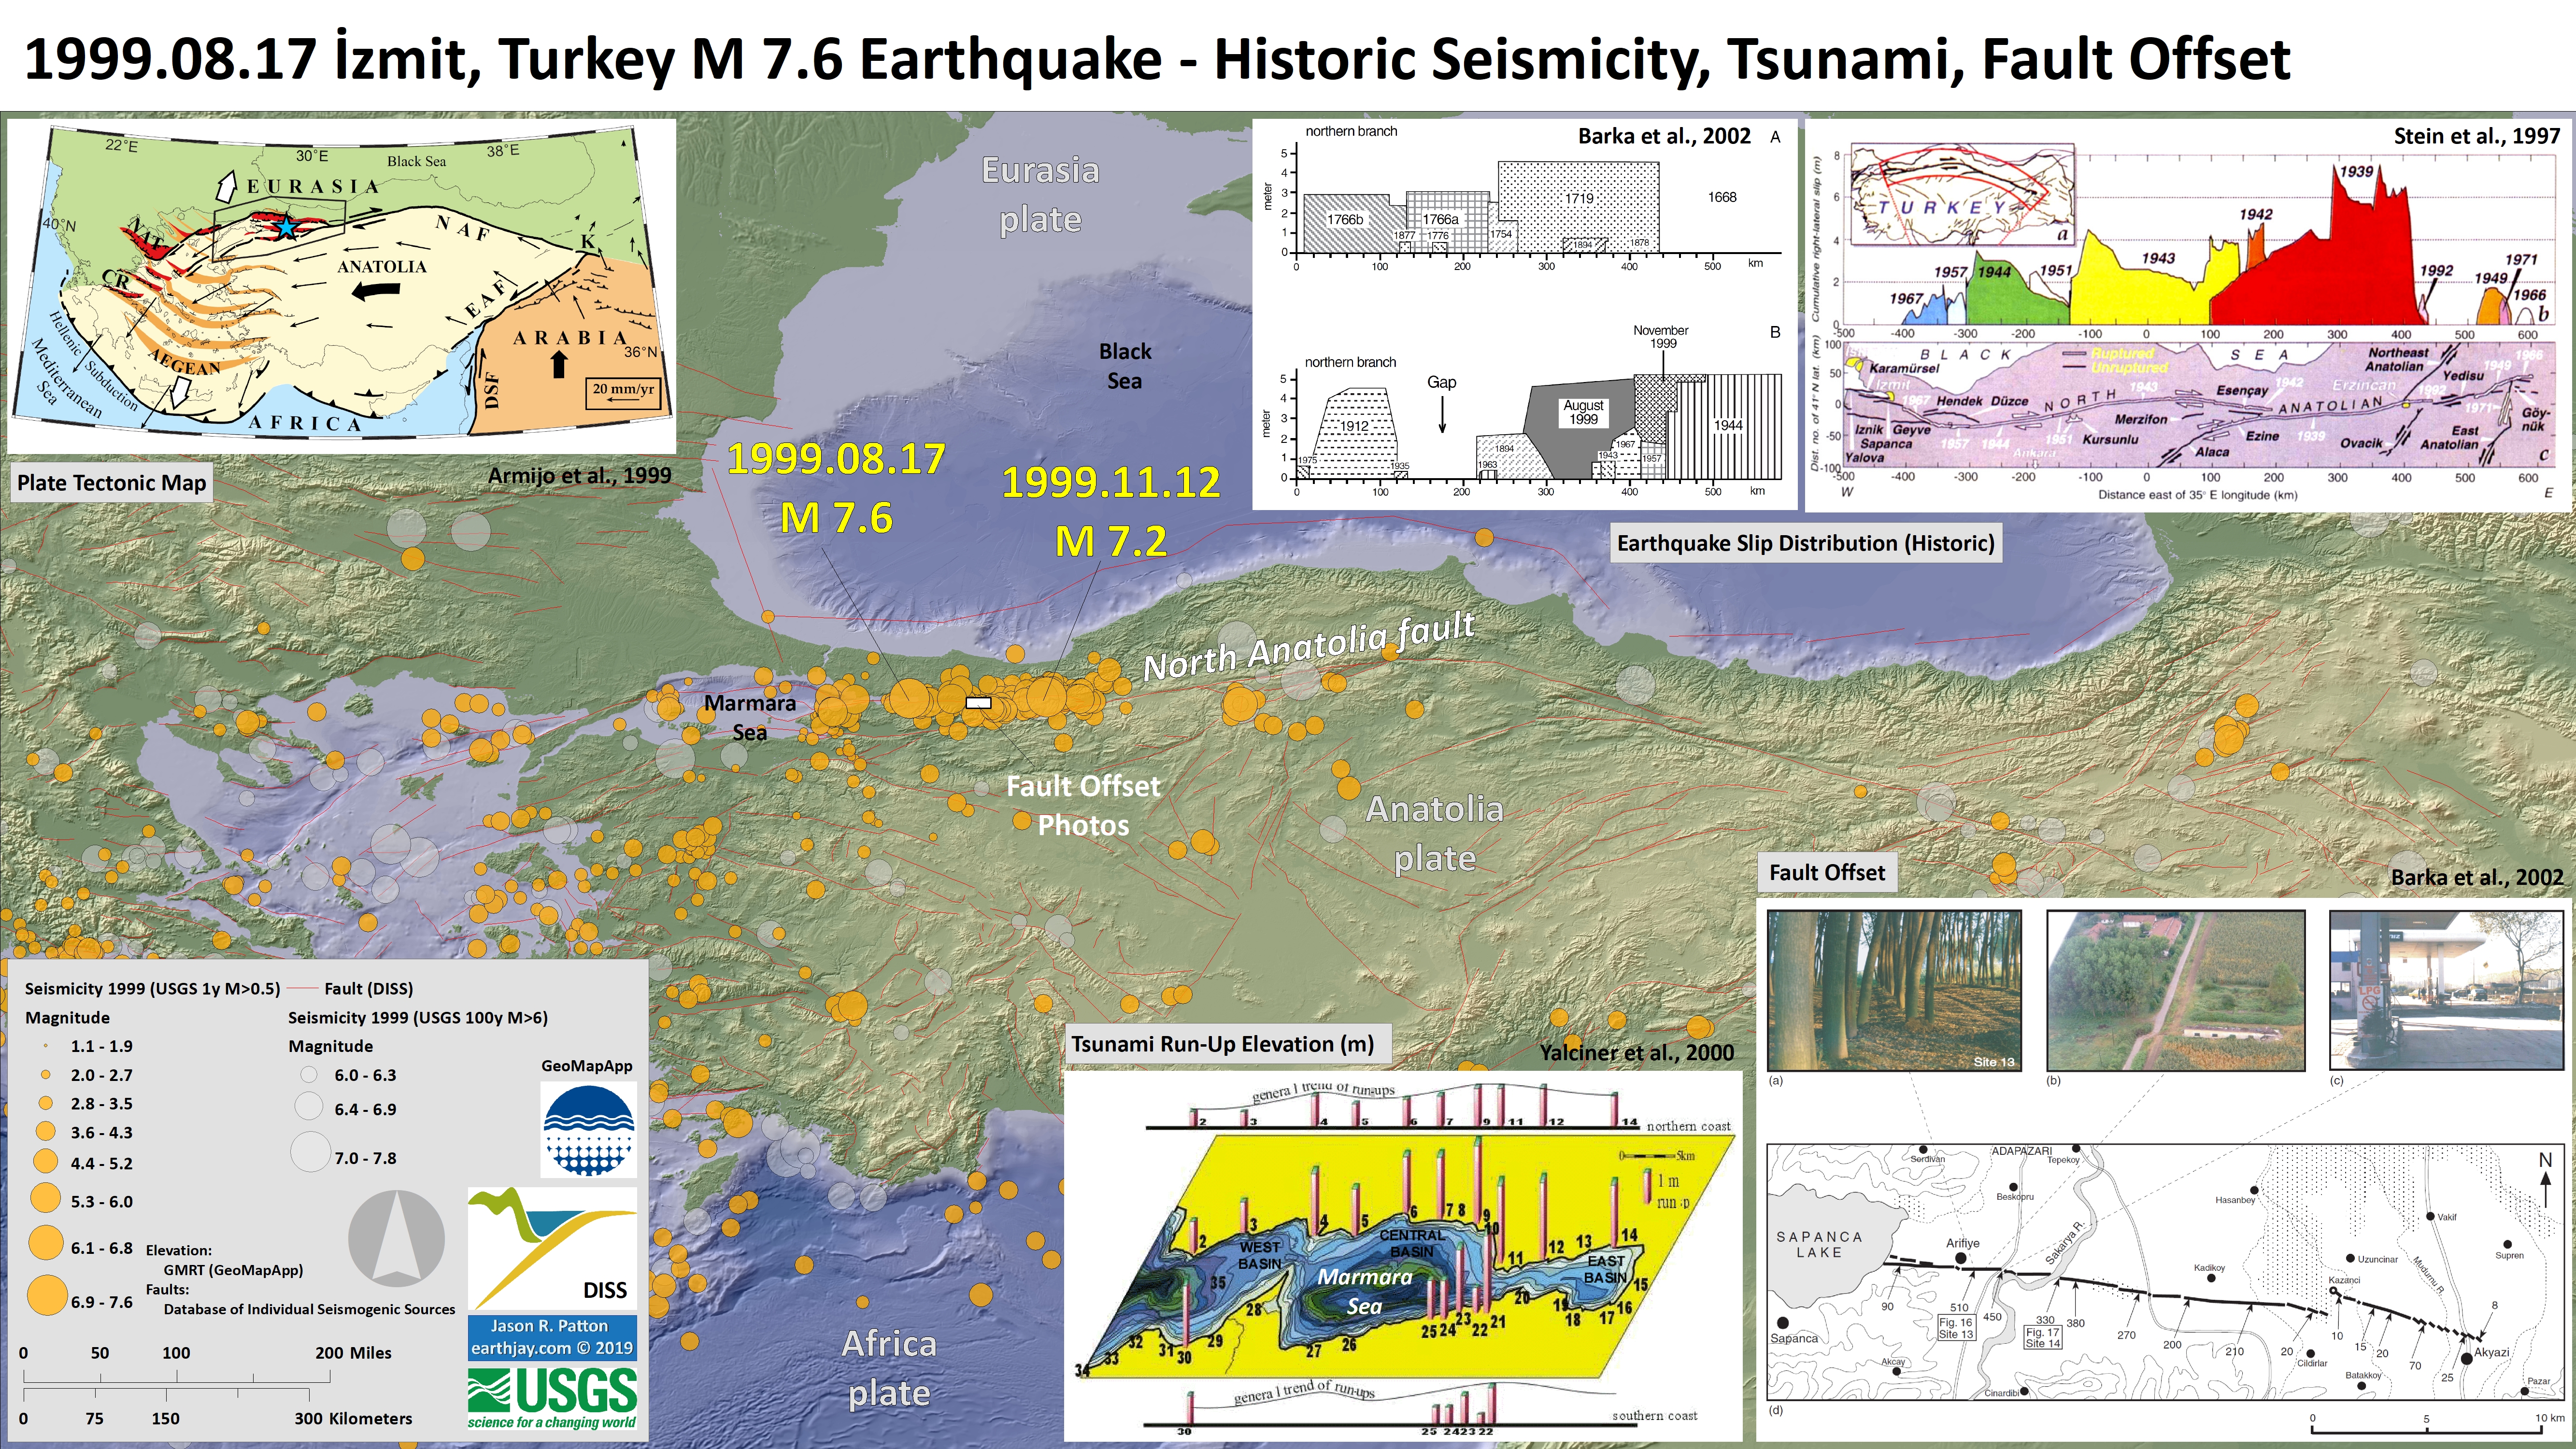
On the northern part of Turkey is bordered by a right-lateral strike-slip fault, the North Anatolia fault. Last year (2019) was the 20 year commemoration of the 1999 Izmit M 7.6 earthquake.
The M 6.7 earthquake may have caused landslides or liquefaction in places, but the chances of this are modest at best.
Geologists have studied the EAF and subdivided the fault into segments based on their mapping efforts. This M 6.7 is within the Pütürge segment of the EAF. If we look at the historic record of the EAF here, we find that the M 6.7 happened in a part of the fault that does not have an historic rupture. There was an earthquake in 1875 that appears to end to the north of the M 6.7 and there is an earthquake in 1893 that appears to terminate just to the south of the M 6.7.
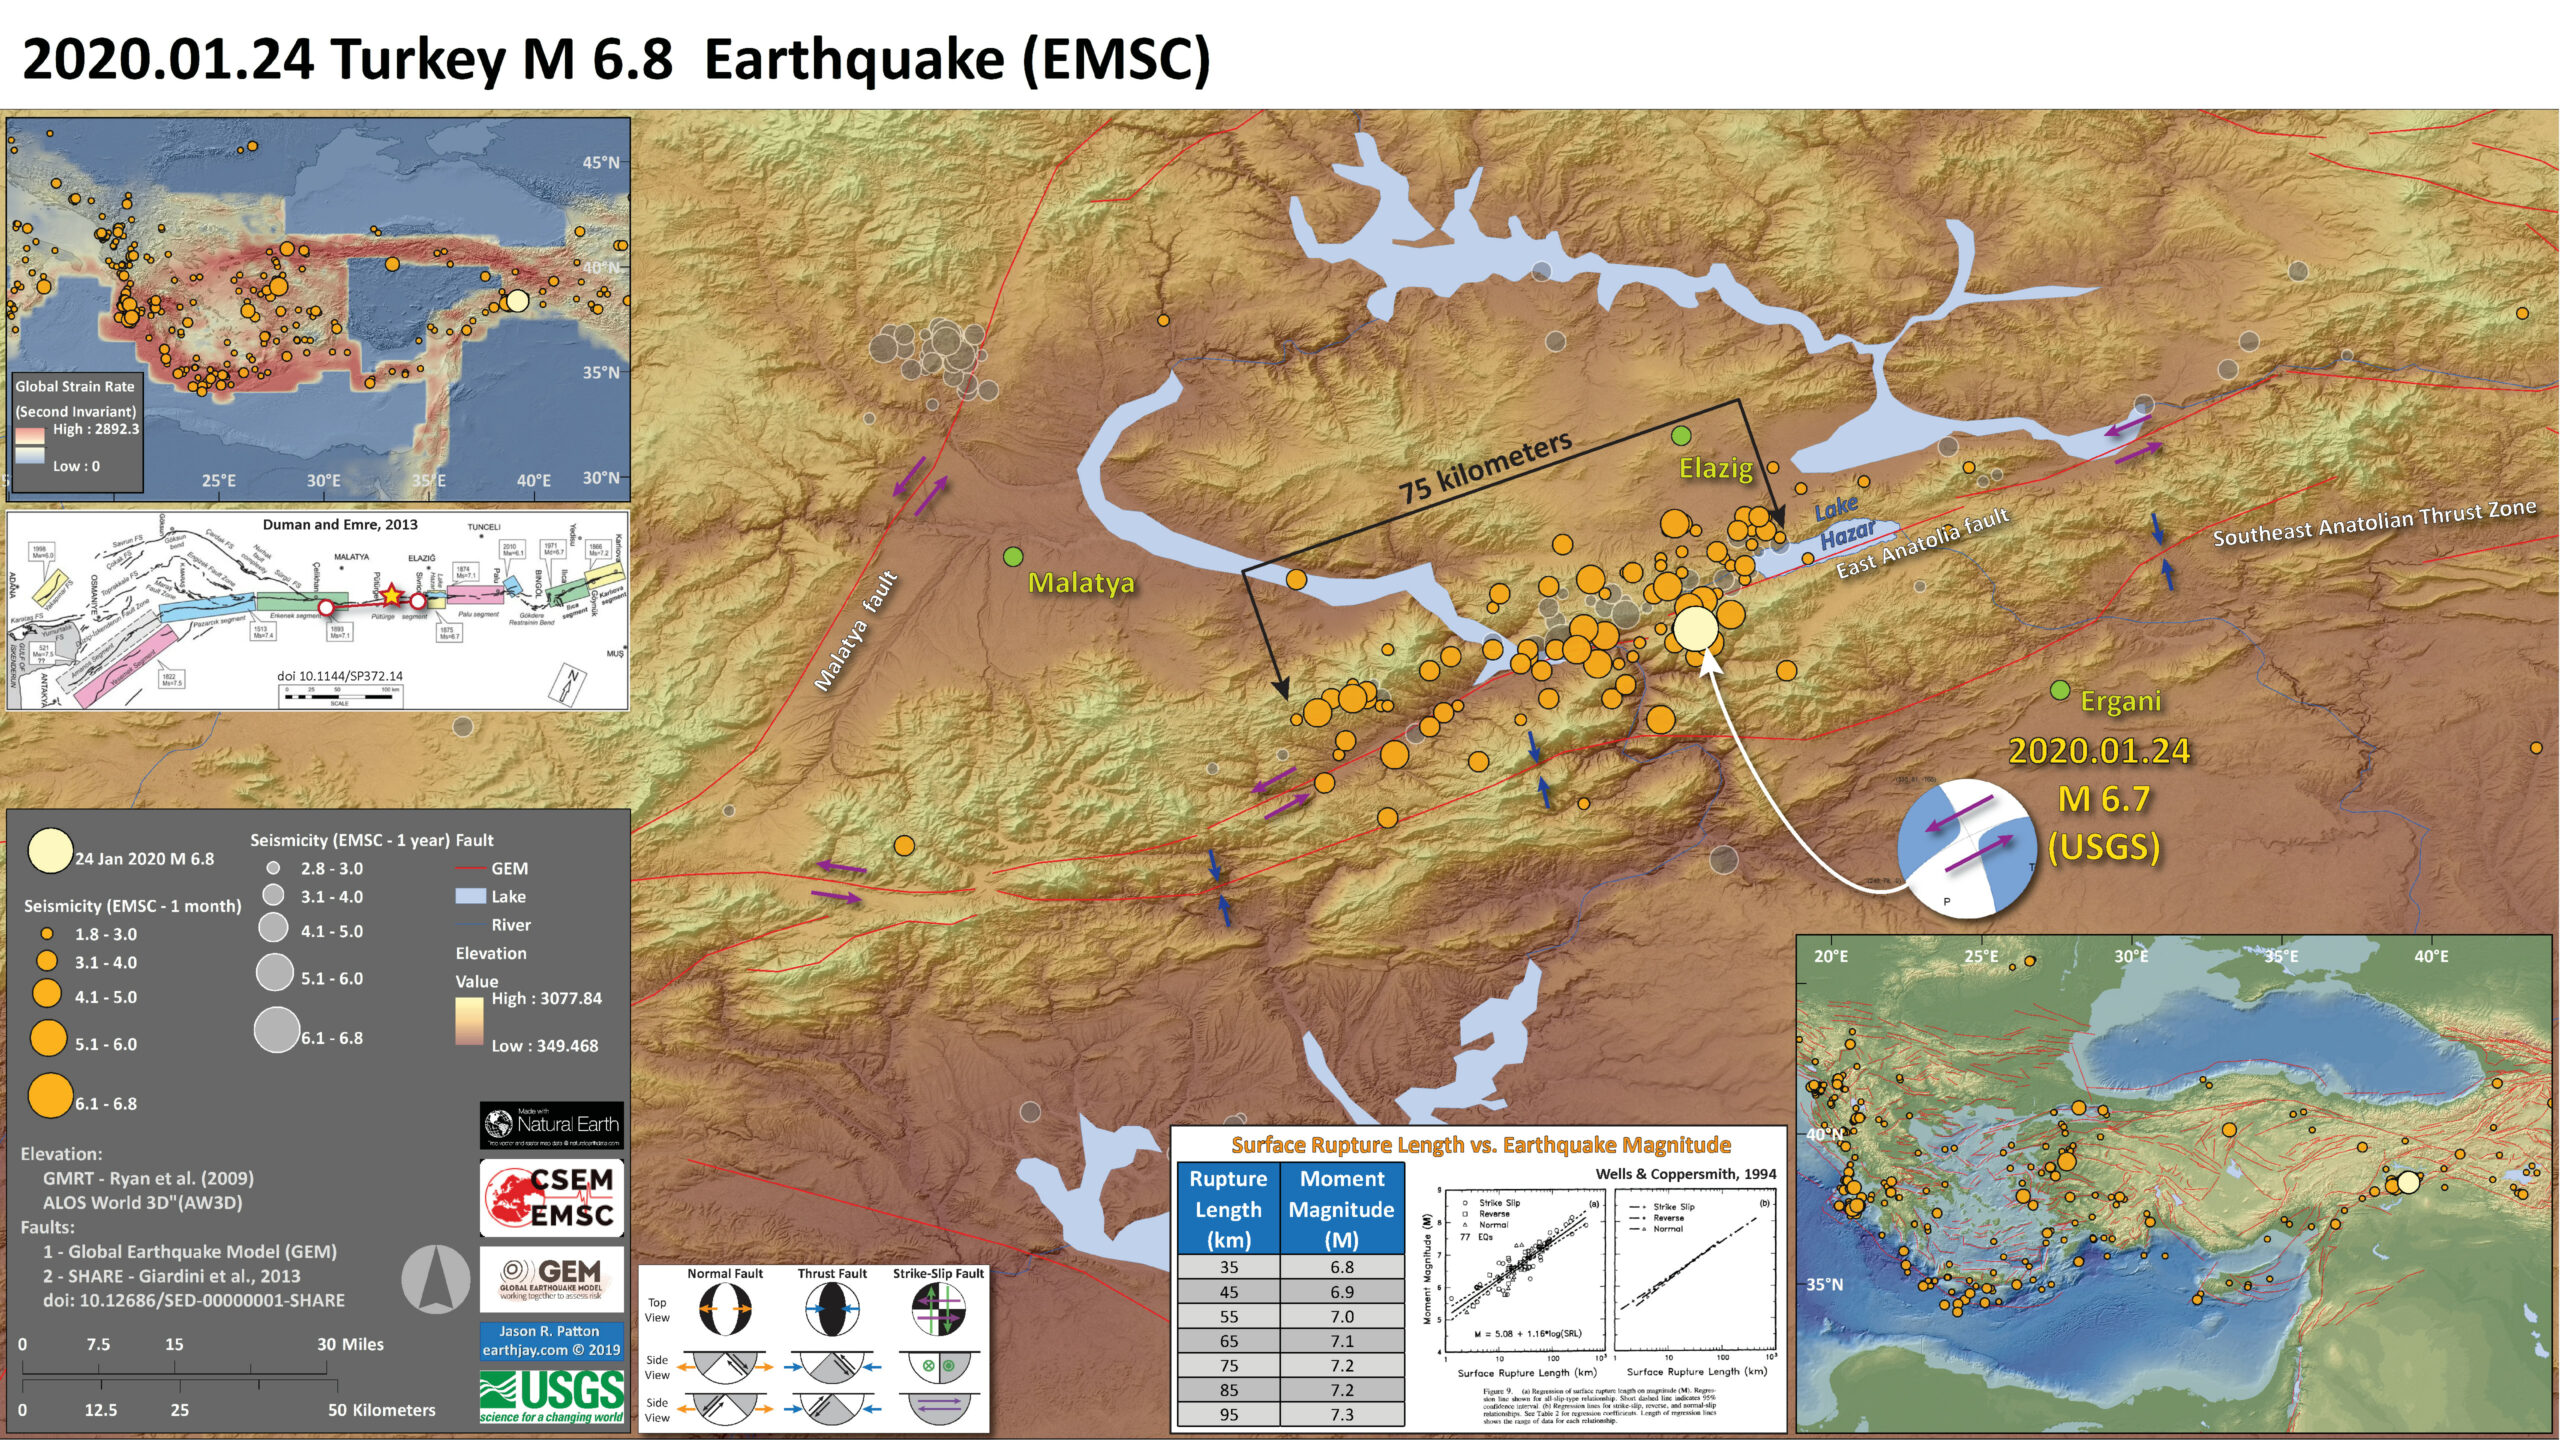
Below is my interpretive poster for this earthquake
- I plot the seismicity from the past year, with diameter representing magnitude (see legend). I include earthquake epicenters from 1920-2020 with magnitudes M ≥ 6.5 in one version.
- I plot the USGS fault plane solutions (moment tensors in blue and focal mechanisms in orange), possibly in addition to some relevant historic earthquakes.
- A review of the basic base map variations and data that I use for the interpretive posters can be found on the Earthquake Reports page.
- Some basic fundamentals of earthquake geology and plate tectonics can be found on the Earthquake Plate Tectonic Fundamentals page.
- In the upper right corner is a map from Armijo et al. (1999) that shows the plate boundary faults and tectonic plates in the region. This M 6.7 earthquake, denoted by the blue star, is along the East Anatolia fault, a left-lateral strike-slip plate boundary fault.
- In the upper left corner is a comparison of the shaking intensity modeled by the USGS and the shaking intensity based on peoples’ “boots on the ground” observations. People felt intensities exceeding MMI 7.
- To the right of the intensity map is a figure from Duman and Emre (2013). This shows the historic earthquakes along the EAF.
- In the lower right corner is a larger scale map showing the tectonic geomorphology of the region (how the landscape is sculpted by tectonic forces).
- To the right of the legend are two maps that show (left) liquefaction susceptibility and (right) landslide probability. These are based on empirical models from the USGS that show the chance an area may have experienced these processes that may have happened as a result of the ground shaking from the earthquake. I spend more time explaining these types of models and what they represent in this Earthquake Report for the recent event in Albania.
I include some inset figures. Some of the same figures are located in different places on the larger scale map below.
- Here is the map with a month’s (ESMC catalog) and a century’s seismicity plotted (USGS NEIC catalog).

- Here is the map with a month’s and a year’s seismicity plotted (CSEM EMSC catalog).
- In the upper left corner is a map that shows the tectonic strain in the region. Areas of red are deforming more from tectonic motion than are areas that are blue. Learn more about the Global Strain Rate Map project here.
- I also show a figure from Wells and Coppersmith (1994). These authors used a global dataset of earthquakes to develop an empirical relation between earthquakes and various parameters. They found relations between the physical size of an earthquake versus earthquake magnitude. These plots show how the magnitude of an earthquake relates to the “surface rupture length in km.” The surface rupture length is the length of the fault that actually caused the ground surface to be offset during the earthquake.
- The table shows calculated magnitudes based on surface rupture lengths of different length. Given the formula in the Wells and Coppersmith (1994) plot shown, an earthquake with a surface rupture length of 35 km would have a magnitude of M 6.8. Note how the aftershock zone is about 75 km long. We will see in the coming week or two if there is a potential for finding surface rupture. Geologists will use satellite data to measure ground offset. This type of remote sensing analysis can help people locate field observations of surface rupture. This kind of analysis was very helpful for our mapping following the July 2019 Ridgecrest Earthquake Sequence.
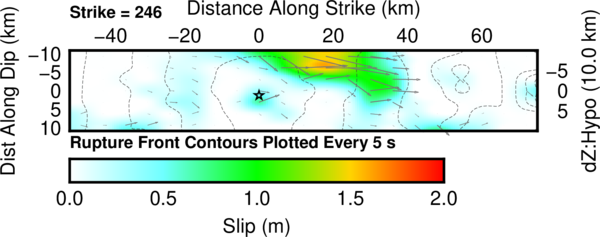
- Let’s take a look at the USGS fault slip model. USGS seismologists analyze seismologic data (from broadband seismometers) to model the distribution of slip for this earthquake. Below is their model that is based on a southwest-northeast striking (trending) fault (parallel to the EAF). Maximum slip is less than 2 meters.
- Note the coincidence between the estimated length of surface rupture length in the table above (35 km) and this slip model. The slip model shows slip on the fault at or near the surface for about 40 km or so.

- Because this 1999 earthquake is important for many reasons, I will be writing up an Earthquake Report for that event sometime soon. In the meantime, here is a poster I put together for that event.
- Of particular note is that this August earthquake generated a small tsunami. I use this in my tsunami talks to highlight how there are non-traditional tsunami sources that need to be considered when mitigating tsunami hazards. Even though this tsunami was only a couple meters high, that is enough to damage harbors, boats, and people.
Other Report Pages
Some Relevant Discussion and Figures
- This is the plate tectonic map from Armijo et al., 1999.
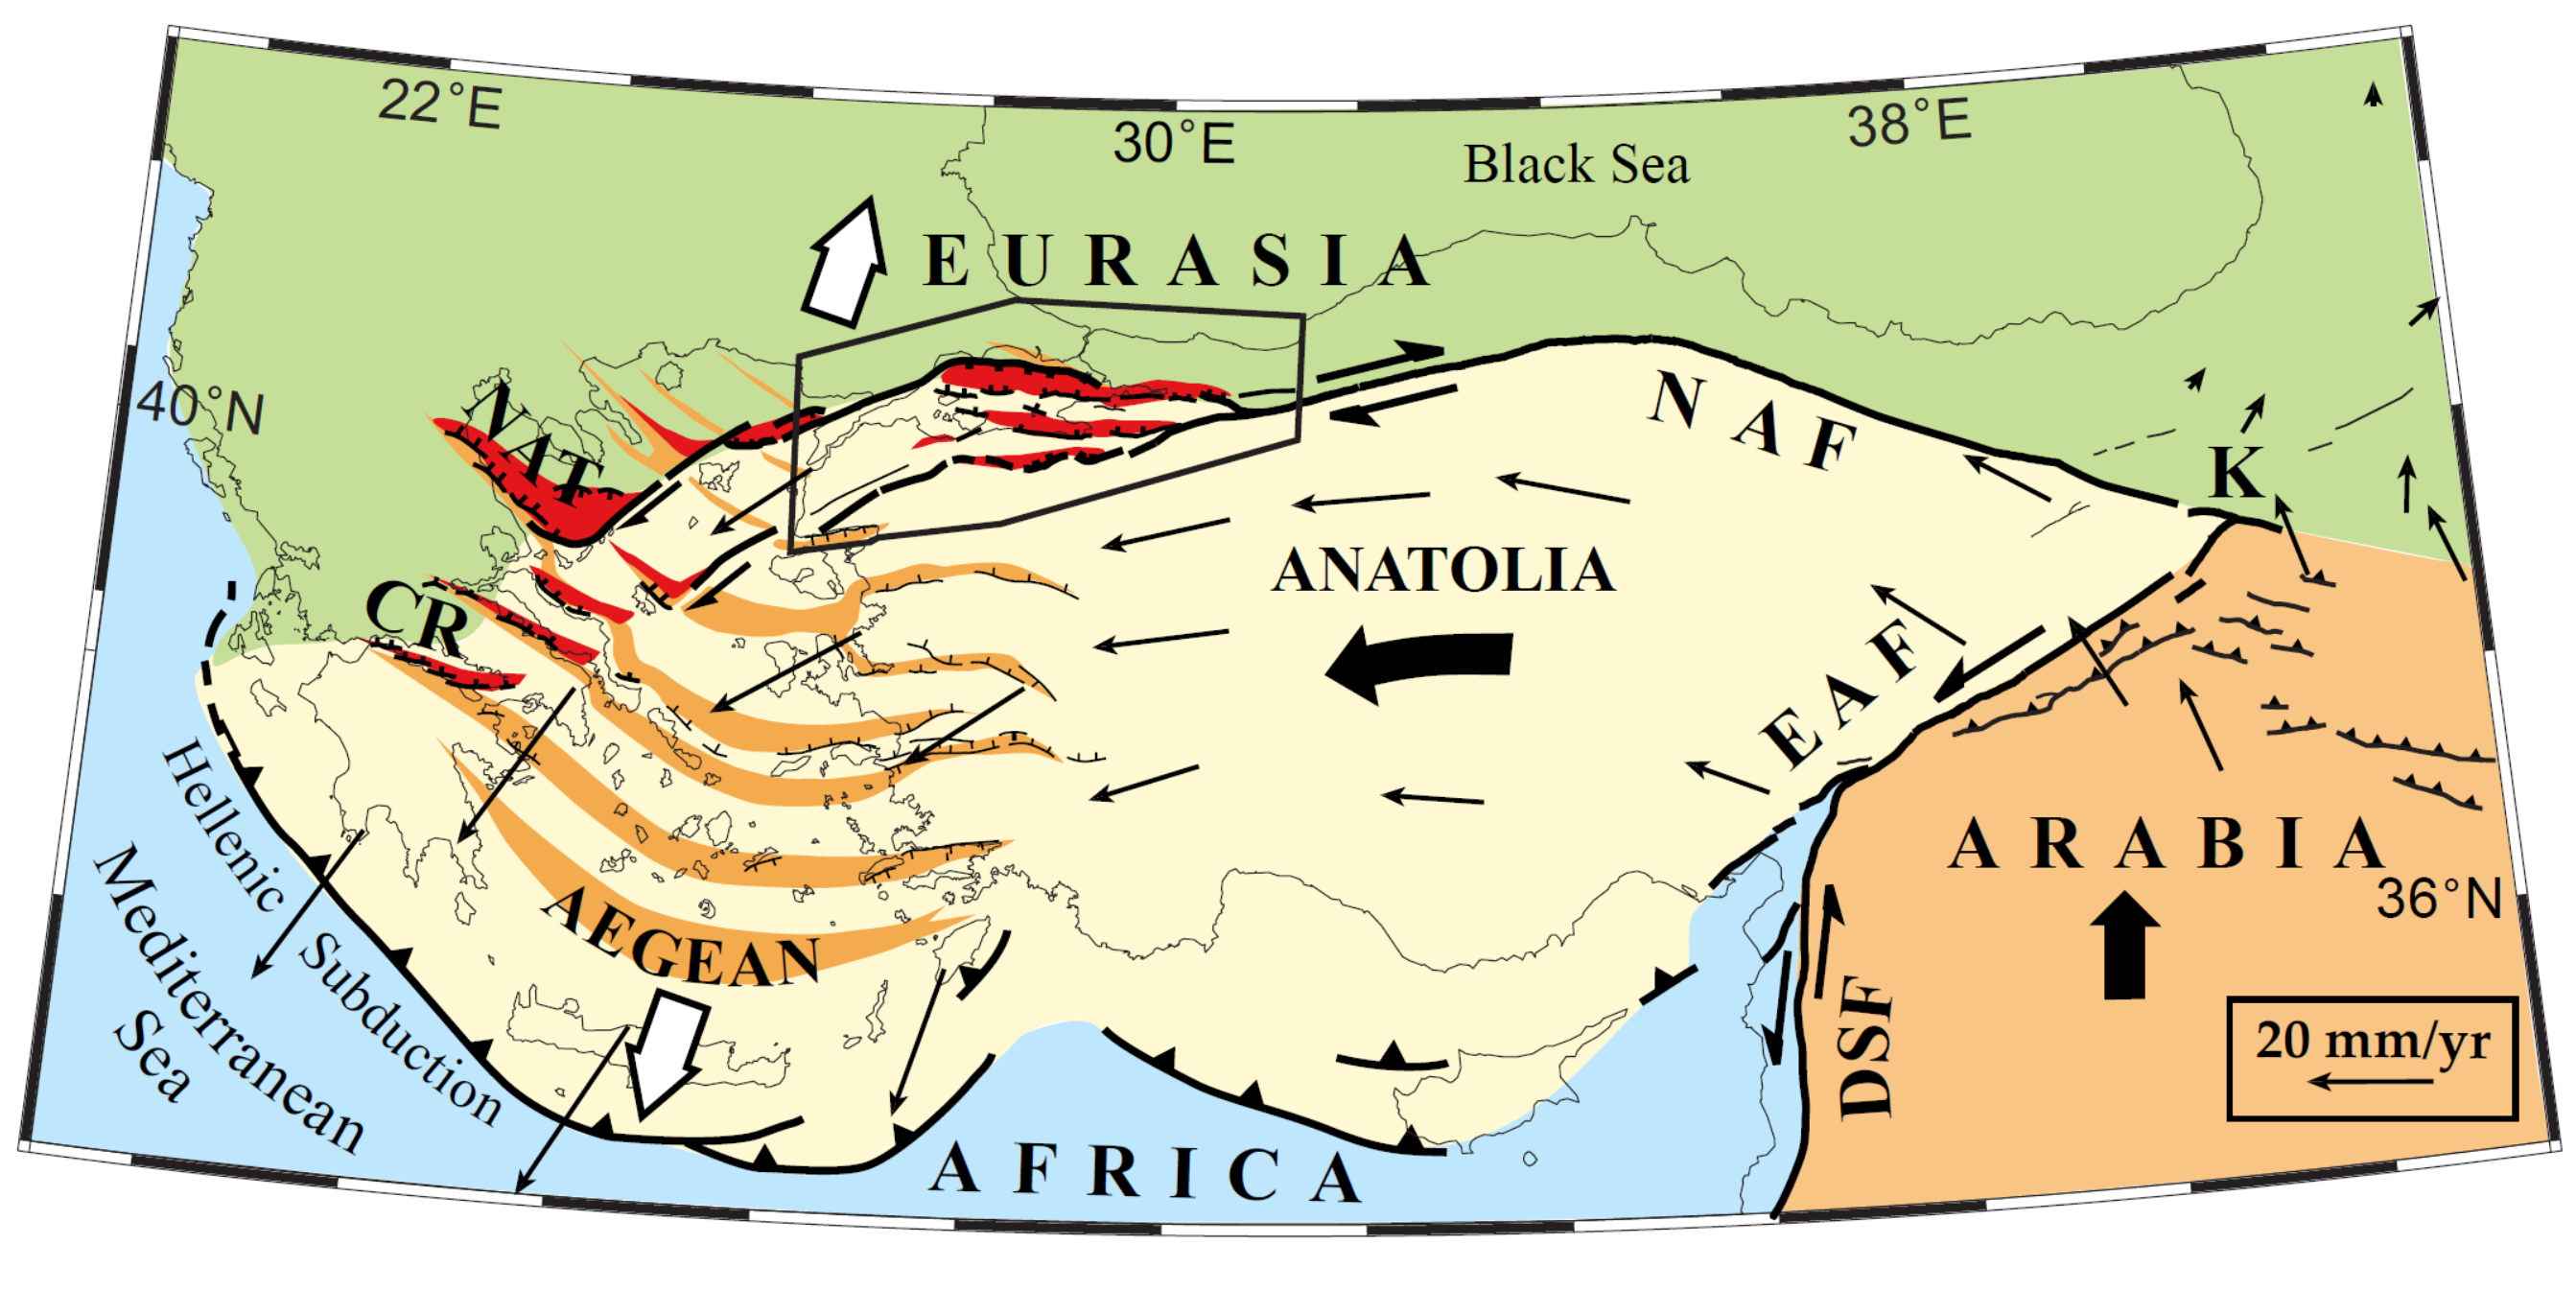
Tectonic setting of continental extrusion in eastern Mediterranean. Anatolia-Aegean block escapes westward from Arabia-Eurasia collision zone, toward Hellenic subduction zone. Current motion relative to Eurasia (GPS [Global Positioning System] and SLR [Satellite Laser Ranging] velocity vectors, in mm/yr, from Reilinger et al., 1997). In Aegean, two deformation regimes are superimposed (Armijo et al., 1996): widespread, slow extension starting earlier (orange stripes, white diverging arrows), and more localized, fast transtension associated with later, westward propagation of North Anatolian fault (NAF). EAF—East Anatolian fault, K—Karliova triple junction, DSF—Dead Sea fault,NAT—North Aegean Trough, CR—Corinth Rift.Box outlines Marmara pull-apart region, where North Anatolian fault enters Aegean.
- Here is the tectonic map from Dilek and Sandvol (2009).
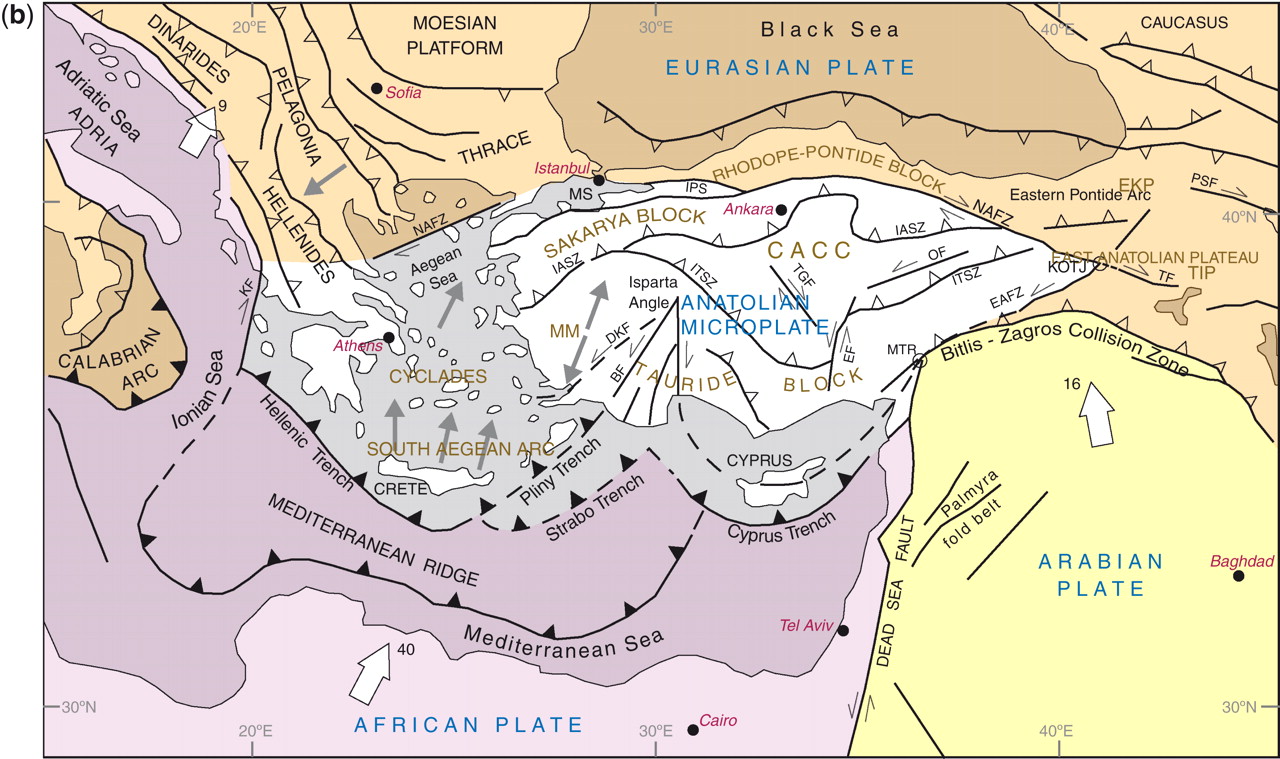
Tectonic map of the Aegean and eastern Mediterranean region showing the main plate boundaries, major suture zones, fault systems and tectonic units. Thick, white arrows depict the direction and magnitude (mm a21) of plate convergence; grey arrows mark the direction of extension (Miocene–Recent). Orange and purple delineate Eurasian and African plate affinities, respectively. Key to lettering: BF, Burdur fault; CACC, Central Anatolian Crystalline Complex; DKF, Datc¸a–Kale fault (part of the SW Anatolian Shear Zone); EAFZ, East Anatolian fault zone; EF, Ecemis fault; EKP, Erzurum–Kars Plateau; IASZ, Izmir–Ankara suture zone; IPS, Intra–Pontide suture zone; ITS, Inner–Tauride suture; KF, Kefalonia fault; KOTJ, Karliova triple junction; MM, Menderes massif; MS, Marmara Sea; MTR, Maras triple junction; NAFZ, North Anatolian fault zone; OF, Ovacik fault; PSF, Pampak–Sevan fault; TF, Tutak fault; TGF, Tuzgo¨lu¨ fault; TIP, Turkish–Iranian plateau (modified from Dilek 2006).
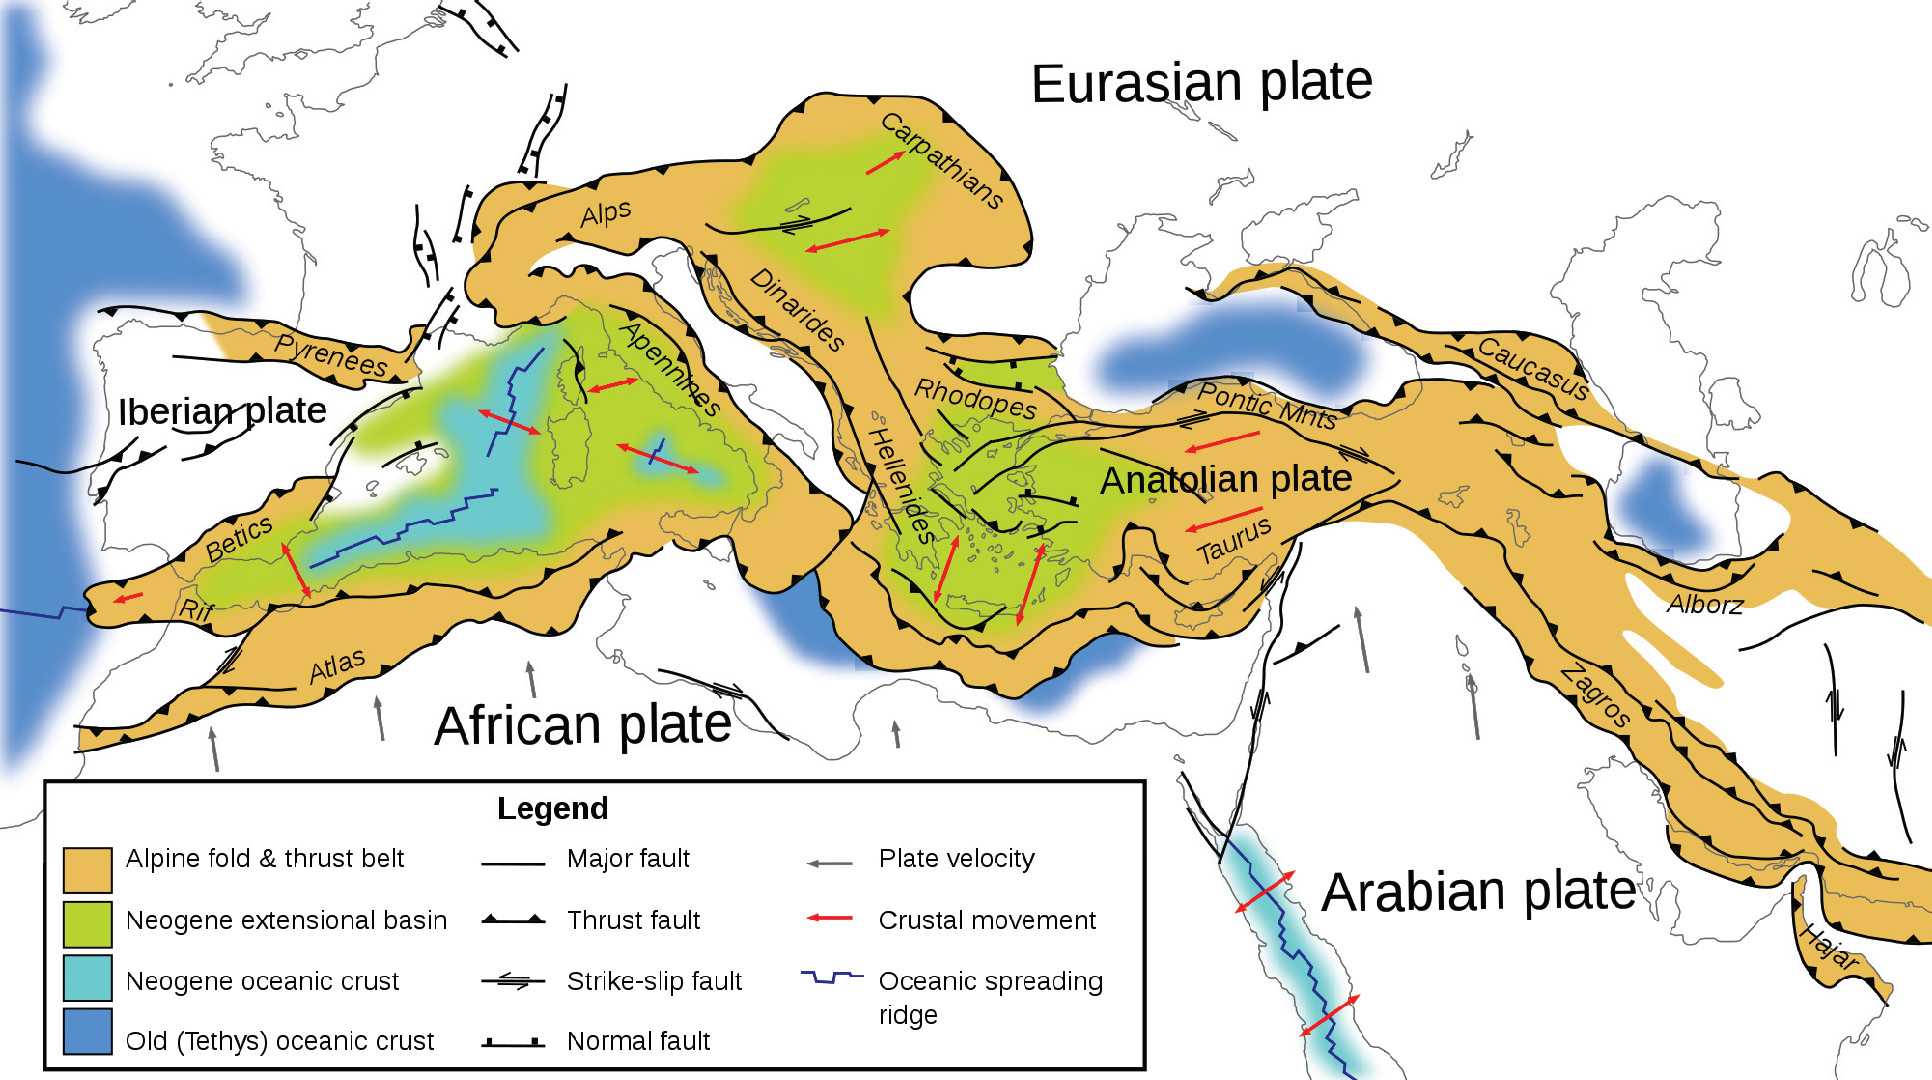
- This is the Woudloper (2009) tectonic map of the Mediterranean Sea. The yellow/orange band represents the Alpide Belt, a convergent plate boundary that extends from western Europe, through the Middle East, beneath northern India and Nepal (forming the Himalayas), through Indonesia, terminating east of Australia.
- Below is a series of figures from Jolivet et al. (2013). These show various data sets and analyses for Greece and Turkey.
- Upper Panel (A): This is a tectonic map showing the major faults and geologic terranes in the region. The fault possibly associated with today’s earthquake is labeled “Neo Tethys Suture” on the map, for the Eastern Anatolia fault.
- Lower Panel (B): This shows historic seismicity for the region. Note the general correlation with the faults in the upper panel.
- Upper Panel (C): These red arrows are Global Positioning System (GPS) velocity vectors. The velocity scale vector is in the lower left corner. The main geodetic (study of plate motions and deformation of the earth) signal here is the westward motion of the North Anatolian fault system as it rotates southward as it traverses Greece. The motion trends almost south near the island of Crete, which is perpendicular to the subduction zone.
- Lower Panel (D): This map shows the region of mid-Cenozoic (Oligo-Miocene) extension (shaded orange). It just happens that there is still extension going on in parts of this prehistoric extension.
- Upper Panel (E): This map shows where the downgoing slab may be located (in blue), along with the volcanic centers associated with the subduction zone in the past.
- Lower Panel (F): This map shows the orientation of how seismic waves orient themselves differently in different places (anisotropy). We think seismic waves travel in ways that reflects how tectonic strain is stored in the earth. The blue lines show the direction of extension in the asthenosphere, green lines in the lithospheric mantle, and red lines for the crust.
- Upper Panel (G): This is the map showing focal mechanisms in the poster above. Note the strike slip earthquakes associated with the North Anatolia and East Anatolia faults and the thrust/reverse mechanisms associated with the thrust faults.
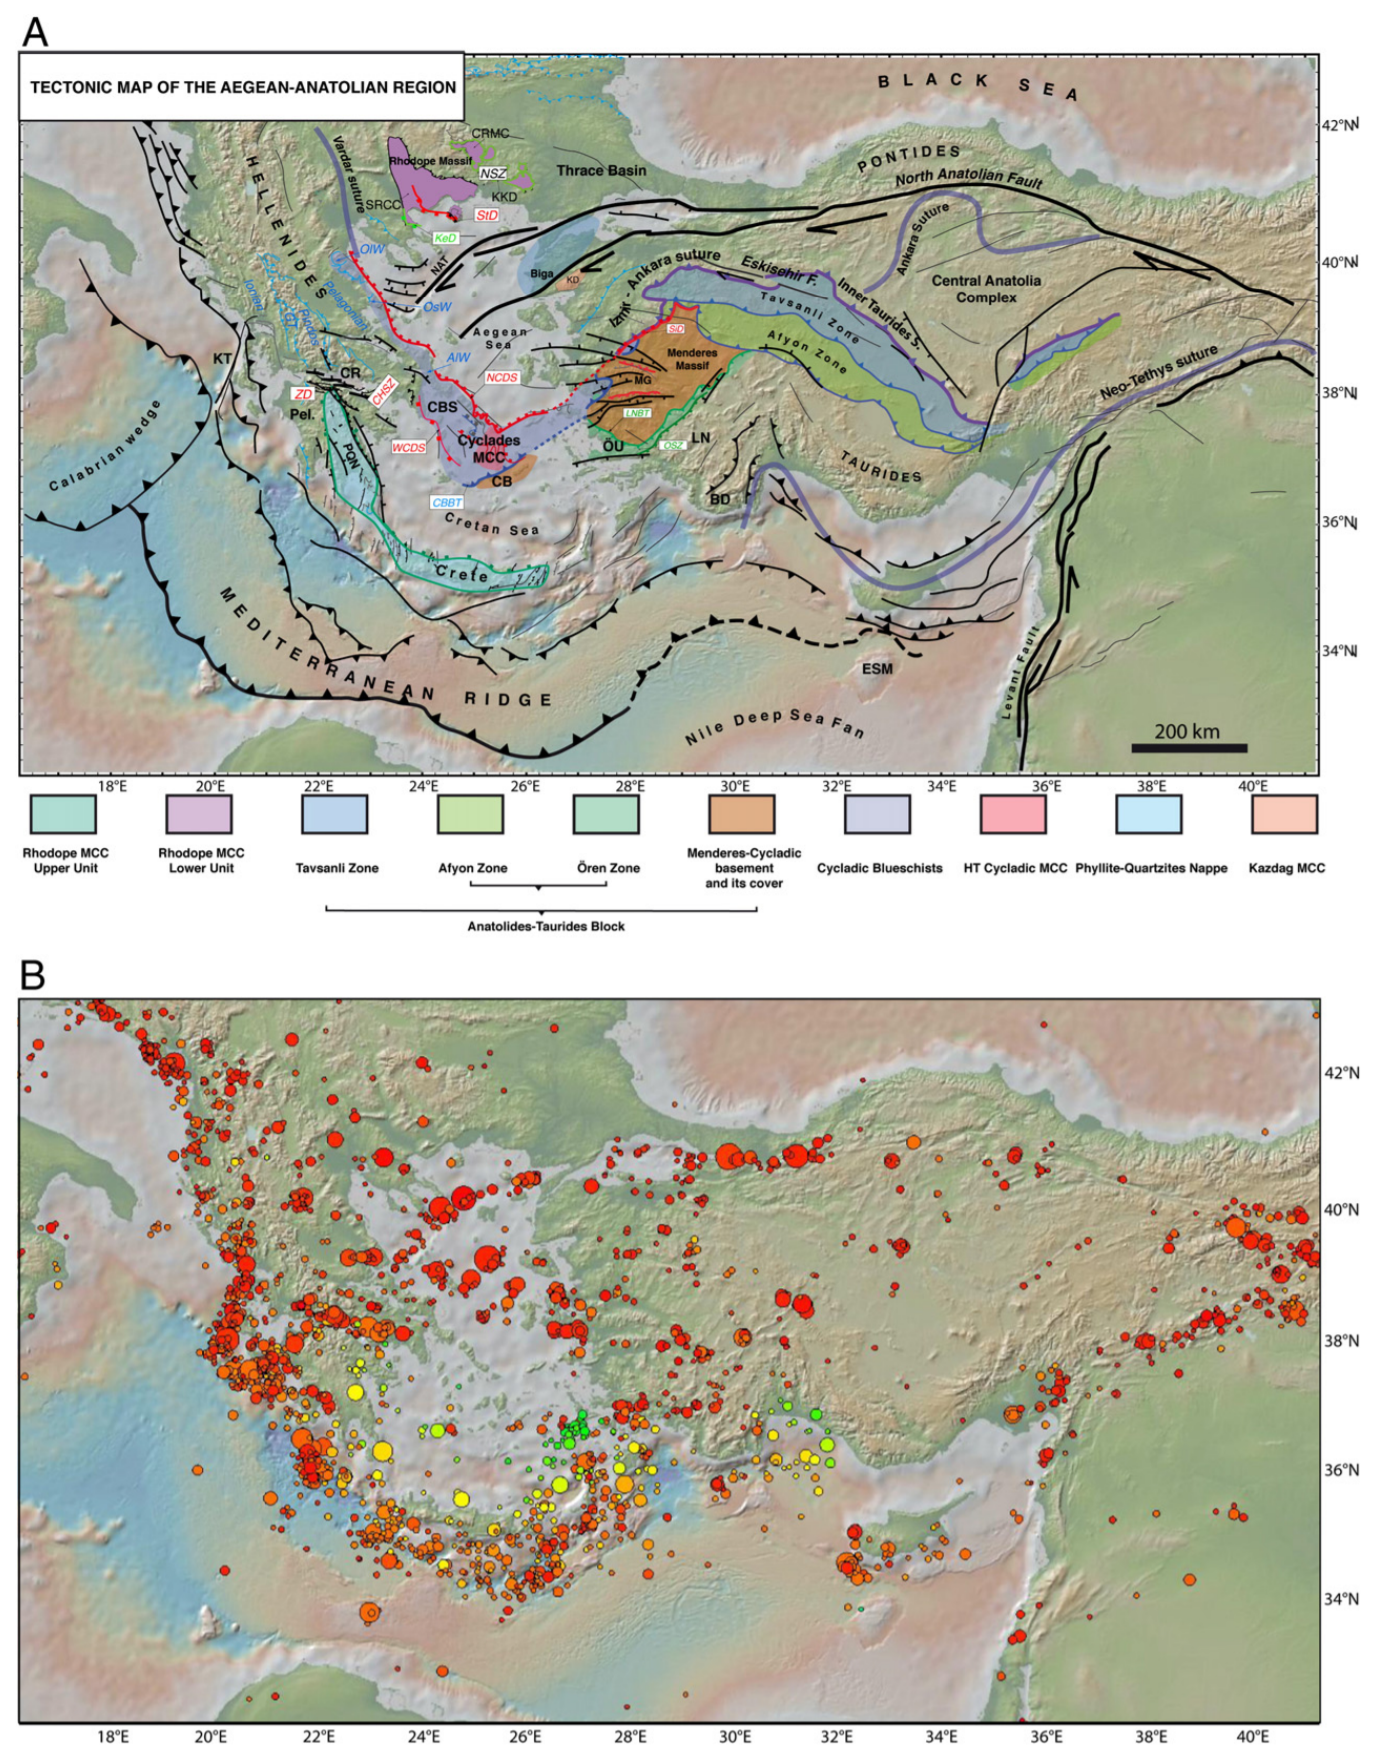
A: Tectonic map of the Aegean and Anatolian region showing the main active structures
(black lines), the main sutures zones (thick violet or blue lines), the main thrusts in the Hellenides where they have not been reworked by later extension (thin blue lines), the North Cycladic Detachment (NCDS, in red) and its extension in the Simav Detachment (SD), the main metamorphic units and their contacts; AlW: Almyropotamos window; BD: Bey Daglari; CB: Cycladic Basement; CBBT: Cycladic Basement basal thrust; CBS: Cycladic Blueschists; CHSZ: Central Hellenic Shear Zone; CR: Corinth Rift; CRMC: Central Rhodope Metamorphic Complex; GT: Gavrovo–Tripolitza Nappe; KD: Kazdag dome; KeD: Kerdylion Detachment; KKD: Kesebir–Kardamos dome; KT: Kephalonia Transform Fault; LN: Lycian Nappes; LNBT: Lycian Nappes Basal Thrust; MCC: Metamorphic Core Complex; MG: Menderes Grabens; NAT: North Aegean Trough; NCDS: North Cycladic Detachment System; NSZ: Nestos Shear Zone; OlW: Olympos Window; OsW: Ossa Window; OSZ: Ören Shear Zone; Pel.: Peloponnese; ÖU: Ören Unit; PQN: Phyllite–Quartzite Nappe; SiD: Simav Detachment; SRCC: South Rhodope Core Complex; StD: Strymon Detachment; WCDS: West Cycladic Detachment System; ZD: Zaroukla Detachment. B: Seismicity. Earthquakes are taken from the USGS-NEIC database. Colour of symbols gives the depth (blue for shallow depths) and size gives the magnitude (from 4.5 to 7.6).
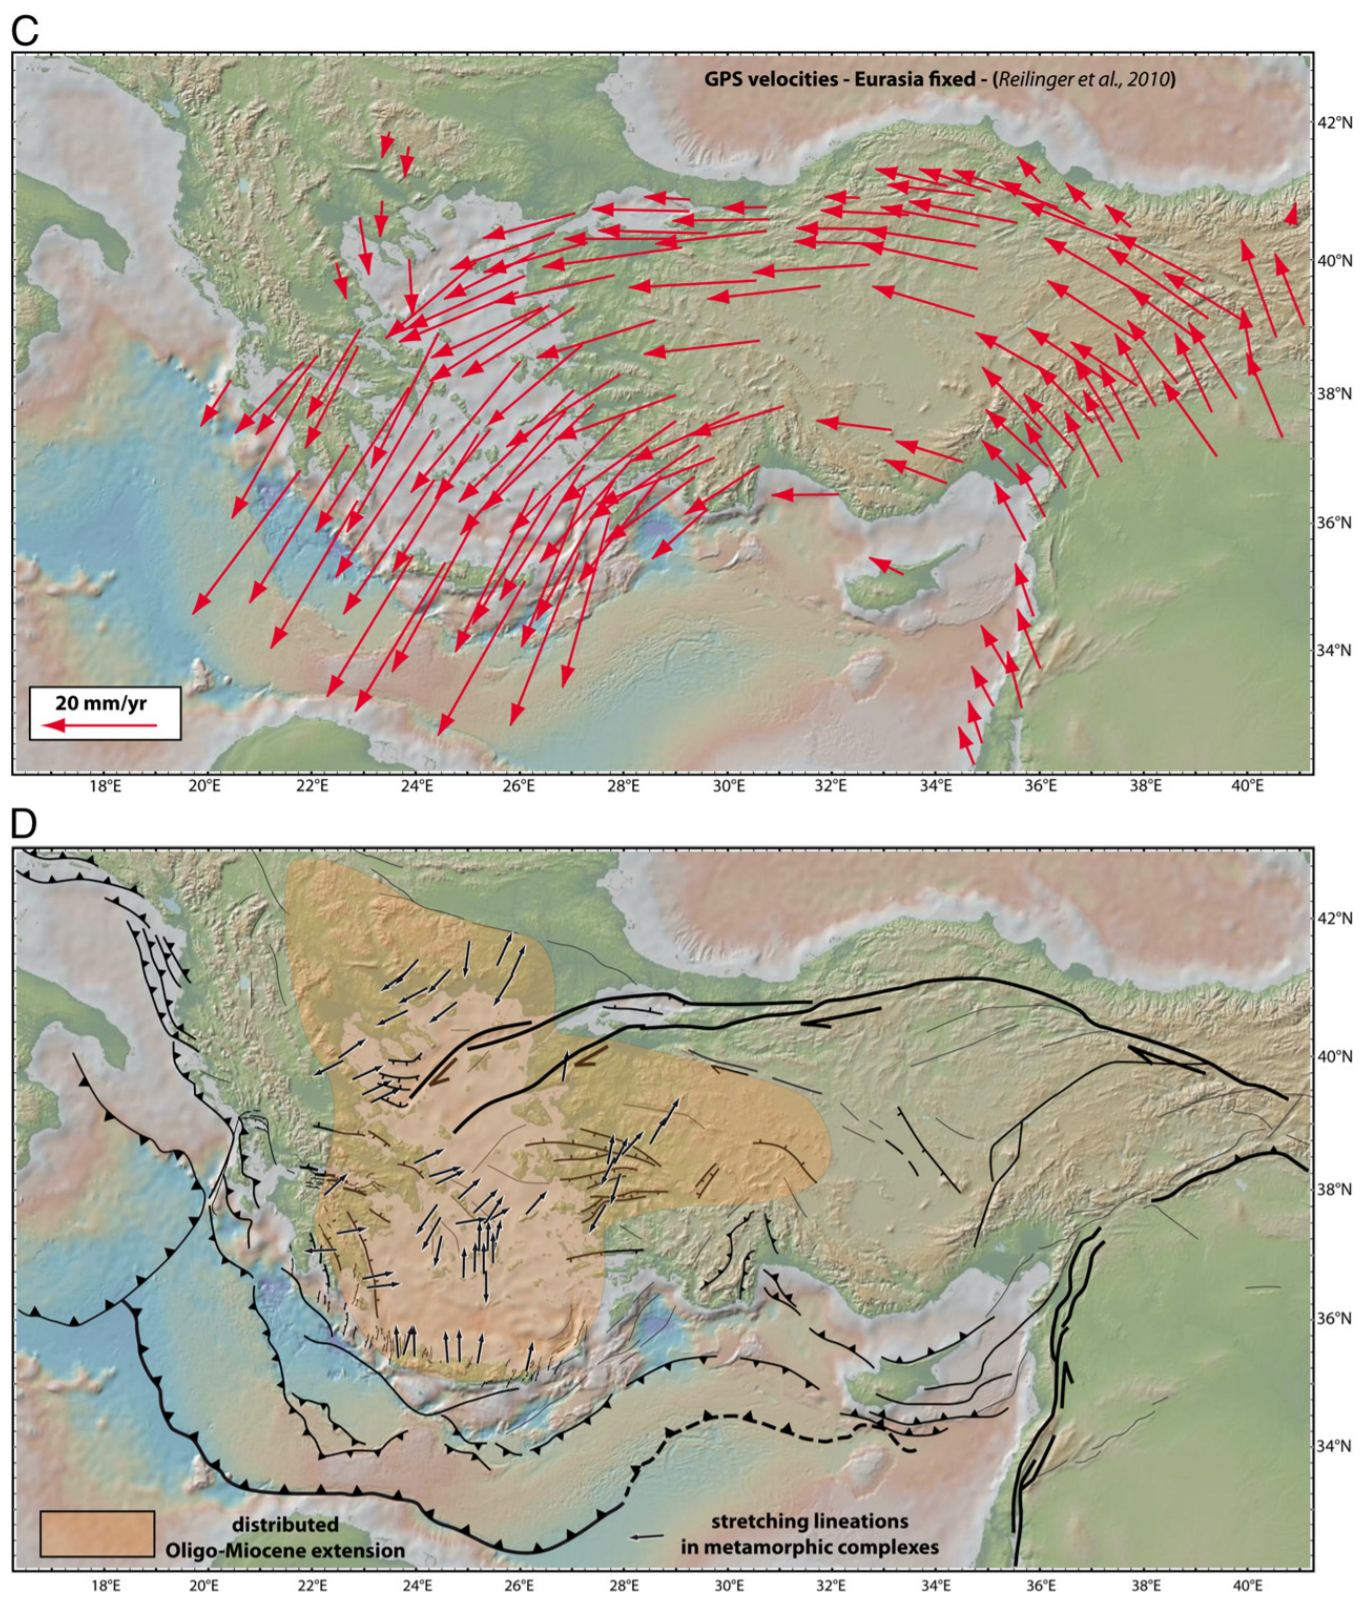
C: GPS velocity field with a fixed Eurasia after Reilinger et al. (2010) D: the domain affected by distributed post-orogenic extension in the Oligocene and the Miocene and the stretching lineations in the exhumed metamorphic complexes.
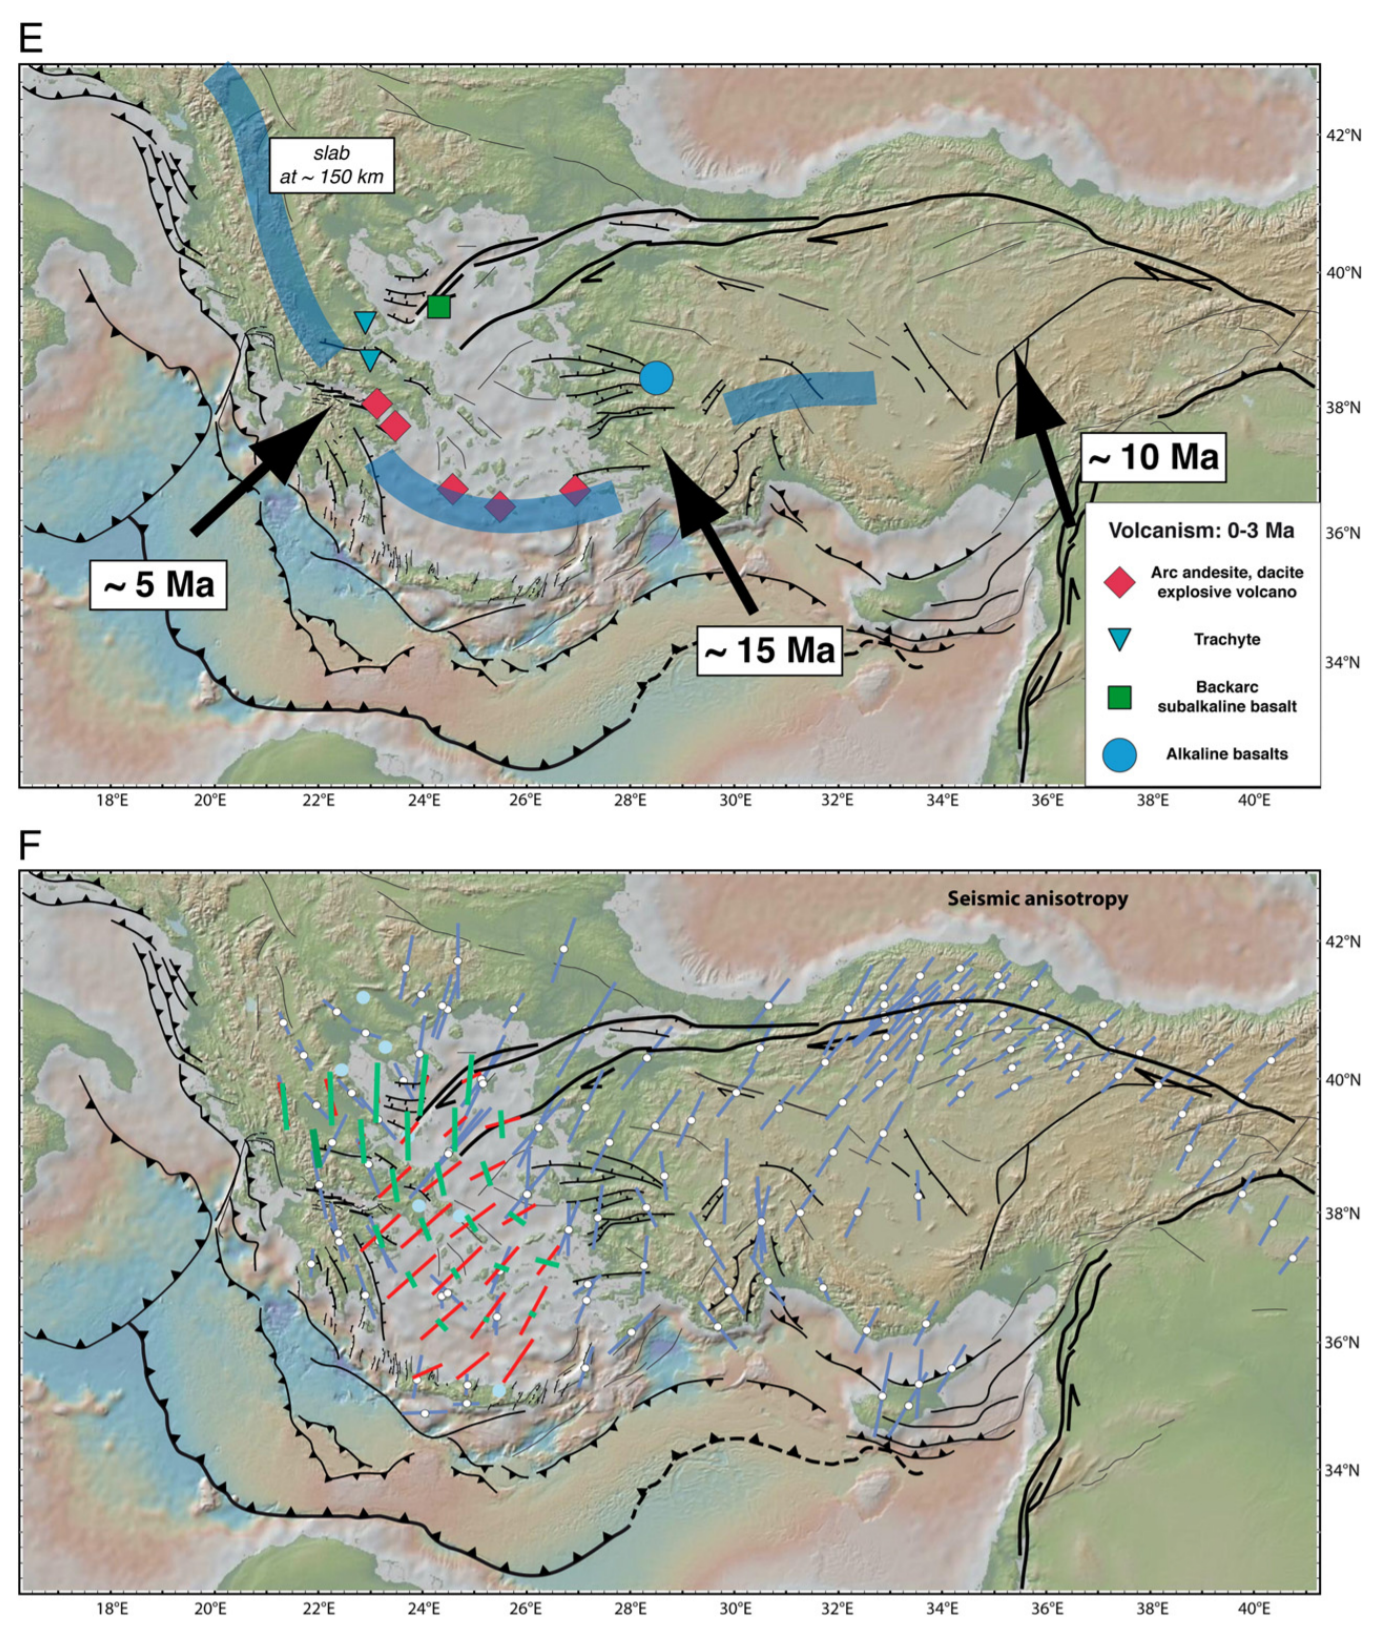
E: The thick blue lines illustrate the schematized position of the slab at ~150 km according to the tomographic model of Piromallo and Morelli (2003), and show the disruption of the slab at three positions and possible ages of these tears discussed in the text. Velocity anomalies are displayed in percentages with respect to the reference model sp6 (Morelli and Dziewonski, 1993). Coloured symbols represent the volcanic centres between 0 and 3 Ma after Pe-Piper and Piper (2006). F: Seismic anisotropy obtained from SKS waves (blue bars, Paul et al., 2010) and Rayleigh waves (green and orange bars, Endrun et al., 2011). See also Sandvol et al. (2003). Blue lines show the direction of stretching in the asthenosphere, green bars represent the stretching in the lithospheric mantle and orange bars in the lower crust.
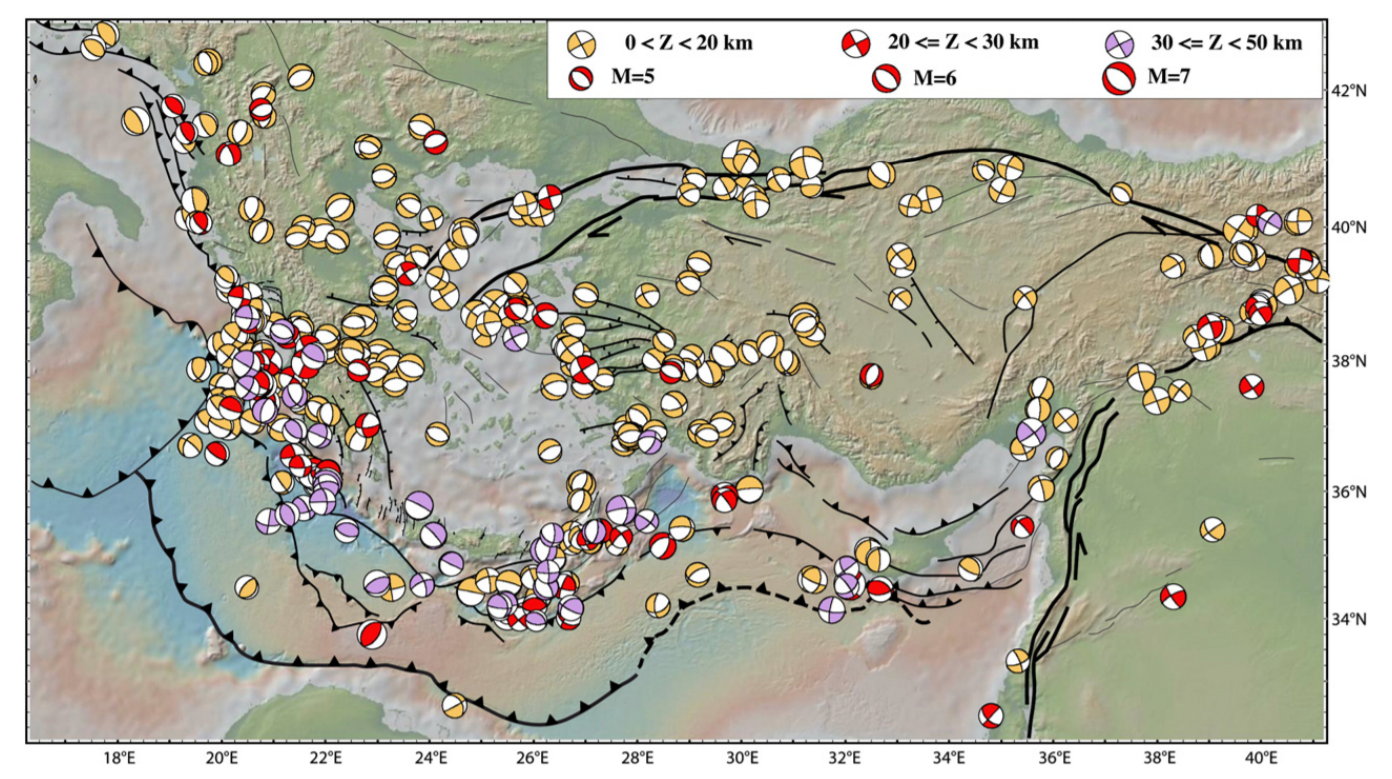
G: Focal mechanisms of earthquakes over the Aegean Anatolian region.
- Here is a map showing tectonic domains (Taymaz et al., 2007).

Schematic map of the principal tectonic settings in the Eastern Mediterranean. Hatching shows areas of coherent motion and zones of distributed deformation. Large arrows designate generalized regional motion (in mm a21) and errors (recompiled after McClusky et al. (2000, 2003). NAF, North Anatolian Fault; EAF, East Anatolian Fault; DSF, Dead Sea Fault; NEAF, North East Anatolian Fault; EPF, Ezinepazarı Fault; CTF, Cephalonia Transform Fault; PTF, Paphos Transform Fault.
- Here is a tectonic overview figure from Duman and Emre, 2013.

The main fault systems of the AN–AR and TR–AF plate boundaries (modified from Sengor & Yılmaz 1981; Saroglu et al. 1992a, b; Westaway 2003; Emre et al. 2011a, b, c). Arrows indicate relative plate motions (McClusky et al. 2000). Abbreviations: AN, Anatolian microplate; AF, African plate; AR, Arabian plate; EU, Eurasian plate; NAFZ, North Anatolian Fault Zone; EAFZ, East Anatolian Fault Zone; DSFZ, Dead Sea Fault Zone; MF; Malatya Fault, TF, Tuzgo¨lu¨ fault; EF, Ecemis¸ fault; SATZ, Southeast Anatolian Thrust Zone; SS, southern strand of the EAFZ; NS, northern strand of the EAFZ.
- This is a map that shows the subdivisions of the EAF (Duman and Emre, 2013). Note Lake Hazar for reference.
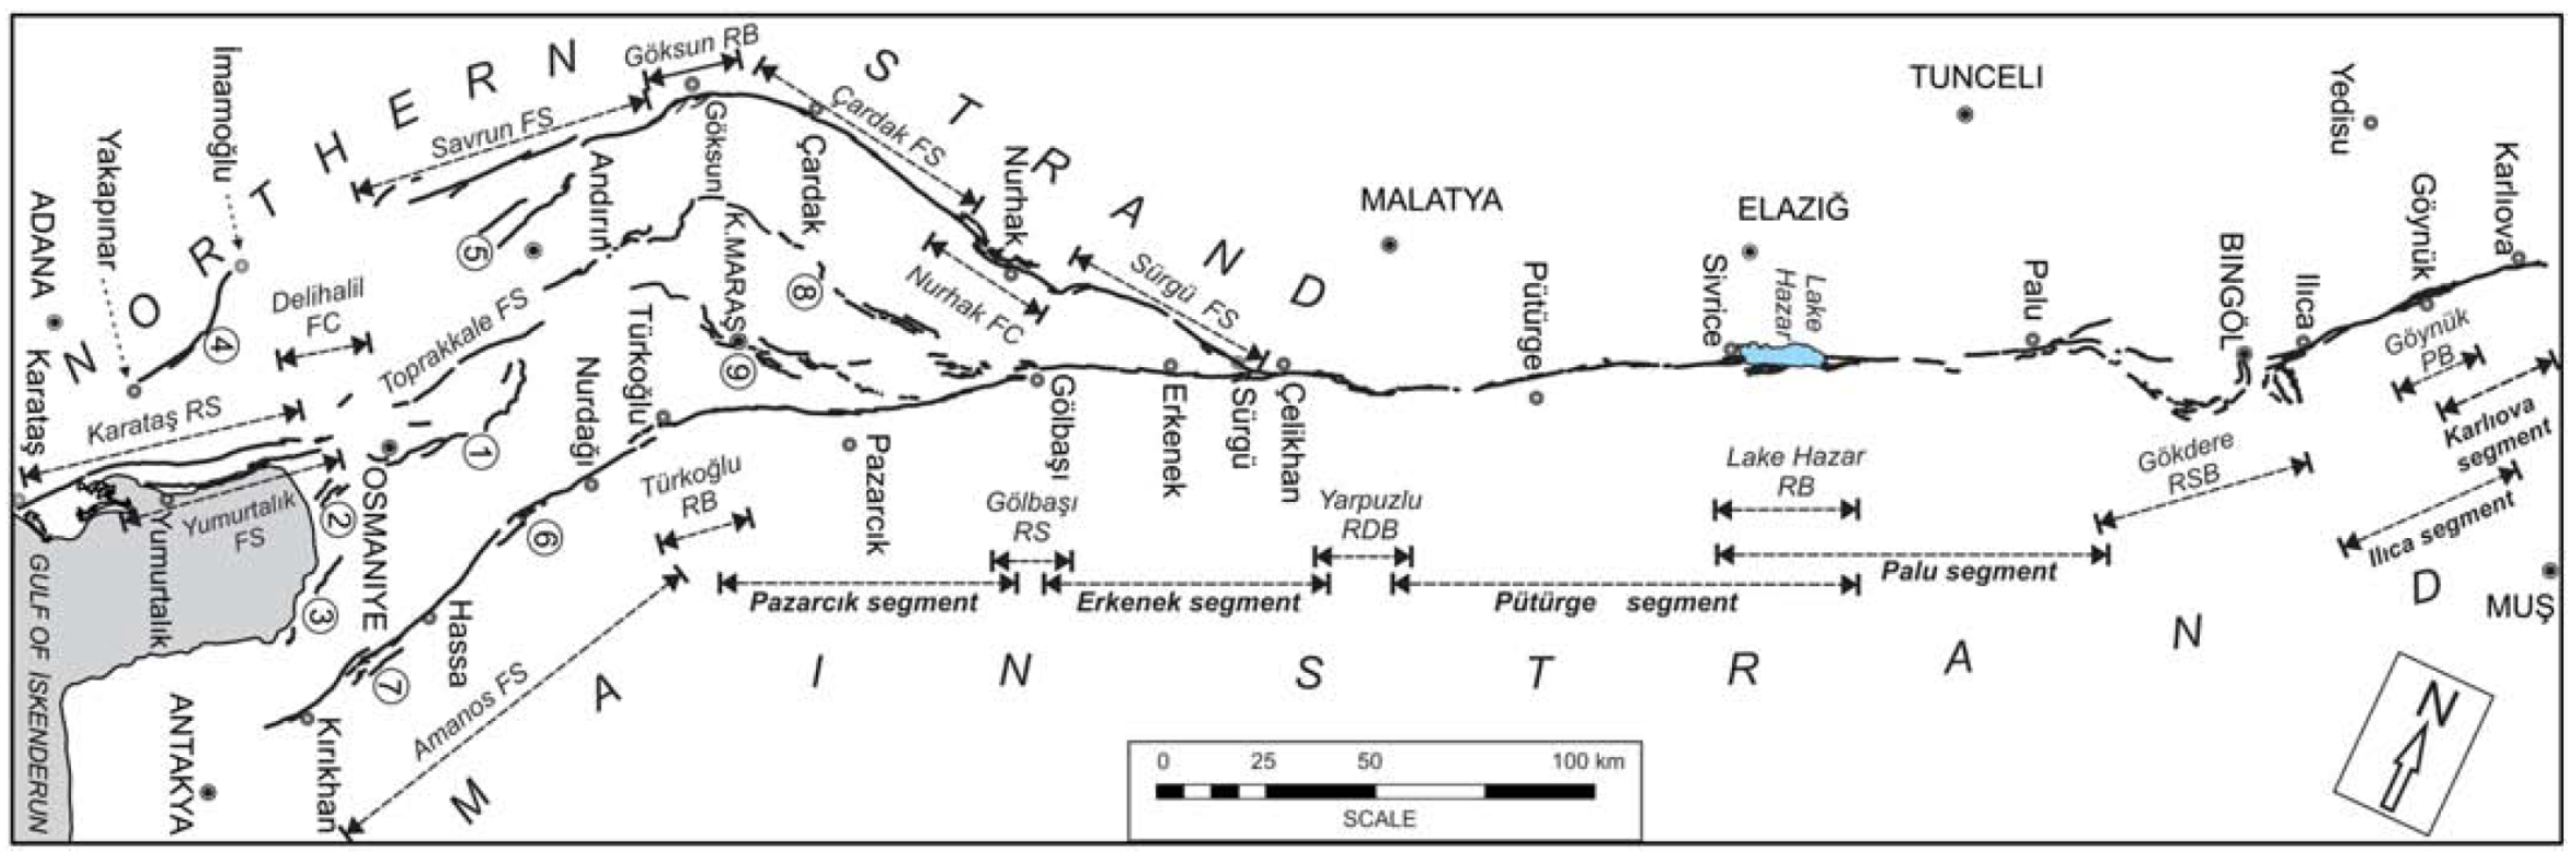
Map of the East Anatolian strike-slip fault system showing strands, segments and fault jogs. Abbreviations: FS, fault Segment; RB, releasing bend; RS, releasing stepover; RDB, restraining double bend; RSB, restraining bend; PB, paired bend; (1) Du¨zic¸i–Osmaniye fault segment; (2) Erzin fault segment; (3) Payas fault segment; (4) Yakapınar fault segment; (5) C¸ okak fault segment; (6) Islahiye releasing bend; (7) Demrek restraining stepover; (8) Engizek fault zone; (9) Maras¸ fault zone.
- This map shows the fault mapping from Duman and Emre, 2013. Note Lake Hazar for reference. We can see some of the thrust faults mapped as part of the Southeast Anatolia fault zone.

Map of the (a) Palu and (b) Puturge segments of the East Anatolian fault. Abbreviations: LHRB, Lake Hazar releasing bend; PS, Palu segment; ES, Erkenek segment; H, hill; M, mountain; C, creek; (1) left lateral strike-slip fault; (2) normal fault; (3) reverse or thrust fault; (4) East Anatolian Fault; (5) Southeastern Anatolian Thrust Zone; (6) syncline;(7) anticline; (8) undifferentiated Holocene deposits; (9) undifferentiated Quaternary deposits; (10) landslide.
- This is the figure from Duman and Emre (2013) that shows the spatial extent for historic earthquakes on the EAF.
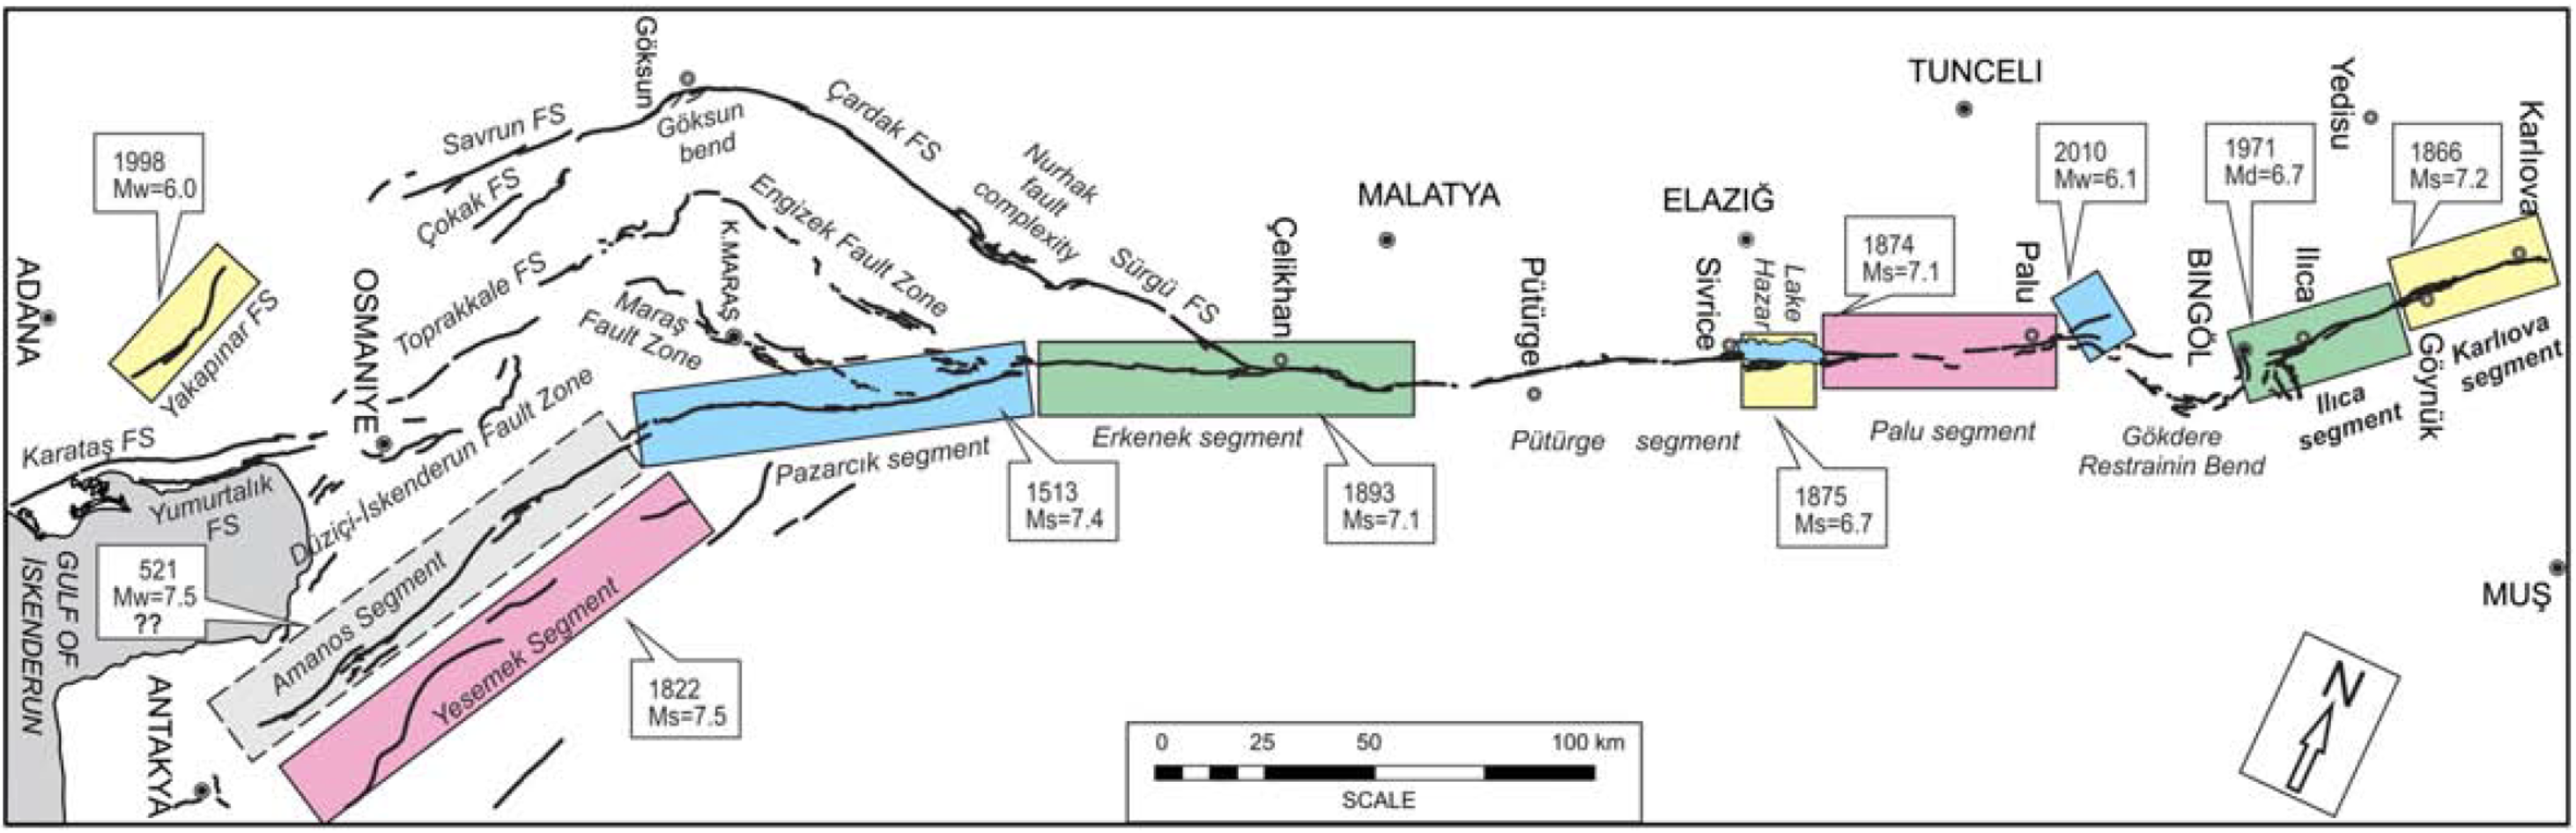
Surface ruptures produced by large earthquakes during the 19th and 20th centuries along the EAF. Data from Arpat (1971), Arpat and S¸arog˘lu (1972), Seymen and Aydın (1972), Ambraseys (1988), Ambraseys and Jackson (1998), Cetin et al. (2003), Herece (2008), Karabacak et al. (2011) and this study. Ruptured fault segments are highlighted.
Seismic Hazard and Seismic Risk
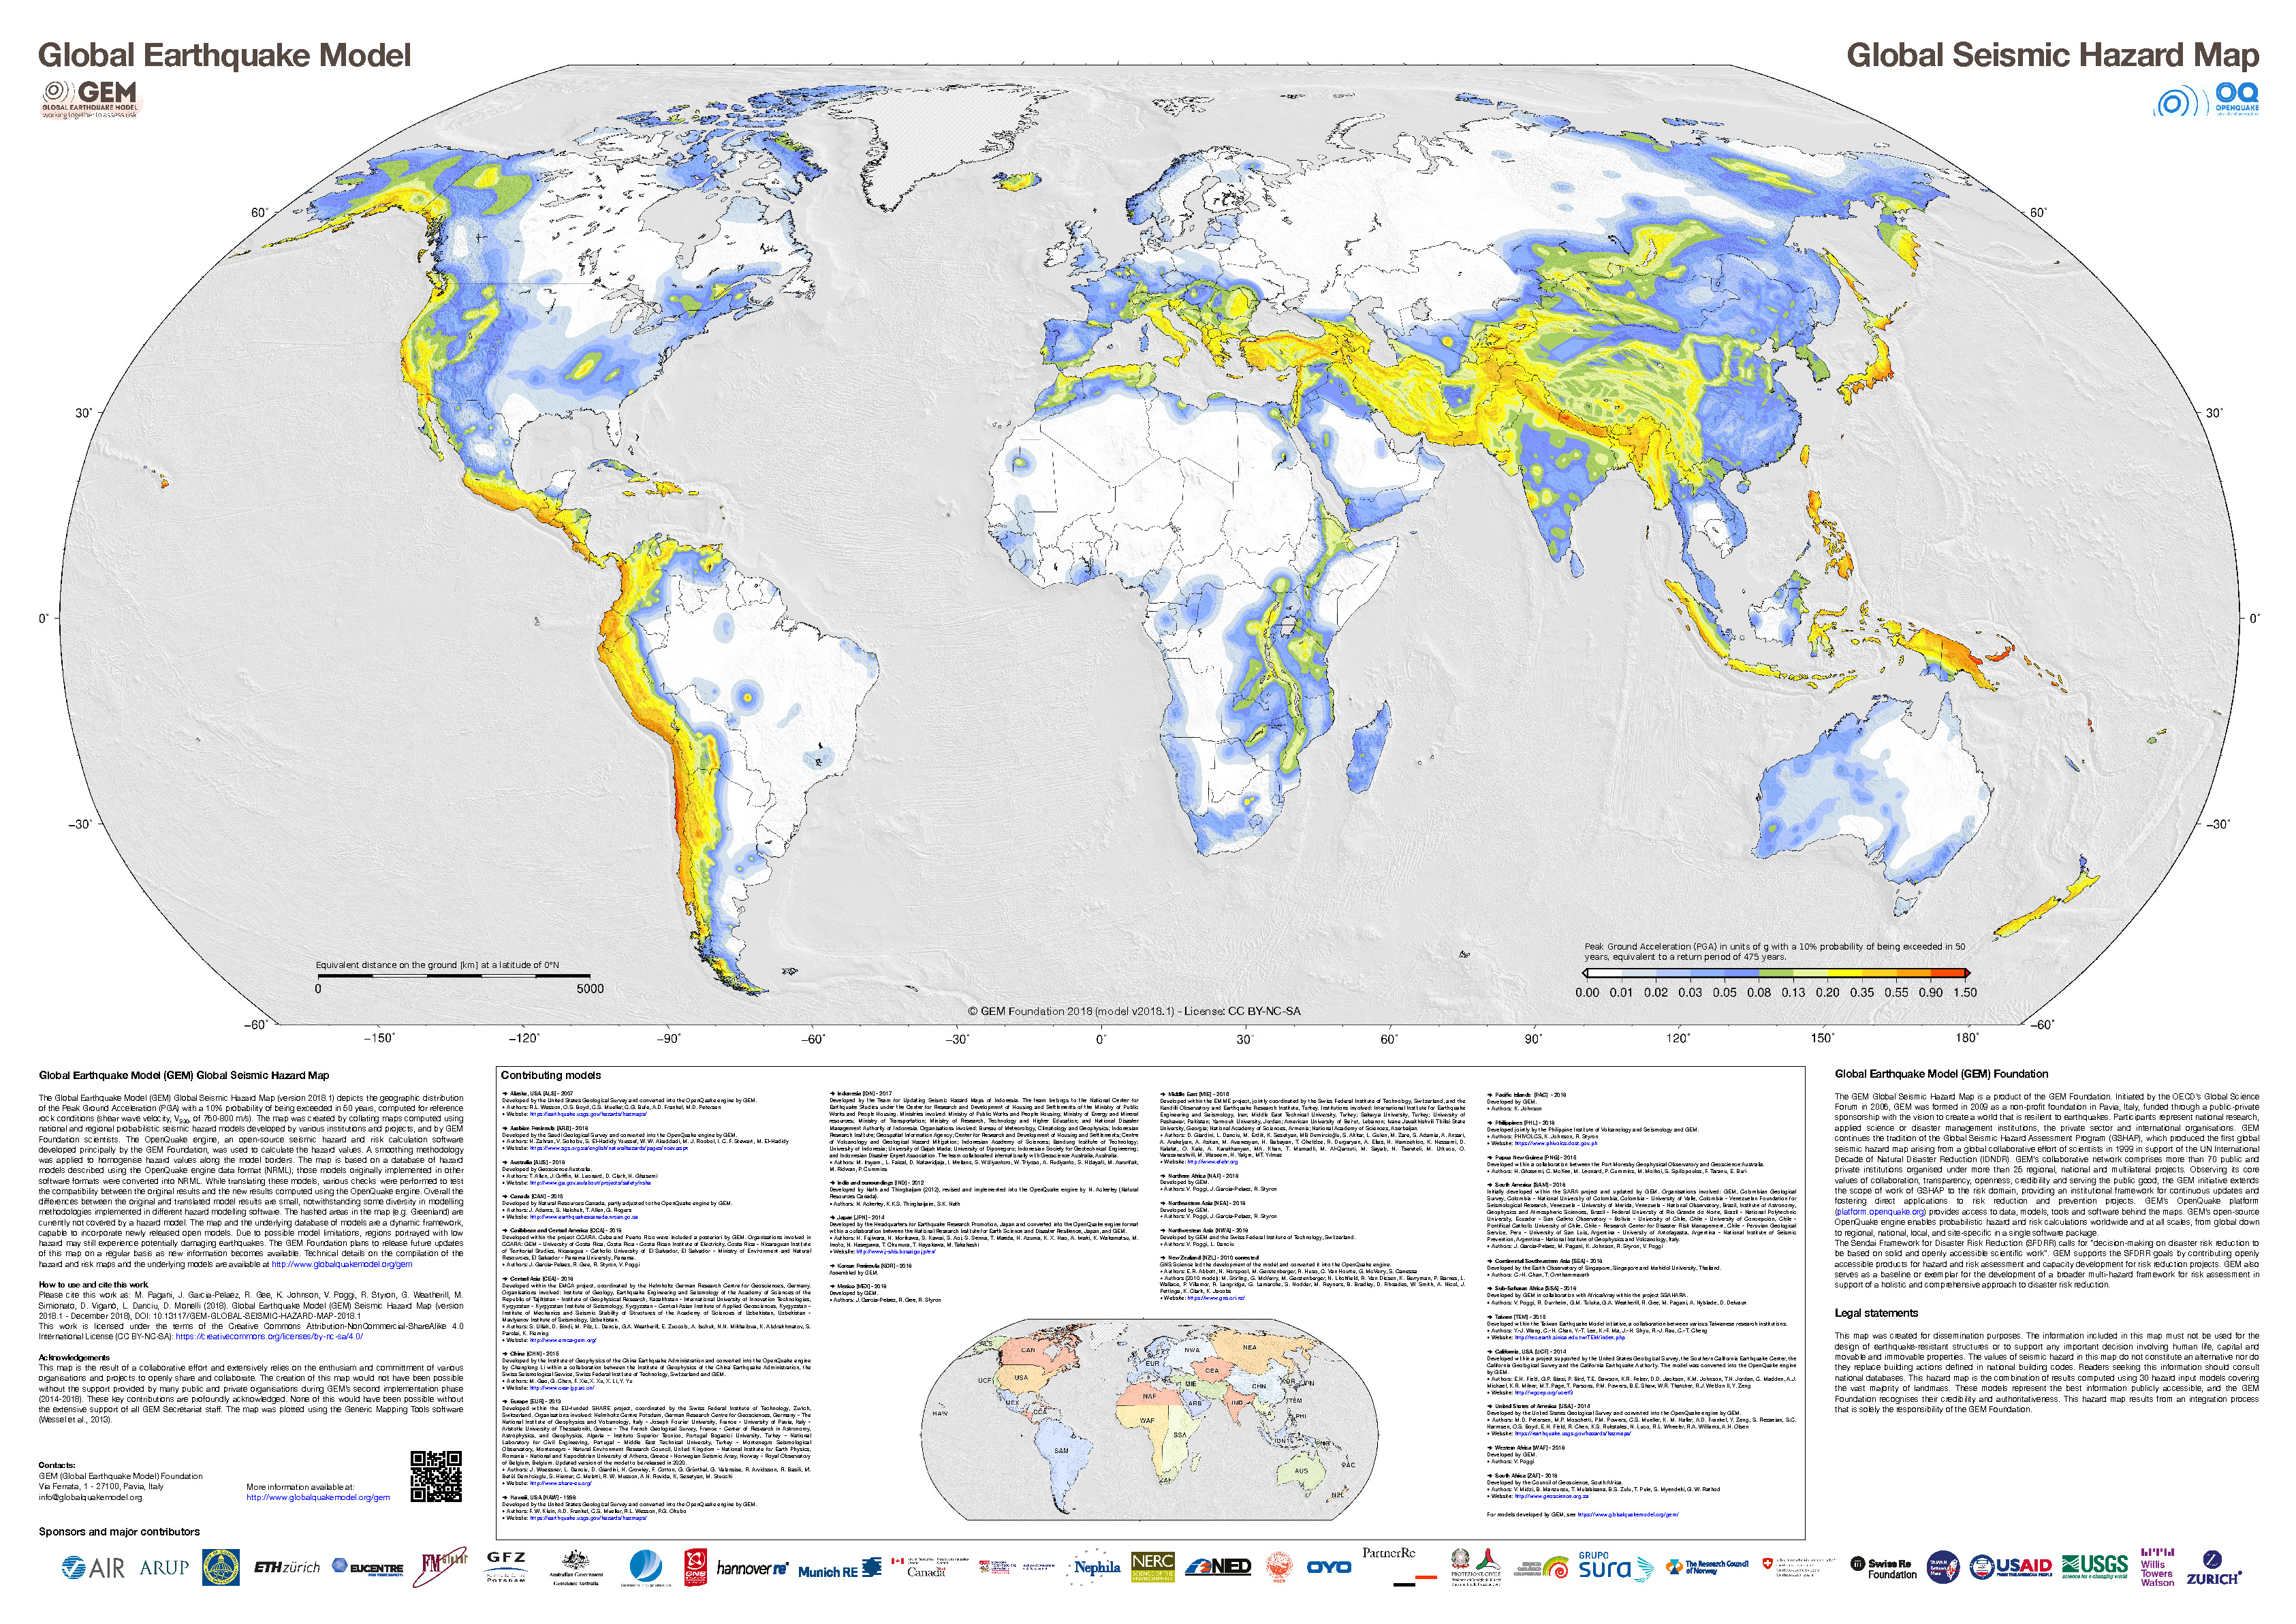
- These are the two seismic maps from the Global Earthquake Model (GEM) project, the GEM Seismic Hazard and the GEM Seismic Risk maps from Pagani et al. (2018) and Silva et al. (2018).
- The GEM Seismic Hazard Map:
- The Global Earthquake Model (GEM) Global Seismic Hazard Map (version 2018.1) depicts the geographic distribution of the Peak Ground Acceleration (PGA) with a 10% probability of being exceeded in 50 years, computed for reference rock conditions (shear wave velocity, VS30, of 760-800 m/s). The map was created by collating maps computed using national and regional probabilistic seismic hazard models developed by various institutions and projects, and by GEM Foundation scientists. The OpenQuake engine, an open-source seismic hazard and risk calculation software developed principally by the GEM Foundation, was used to calculate the hazard values. A smoothing methodology was applied to homogenise hazard values along the model borders. The map is based on a database of hazard models described using the OpenQuake engine data format (NRML). Due to possible model limitations, regions portrayed with low hazard may still experience potentially damaging earthquakes.
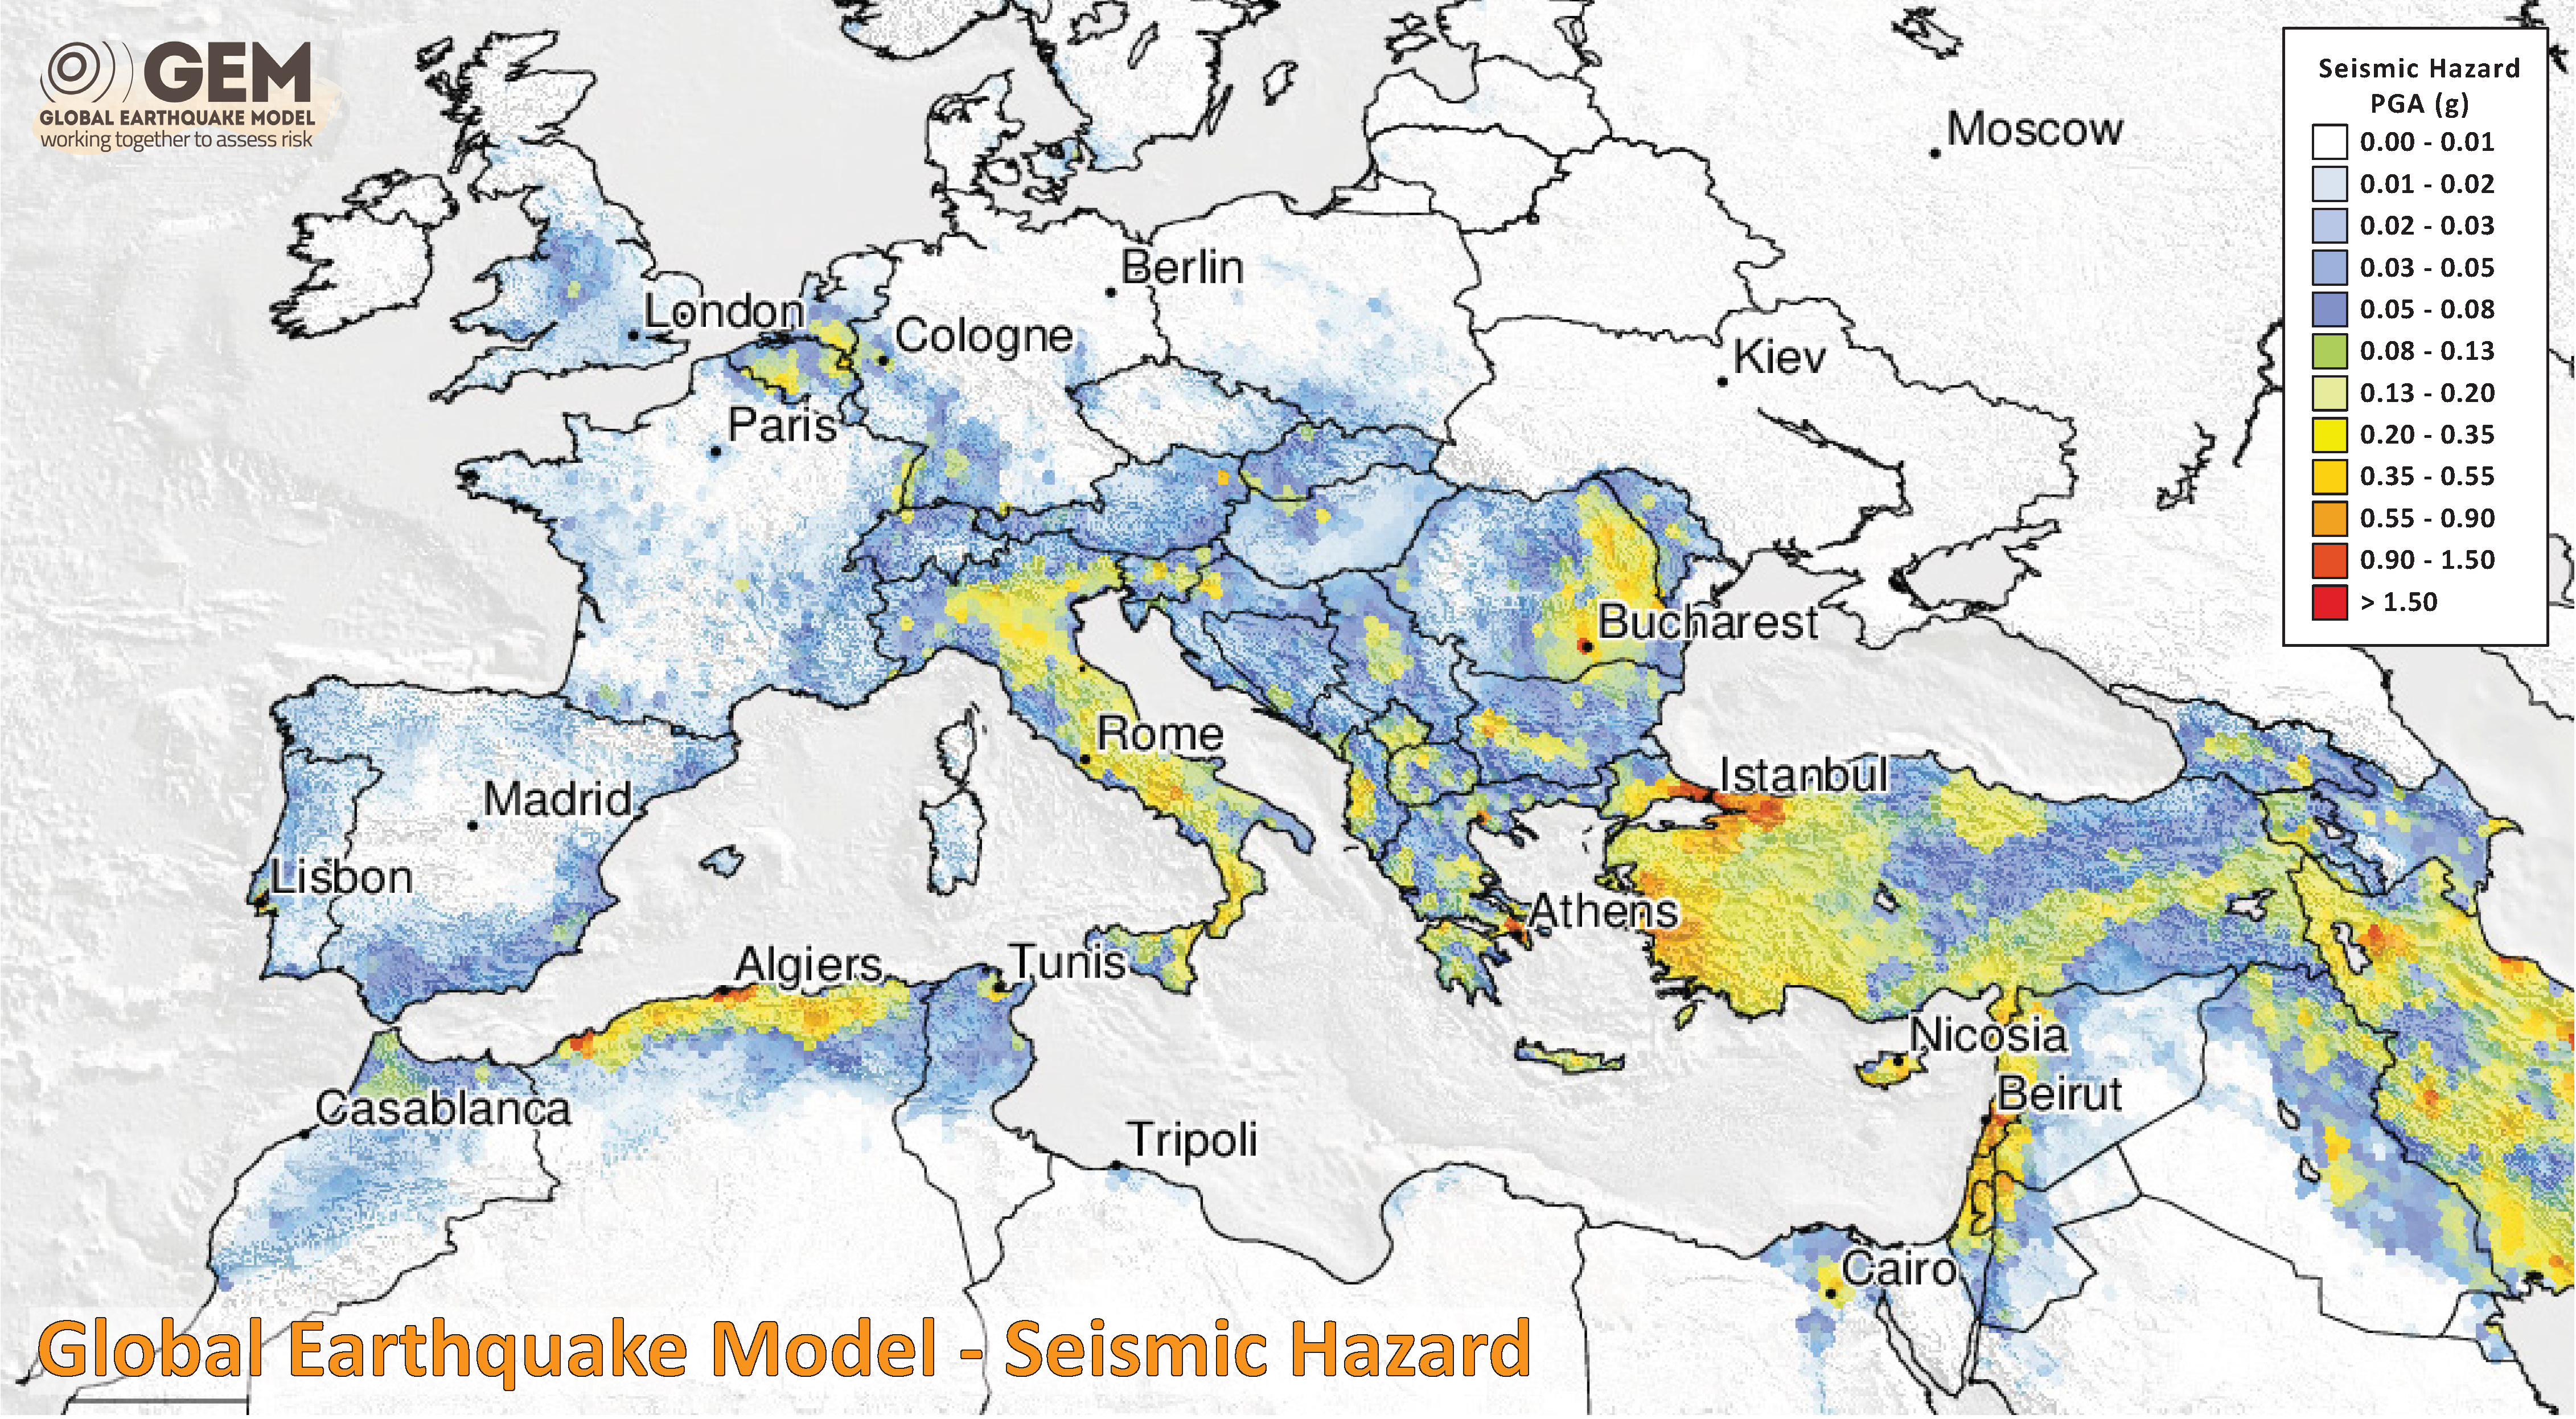
- Here is a view of the GEM seismic hazard map for Europe.
- The USGS Seismic Hazard Map:
- Here is a map that displays an estimate of seismic hazard for the region (Jenkins et al., 2010). This comes from Giardini et al. (1999).
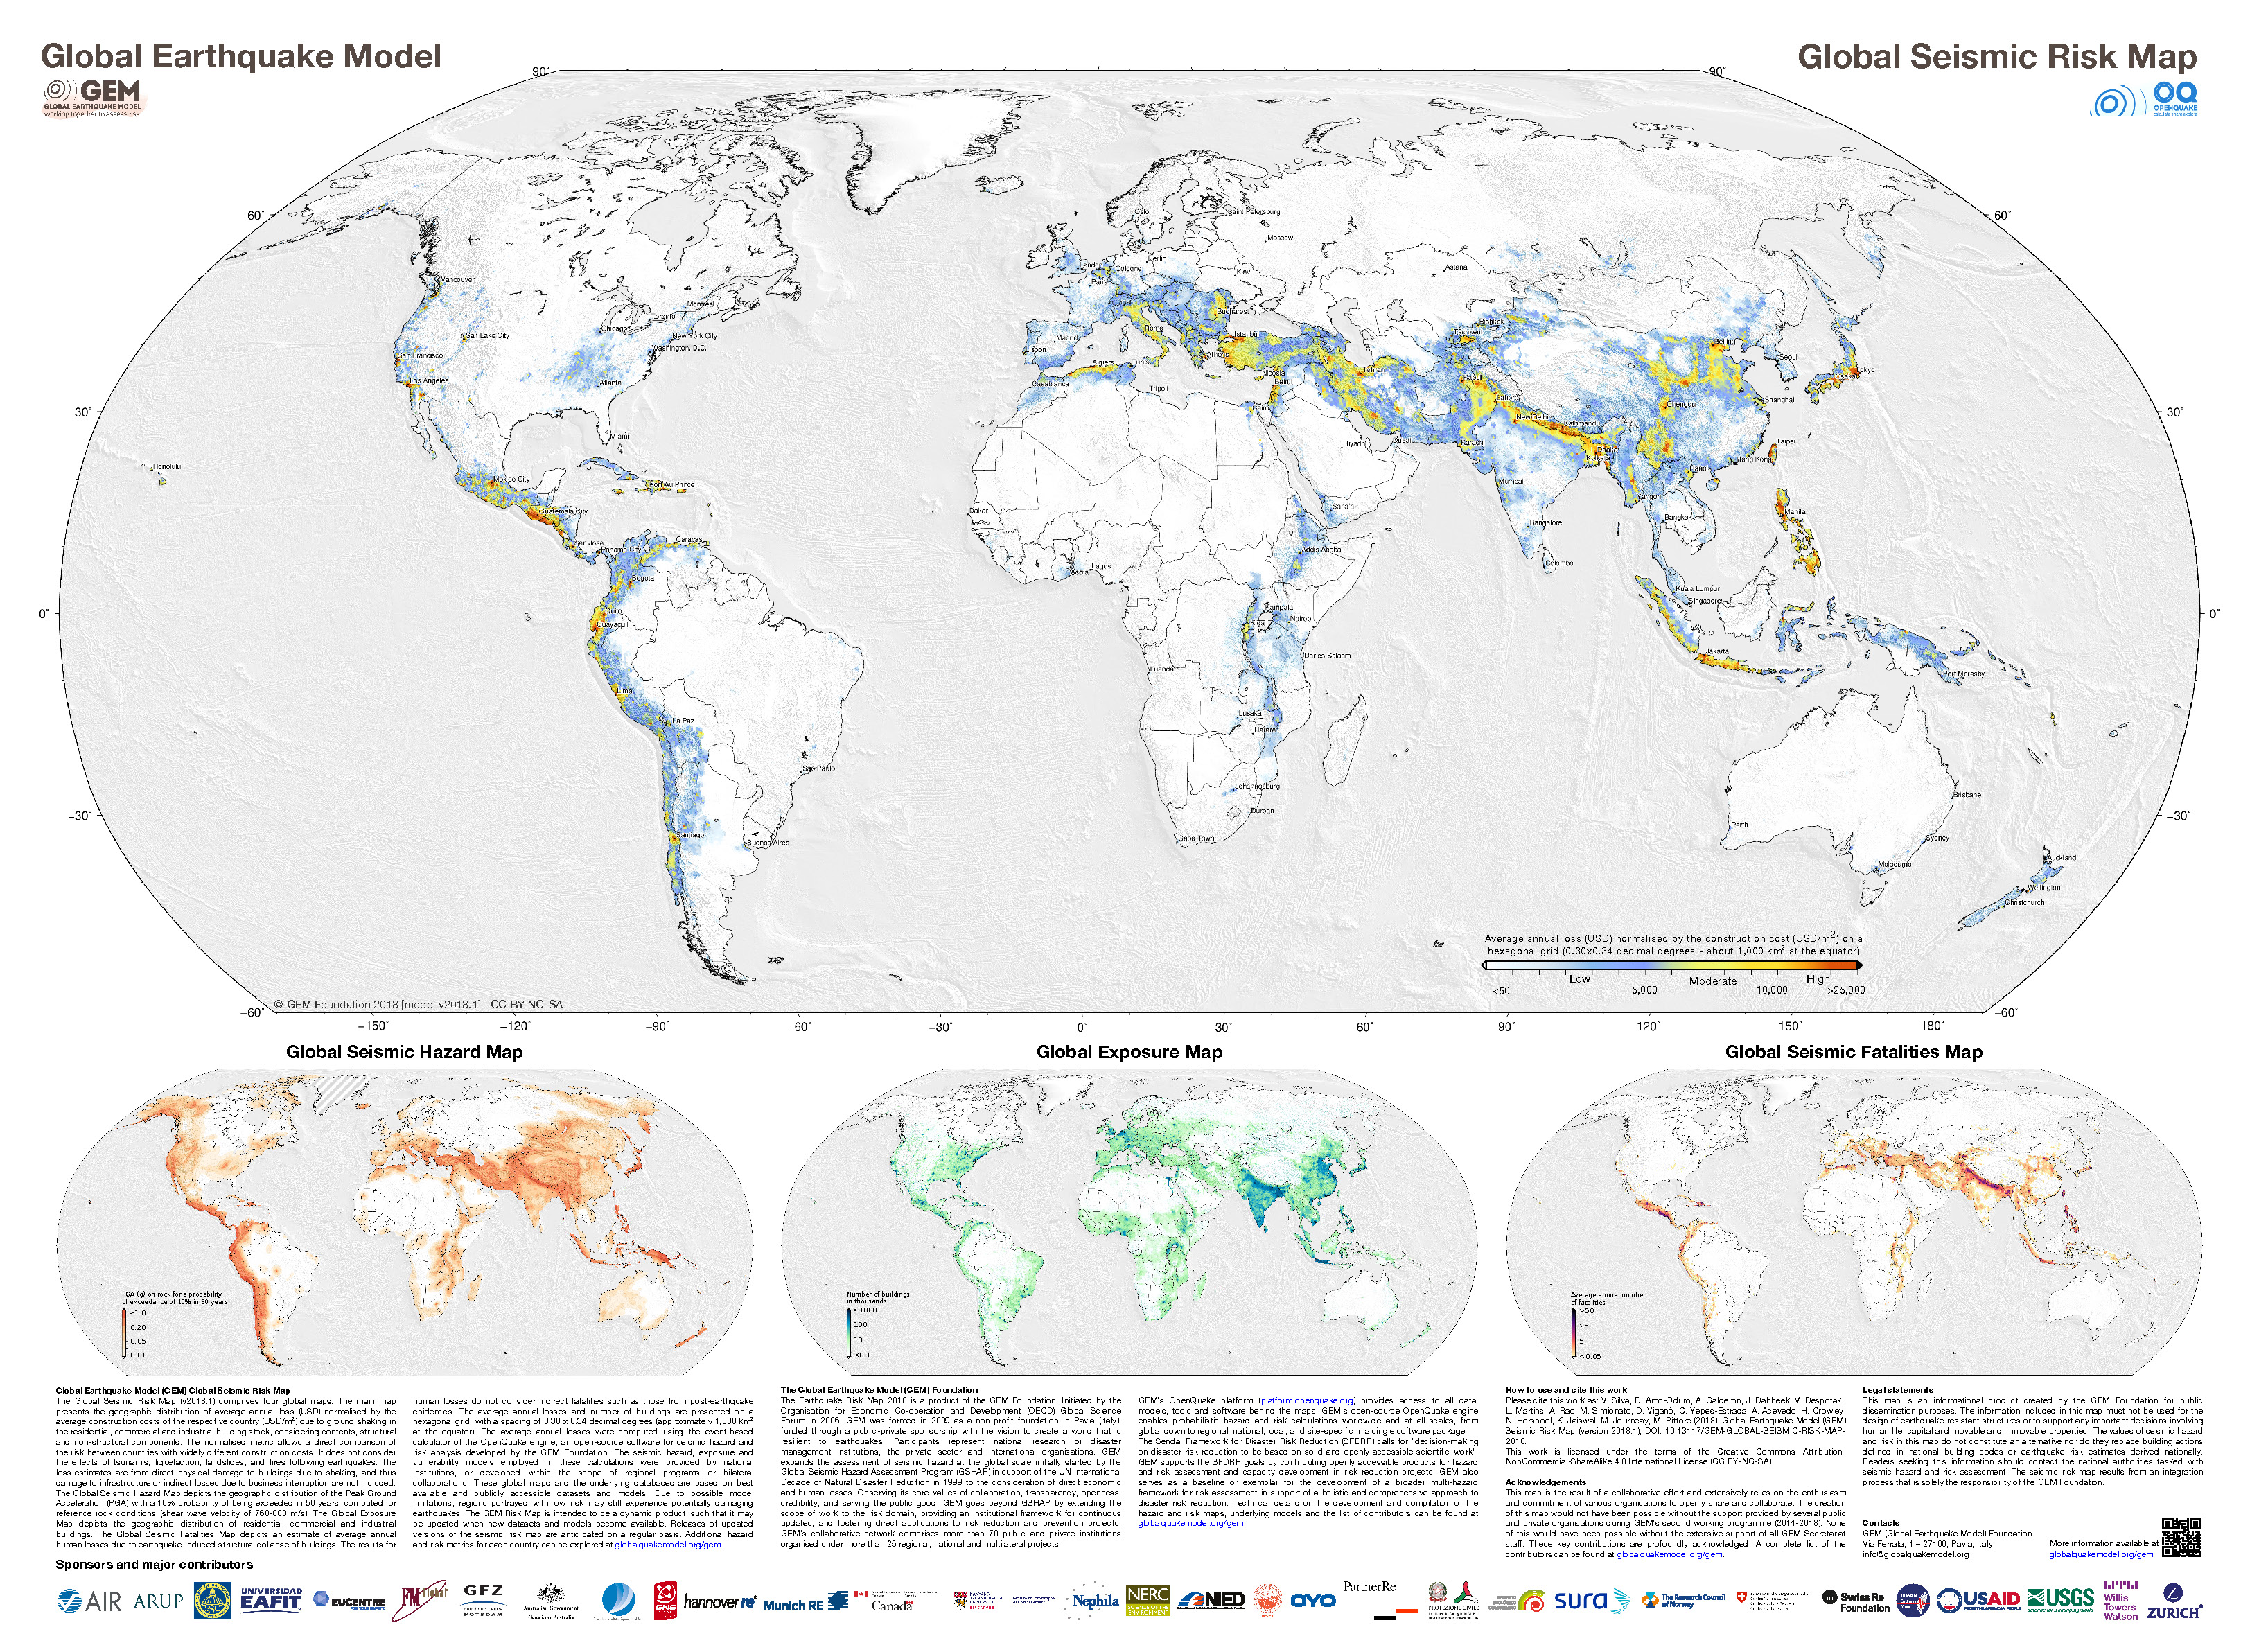
- The GEM Seismic Risk Map:
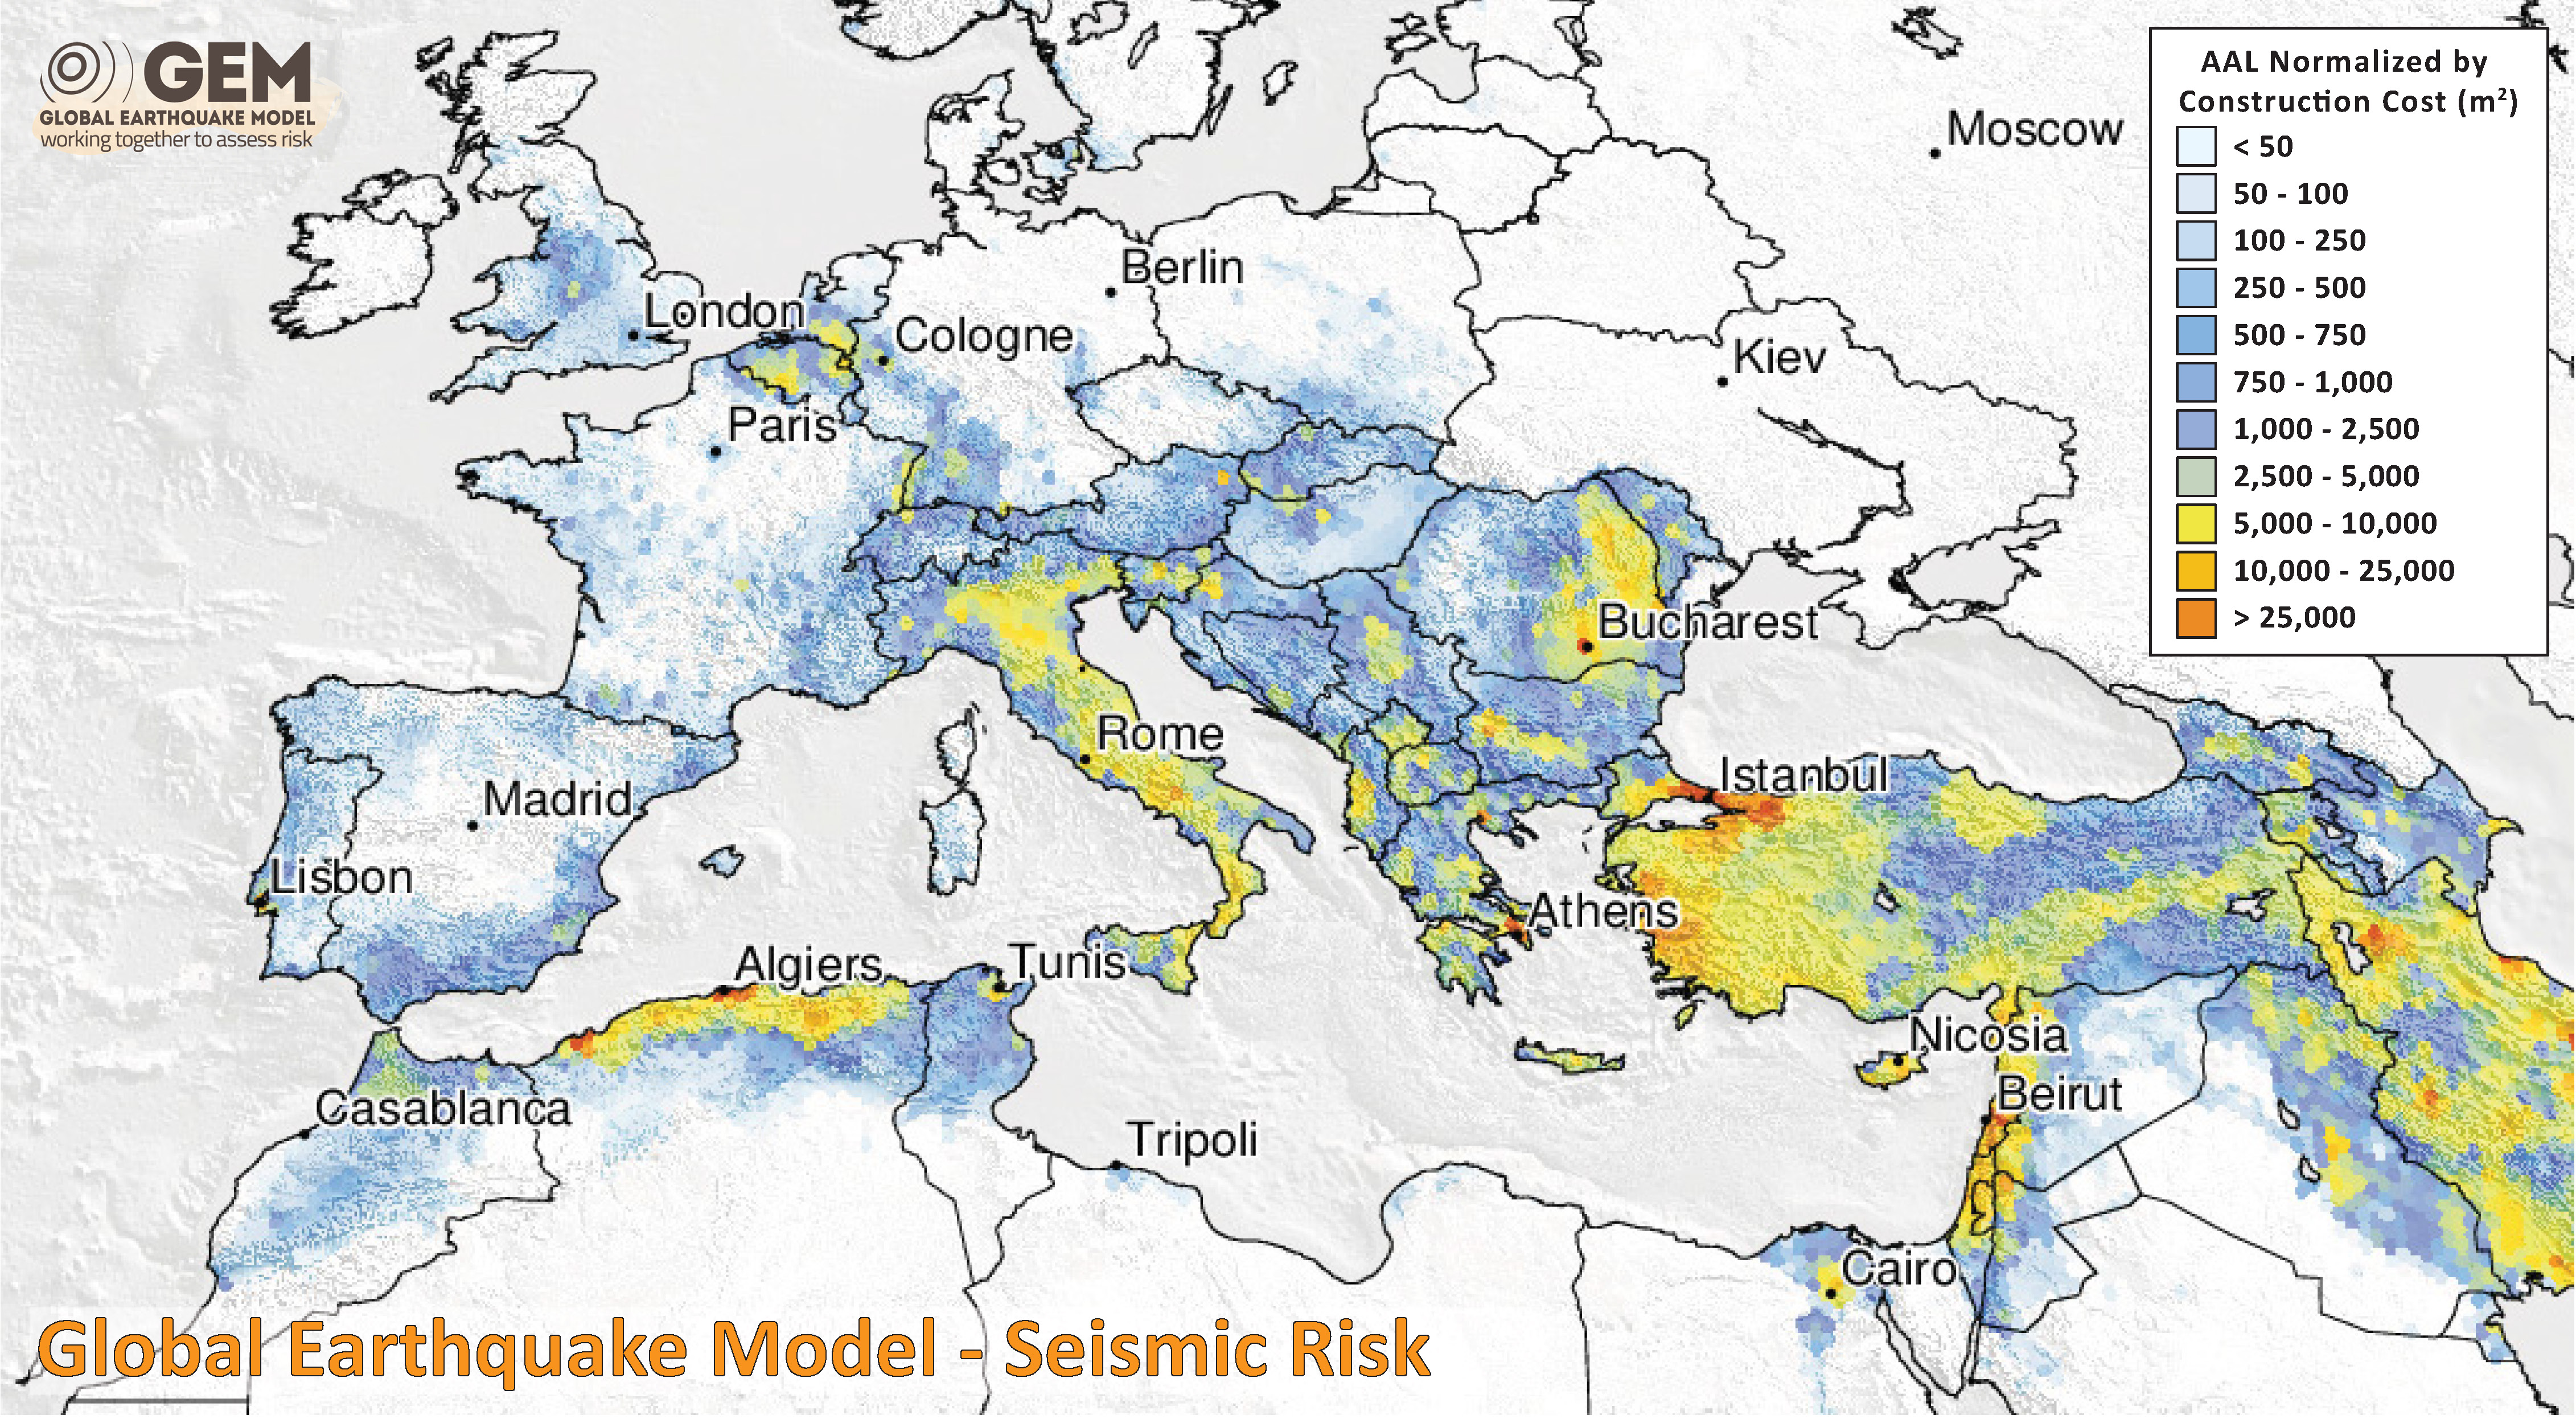
- The Global Seismic Risk Map (v2018.1) presents the geographic distribution of average annual loss (USD) normalised by the average construction costs of the respective country (USD/m2) due to ground shaking in the residential, commercial and industrial building stock, considering contents, structural and non-structural components. The normalised metric allows a direct comparison of the risk between countries with widely different construction costs. It does not consider the effects of tsunamis, liquefaction, landslides, and fires following earthquakes. The loss estimates are from direct physical damage to buildings due to shaking, and thus damage to infrastructure or indirect losses due to business interruption are not included. The average annual losses are presented on a hexagonal grid, with a spacing of 0.30 x 0.34 decimal degrees (approximately 1,000 km2 at the equator). The average annual losses were computed using the event-based calculator of the OpenQuake engine, an open-source software for seismic hazard and risk analysis developed by the GEM Foundation. The seismic hazard, exposure and vulnerability models employed in these calculations were provided by national institutions, or developed within the scope of regional programs or bilateral collaborations.
- Here is a view of the GEM seismic risk map for Europe.
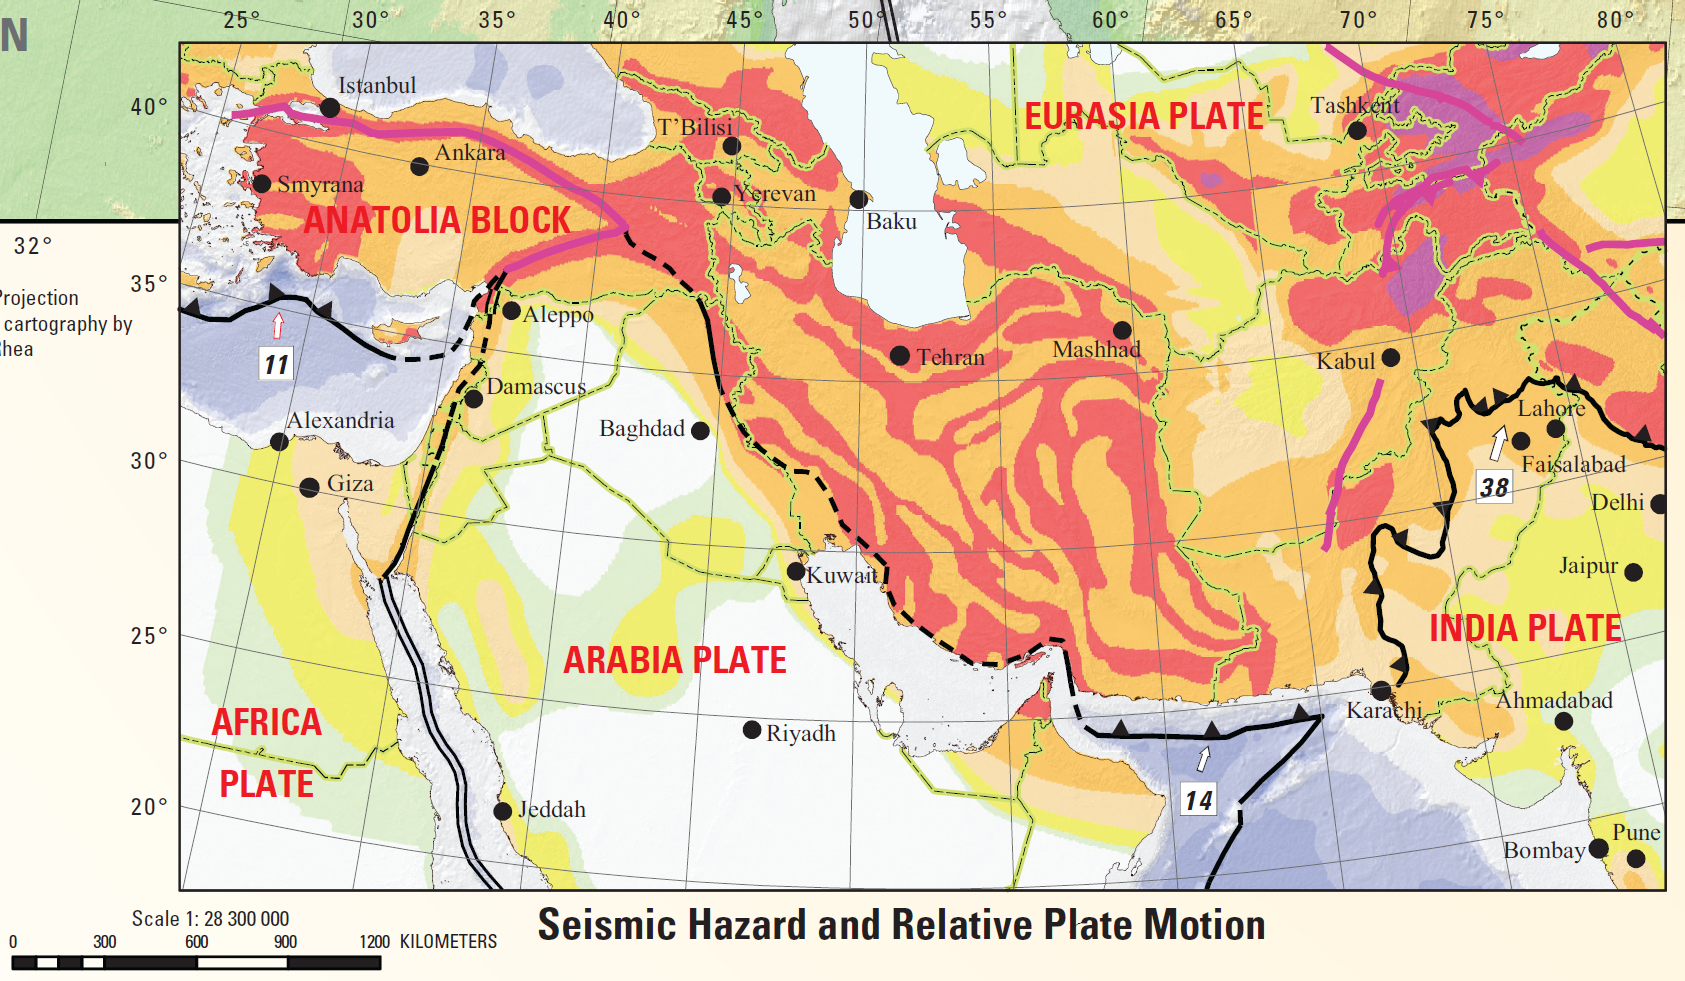
The Global Seismic Hazard Map. Peak ground acceleration (pga) with a 10% chance of exceedance in 50 years is depicted in m/s2. The site classification is rock everywhere except Canada and the United States, which assume rock/firm soil site classifications. White and green correspond to low seismicity hazard (0%-8%g), yellow and orange correspond to moderate seismic hazard (8%-24%g), pink and dark pink correspond to high seismicity hazard (24%-40%g), and red and brown correspond to very high seismic hazard (greater than 40%g).
- 2020.01.24 M 6.7 Turkey
- 2019.11.26 M 6.4 Albania
- 2018.10.25 M 6.8 Greece
- 2017.07.20 M 6.7 Turkey
- 2017.06.12 M 6.3 Turkey/Greece
- 2016.10.30 M 6.6 Italy
- 2016.10.30 M 6.6 Italy Update #1
- 2016.10.28 M 5.8 Tyrrhenian Sea
- 2016.10.26 M 6.1 Italy
- 2016.10.16 M 5.3 Greece/Albania
- 2016.08.23 M 6.2 Italy
- 2016.01.24 M 6.1 Mediterranean
- 2015.11.17 M 6.5 Greece
- 2015.04.16 M 6.0 Crete
Europe Earthquake Reports
General Overview
Earthquake Reports
- 2018.11.25 M 6.3 Iran/Iraq
- 2017.12.01 M 6.1 Iran
- 2017.11.12 M 7.3 Iraq
- 2017.02.08 M 6.3 Makran subduction zone (Pakistan)
- 2015.10.27 M 7.5 Afghanistan
Middle East Earthquake Reports
General Overview
Earthquake Reports
Social Media
#EarthquakeReport for #depremElazig #Deprem #Earthquake in #Turkey
Posters here I have tweeted before, now there is a report to explain them. I will update this report over time
https://t.co/EuFXnSeqlc#TurkeyEarthquake #elazığdepremi #elazığdadeprem #Elazıg #Malatya #Ergani pic.twitter.com/OXwkvfjDJP— Jason "Jay" R. Patton (@patton_cascadia) January 25, 2020
#EarthquakeReport pages can now be translated on https://t.co/fGEEJoACJA by simply clicking the language on the upper right. Uses Google Translate plugin "GTranslate: for WordPress" pic.twitter.com/hkLvy8VlAq
— Jason "Jay" R. Patton (@patton_cascadia) January 26, 2020
Mw=6.7, TURKEY (Depth: 23 km), 2020/01/24 17:55:14 UTC – Full details here: https://t.co/rL50XD3kRs pic.twitter.com/uBFWy5q1hN
— Earthquakes (@geoscope_ipgp) January 24, 2020
very strong and dangerous #earthquake #deprem along border of #Turkey and #Syria near #Elazig and #Malatya, felt widely including as far as #Istanbul and all over the Middle East
Due to crisis situation in this region, impact estimates are difficult@ShakingEarth pic.twitter.com/Z1EPX0byHi
— CATnews | Andreas M. Schäfer (@CATnewsDE) January 24, 2020
Map of felt reports received so far following the #earthquake M6.9 in Eastern Turkey 40 min ago pic.twitter.com/RXQx9Vkbw3
— EMSC (@LastQuake) January 24, 2020
Updated aftershock map of Jan 24 Mw6.8 #earthquake near Sivrice, Elazığ (eastern Turkey); >60km rupture along the Pütürge Segment of East Anatolia Fault Zone. Epicenters & focal mechanism from AFAD, active fault traces from MTA. Latest #Landsat8 image from Jan 22. pic.twitter.com/YR45rY6C1z
— Sotiris Valkaniotis (@SotisValkan) January 25, 2020
Watch the waves from the M6.7 Turkey #earthquake roll across the USArray Transportable Array seismic network (https://t.co/RIcNz4bgWq ). #TurkeyEarthquake (THREAD) pic.twitter.com/UoxtaFVOQ6
— IRIS Earthquake Sci (@IRIS_EPO) January 24, 2020
Mw6.9 #earthquake in eastern #Turkey. Possible activation of Pütürge Segment, East Anatolia Fault. Preliminary locations of the epicenter, and GFZ focal mech. Fault map from Duman & Emre (2013) pic.twitter.com/iot7Rb58EA
— Sotiris Valkaniotis (@SotisValkan) January 24, 2020
The @USGS generates finite fault models for larger EQs, where they try to reconstruct the quake. For the #TurkeyEarthquake, their prelim estimate is ~20 seconds of rupture, or 20 seconds just for the fault(s) to break. This is different from how long the earth shook. https://t.co/ln4bqol3OU
— Alka Tripathy-Lang, PhD (@DrAlkaTrip) January 25, 2020
🗺 New map: [#EMSR423] Elazig: Grading Product, version 1, release 1, RTP Map #01 [v1, 1:30000]
🔗 https://t.co/uJIGwWyfBc — #earthquake #grading in #Turkey#Copernicus #CEMS #RapidMapping #EUCivPro— Copernicus EMS (@CopernicusEMS) January 25, 2020
29 dead, 1,466 injured as massive quake of magnitude 6.8 rocks Turkey's Elazığ https://t.co/HaUzX5C8hR
— Jason "Jay" R. Patton (@patton_cascadia) January 25, 2020
The Elazig earthquake from a 6-day Sentinel-1 pair (@ESA_EO @CopernicusData), processed using ISCE. The colour gradient from red to blue (instead of a sharp discontinuity) suggests that most of the slip occurred at depth and did not make it to the surface (intriguing…) pic.twitter.com/gZcqhs1wsq
— Gareth Funning (@gfun) January 28, 2020
- Frisch, W., Meschede, M., Blakey, R., 2011. Plate Tectonics, Springer-Verlag, London, 213 pp.
- Hayes, G., 2018, Slab2 – A Comprehensive Subduction Zone Geometry Model: U.S. Geological Survey data release, https://doi.org/10.5066/F7PV6JNV.
- Holt, W. E., C. Kreemer, A. J. Haines, L. Estey, C. Meertens, G. Blewitt, and D. Lavallee (2005), Project helps constrain continental dynamics and seismic hazards, Eos Trans. AGU, 86(41), 383–387, , https://doi.org/10.1029/2005EO410002. /li>
- Jessee, M.A.N., Hamburger, M. W., Allstadt, K., Wald, D. J., Robeson, S. M., Tanyas, H., et al. (2018). A global empirical model for near-real-time assessment of seismically induced landslides. Journal of Geophysical Research: Earth Surface, 123, 1835–1859. https://doi.org/10.1029/2017JF004494
- Kreemer, C., J. Haines, W. Holt, G. Blewitt, and D. Lavallee (2000), On the determination of a global strain rate model, Geophys. J. Int., 52(10), 765–770.
- Kreemer, C., W. E. Holt, and A. J. Haines (2003), An integrated global model of present-day plate motions and plate boundary deformation, Geophys. J. Int., 154(1), 8–34, , https://doi.org/10.1046/j.1365-246X.2003.01917.x.
- Kreemer, C., G. Blewitt, E.C. Klein, 2014. A geodetic plate motion and Global Strain Rate Model in Geochemistry, Geophysics, Geosystems, v. 15, p. 3849-3889, https://doi.org/10.1002/2014GC005407.
- Meyer, B., Saltus, R., Chulliat, a., 2017. EMAG2: Earth Magnetic Anomaly Grid (2-arc-minute resolution) Version 3. National Centers for Environmental Information, NOAA. Model. https://doi.org/10.7289/V5H70CVX
- Müller, R.D., Sdrolias, M., Gaina, C. and Roest, W.R., 2008, Age spreading rates and spreading asymmetry of the world’s ocean crust in Geochemistry, Geophysics, Geosystems, 9, Q04006, https://doi.org/10.1029/2007GC001743
- Pagani,M. , J. Garcia-Pelaez, R. Gee, K. Johnson, V. Poggi, R. Styron, G. Weatherill, M. Simionato, D. Viganò, L. Danciu, D. Monelli (2018). Global Earthquake Model (GEM) Seismic Hazard Map (version 2018.1 – December 2018), DOI: 10.13117/GEM-GLOBAL-SEISMIC-HAZARD-MAP-2018.1
- Silva, V ., D Amo-Oduro, A Calderon, J Dabbeek, V Despotaki, L Martins, A Rao, M Simionato, D Viganò, C Yepes, A Acevedo, N Horspool, H Crowley, K Jaiswal, M Journeay, M Pittore, 2018. Global Earthquake Model (GEM) Seismic Risk Map (version 2018.1). https://doi.org/10.13117/GEM-GLOBAL-SEISMIC-RISK-MAP-2018.1
- Zhu, J., Baise, L. G., Thompson, E. M., 2017, An Updated Geospatial Liquefaction Model for Global Application, Bulletin of the Seismological Society of America, 107, p 1365-1385, https://doi.org/0.1785/0120160198
- Armijo, R., Meyer, B., Hubert, A., and Barka, A., 1999. Westward propagation of the North Anatolian fault into the northern Aegean: Timing and kinematics in Geology, v. 27, no. 3, p. 267-270
- Basili R., G. Valensise, P. Vannoli, P. Burrato, U. Fracassi, S. Mariano, M.M. Tiberti, E. Boschi (2008), The Database of Individual Seismogenic Sources (DISS), version 3: summarizing 20 years of research on Italy’s earthquake geology, Tectonophysics, doi:10.1016/j.tecto.2007.04.014
- Brun, J.-P., Sokoutis, D., 2012. 45 m.y. of Aegean crust and mantle flow driven by trench retreat. Geol. Soc. Am., v. 38, p. 815–818.
- Caputo, R., Chatzipetros, A., Pavlides, S., and Sboras, S., 2012. The Greek Database of Seismogenic Sources (GreDaSS): state-of-the-art for northern Greece in Annals of Geophysics, v. 55, no. 5, doi: 10.4401/ag-5168
- Dilek, Y., 2006. Collision tectonics of the Mediterranean region: Causes and consequences in Dilek, Y., and Pavlides, S., eds., Postcollisional tectonics and magmatism in the Mediterranean region and Asia: Geological Society of America Special Paper 409, p. 1–13
- Dilek, Y. and Sandvol, E., 2006. Collision tectonics of the Mediterranean region: Causes and consequences in Dilek, Y., and Pavlides, S., eds., Postcollisional tectonics and magmatism in the Mediterranean region and Asia: Geological Society of America Special Paper 409, p. 1–13
- DISS Working Group (2015). Database of Individual Seismogenic Sources (DISS), Version 3.2.0: A compilation of potential sources for earthquakes larger than M 5.5 in Italy and surrounding areas. http://diss.rm.ingv.it/diss/, Istituto Nazionale di Geofisica e Vulcanologia; DOI:10.6092/INGV.IT-DISS3.2.0.
- Duman, T.Y. and Emre, O., 2013. The East Anatolian Fault: geometry, segmentation and jog characteristics in Geological Society of London, Special Publications, v. 372, doi: 10.1144/SP372.14
- Ersoy, E.Y., Cemen, I., Helvaci, C., and Billor, Z., 2014. Tectono-stratigraphy of the Neogene basins in Western Turkey: Implications for tectonic evolution of the Aegean Extended Region in Tectonophysics v. 635, p. 33-58.
- Jenkins, Jennifer, Turner, Bethan, Turner, Rebecca, Hayes, G.P., Sinclair, Alison, Davies, Sian, Parker, A.L., Dart, R.L., Tarr, A.C., Villaseñor, Antonio, and Benz, H.M., compilers, 2013, Seismicity of the Earth 1900–2010 Middle East and vicinity (ver 1.1, Jan. 28, 2014): U.S. Geological Survey Open-File Report 2010–1083-K, scale 1:7,000,000, https://pubs.usgs.gov/of/2010/1083/k/.
- Jolivet, L., et al., 2013. Aegean tectonics: Strain localisation, slab tearing and trench retreat in Tectonophysics, v. 597-598, p. 1-33
- Kokkalas, S., et al., 2006. Postcollisional contractional and extensional deformation in the Aegean region in GSA Special Papers, v. 409, p. 97-123.
- Kurt, H., Demirbag, E., and Kuscu, I., 1999. Investigation of the submarine active tectonism in the Gulf of Gokova, southwest Anatolia–southeast Aegean Sea, by multi-channel seismic reflection data in Tectonophysics, v. 305, p. 477-496
- Papazachos, B.C., Papadimitrious, E.E., Kiratzi, A.A., Papazachos, C.B., and Louvari, E.k., 1998. Fault Plane Solutions in the Aegean Sea and the Surrounding Area and their Tectonic Implication, in Bollettino Di Geofisica Terorica Ed Applicata, v. 39, no. 3, p. 199-218.
- Taymaz, T., Yilmaz, Y., and Dilek, Y., 2007. The geodynamics of the Aegean and Anatolia: introduction in Geological Society Special Publications, v. 291, p. 1-16.
- Wouldloper, 2009. Tectonic map of southern Europe and the Middle East, showing tectonic structures of the western Alpide mountain belt. Only Alpine (tertiary) structures are shown.
References:
Basic & General References
Specific References
Return to the Earthquake Reports page.
Leave a Reply