Well, I was about to head to town and noticed a magnitude M = 5.0 earthquake in Greece. I thought to myself, I wonder if that is a foreshock. It was.
Then, the M 6.8 mainshock hit while i was out and about, followed by a M = 5.2 aftershock.
Before I looked more closely, I thought this sequence might be related to the Kefallonia fault. I prepared some earthquake reports for earthquakes here in the past, in 2015 and in 2016.
Both of those earthquakes were right-lateral strike-slip earthquakes associated with the Kefallonia fault.
However, today’s earthquake sequence was further to the south and east of the strike-slip fault, in a region experiencing compression from the Ionian Trench subduction zone. But there is some overlap of these different plate boundaries, so the M 6.8 mainshock is an oblique earthquake (compressional and strike-slip). Based upon the sequence, I interpret this earthquake to be right-lateral oblique. I could be wrong.
There are records of tsunami observed on tide gage data.
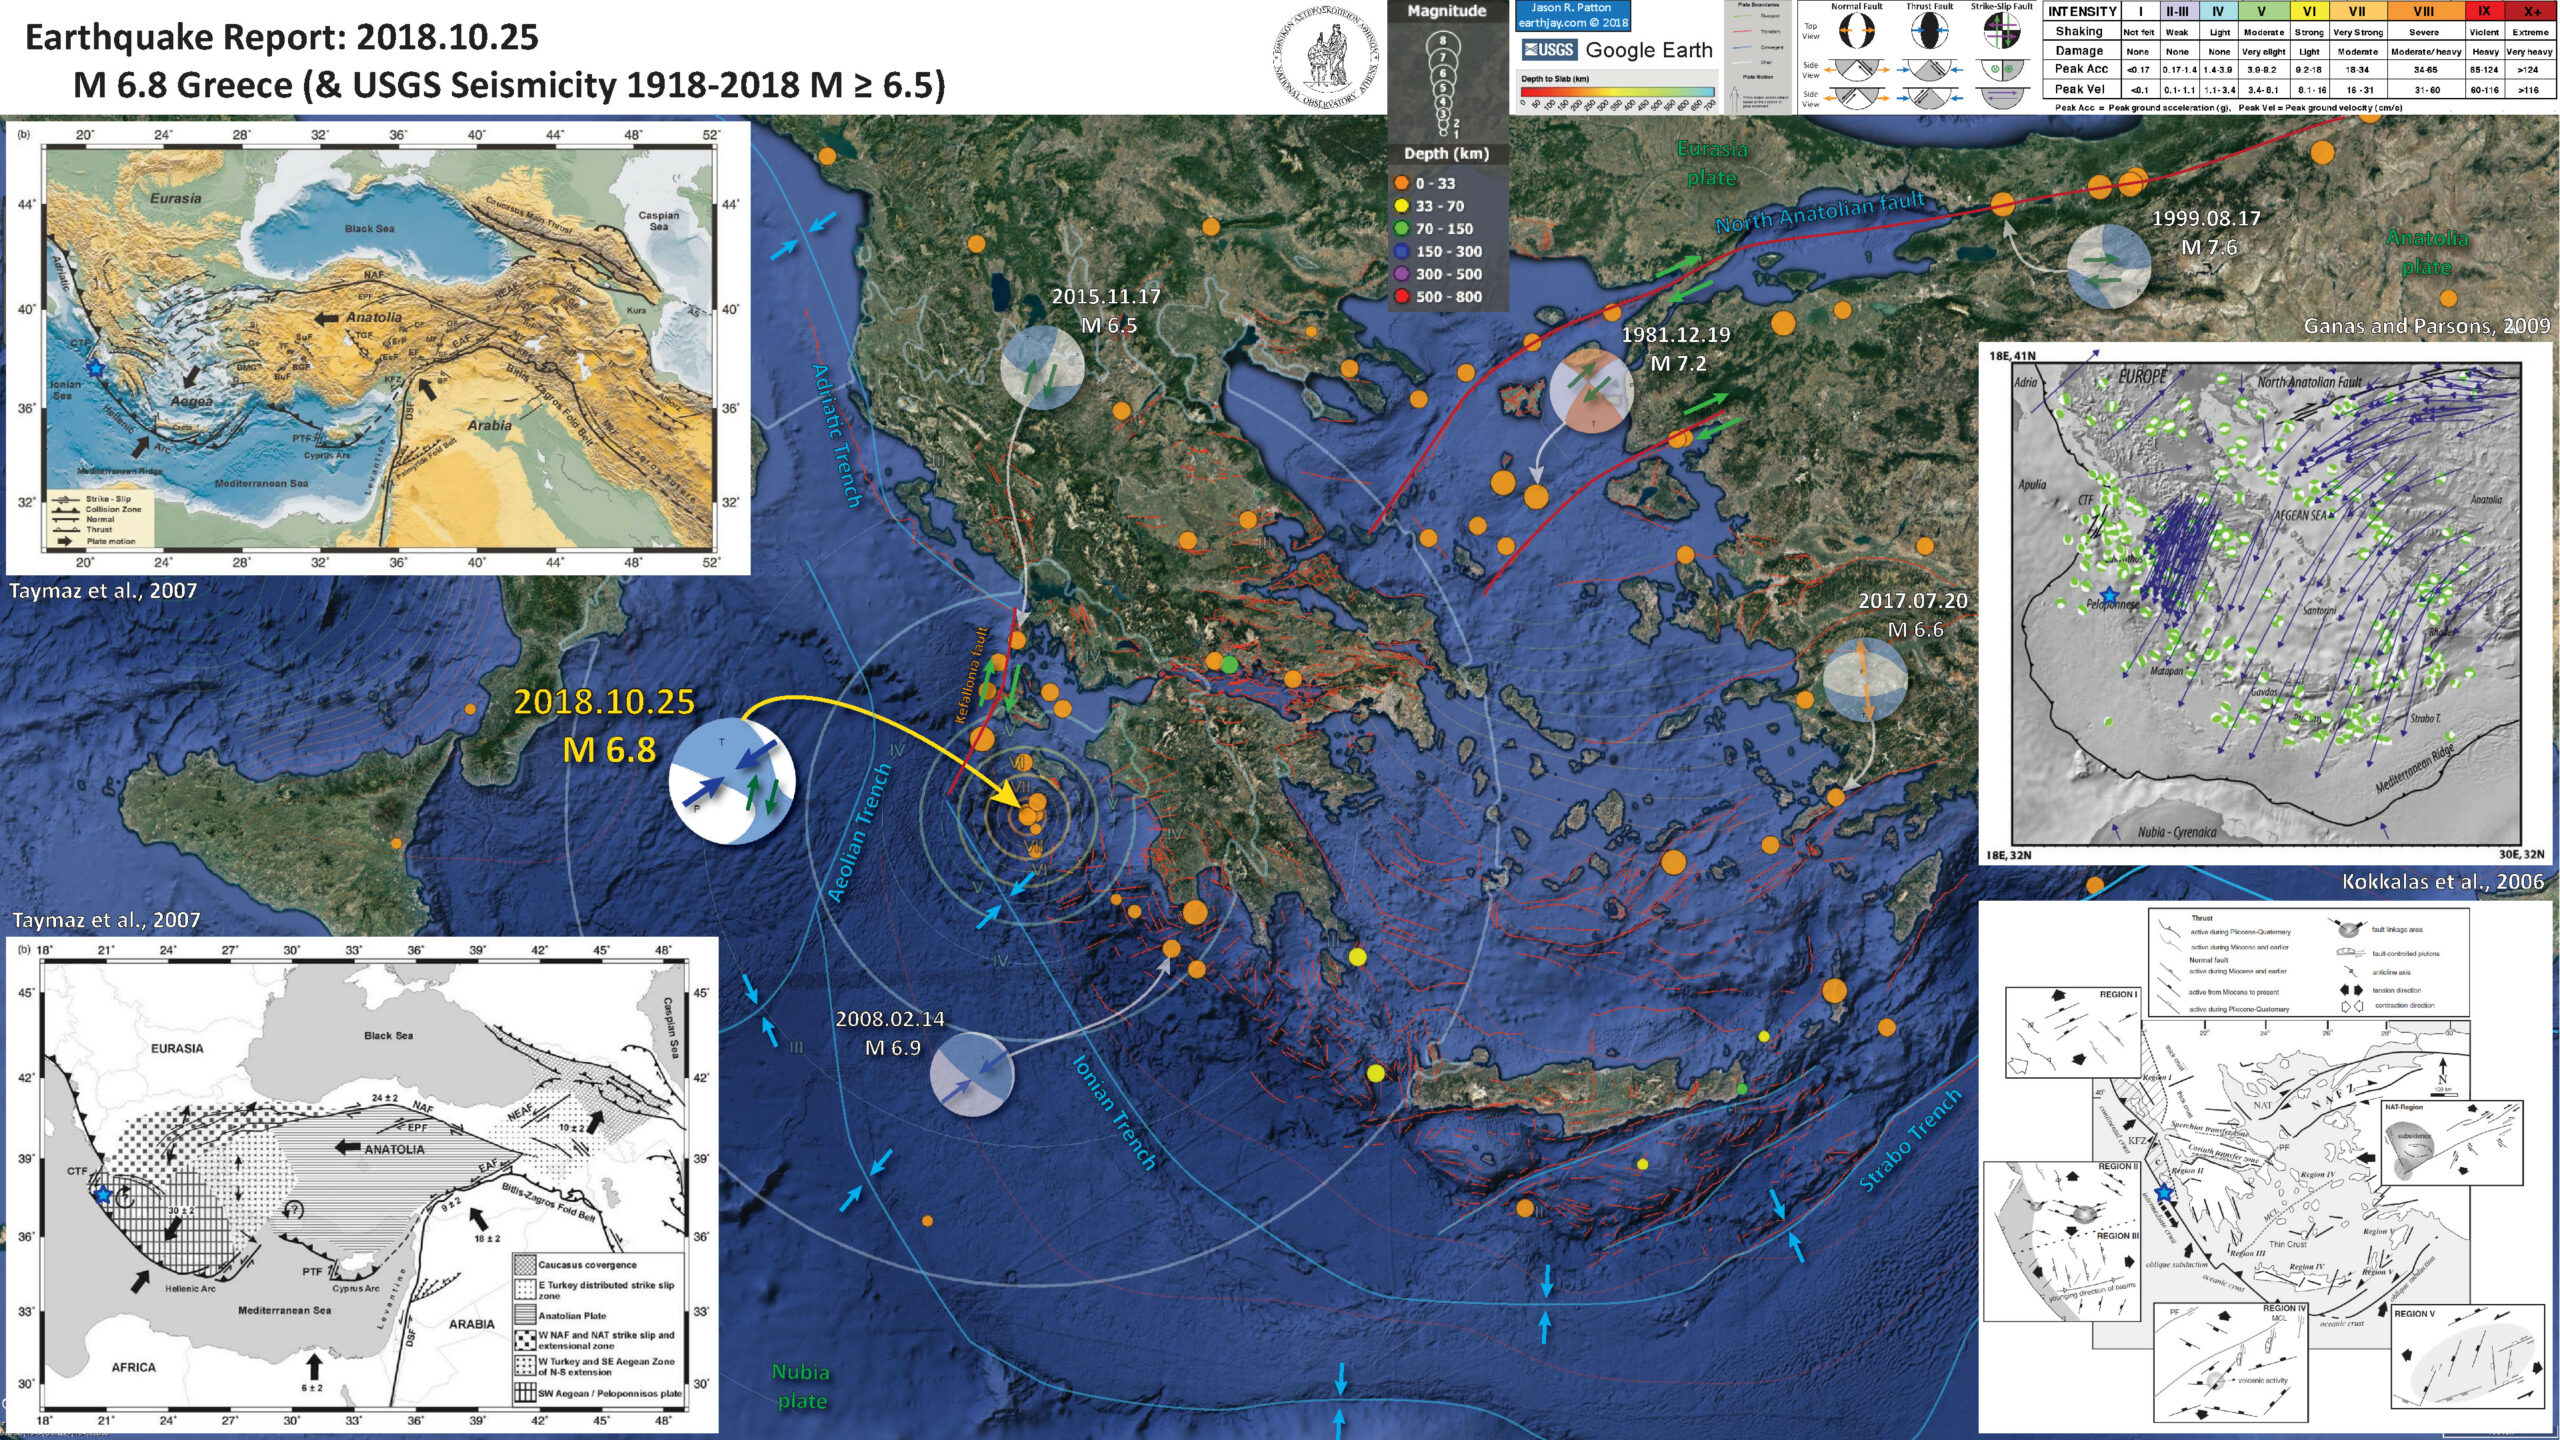
Below is my interpretive poster for this earthquake
I plot the seismicity from the past month, with color representing depth and diameter representing magnitude (see legend). I include earthquake epicenters from 1918-2018 with magnitudes M ≥ 6.5 in one version.
I plot the USGS fault plane solutions (moment tensors in blue and focal mechanisms in orange), possibly in addition to some relevant historic earthquakes.
The poster below includes earthquakes that represent the different plate boundaries and tectonic regimes.
- The 1999 M = 7.6 Izmit earthquake was quite damaging and deadly earthquake on the North Anatolian fault. To the east, the majority of this plate boundary has ruptured in the 20th century. The last portion of the fault to rupture is to the west of this M = 7.6 earthquake and those who live in Istanbul would do well to invest in earthquake resilient building design. The Iszmit earthquake generated a tsunami with run up elevations about 2 meters, though had localized larger run ups due to a submarine landslide.
- The 1981 M = 7.2 earthquake shows that this dextral (right-lateral) strain extends through the region into eastern Greece.
- The 2015 M = 6.5 earthquake I mention above is plotted, showing the right-lateral sense of motion associated with the Kefallonia fault. There was a tsunami observed following this earthquake, probably associated with a landslide also observed (dust was seen and photographed).
- The 2008 M = 6.9 earthquake is a thrust earthquake and represents the convergence (compression) associated with the convergent plate boundary associated with the Ionian Trench.
- The 2017 M = 6.6 earthquake is an interesting earthquake that shows the upper plate deformation in the Anatolia plate in western Turkey is extending. Geologic structural cross sections in this region shows that this extension has been ongoing for millions of years. Here is my earthquake report for this 2017 M 6.6 earthquake. There was a tsunami observed as a result of this earthquake, believe it or not.
- I placed a moment tensor / focal mechanism legend on the poster. There is more material from the USGS web sites about moment tensors and focal mechanisms (the beach ball symbols). Both moment tensors and focal mechanisms are solutions to seismologic data that reveal two possible interpretations for fault orientation and sense of motion. One must use other information, like the regional tectonics, to interpret which of the two possibilities is more likely.
- I also include the shaking intensity contours on the map. These use the Modified Mercalli Intensity Scale (MMI; see the legend on the map). This is based upon a computer model estimate of ground motions, different from the “Did You Feel It?” estimate of ground motions that is actually based on real observations. The MMI is a qualitative measure of shaking intensity. More on the MMI scale can be found here and here. This is based upon a computer model estimate of ground motions, different from the “Did You Feel It?” estimate of ground motions that is actually based on real observations.
- I include the slab 2.0 contours plotted (Hayes, 2018), which are contours that represent the depth to the subduction zone fault. These are mostly based upon seismicity. The depths of the earthquakes have considerable error and do not all occur along the subduction zone faults, so these slab contours are simply the best estimate for the location of the fault.li>
- I include the faults from the NOA Digital Database for Active faults in Greece (Ganas et a., 2013) as red lines.
- In the upper left corner is a small scale map showing the major tectonic fault systems in the eastern Mediterranean (Taymaz et al., 2007). The large black arrows show relative plate motions. I place a blue star in the general location of today’s earthquake sequence.
- In the lower left corner is a generalized view of the tectonic regimes as interpreted by Taymaz et al. (2007). Today’s earthquake is in the SW Aegena/Peloponnisos plate, a region of compression associated with the Ionian Trench subduction zone. Today’s earthquake was probably right-lateral oblique, given the spatial relations between the different earthquakes.
- In the upper right corner is a figure that shows GPS plate motion vectors (Ganas and Parsons, 2009). NOt how the vectors in the northeast are parallel to the North Anatolian fault and, as one moves to the southwest, they become normal (perpendicular) to the Ionian trench.
- In the lower right corner is a more detailed map showing an interpretation of the faulting in the region (Kokkalas et al., 2006).
I include some inset figures. Some of the same figures are located in different places on the larger scale map below.
- Here is the map with a month’s seismicity plotted.

- Here is the map with a century’s seismicity plotted.

- Here is the tide gage data from Katakolo, which is only 65 km from the M 6.8 epicenter.

- Here is a tsunami model from INGV.
Other Report Pages
Some Relevant Discussion and Figures
- Here is the large scale tectonic setting map (Taymaz et al., 2007) with their figure below.

Summary sketch map of the faulting and bathymetry in the Eastern Mediterranean region, compiled from our observations and those of Le Pichon & Angelier (1981), Taymaz (1990), Taymaz et al. (1990, 1991a, b); S¸arogˇlu et al. (1992), Papazachos et al. (1998), McClusky et al. (2000) and Tan & Taymaz (2006). Large black arrows show relative motions of plates with respect to Eurasia (McClusky et al. 2003). Bathymetry data are derived from GEBCO/97–BODC, provided by GEBCO (1997) and Smith & Sandwell (1997a, b). Shaded relief map derived from the GTOPO-30 Global Topography Data taken after USGS. NAF, North Anatolian Fault; EAF, East Anatolian Fault; DSF, Dead Sea Fault; NEAF, North East Anatolian Fault; EPF, Ezinepazarı Fault; PTF, Paphos Transform Fault; CTF, Cephalonia Transform Fault; PSF, Pampak–Sevan Fault; AS, Apsheron Sill; GF, Garni Fault; OF, Ovacık Fault; MT, Mus¸ Thrust Zone; TuF, Tutak Fault; TF, Tebriz Fault; KBF, Kavakbas¸ı Fault; MRF, Main Recent Fault; KF, Kagˇızman Fault; IF, Igˇdır Fault; BF, Bozova Fault; EF, Elbistan Fault; SaF, Salmas Fault; SuF, Su¨rgu¨ Fault; G, Go¨kova; BMG, Bu¨yu¨k Menderes Graben; Ge, Gediz Graben; Si, Simav Graben; BuF, Burdur Fault; BGF, Beys¸ehir Go¨lu¨ Fault; TF, Tatarlı Fault; SuF, Sultandagˇ Fault; TGF, Tuz Go¨lu¨ Fault; EcF, Ecemis¸ Fau; ErF, Erciyes Fault; DF, Deliler Fault; MF, Malatya Fault; KFZ, Karatas¸–Osmaniye Fault Zone.
- This figure shows GPS velocities in the region (Taymaz et al., 2007).

GPS horizontal velocities and their 95% confidence ellipses in a Eurasia-fixed reference frame for the period 1988–1997 superimposed on a shaded relief map derived from the GTOPO-30 Global Topography Data taken after USGS. Bathymetry data are derived from GEBCO/97–BODC, provided by GEBCO (1997) and Smith & Sandwell (1997a, b). Large arrows designate generalized relative motions of plates with respect to Eurasia (in mm a21) (recompiled after McClusky et al. 2000). NAF, North Anatolian Fault; EAF, East Anatolian Fault; DSF, Dead Sea Fault; NEAF, North East Anatolian Fault; EPF, Ezinepazarı Fault; CTF, Cephalonia Transform Fault; PTF, Paphos Transform Fault; CMT, Caucasus Main Thrust; MRF, Main Recent Fault.
- Finally their summary figure showing the tectonic regimes (Taymaz et al., 2007).

Schematic map of the principal tectonic settings in the Eastern Mediterranean. Hatching shows areas of coherent motion and zones of distributed deformation. Large arrows designate generalized regional motion (in mm a21) and errors (recompiled after McClusky et al. (2000, 2003). NAF, North Anatolian Fault; EAF, East Anatolian Fault; DSF, Dead Sea Fault; NEAF, North East Anatolian Fault; EPF, Ezinepazarı Fault; CTF, Cephalonia Transform Fault; PTF, Paphos Transform Fault.
- This is a tectonic summary figure from Kokkalas et al. (2006).

Simplified map showing the main structural features along the Hellenic arc and trench system, as well as the main active structures in the Aegean area. The mean GPS horizontal velocities in the Aegean plate, with respect to a Eurasia-fixed reference frame, are shown (after Kahle et al., 1998; McClusky et al., 2000). The lengths of vectors are
proportional to the amount of movement. The thick black arrows indicate the mean motion vectors of the plates. The polygonal areas on the map (dashed lines) define the approximate borders of the five different structural regions discussed in the text. The borders between structural regions are not straightforward, and wide transitional zones probably exist between them. The inset shows a schematic map with the geodynamic framework in the eastern Mediterranean area (modified from McClusky et al., 2000). DSF—Dead Sea fault; EAF—East Anatolia fault; HT—Hellenic trench; KFZ— Kefallonia fault zone; MRAC—Mediterranean Ridge accretionary complex; NAF—North Anatolia fault; NAT—North Aegean trough.
- Here is their detailed view of the faulting in the region (Kokkalas et al., 2006)

General simplified structural map of Greece showing the main currently active structures in the five structural regions along the Hellenic Arc, as well as some main pre-existing lineaments. Insets illustrate the main structural features of each region and the period of activity of these structures (for further details see discussion). KFZ—Kefallonia Fault zone; MCL—Mid-Cycladic lineament; NAFZ—North Anatolia fault zone; NAT—North Aegean trough; PF—Pelagonian fault.
- Here is an even more detailed view of this region (Kokkalas et al., 2006). Note how the Convergent plate boundary “Ionian thrust” overlaps with the strike-slip faulting of the Kefallonia fault. Today’s M 6.8 happened south of where these authors map the Ionian thrust extending south from Zakynthos Island.

Schematic structural map of the central Hellenic Peninsula (Region II), with stress nets showing the orientation of principal stress axes. Stress net explanation as for Figure 3. Also included are cross-sections showing the geometry and kinematics of the External Hellenides in the area (A-A′) and the evolution of the synorogenic basin in the Paleros area (B-B′-B′′). AG—Abelon graben; ALG—Almyros graben; AMG—Amvrakikos graben; CG—Corinth graben; KB—Kymi basin; KF—Klenia fault zone; KFZ—Kefalonia fault zone; LF—Lapithas fault; MG—Megara graben; NG—Nedas graben; P—Parnitha area; PG—Pyrgos graben; PLB—Paleros basin; PTG—Patras graben; RG—Rio graben; S-A.G— Sperchios-Atalanti graben; SEG—South Evoikos graben; TB—Thiva basin; TG—Tithorea graben; TRG—Trihonis graben; VF—Vounargos fault.
Geologic Fundamentals
- For more on the graphical representation of moment tensors and focal mechnisms, check this IRIS video out:
- Here is a fantastic infographic from Frisch et al. (2011). This figure shows some examples of earthquakes in different plate tectonic settings, and what their fault plane solutions are. There is a cross section showing these focal mechanisms for a thrust or reverse earthquake. The upper right corner includes my favorite figure of all time. This shows the first motion (up or down) for each of the four quadrants. This figure also shows how the amplitude of the seismic waves are greatest (generally) in the middle of the quadrant and decrease to zero at the nodal planes (the boundary of each quadrant).

- Here is another way to look at these beach balls.
The two beach balls show the stike-slip fault motions for the M6.4 (left) and M6.0 (right) earthquakes. Helena Buurman's primer on reading those symbols is here. pic.twitter.com/aWrrb8I9tj
— AK Earthquake Center (@AKearthquake) August 15, 2018
- There are three types of earthquakes, strike-slip, compressional (reverse or thrust, depending upon the dip of the fault), and extensional (normal). Here is are some animations of these three types of earthquake faults. The following three animations are from IRIS.
Strike Slip:
Compressional:
Extensional:
- This is an image from the USGS that shows how, when an oceanic plate moves over a hotspot, the volcanoes formed over the hotspot form a series of volcanoes that increase in age in the direction of plate motion. The presumption is that the hotspot is stable and stays in one location. Torsvik et al. (2017) use various methods to evaluate why this is a false presumption for the Hawaii Hotspot.
- Here is a map from Torsvik et al. (2017) that shows the age of volcanic rocks at different locations along the Hawaii-Emperor Seamount Chain.

A cutaway view along the Hawaiian island chain showing the inferred mantle plume that has fed the Hawaiian hot spot on the overriding Pacific Plate. The geologic ages of the oldest volcano on each island (Ma = millions of years ago) are progressively older to the northwest, consistent with the hot spot model for the origin of the Hawaiian Ridge-Emperor Seamount Chain. (Modified from image of Joel E. Robinson, USGS, in “This Dynamic Planet” map of Simkin and others, 2006.)

Hawaiian-Emperor Chain. White dots are the locations of radiometrically dated seamounts, atolls and islands, based on compilations of Doubrovine et al. and O’Connor et al. Features encircled with larger white circles are discussed in the text and Fig. 2. Marine gravity anomaly map is from Sandwell and Smith.
- 2018.10.25 M 6.8 Greece
- 2017.07.20 M 6.7 Turkey
- 2017.06.12 M 6.3 Turkey/Greece
- 2016.10.30 M 6.6 Italy
- 2016.10.30 M 6.6 Italy Update #1
- 2016.10.28 M 5.8 Tyrrhenian Sea
- 2016.10.26 M 6.1 Italy
- 2016.10.16 M 5.3 Greece/Albania
- 2016.08.23 M 6.2 Italy
- 2016.01.24 M 6.1 Mediterranean
- 2015.11.17 M 6.5 Greece
- 2015.04.16 M 6.0 Crete
Europe
General Overview
Earthquake Reports
Social Media
M6.8 #earthquake was a truly international quake felt up to 800 km in at least 8 countries (Malta, Libya, Italy, Greece, Macedonia, Albania, Bosnia, Bulgaria, Turkey) pic.twitter.com/gt2oVn5tLS
— EMSC (@LastQuake) October 26, 2018
Todays strong #earthquake in Ionian Sea, #Greece, in an area of high seismicity near the junction of Hellenic Arc subduction and Cephalonia Transform Fault. NW-SE/WNW-ESE thrusting in accord. with local tectonic structures. Revised epicenter location (ML 6.4) from NOA. pic.twitter.com/0aqZhsTwOb
— Sotiris Valkaniotis (@SotisValkan) October 26, 2018
Sea level changes following M6.8 earthquake are still being observed. Their amplitude remain hopefully limited. Do not go checking your boats there may be strong currents in harbors pic.twitter.com/0WGNjZGnd2
— EMSC (@LastQuake) October 26, 2018
Mw=7.0, IONIAN SEA (Depth: 15 km), 2018/10/25 22:54:51 UTC – Full details here: https://t.co/jXsx6jWEC9 pic.twitter.com/pZiAZvPeKx
— Earthquakes (@geoscope_ipgp) October 25, 2018
strong #earthquake offshore Western #Greece near #Zakynthos, also felt in Southern #Italy and #Albania @LastQuake @Quake_Tracker @JuskisErdbeben pic.twitter.com/BF8W44NOjq
— CATnews (@CATnewsDE) October 25, 2018
potential #tsunami after #earthquake offshore #Greece, still uncertain, yet a run-up of up to 1.5m can be possible locally, but mostly expected peak coastal wave heights of 20-50cm in Western Greece @LastQuake @JuskisErdbeben @Quake_Tracker4 pic.twitter.com/cejAwCoGgD
— CATnews (@CATnewsDE) October 25, 2018
A 6.9 magnitude earthquake took place in Greece today. The epicenter of the quake was reported to be in the Iyon Sea, 250 km west to Athens.
Users shared footage on social media of the quake, that happened in a depth of 16.6 km. pic.twitter.com/p4VrGUXT9y
— EHA News (@eha_news) October 25, 2018
Faulting mechanism for the M6.8 Greece earthquake (blue beach ball; from the USGS) has a complex oblique mechanism. Past quakes in the area related to the Hellenic subduction thrust. The Cephalonia strike-slip fault lies a little further to the north. Tectonically complex region. pic.twitter.com/asklvRpB7V
— Stephen Hicks 🇪🇺 (@seismo_steve) October 25, 2018
- Ganas, A., and T. Parsons (2009), Three-dimensional model of Hellenic Arc deformation and origin of the Cretan uplift, J. Geophys. Res., 114, B06404, doi:10.1029/2008JB005599
- Ganas, A., Oikonomou, I.A., and Tsimi, C., 2013. NOAFAULTS: A Digital Database for Active Faults in Greece in Bulletin of the Geological Society of Greece, v. XLVII, Proceedings fo the 13th International Cogfress, Chania, Sept, 2013
- Kokkalas, S., Xypolias, P., Koukouvelas, I., and Doutsos, T., 2006, Postcollisional contractional and extensional deformation in the Aegean region, in Dilek, Y., and Pavlides, S., eds., Postcollisional tectonics and magmatism in the Mediterranean region and Asia: Geological Society of America Special Paper 409, p. 97–123, doi: 10.1130/2006.2409(06)
- Hayes, G., 2018, Slab2 – A Comprehensive Subduction Zone Geometry Model: U.S. Geological Survey data release, https://doi.org/10.5066/F7PV6JNV.
- Meyer, B., Saltus, R., Chulliat, a., 2017. EMAG2: Earth Magnetic Anomaly Grid (2-arc-minute resolution) Version 3. National Centers for Environmental Information, NOAA. Model. doi:10.7289/V5H70CVX
- Taymaz, T. , Yilmaz, Y., and Dilek, Y., 2007. The geodynamics of the Aegean and Anatolia: introduction in TAYMAZ, T., YILMAZ, Y. & DILEK, Y. (eds) The Geodynamics of the Aegean and Anatolia. Geological Society, London, Special Publications, 291, 1–16. DOI: 10.1144/SP291.1 0305-8719/07
References:
Return to the Earthquake Reports page.