There have been a nice suite of aftershocks to help us interpret these data. There were several aftershocks less than or equal to M = 6. These occurred within hours of the mainshock. They also occurred northwest of the mainshock. This suggested that the fault that ruptured strikes west-northwest, based on the moment tensors. I mentioned this spatial relation on the first page about this earthquake swarm here. There is more information about the mainshock and tsunami measurements on that first page.
Here is the mainshock moment tensor:
We now have some more aftershocks, including a slightly larger magnitude earthquake M = 6.3 further northwest from the main swarm. This earthquake occurred ~7 hrs after the main shock. At first I thought I might consider this a triggered earthquake (not an aftershock). Following are a couple figures I put together to explain how I interpret this swarm.
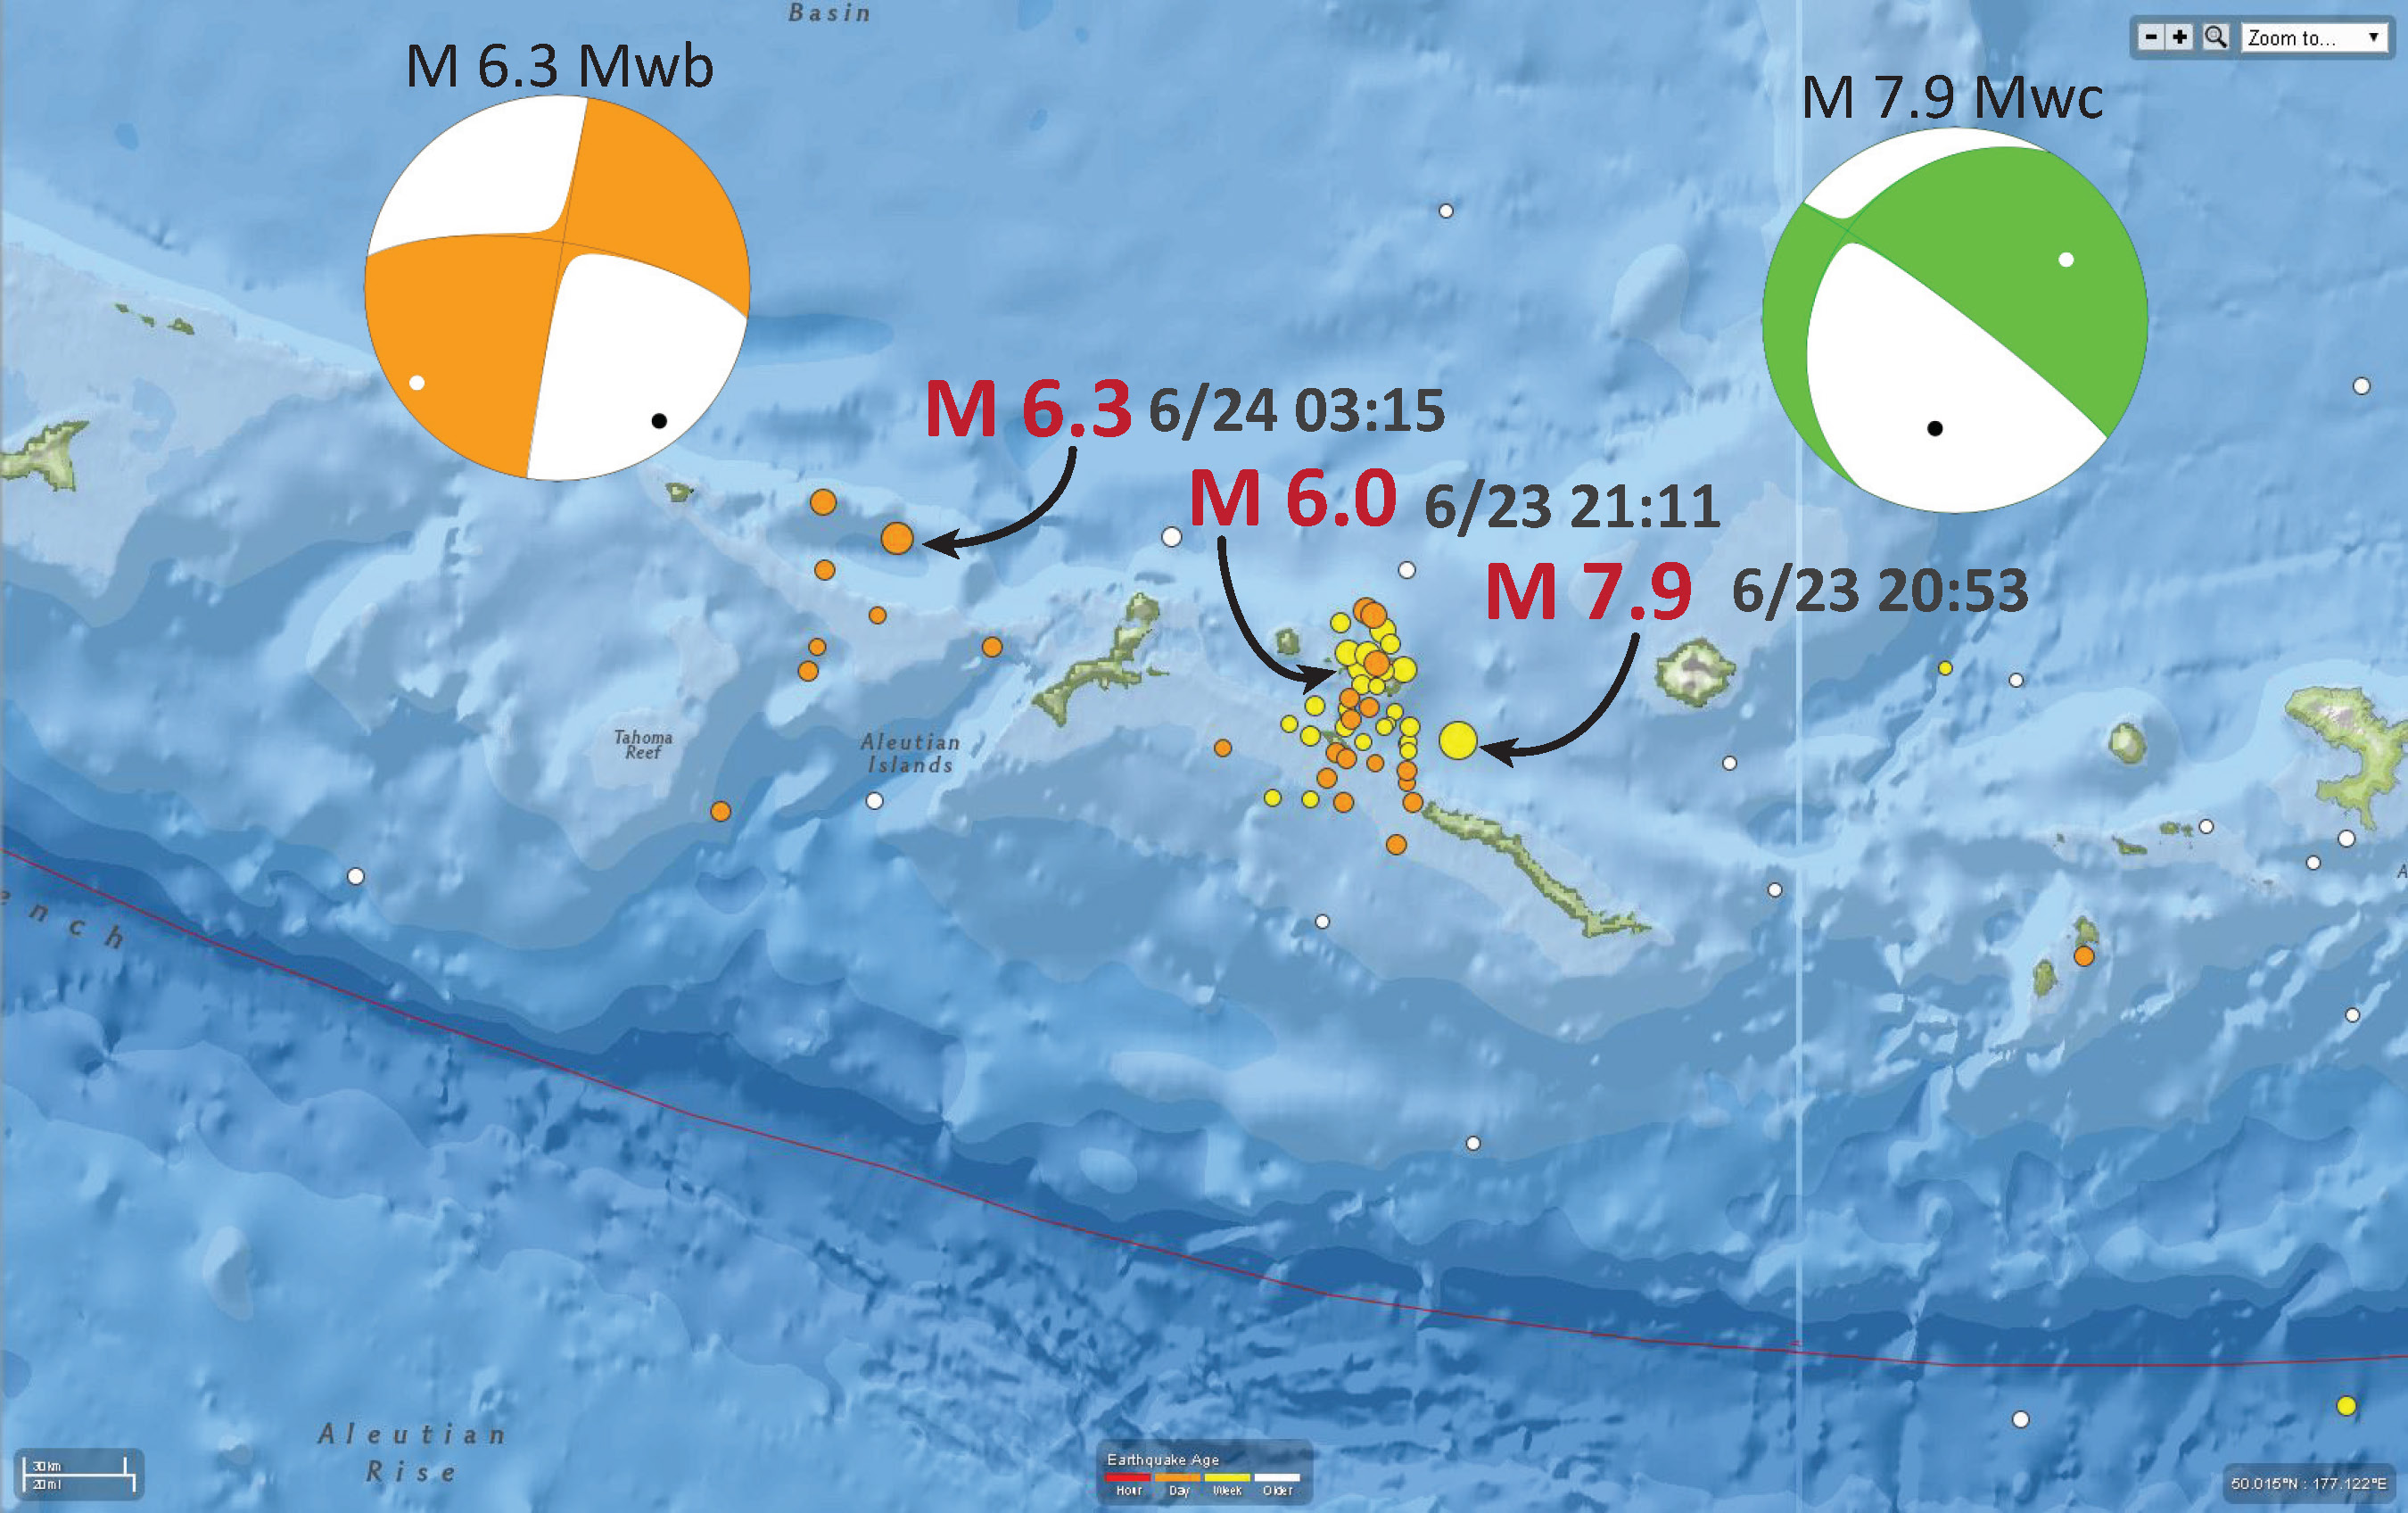
Here is a map that shows the epicenters, the magnitudes, and the time the earthquakes were recorded. The USGS moment tensor for the M = 7.9 earthquake is in green. The USGS moment tensor for the M = 6.3 earthquake is in orange.
In this map I placed lines that are oriented for my preferred fault plane solution from each of the moment tensors. I center the red strike line on the epicenter for each earthquake. There is some spread to the strike (neither of the two largest earthquakes align perfectly with their partner’s strike).

This map shows a strike line that is the average between the strike lines for the two largest earthquakes. This is far from being quantitative, but it shows a little about how if we consider the different sources of error for each measurement (aleatory uncertainty) and what we understand about how these moment tensors represent the real earthquake(s) (epistemic uncertainty), it is reasonable to interpret these earthquakes to be along the same fault (or at least a synthetic or subparallel fault).

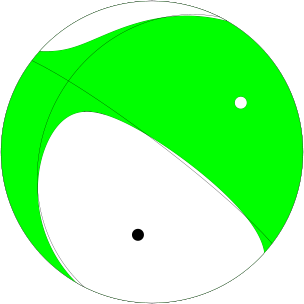
And here is a primer on focal mechanisms. The moment tensor plots are made differently than are focal mechanisms (they use tensors instead of first motions). However, these moment tensor plots use the same graphical representation as focal mechanism plots (i.e. beach balls). Basically, each focal mechanism results in a graphic that shows two possible fault plane solutions (the criss-cross separating the colors, orange or green in this case). The regions of color represent earth that has “bulged out” (compression) and the white represents earth that has contracted (tension) or “bulged in.” This graphic explains this further and click on the graphic to see it full size. This graphic is from here at the USGS. If you want to see a primer on moment tensors, here is the USGS page on them.

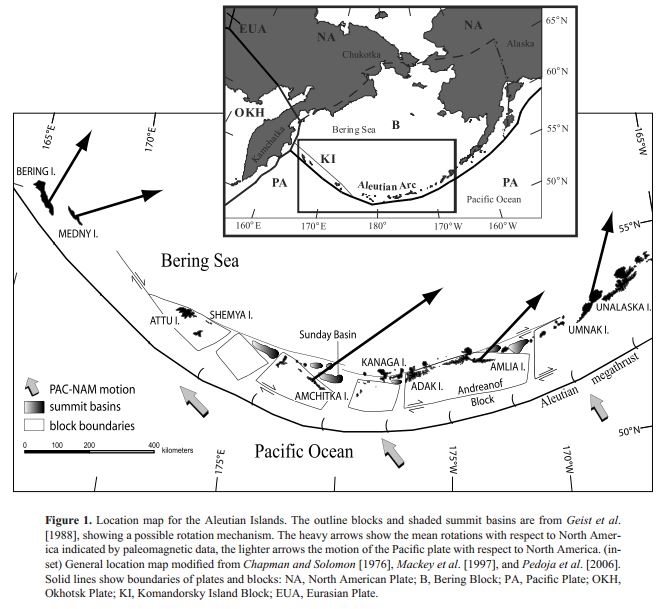
These are deep earthquakes and are clearly not on the subduction zone fault. Also, the moment tensors show mostly strike slip (the M 7.9 slightly extensional-oblique). If we start thinking about forearc slivers (“strain partitioning,” generally in the upper plate, where a subduction zone fault is not perpendicular to the convergence motion, a strike slip fault system will form to accommodate the margin parallel strain). This earthquake swarm appears to be rupturing a forearc sliver in the lower plate. We saw another potential analogy of this in the southwest Pacific earlier this year (the earthquake swarm in the Solomon Islands. I will need to see if anyone has documented (philosophically or otherwise) such a phenomenon. Most forearc slivers that have been documented are in the upper plate (the great Sumatra fault is a great example of a forearc sliver). The Aleutians form blocks that may rotate in response to oblique convergence.
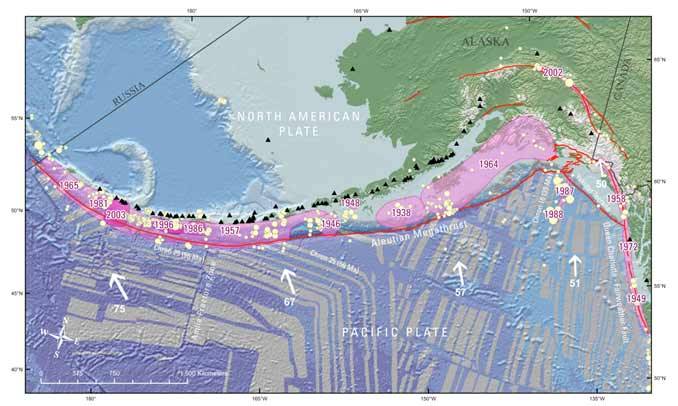
This map shows historic earthquakes in pink. Today’s earthquake is on the eastern boundary of the 1965 M 8.7 subduction zone earthquake. Note the plate motion vectors in white. Note how the plate motion vector nearest the Rat Islands is not perpendicular to the margin (the subduction zone fault).
Here is a graphic showing what a forearc sliver might look like (from GSA).
Here is a map from Krutikov et al. 2008 (Active Tectonics and Seismic Potential of Alaska, Geophysical Monograph Series 179 Copyright 2008 by the American Geophysical Union. 10.1029/179GM07)
Note that there are blocks that are rotating to accomodate the oblique convergence. There are also margin parallel strike slip faults that bound these blocks. These faults are in the upper plate, but may impart localized strain to the lower plate, resulting in strike slip motion on the lower plate (my arm waving part of this). Note how the upper plate strike-slip faults have the same sense of motion as these deeper earthquakes.
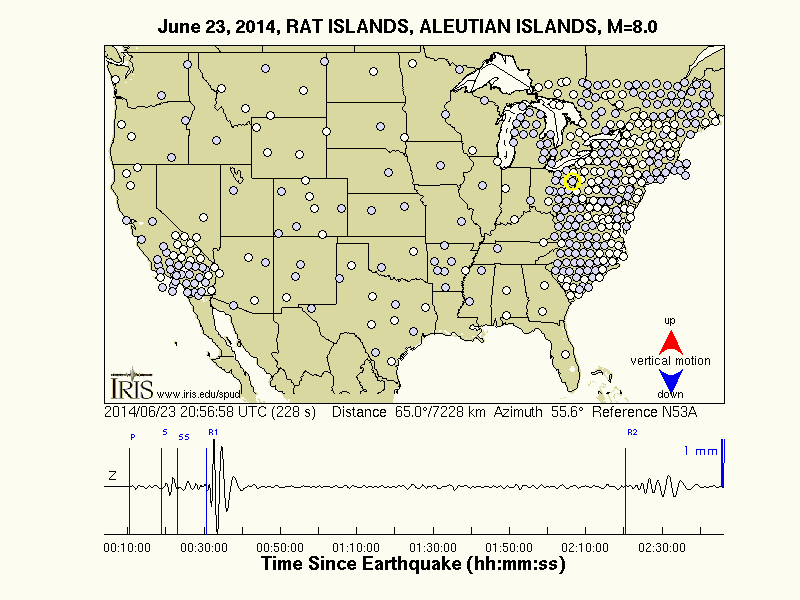
Here is something cool too… This animation was created by IRIS here. The seismologic record of the M 7.9 earthquake as recorded at many operating seismometers is compiled to show the vertical motion across the United States. Red is up and blue is down. Click on the map to view the animation.
1 thought on “M 7.9 Rat Island / Aleutian Islands: aftershocks reveal more”