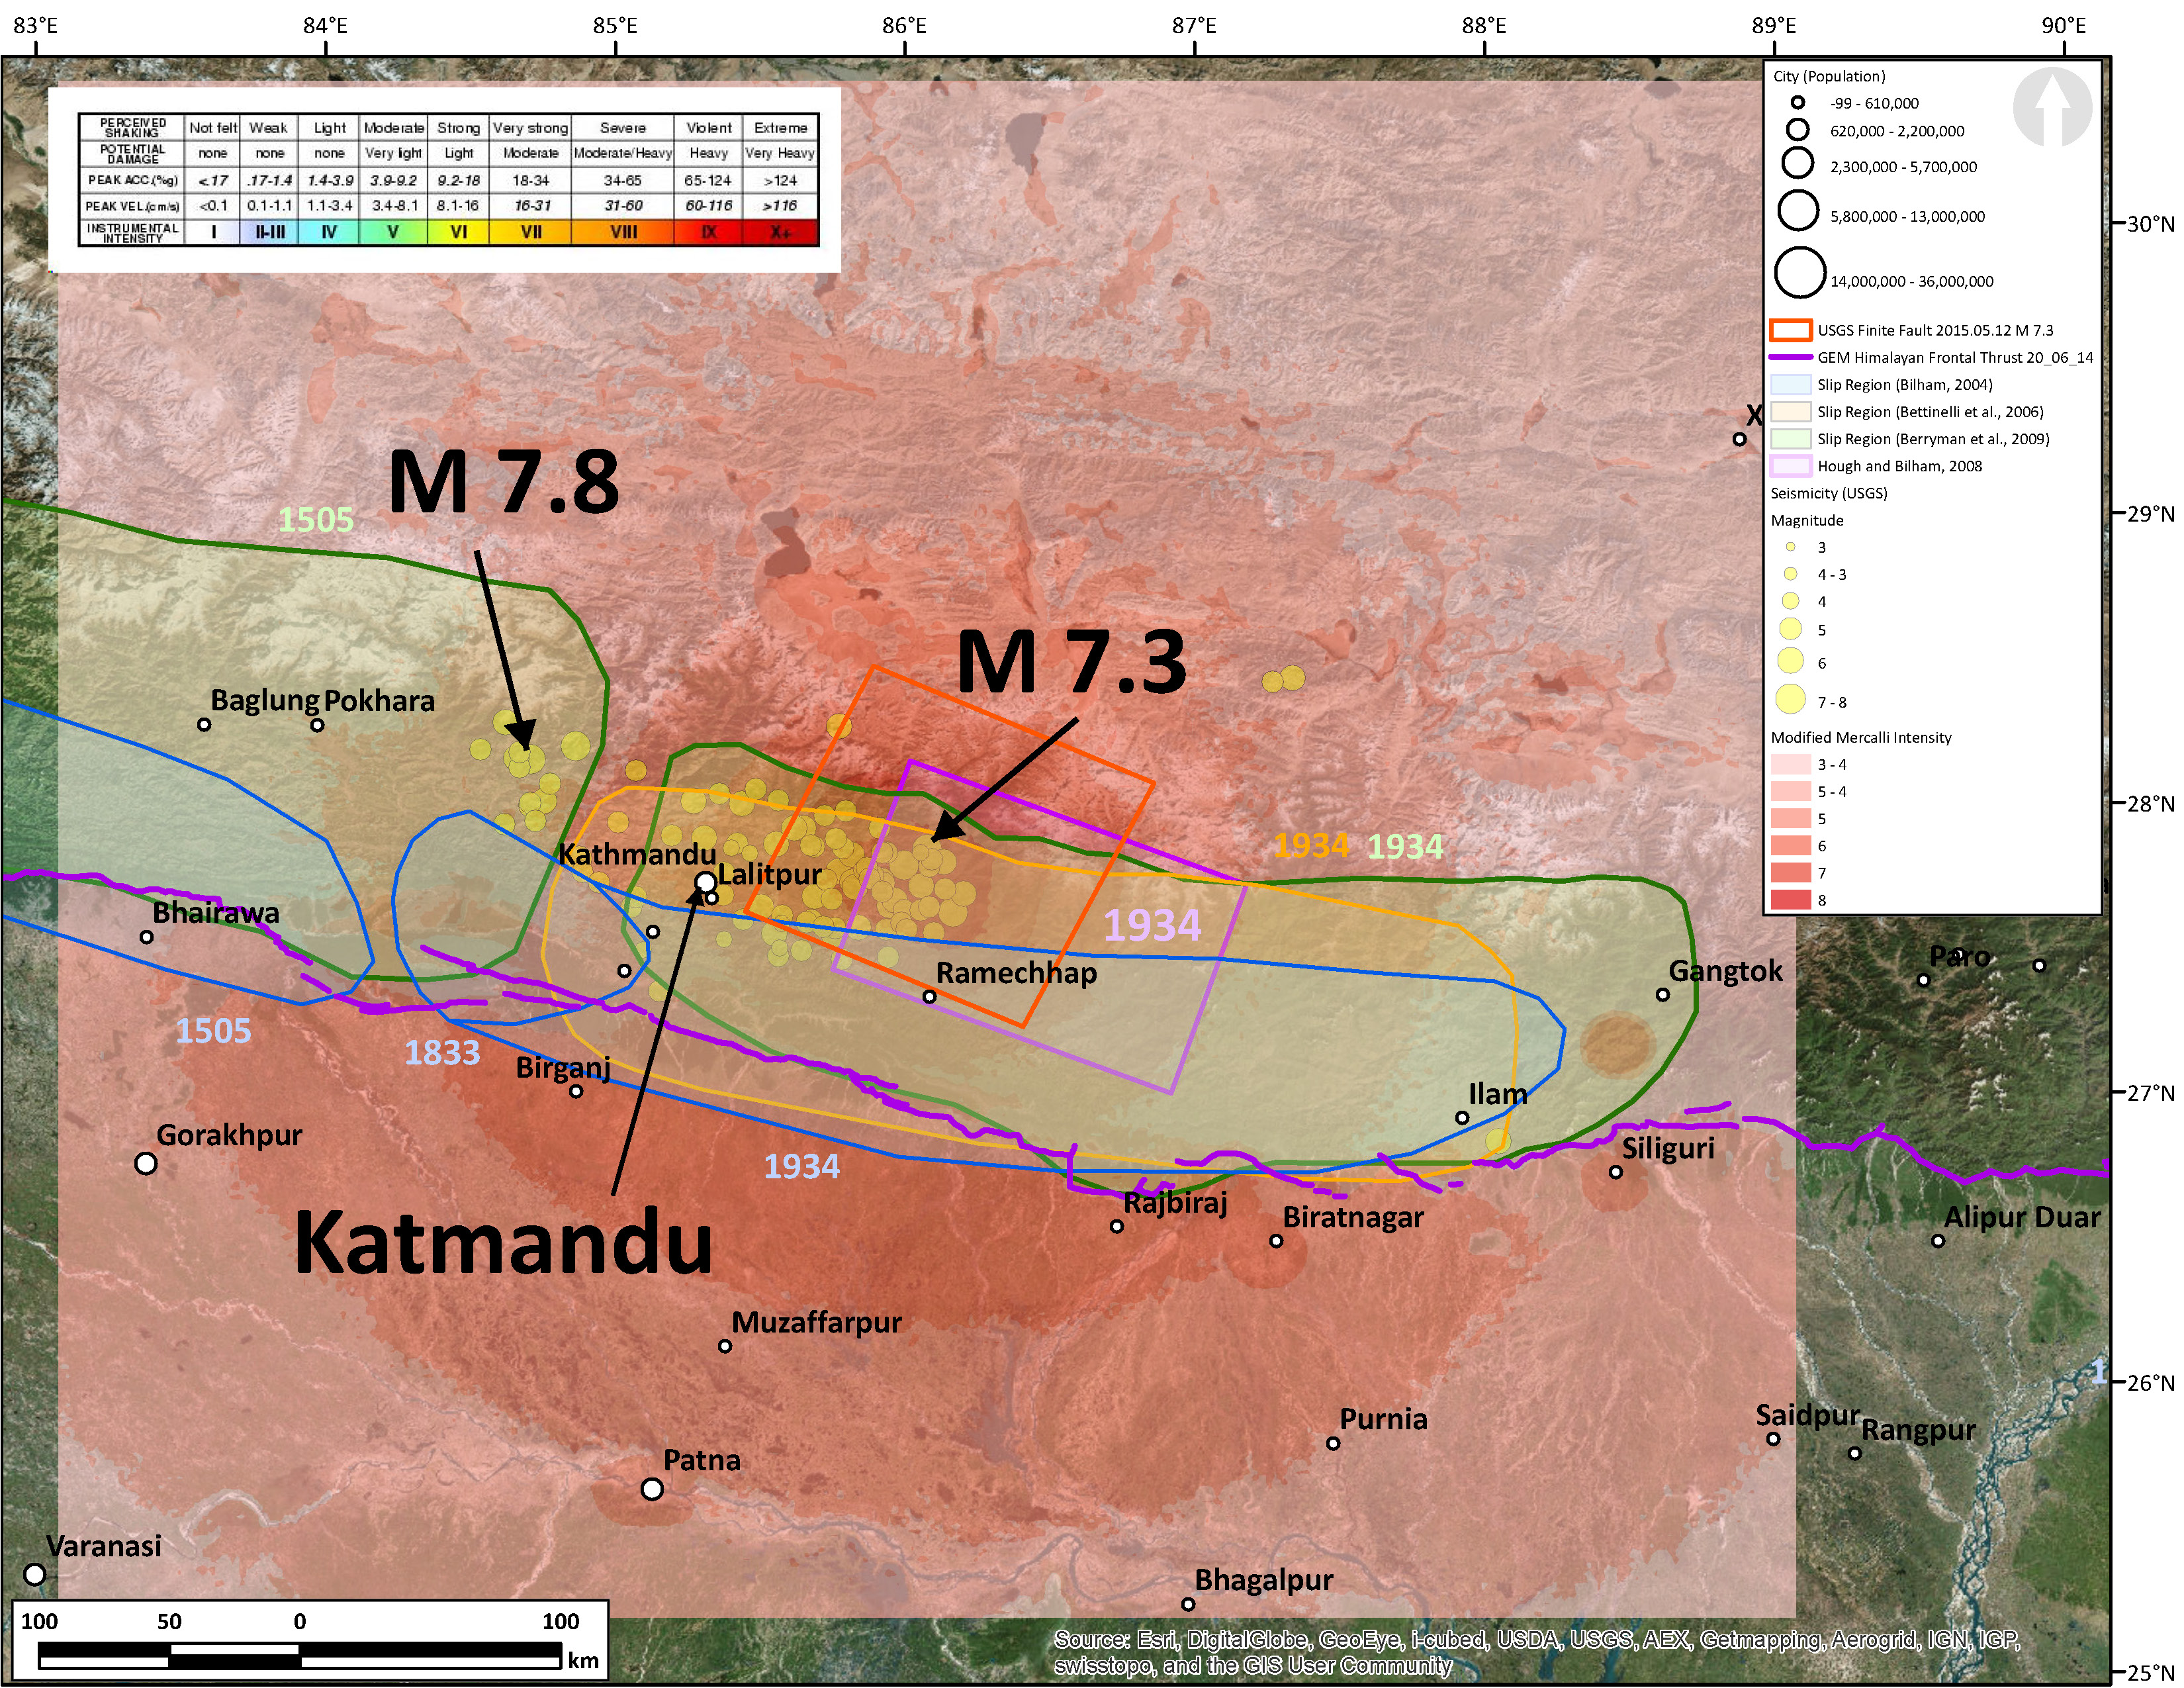
Well, there have been a few more aftershocks over night… Here is my first post about these aftershocks (I provide more links to the USGS web sites). Plus, the USGS has inverted the seismic data to estimate a fault plane (with estimated slip on the fault). They also updated their shaking intensity maps and PAGER estimates to reflect results of modeling slip and ground motions upon this fault plane. Below I plot the new Modified Mercalli Intensity data (in red, not the typical MMI color scale). I also include the Hough and Bilham (2008 ) slip model for the 1934 earthquake. It appears as though this 2015 swarm overlaps slightly with the 1934 slip patch (less so than the other two 1934 slip patches). Previously I had plotted other historic earthquakes on a regional map. Update 10:45 PM PST: I added the GEM frontal thrust fault and the Berryman (2014) earthquake patches to this map.
I digitized the outline of the USGS fault model and present this outline on this map. Here is the fault model with seismicity plotted…
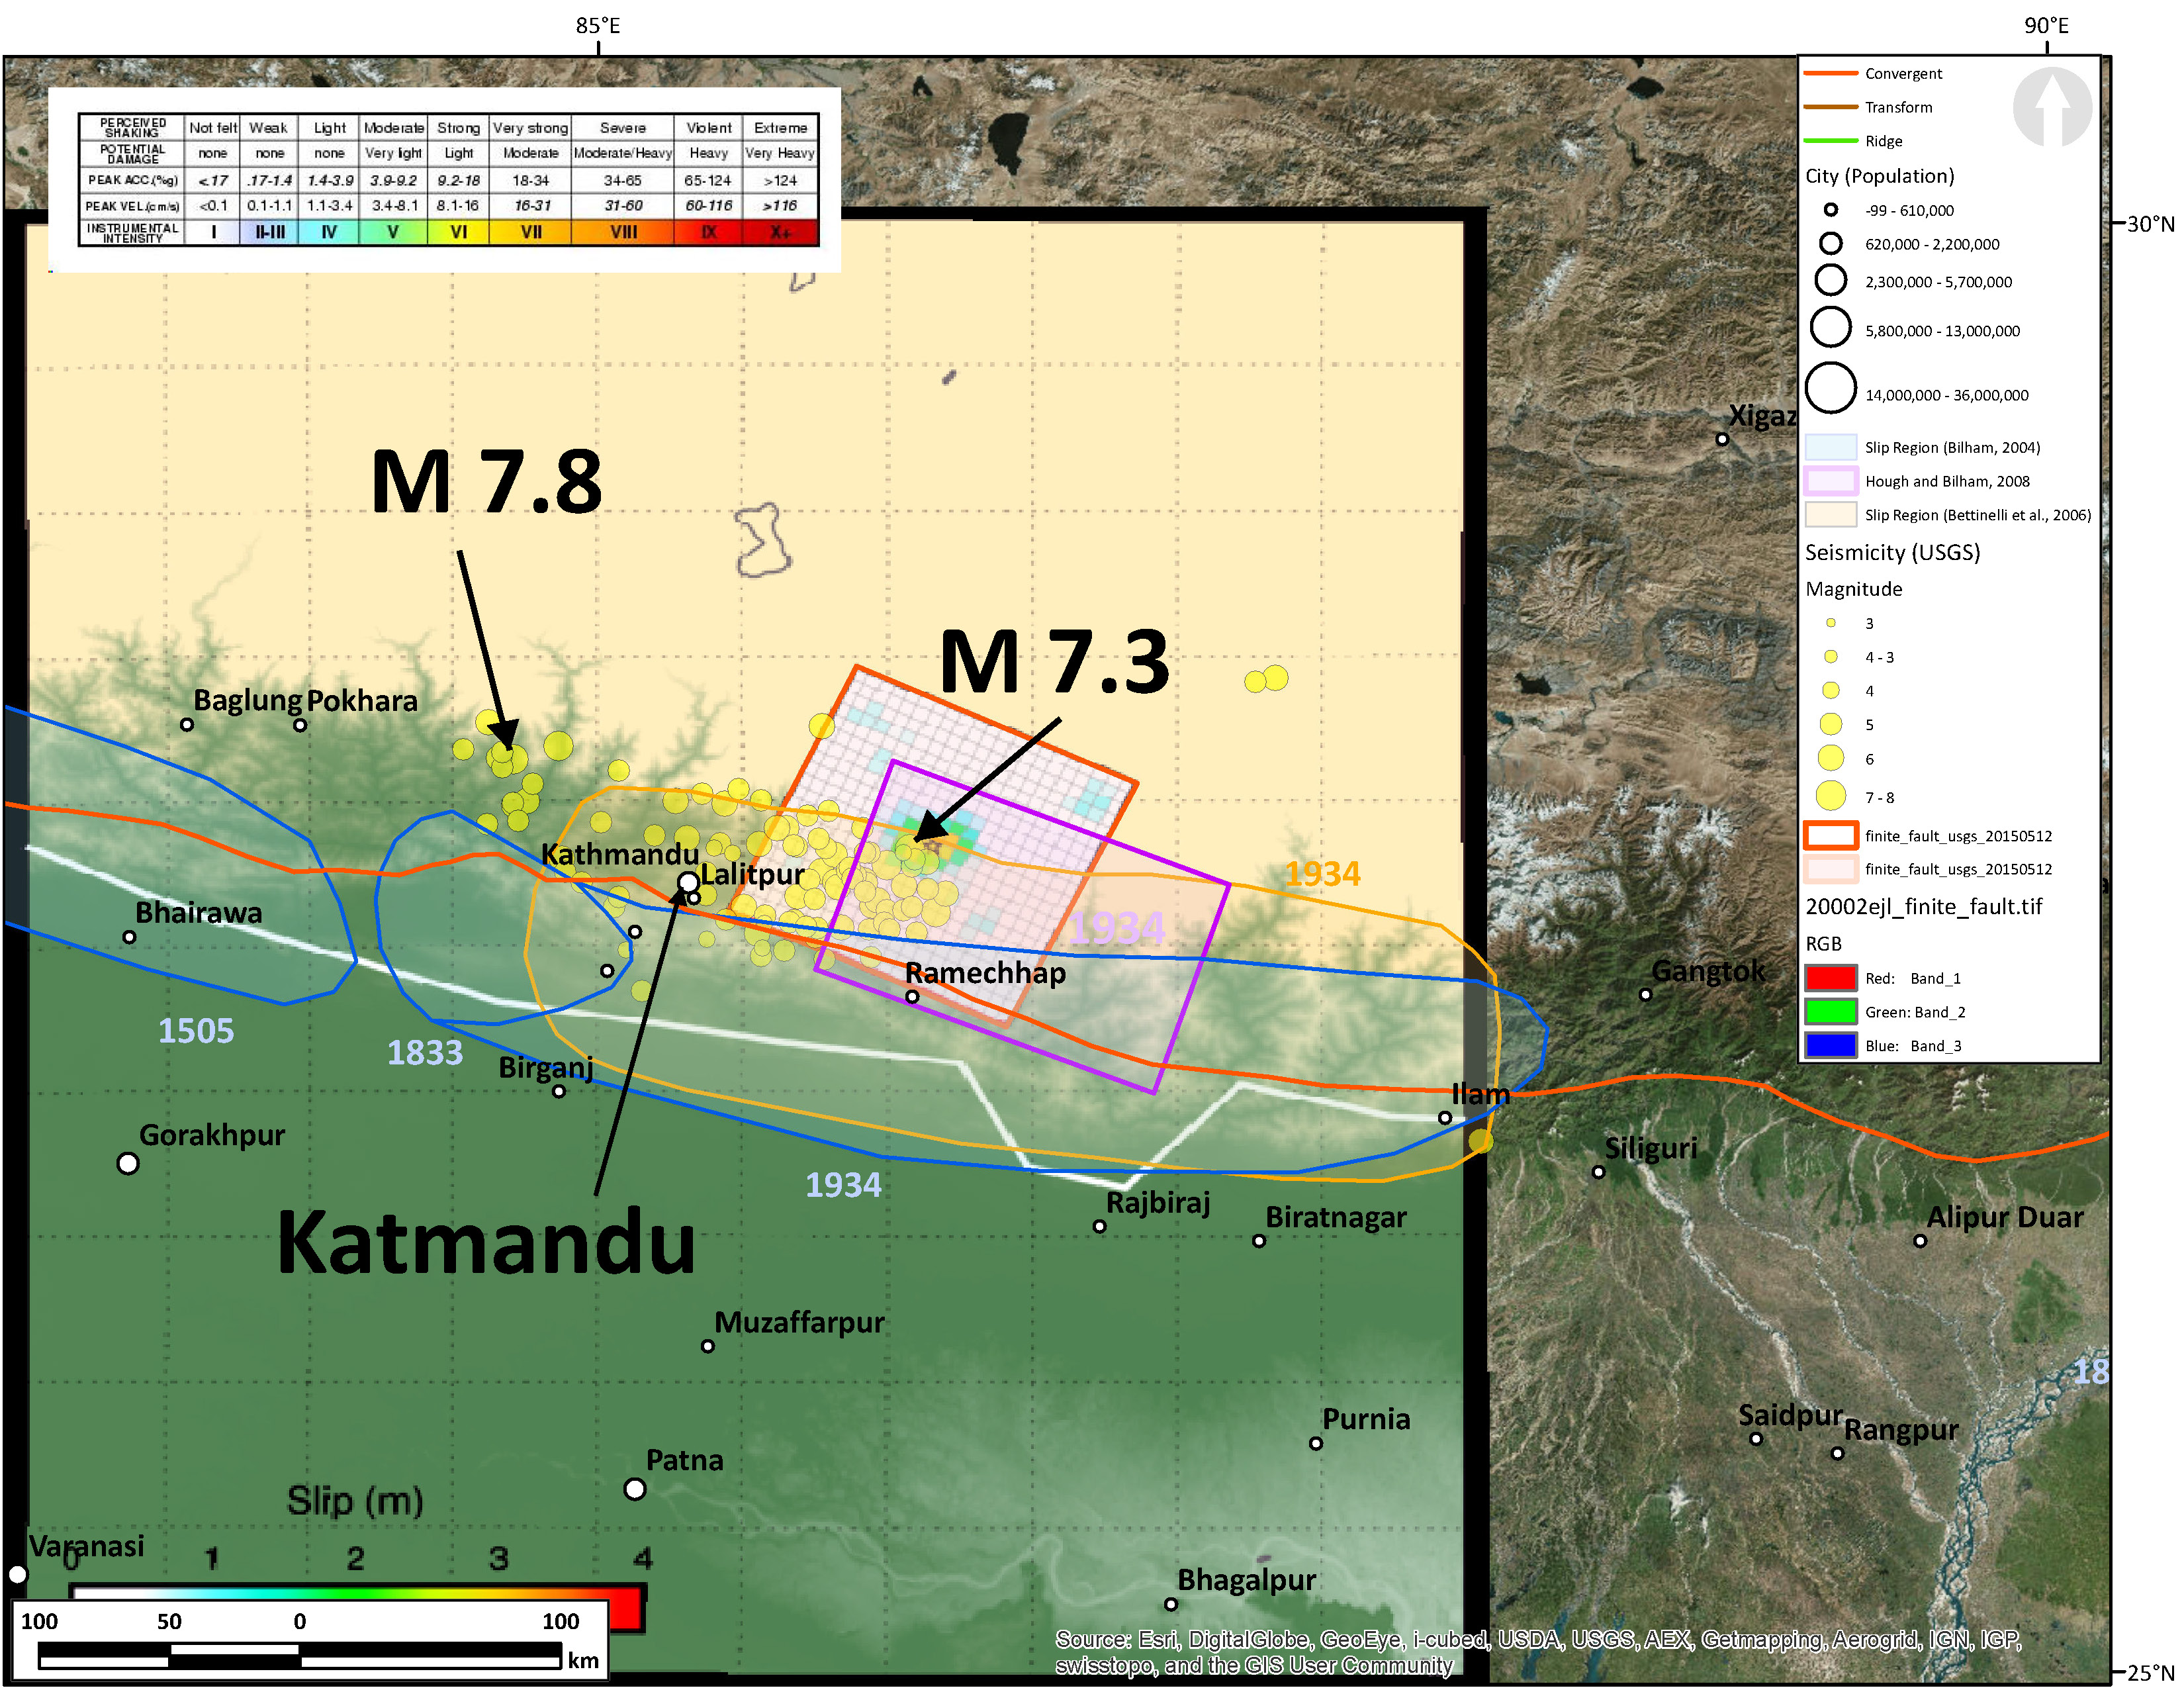
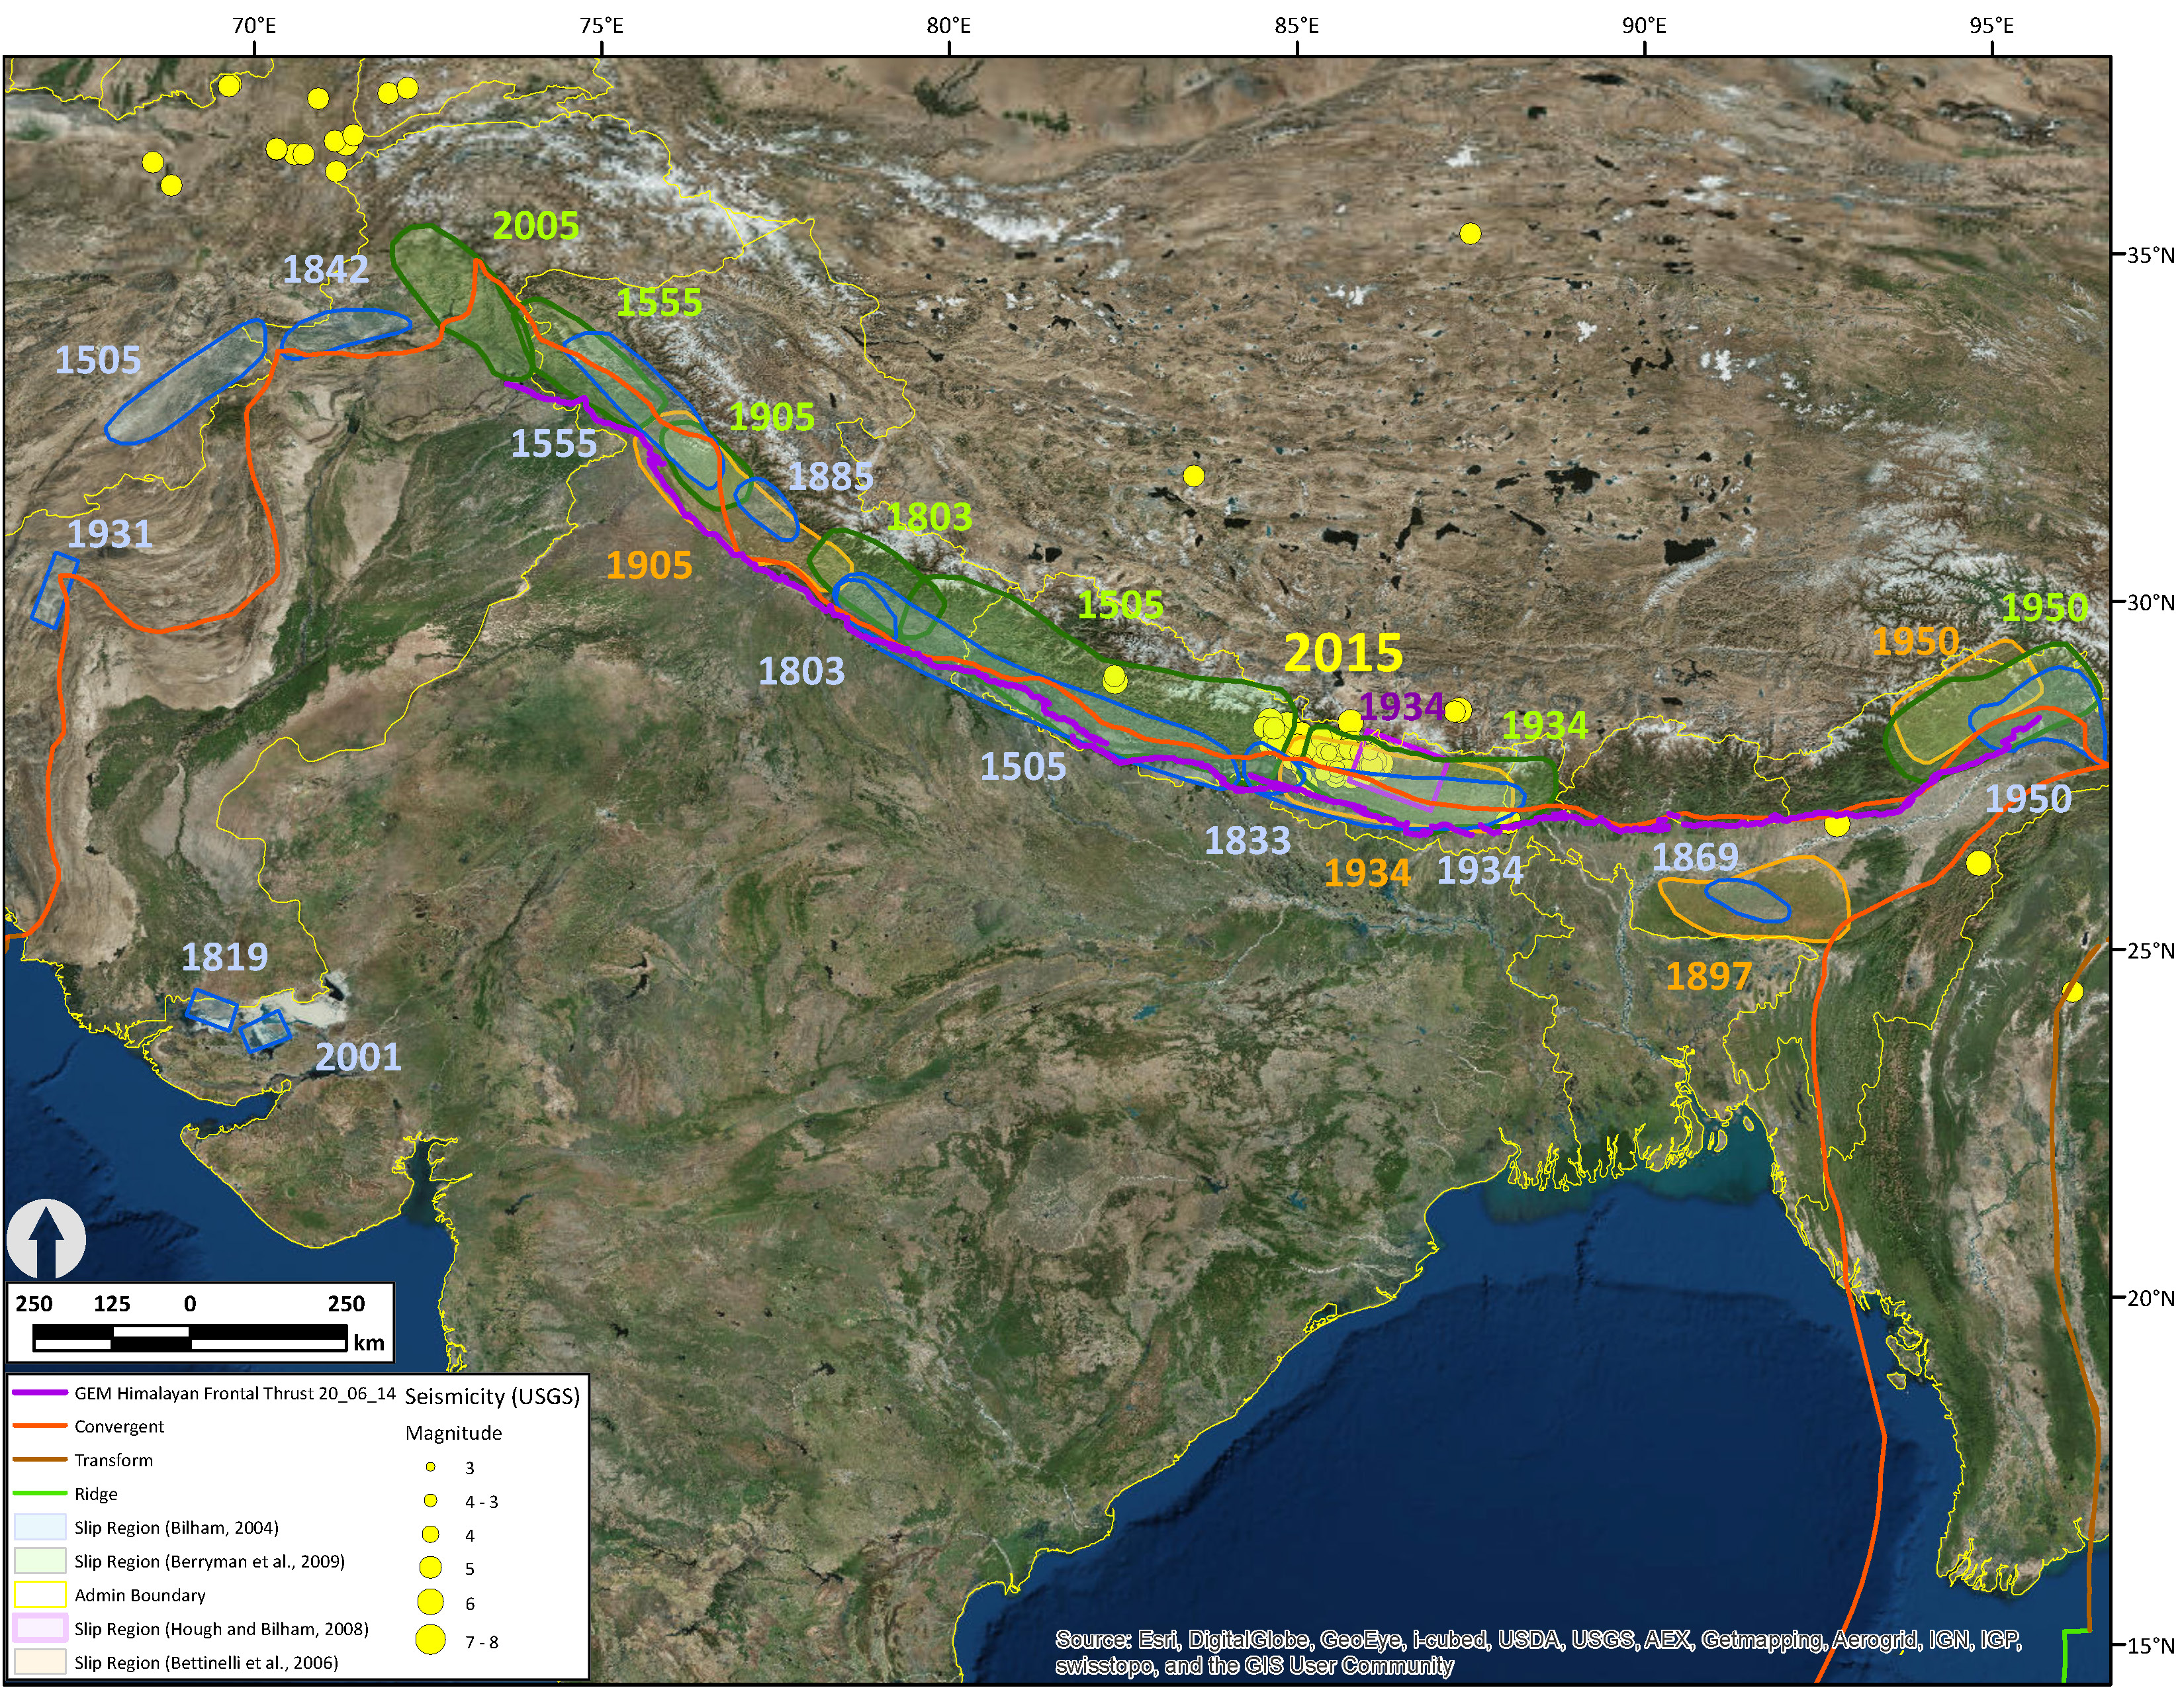
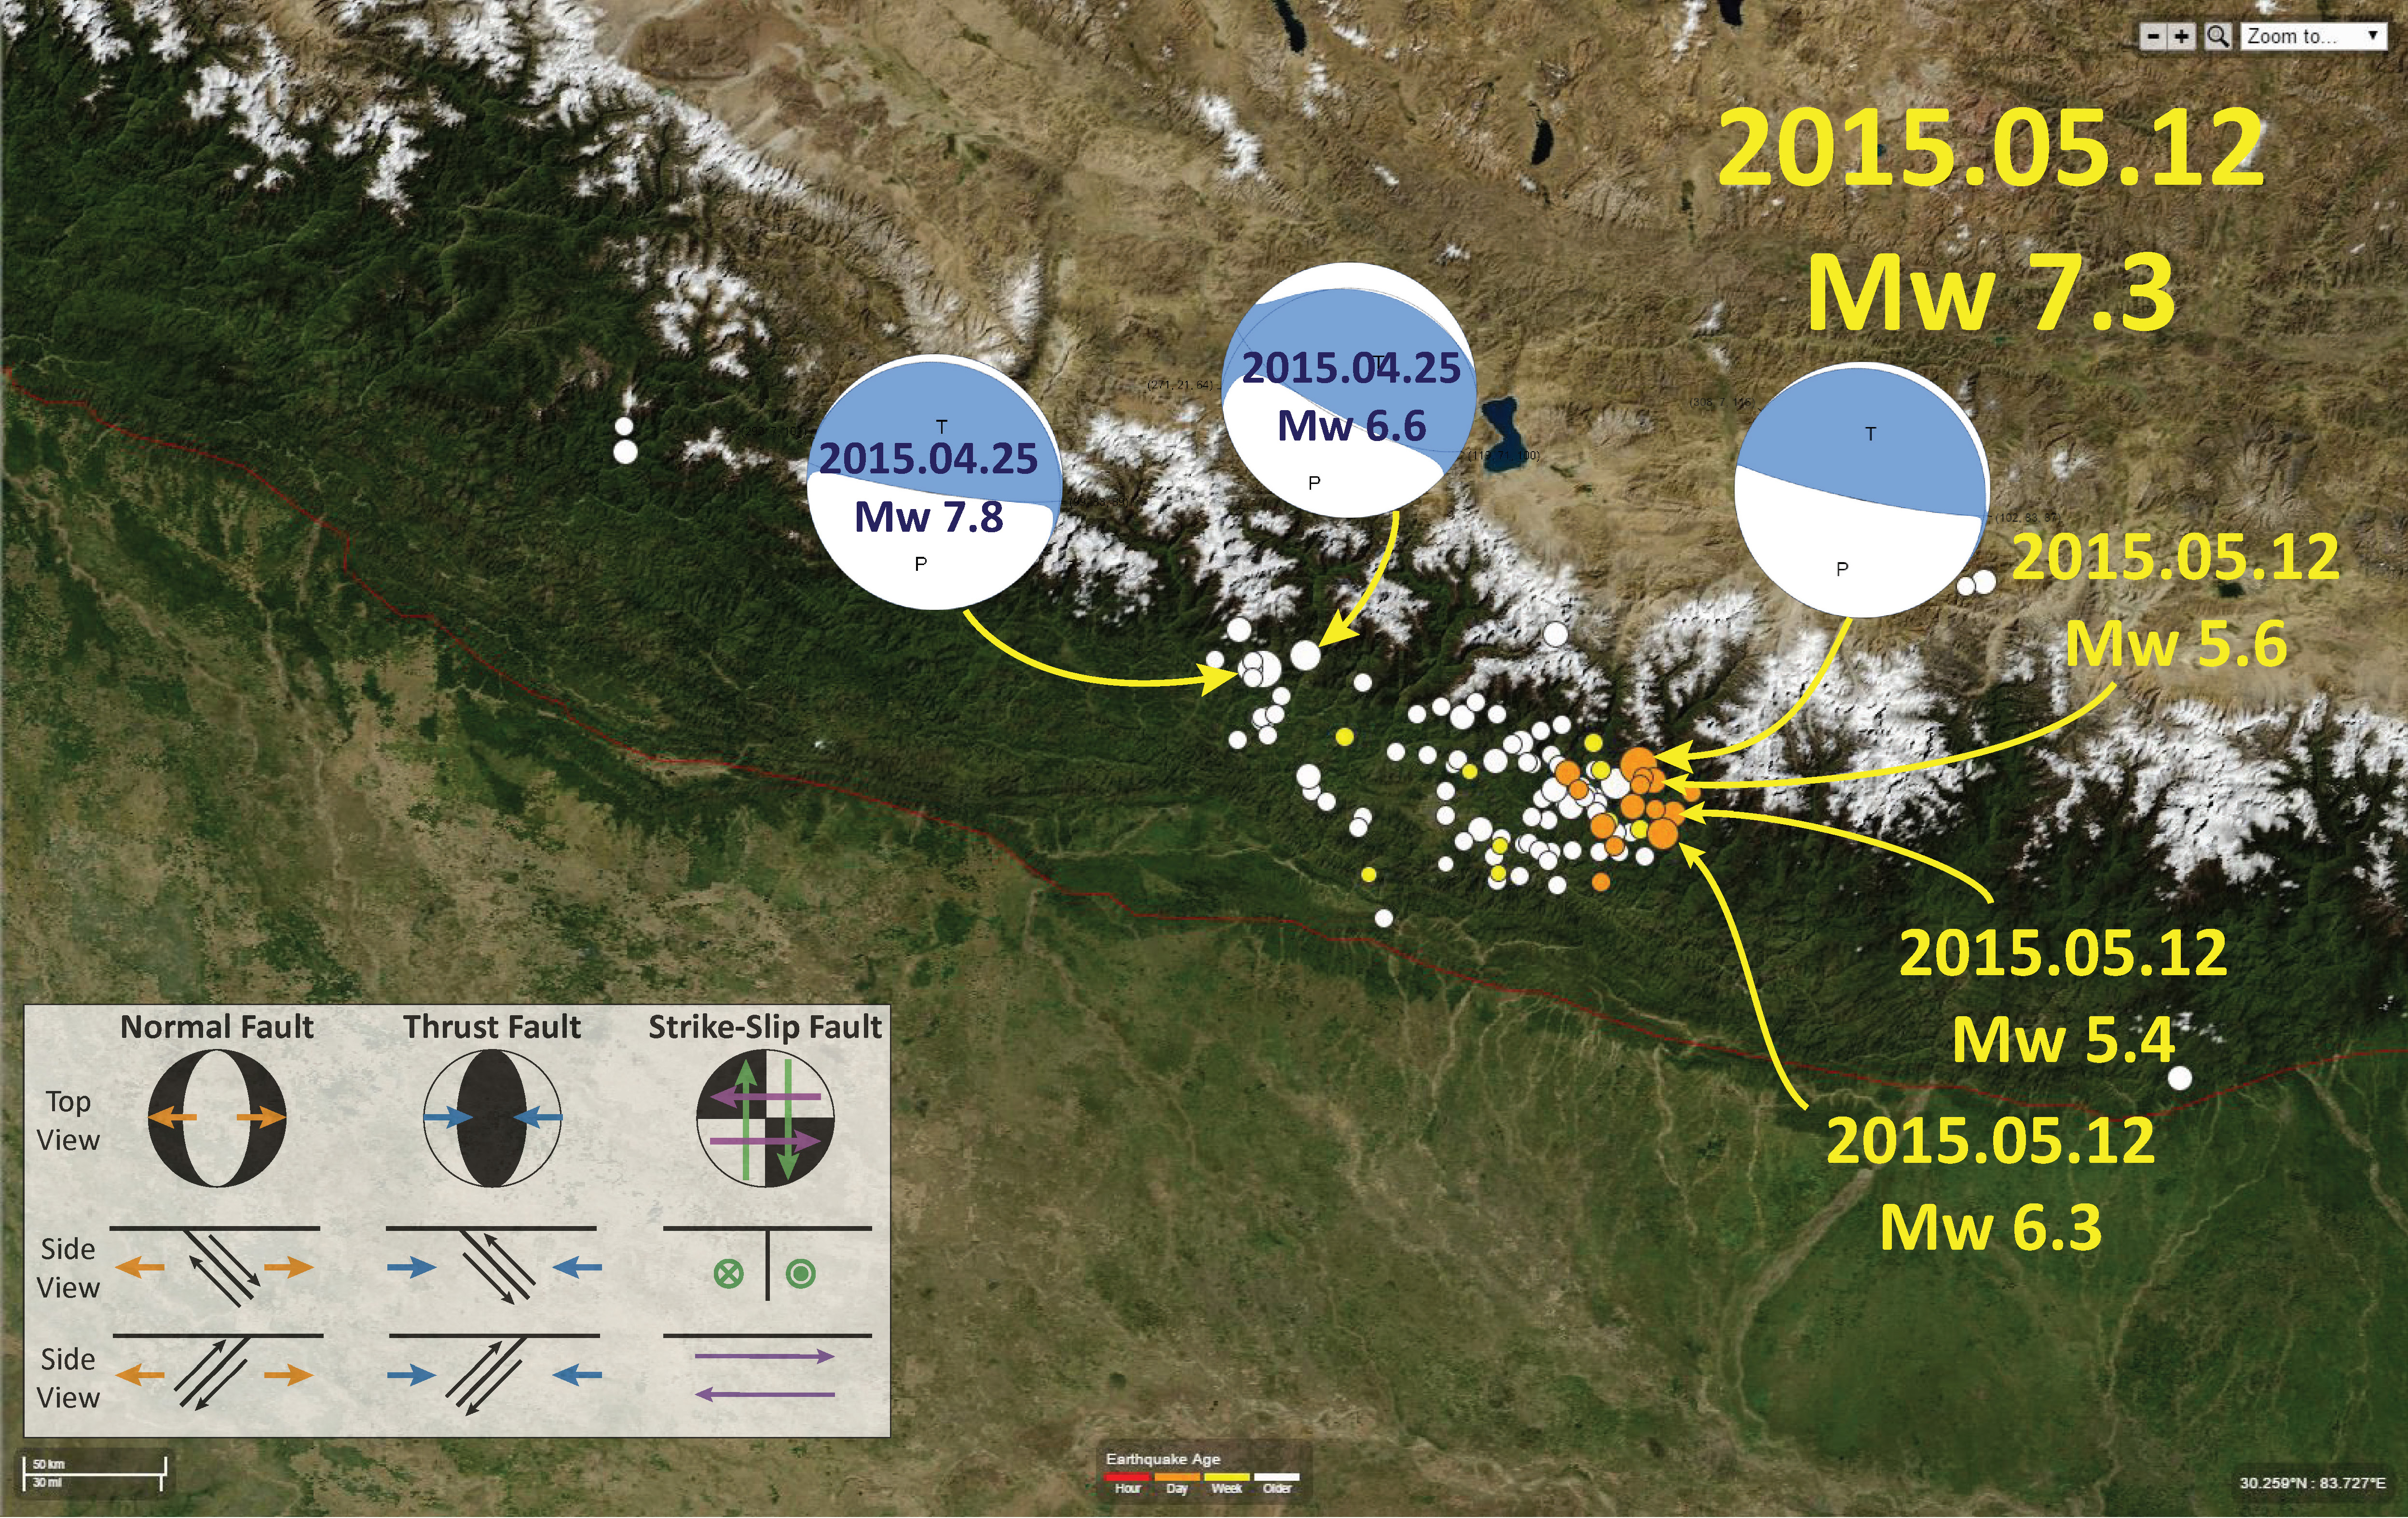
Here is an updated regional map that incorporates Hough and Bilham (2008 ) and today’s seismicity. The historic and prehistoric earthquake slip patches are also shown. The three other data sets now include Bilham (2004), Bettinelli et al (2006), and Berryman et al. (2009). I provide information about how I compiled these data sets on this page.
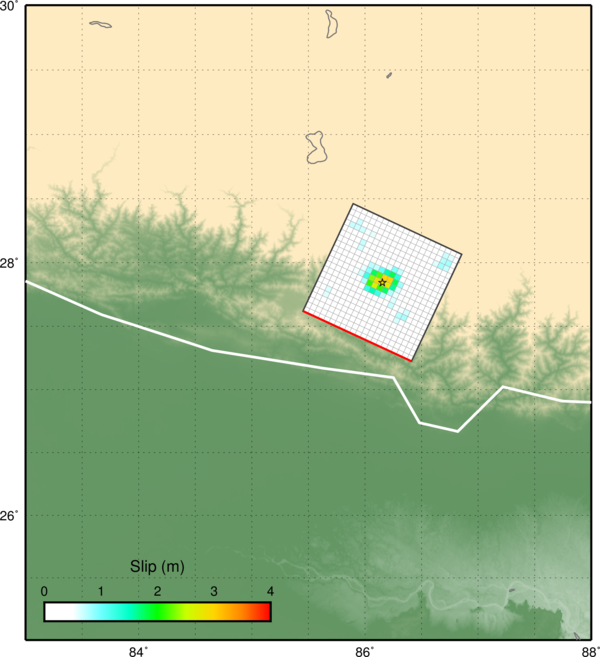
Here is the USGS fault plane solution.
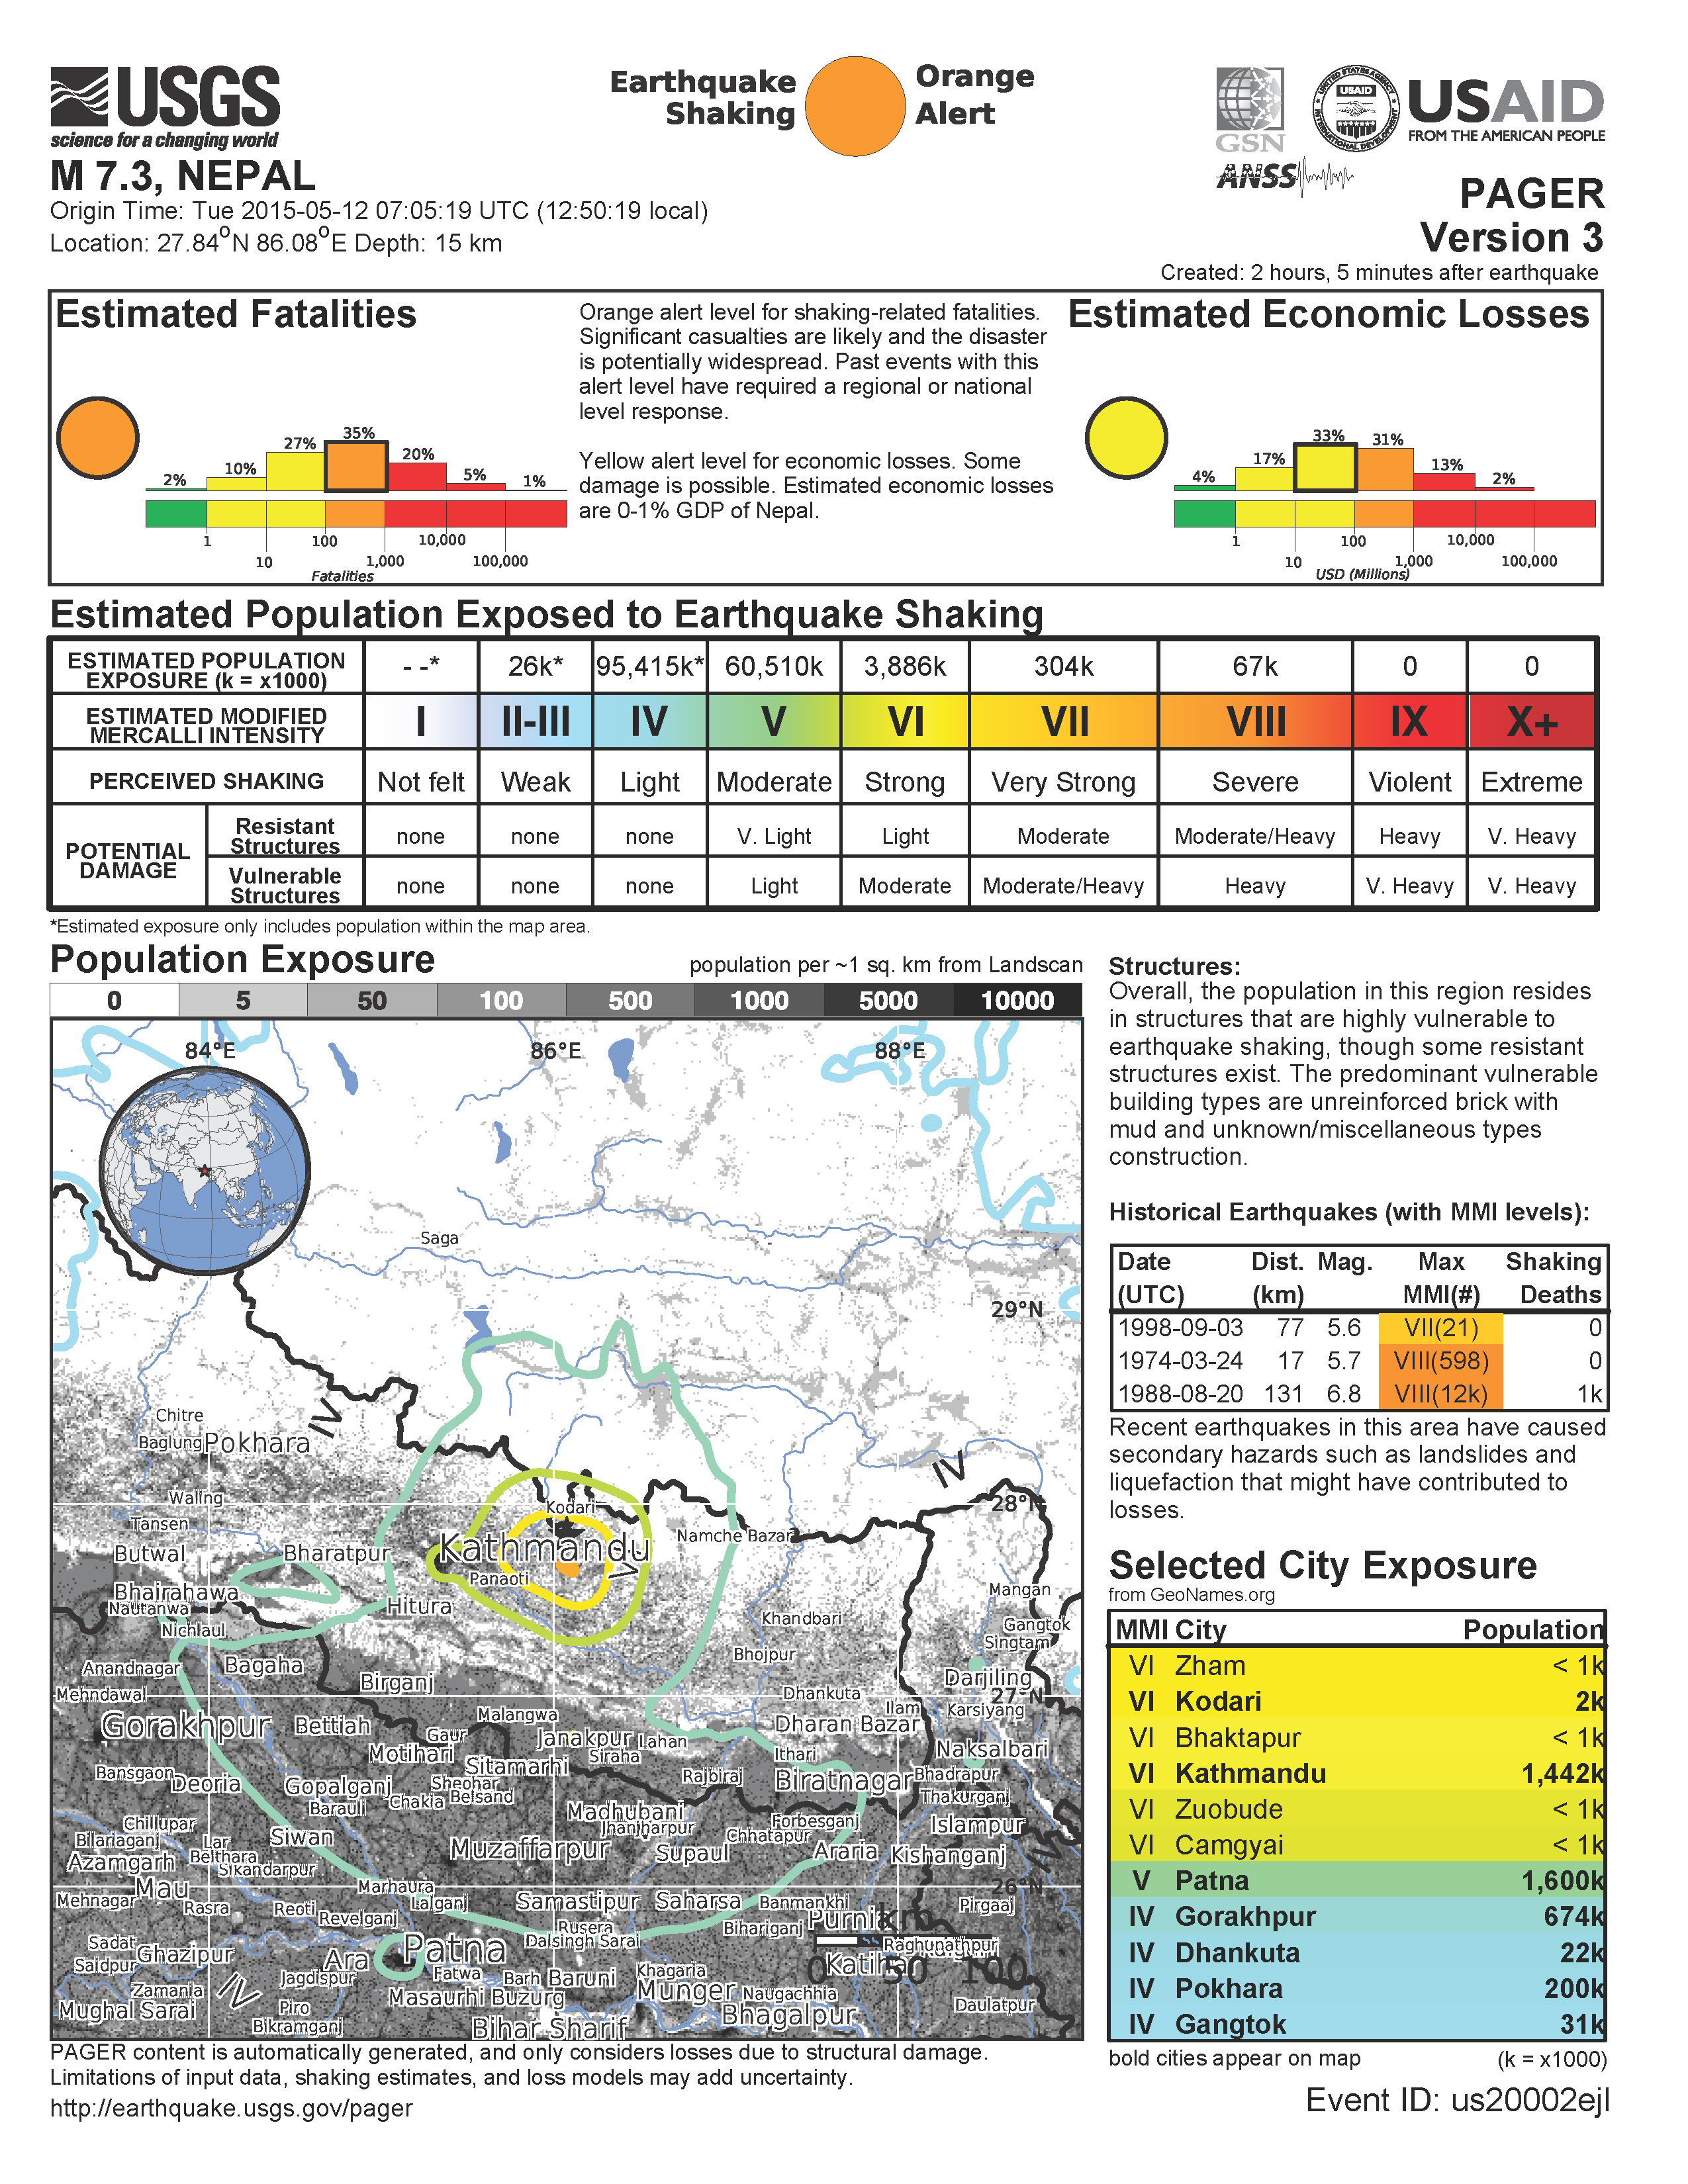
The PAGER [Version 3] estimate has also increased the estimated casualties. This does not include potential casualties from the landslides that will fail during the soon coming monsoon season.
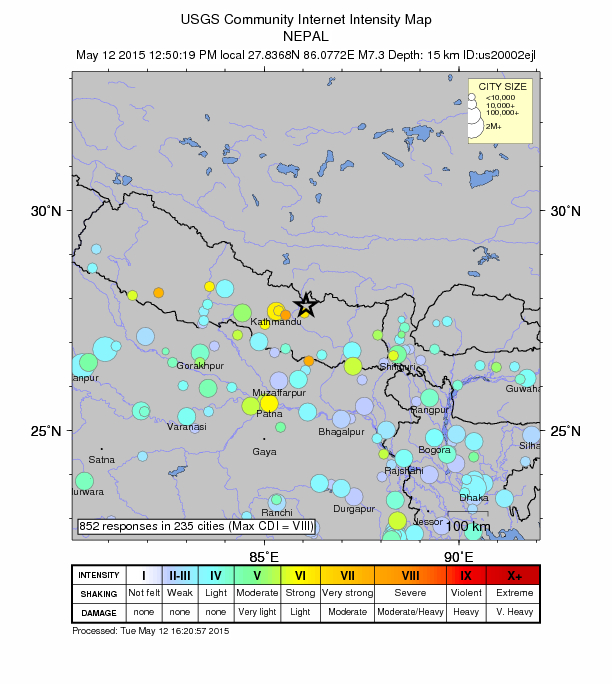
Here is the updated DYFI map.
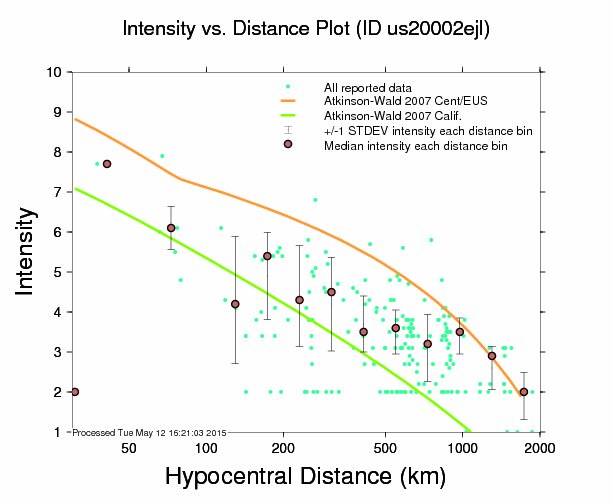
Here is the associated updated attenuation relations plot. I spend more time explaining these two figures in my prior post here.
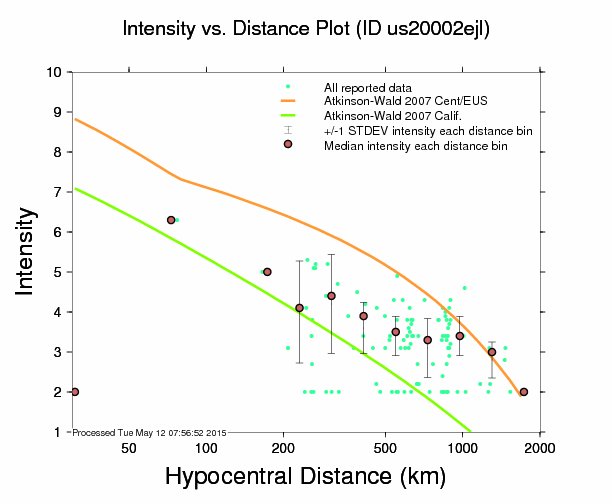
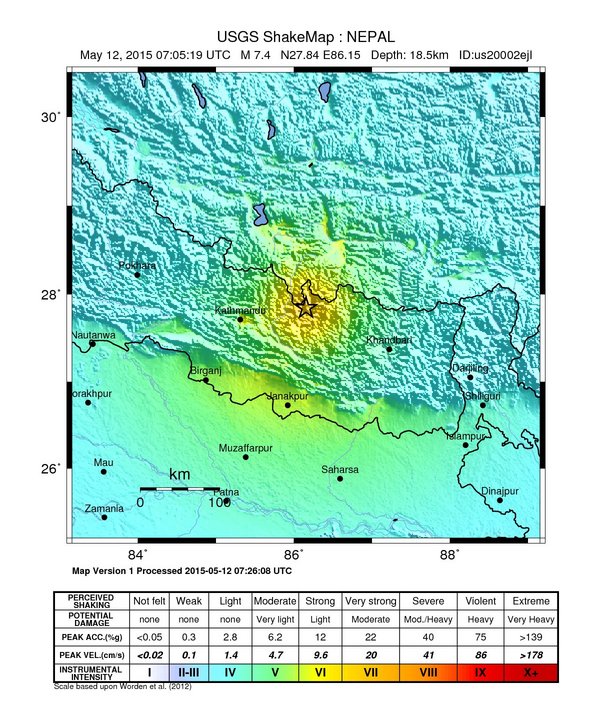
This is the prior attenuation plot for comparison.
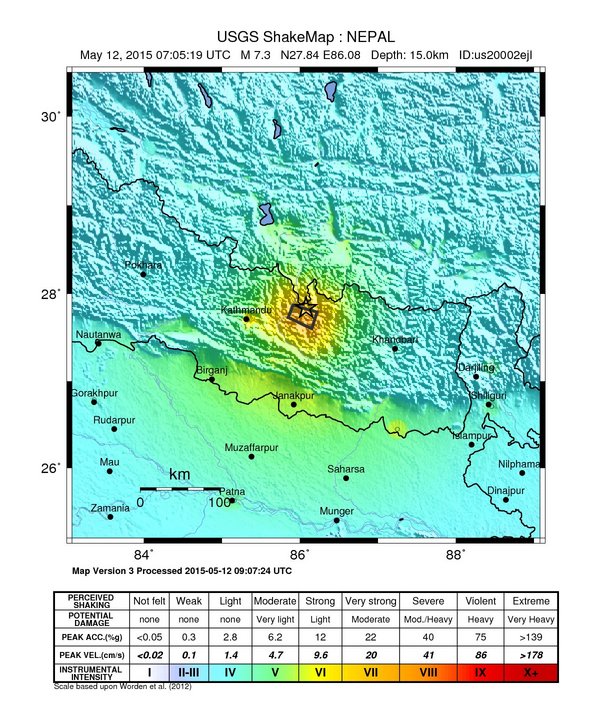
For another comparison, here are the two MMI intensity maps. The first one was based on an automated numerical attenuation model. The lower one is based upon the finite fault inversion.
12:15 PM PST:
Here is an update of the seismicity…
2:30 PM PST:
Here are two visualizations of the seismic waves as they propagate through the Earth. These are records from the USArray Transportable Array. Your tax dollars at work, unless congress defunds these projects. This first video shows vertical motion as red and blue.
This second video shows horizontal motion with magnitude and direction.
-
References:
- Bilham, R., Gaur, V.K., Molnar, P., 2001. Himalayan Seismic Hazard, Science, v. 293, p/ 1,442-1,444.
- Bilham, R., 2004. Earthquakes in India and the Himalaya: tectonics, geodesy and history, Annals of Geophysics, v. 42, no. 2/3, p. 839-858.
- Bettinelli, P., Avouac, J-P., Flouzat, M., Jouanne, F., Bollinger, L., Willis, P., and Chikitrar, G.R., 2006. Plate motion of India and interseismic strain in the Nepal Himalaya from GPS and DORIS measurements, Journal of Geodesy, v. 80, p. 567-589
- Berryman, K., Ries, W., Litchfield, N. (2009) The Himalayan Frontal Thrust: Attributes for seismic hazard Version 1.0, December 2014, GEM Faulted Earth Project, available from http://www.nexus.globalquakemodel.org/.
- Hough, S.E. and Bilham, R., 2008. Site response of the Ganges basin inferred from re-evaluated macroseismic observations from the 1897 Shillong, 1905 Kangra, and 1934 Nepal earthquakes, Journal of Earth System Sciences, v. 117, S2, November 2008, p. 773-782.
Ian here is a version without seismicity plotted (may be more useful to you) http://earthjay.com/earthquakes/20150512_nepal/20150425_nepal_local_MMI_20150512.jpg
the usgs fault plane is also plotted in this one…