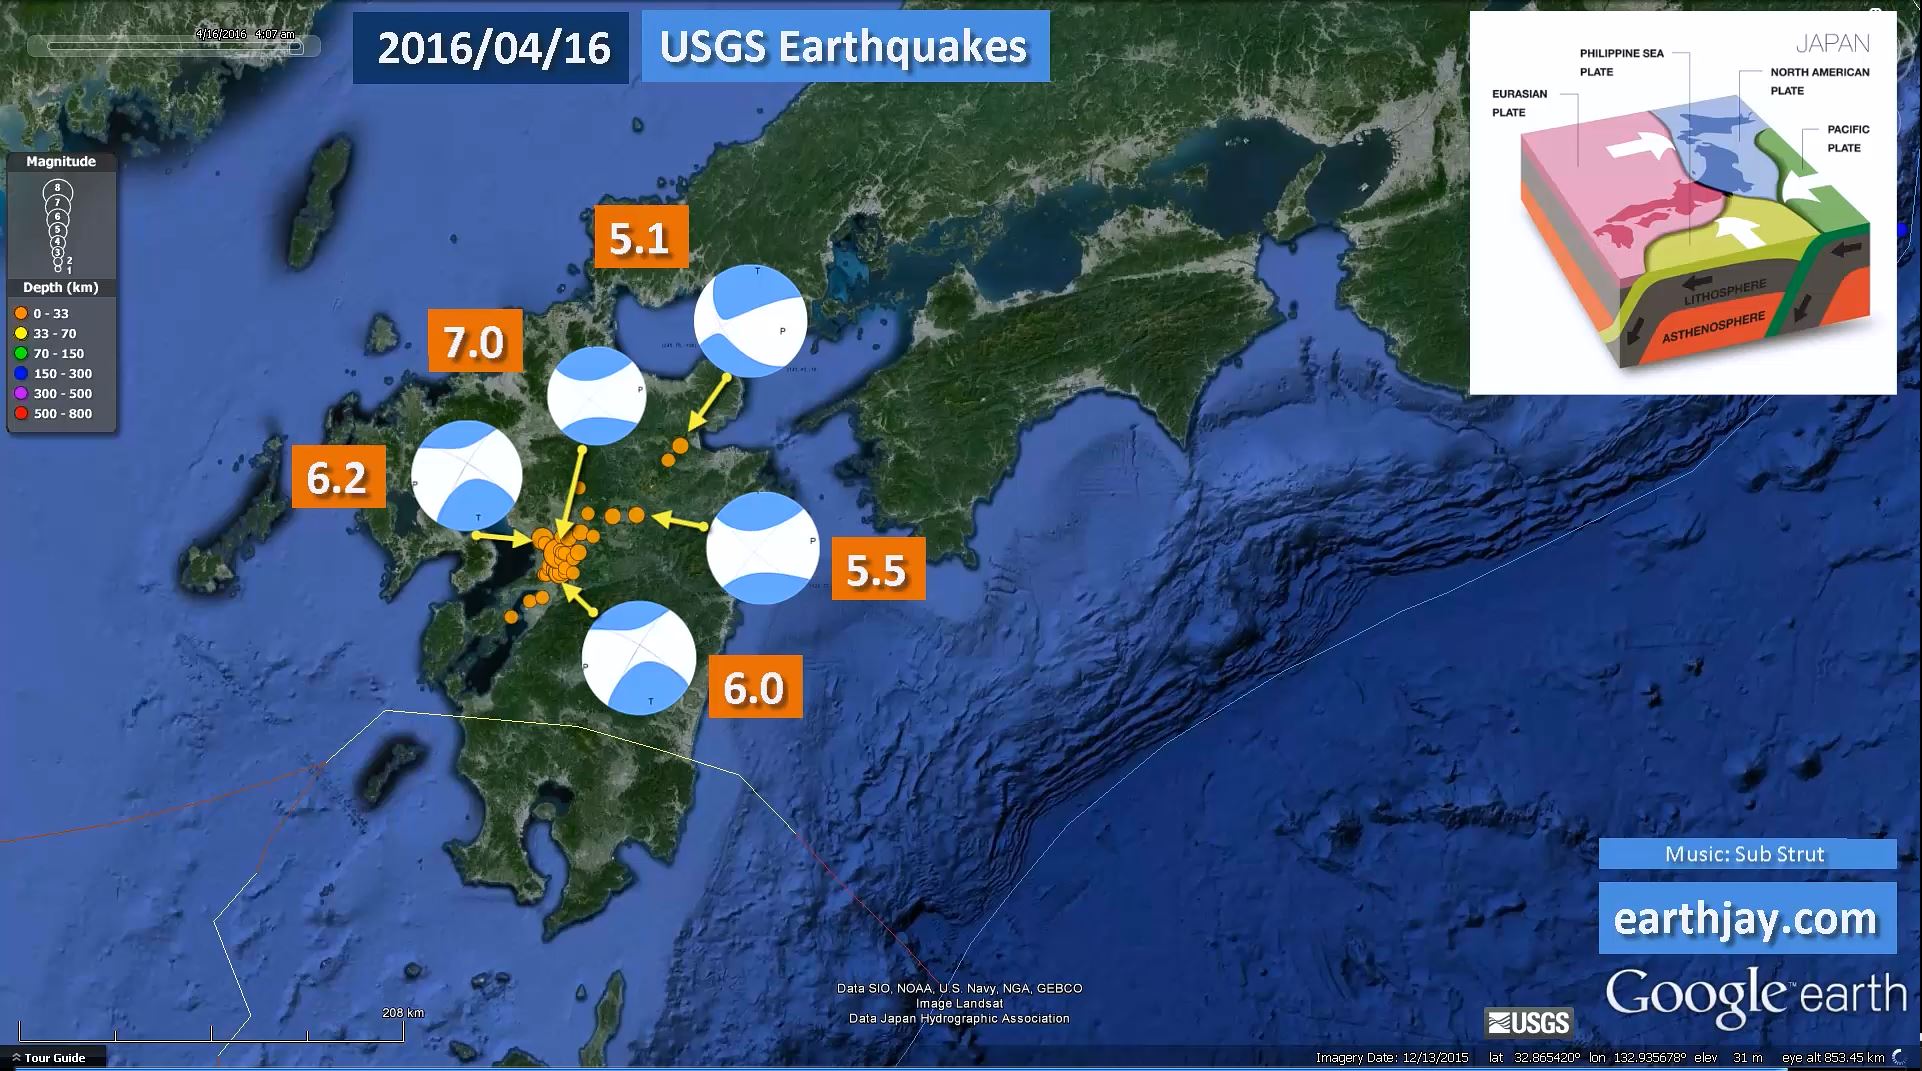
Here is an update to the seismicity from the past couple of days in Kyushu Japan. On 2016/04/14 there was an earthquake with magnitude M 6.2 that initiated this series of earthquakes. The largest aftershock was a magnitude M 6.0. The following day, there was a M 7.0 earthquake. These earthquakes have ruptured a series of faults in the region of Kumamoto, Kyushu, Japan.
Here is a page that helps people connect and help those in Japan.
-
Here are the USGS websites for the larger earthquakes in this region for today and yesterday.
- 2016.04.14 12:26 UTC M 6.2
- 2016.04.14 15:03 UTC M 6.0
- 2016.04.14 15:06 UTC M 5.3
- 2016.04.15 16:25 UTC M 7.0
- 2016.04.15 18:55 UTC M 5.5
- 2016.04.15 22:11 UTC M 5.1
-
I put together an animation for the seismicity from the past few days. The animation spans 4/13-4/16. Below is a map that shows a summary of the animation. Beneath that is the video (link and embedded).
- Here is a link to the video file embedded below (2 MB mp4)

- Here is a fantastic animated gif of the seismicity in this region. The gif has a large file size and one may download it here. Below I include a figure caption as a blockquote.

[ For the officials ] we made this kind of animation . In terms of image for this time of seismic activity I hope to reference . (Temporal movement of the epicenters of Kumamoto Earthquakes)
Time series epicenter plot GIF
https://drive.google.com/file/d/0B8MRNE4IXrmSZW5fV3k0M3RfeVU/view?pref=2&pli=1
Credit: JMA hypocenter · Hinet automatic processing epicenter · ALOS World 3D DSM ( land terrain ) · J-EGG500 ( bathymetry ) AIST seamless geological map ( fault ) · GSHHS ( coastline )
-
Here are the two maps from the first two Earthquake Reports. Please visit those pages for an explanation.
- Initial Report 2016.04.14 M 6.2
- Update # 1 Report 2016.04.15 M 7.0

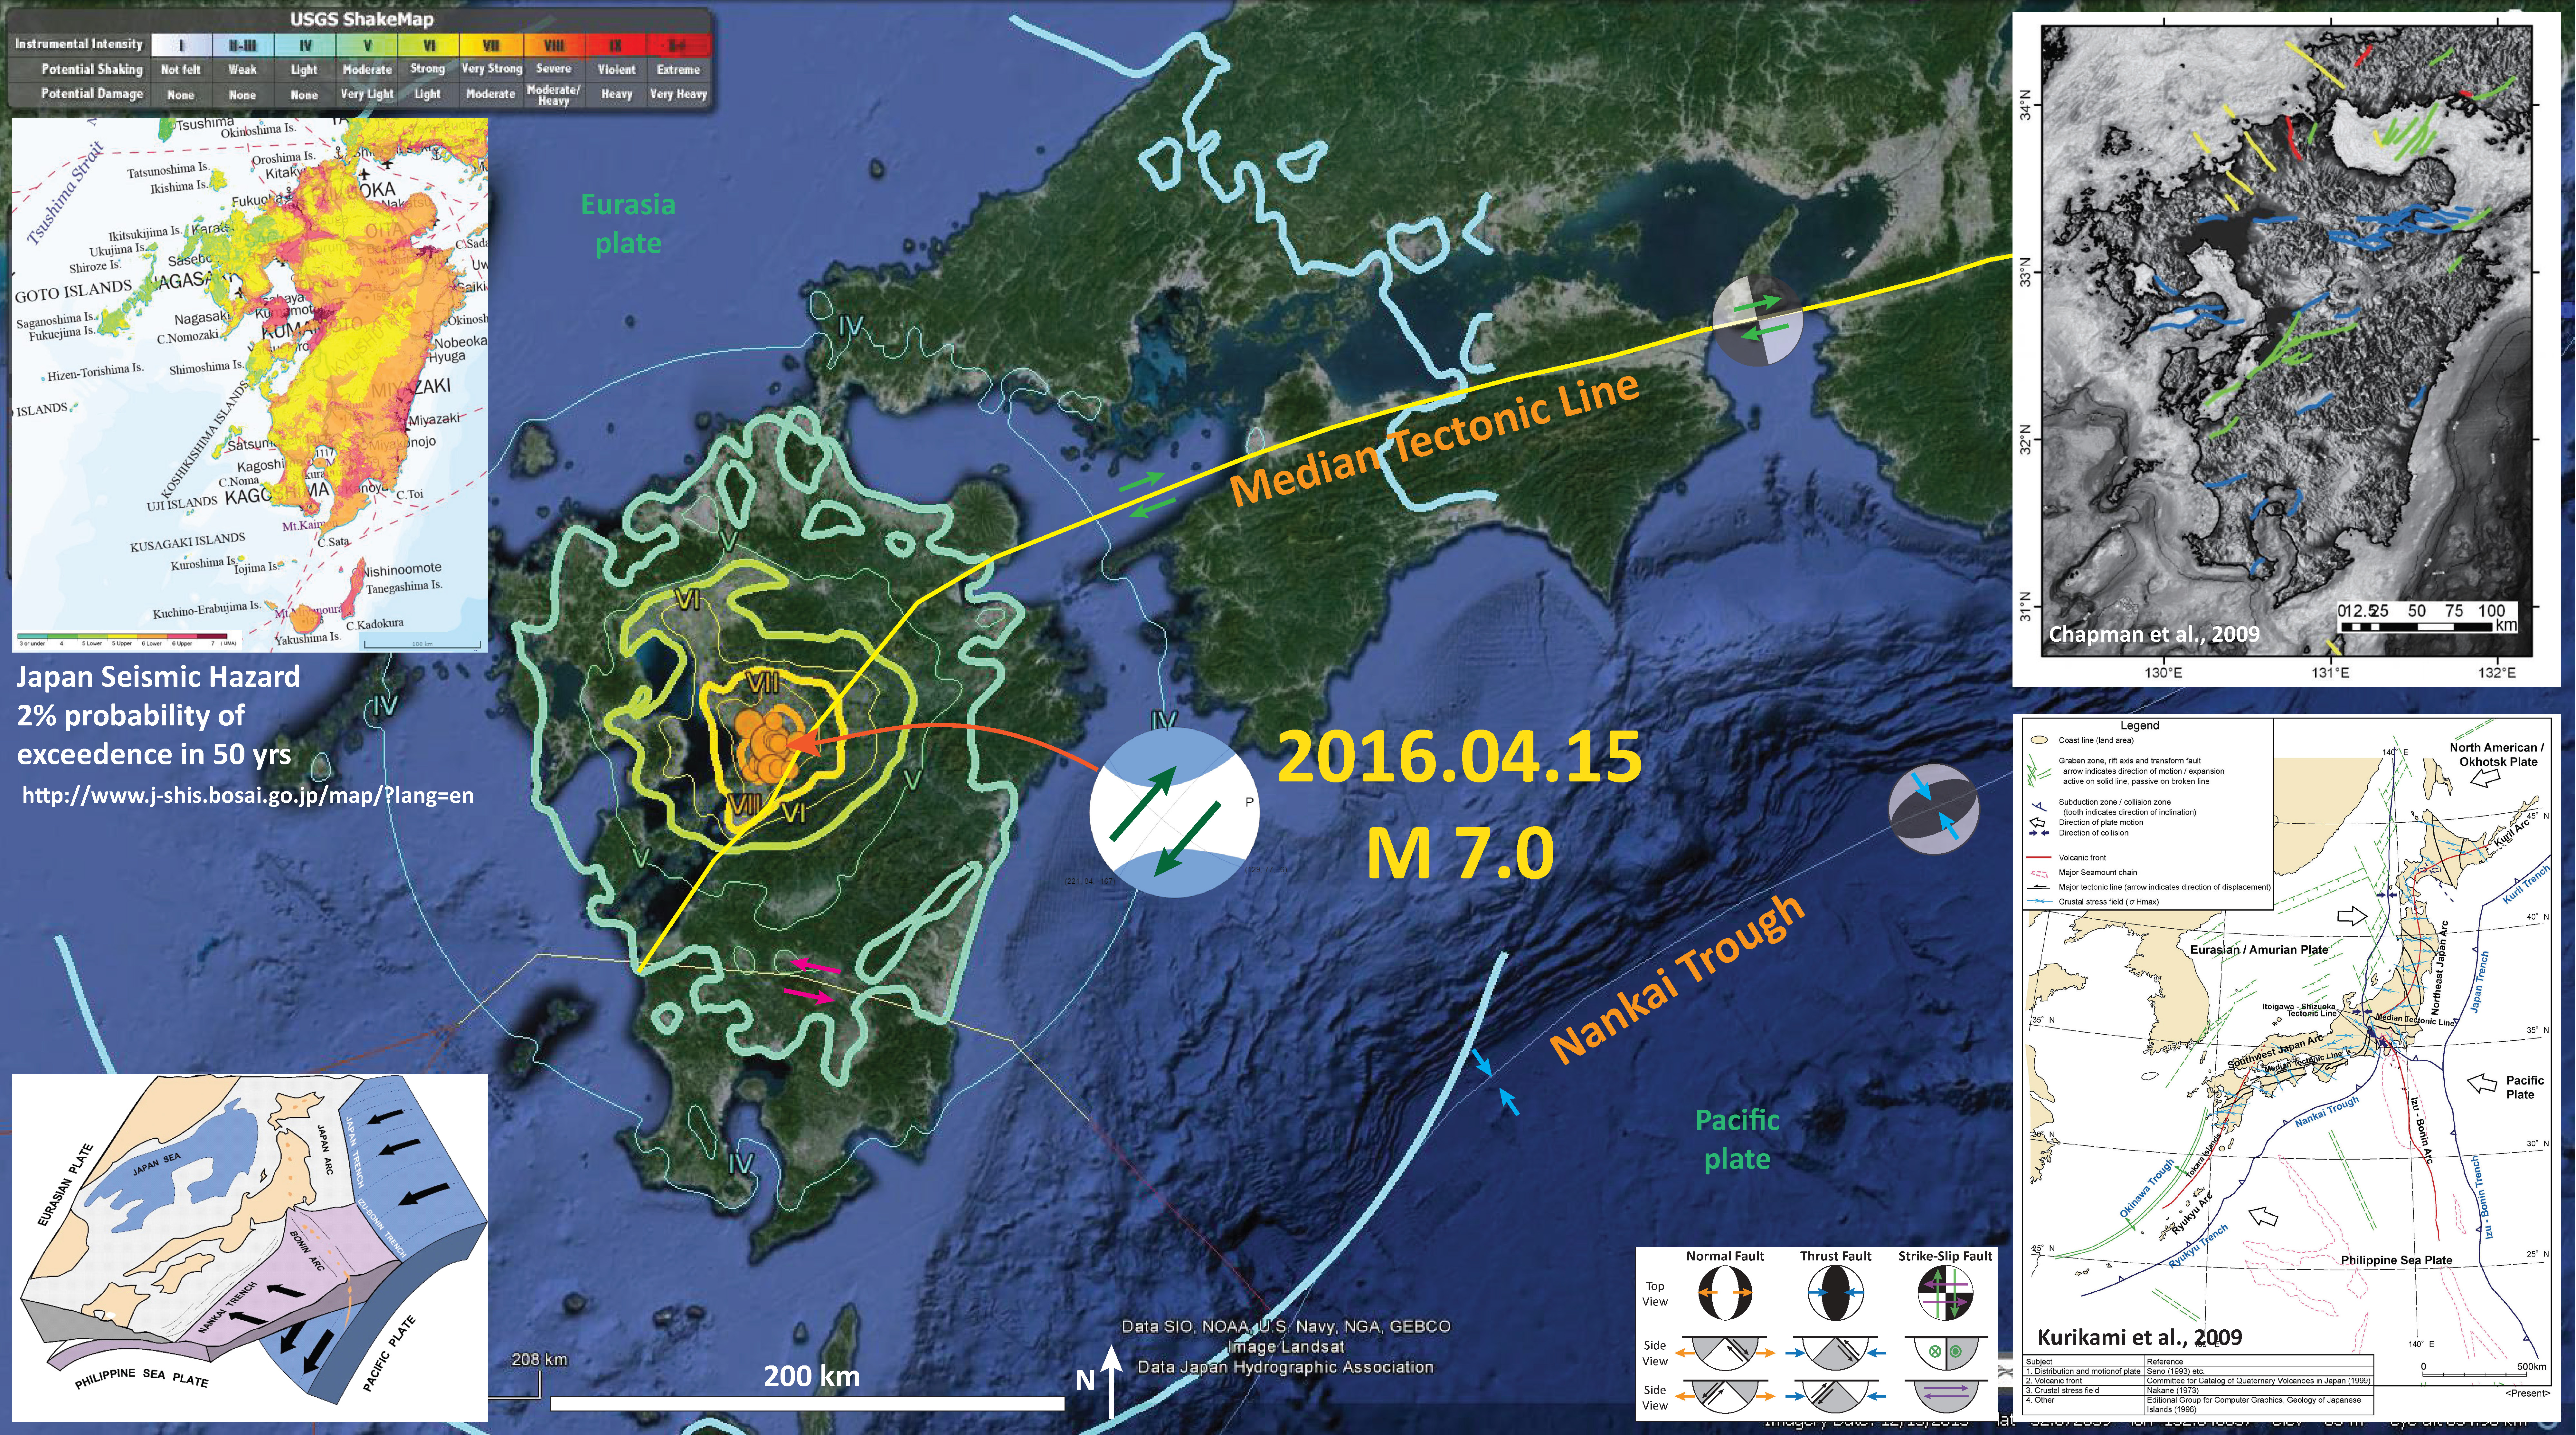
This area is near the southern terminus of the Median Tectonic Line (MTL), a large dextral strike-slip fault system. Below is a map that shows the major faults in Japan.
- Here is the figure showing the tectonic setting (Kurikami et al., 2009). I include their figure caption as a blockquote.

Current tectonic situation of Japan and key tectonic features.
Jascha Polet, Seismologist at Cal Poly Pomona, posted this map that shows the aftershocks from the past 24 hours. She prepared this map from the Hi-Net Hypocenter Map tool. They clearly align with the mapped faults in the region, that are also align with the MTL.

-
Here is a map that shows the epicenters and their adjacency to mapped faults in the region. I made this map from this online site run by GAJ and AIST in Japan. Note the nearby volcano Mount Aso. These faults that ruptured trend towards this volcano! There are also reports that the volcano erupted!

-
Ross Stein and Volkan Sevilgen hypothesize that the M 6.1 earthquake loaded stress upon the fault that ruptured as the M 7.0 earthquake. This short lived increased stress caused the M 7.0 and other earthquakes. They post the figure from below on their website for this earthquake series. They run a website called Tremblor. Below is a figure that shows how slip from the M 6.2 (labeled M 6.1, with the epicenter located by a yellow star) increased stress upon faults to the northeast and to the southwest of the epicenter.

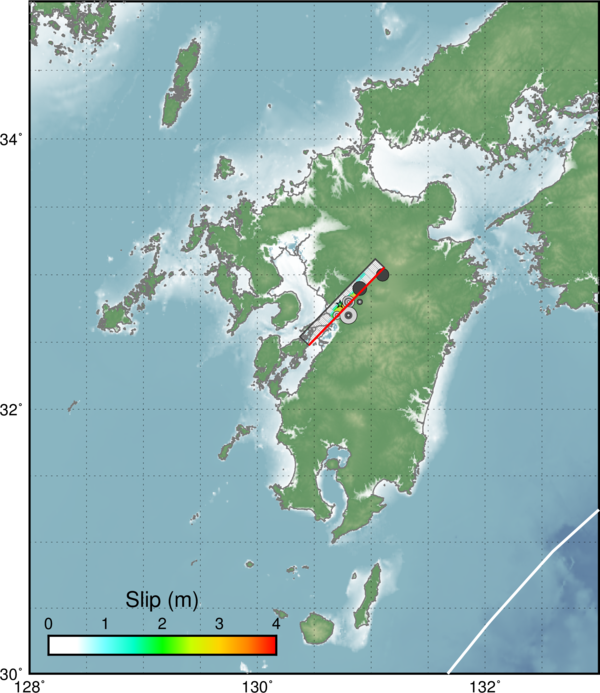
- The USGS constructed an earthquake slip model. Below is a plot of this slip model in relation to the region.
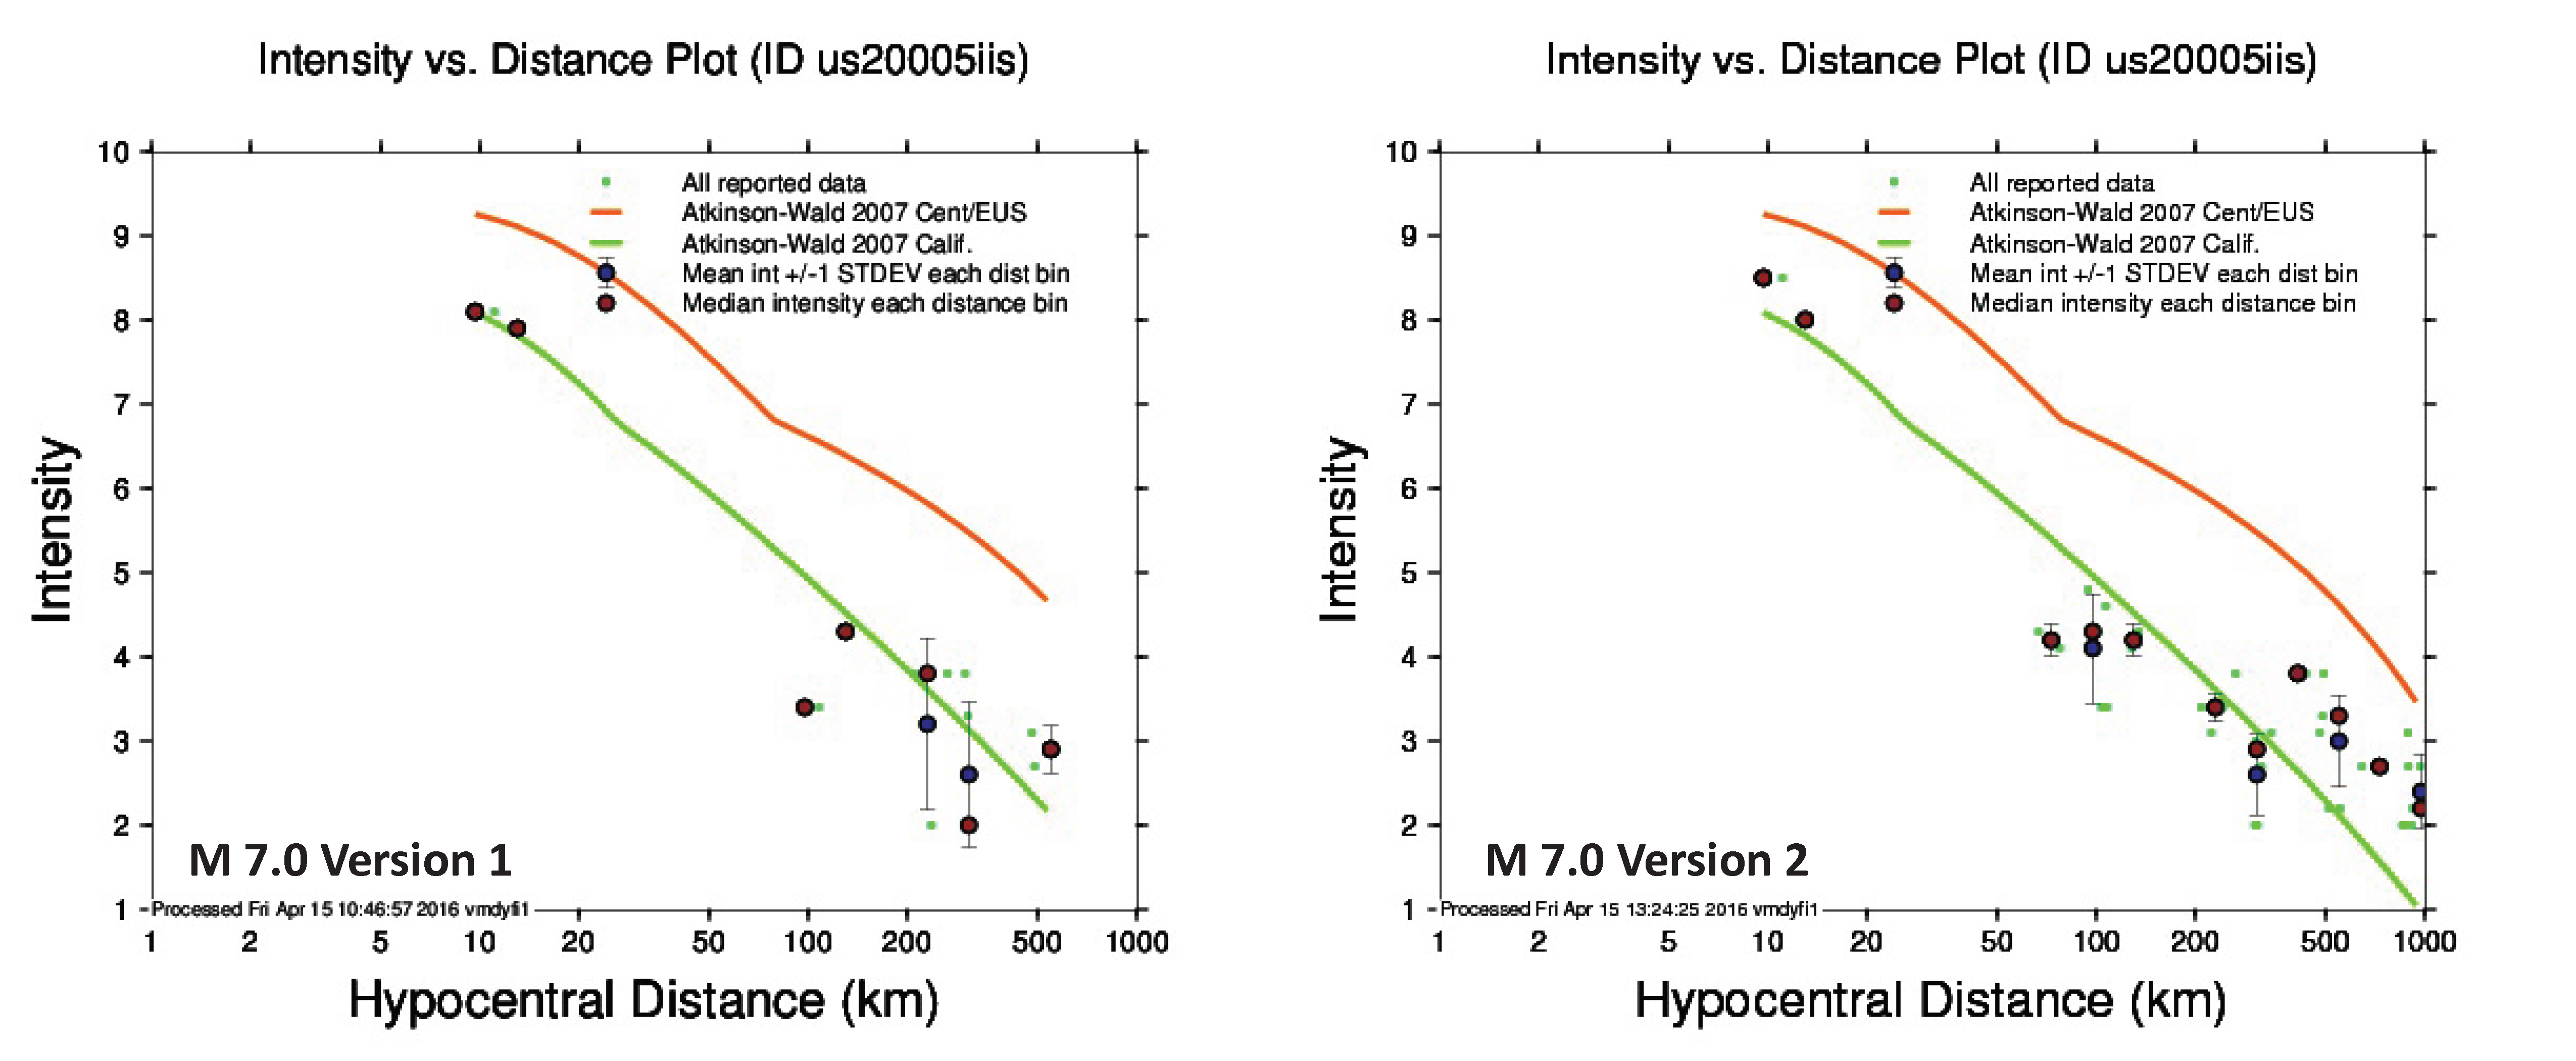
- Shakemap: Once the USGS constructed a slip model for this earthquake, they ran a new ground motion model with this fault slip model as a source of ground motions. Below is a comparison between these two shakemaps.
- PAGER Report: With these new estimates of ground shaking, the USGS then makes a new estimate of damage to people and their belongings. Below is a comparison of these two PAGER alert pages.
- These plots show two things, both relating how ground motions (shaking intensity) attenuate with distance (energy gets absorbed by the Earth). The two colored lines represent the empirical model outputs that drive the shakemap and PAGER models. These empirical models are called Ground Motion Prediction Equations (GMPE). The green line assumes an Earth like that in California (accreted terranes, low seismic Q). The orange line assumes an earth line the central and eastern USA (craton/stable continent, higher seismic Q). The green dots are data from reported observations and the blue dots show the mean and standard deviation of the ground motions for a series of binned distances. The models than produce the green and orange lines are based on seismological measurements from thousands of earthquakes. Note how the observations match the California GMPE plot.
Changes


- Here is a video from the Wall Street Journal.
- Here is a news report from Japan. NHK is the public broadcasting organization in Japan.
- Chapman et al., 2009. Development of Methodologies for the Identification of Volcanic and Tectonic Hazards to Potential HLW Repository Sites in Japan –The Kyushu Case Study-, NUMO-TR-09-02, NOv. 2009, 192 pp.
- Kurikami et al., 2009. Study on strategy and methodology for repository concept development for the Japanese geological disposal project, NUMO-TR-09-04, Sept. 20-09, 101 pp.
- Rhea, S., Tarr, A.C., Hayes, G., Villaseñor, A., and Benz, H.M., 2010. Seismicity of the earth 1900–2007, Japan and vicinity: U.S. Geological Survey Open-File Report 2010–1083-D, scale 1:6,000,000.
-
References:
1 thought on “Earthquake Report: Japan Update #2”