In the last ~24 hours, we have had a few earthquakes in northeastern Papua New Guinea, all in the M 5 range.
-
Here are the USGS web sites for these earthquakes:
- 2015.09.11 M 5.5
- 2015.09.11 M 5.3
- 2015.09.12 M 5.0
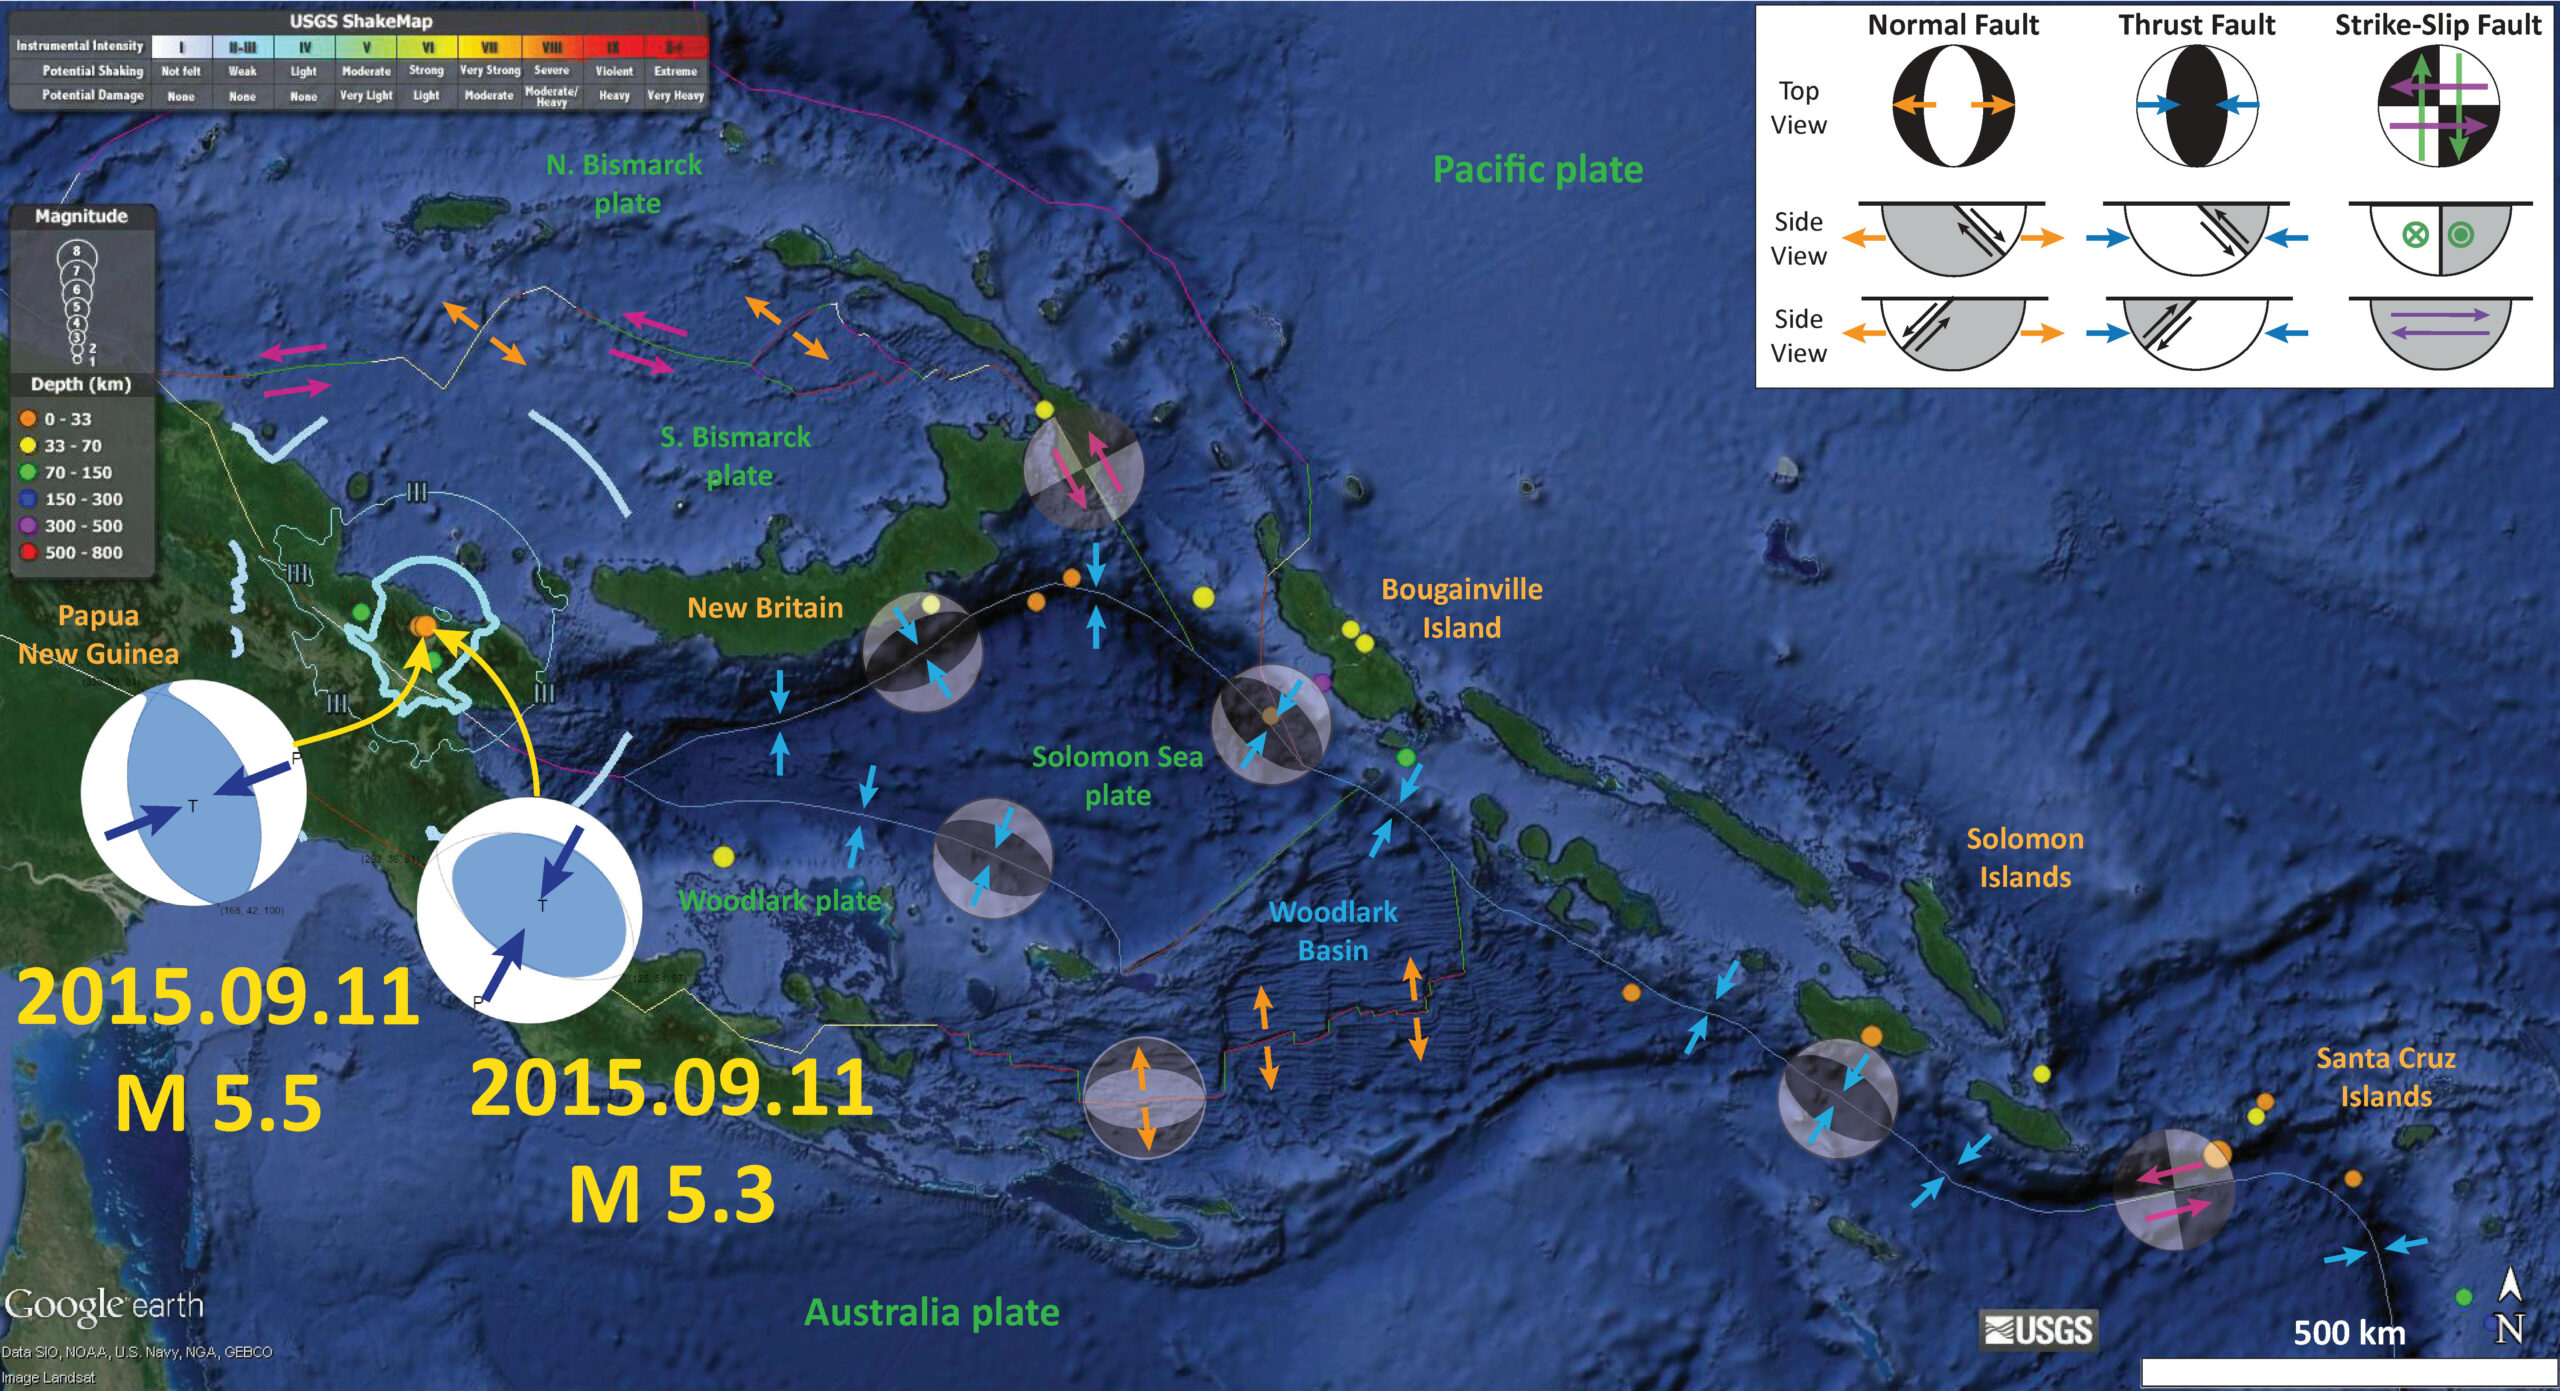
Here is a map that shows these three earthquakes. I have plotted the USGS moment tensors for the M 5.3 and M 5.5 earthquakes. I placed a moment tensor / focal mechanism legend in the upper right corner of the map. There is more material from the USGS web sites about moment tensors and focal mechanisms (the beach ball symbols). Both moment tensors and focal mechanisms are solutions to seismologic data that reveal two possible interpretations for fault orientation and sense of motion. One must use other information, like the regional tectonics, to interpret which of the two possibilities is more likely.
These moment tensors show compression in the ~northeast direction. This is consistent with the northwest striking plate boundary fault to the southwest of these earthquakes.

Here is a generalized tectonic map from Hamilton (1979), posted on the Oregon State University website.

Here is a more detailed geologic and seismicity map from Baldwin et al. (2012). These M ~5 earthquakes are plotted near the Ramu-Markham fault which is an onland extension of the New Britain trench (south verging subduction zone plate boundary), a plate boundary fault system separating volcanic arc / ophiolite rocks on the north from the New Guinea Mobile Belt rocks to the south.

This map has some cross sections to help us interpret the complicated geology of the region (Baldwin et al., 2012). We can note that the different maps of this region all plot the plate boundaries in different places, probably because they are all using different sources of information (e.g. the GPS geodetic map below, which only uses motions of points).

The Baldwin et al. (2012) map above uses geology and GPS geodesy, but this map only has plate motions plotted (from Paul Tregoning at The Australian National University). The map plots, “linear velocities of GPS sites in PNG, showing absolute motions of the numerous tectonic plates.” Go to his website where he presents some related papers.

This is an interesting map from a Baldwin et al. (2004). This shows how the Woodlark Basin is formed by the spreading center there. This map shows the Trobriand trough meet the New Britain trench and note how they verge in opposite directions. Compare this with the oblique map and cross section above.

Here is another map (from a GSA Bulletin article) that also shows how the NBT transitions into the RMFZ.

There was a M = 7.0 earthquake in northwest Papua New Guinea in late July 2015. I report about that earthquake and it also is compressional and related to the east-west striking north-south convergence along the north side of Papua New Guinea. Below is a map showing my interpretations of that earthquake.

The New Britain trench is a very seismically active region. Below are a couple reports on the seismic activity from the past year or two.
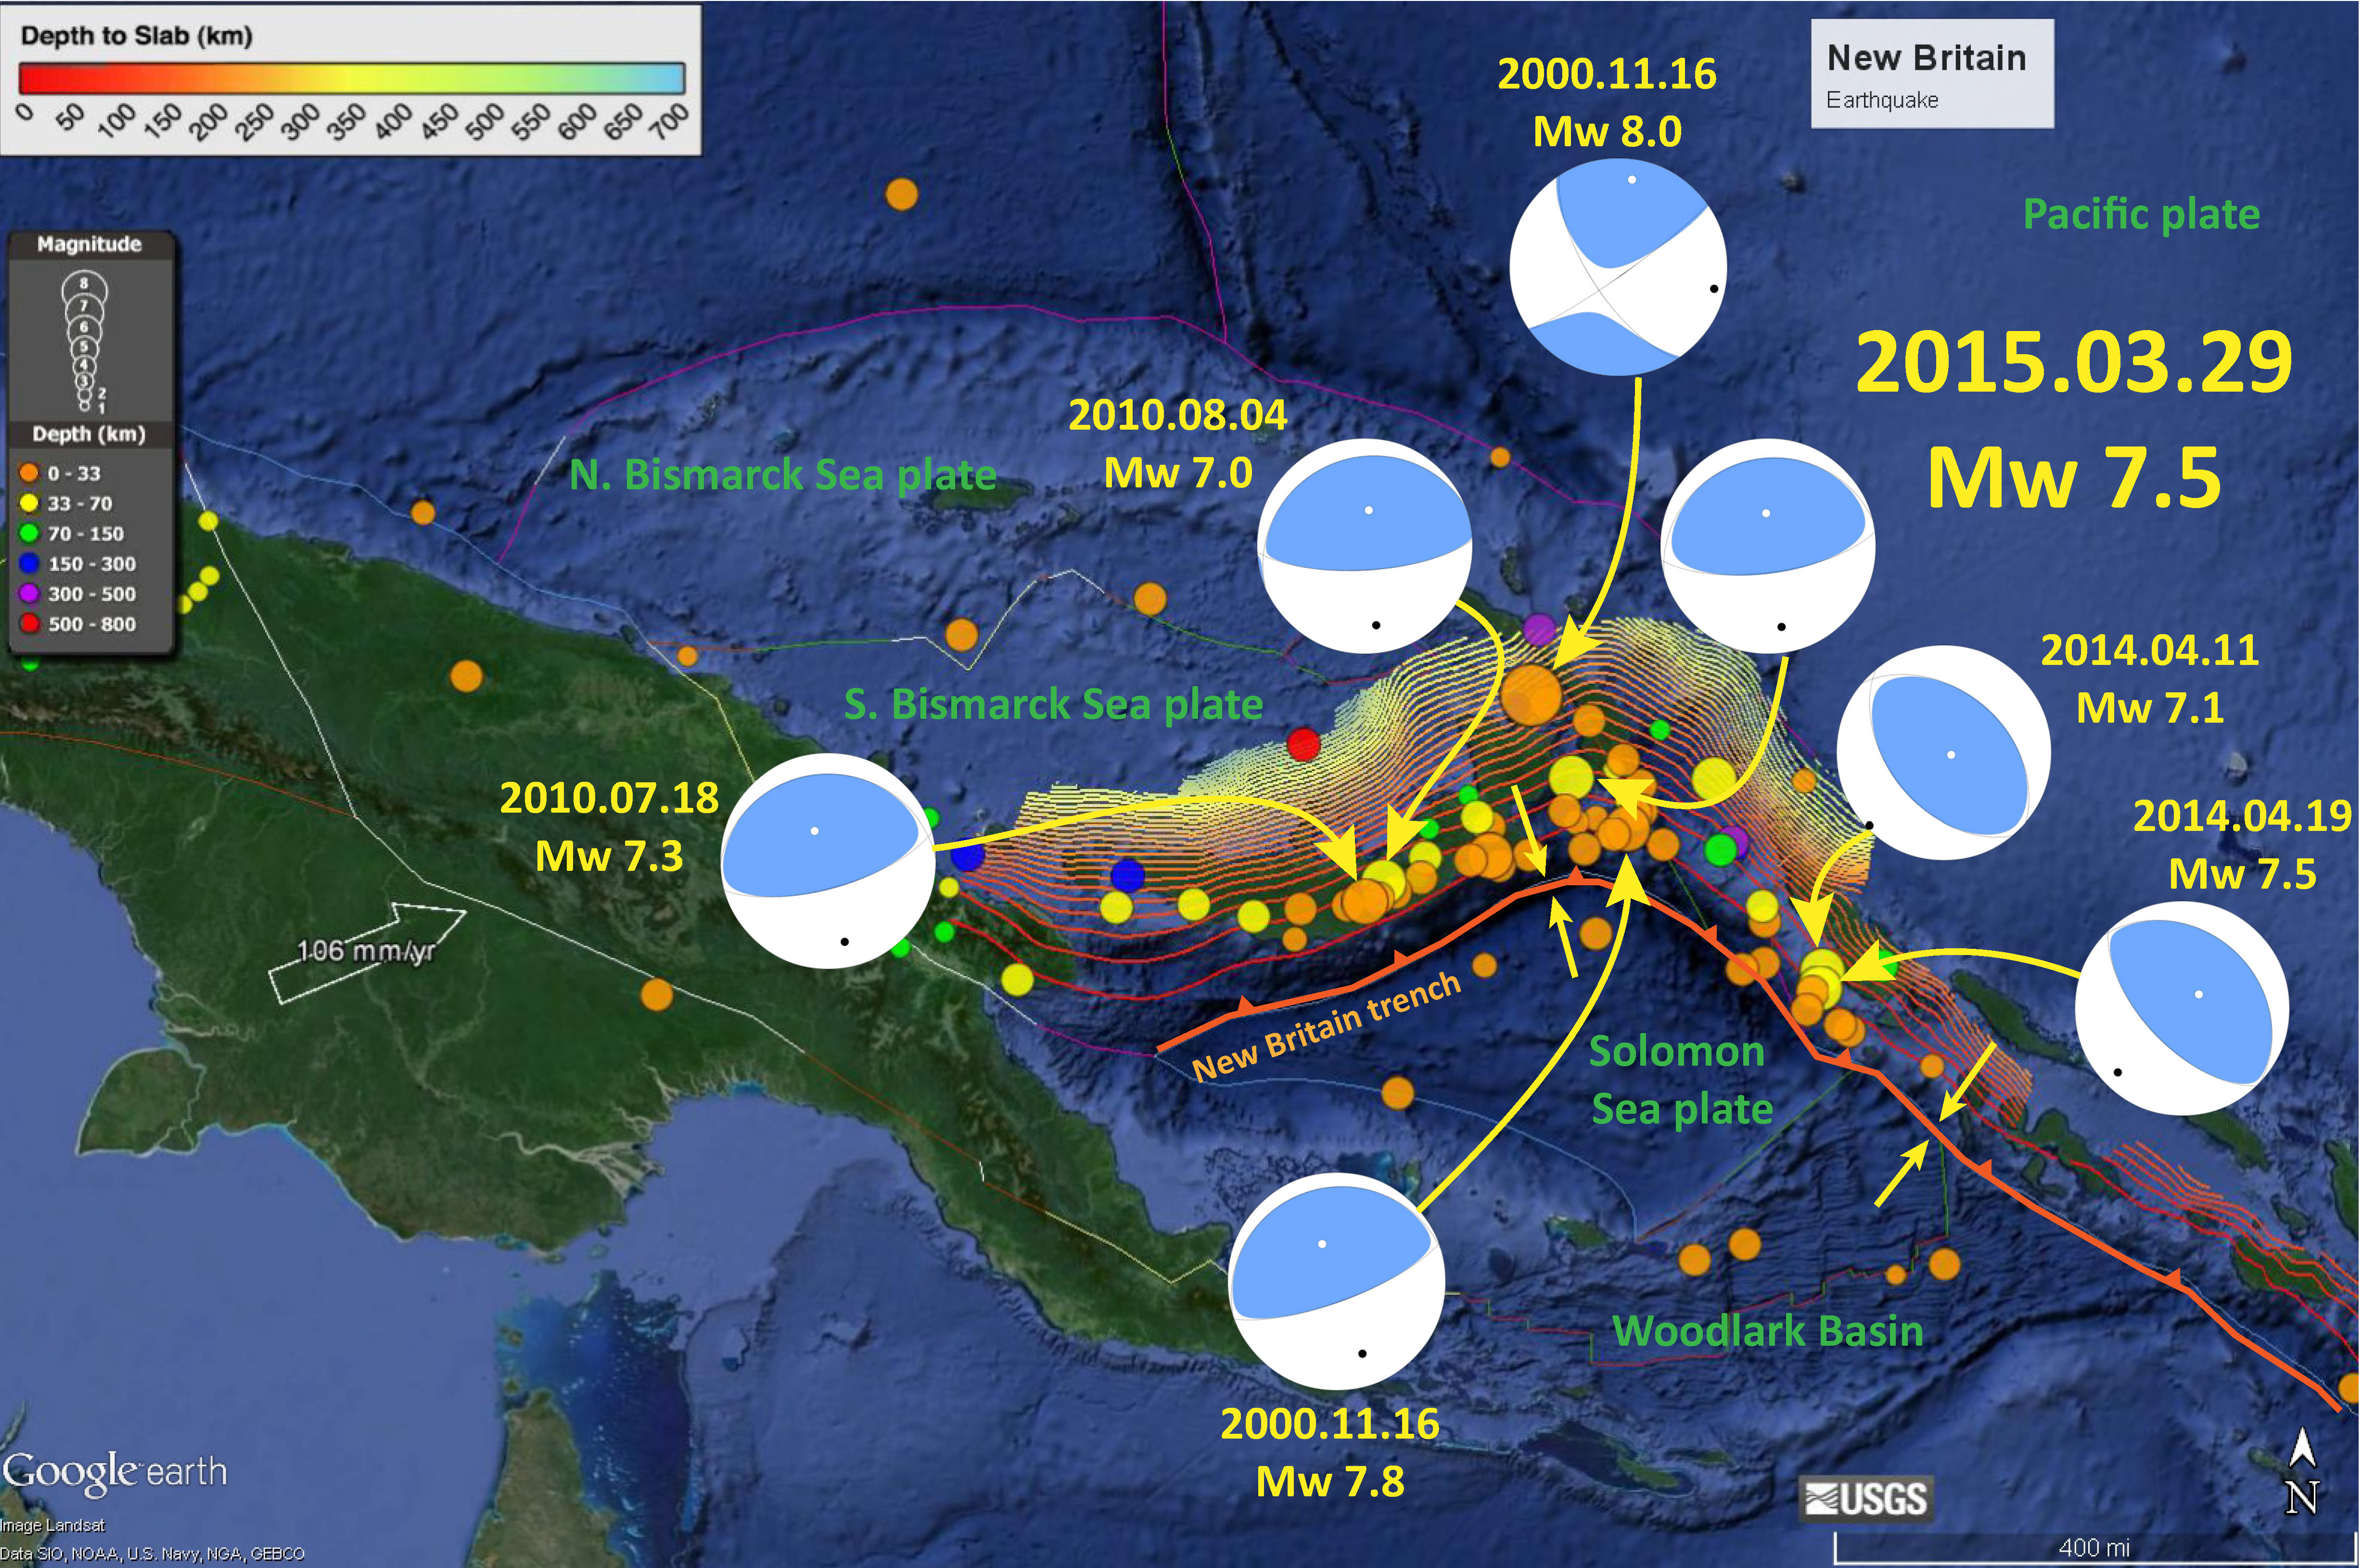
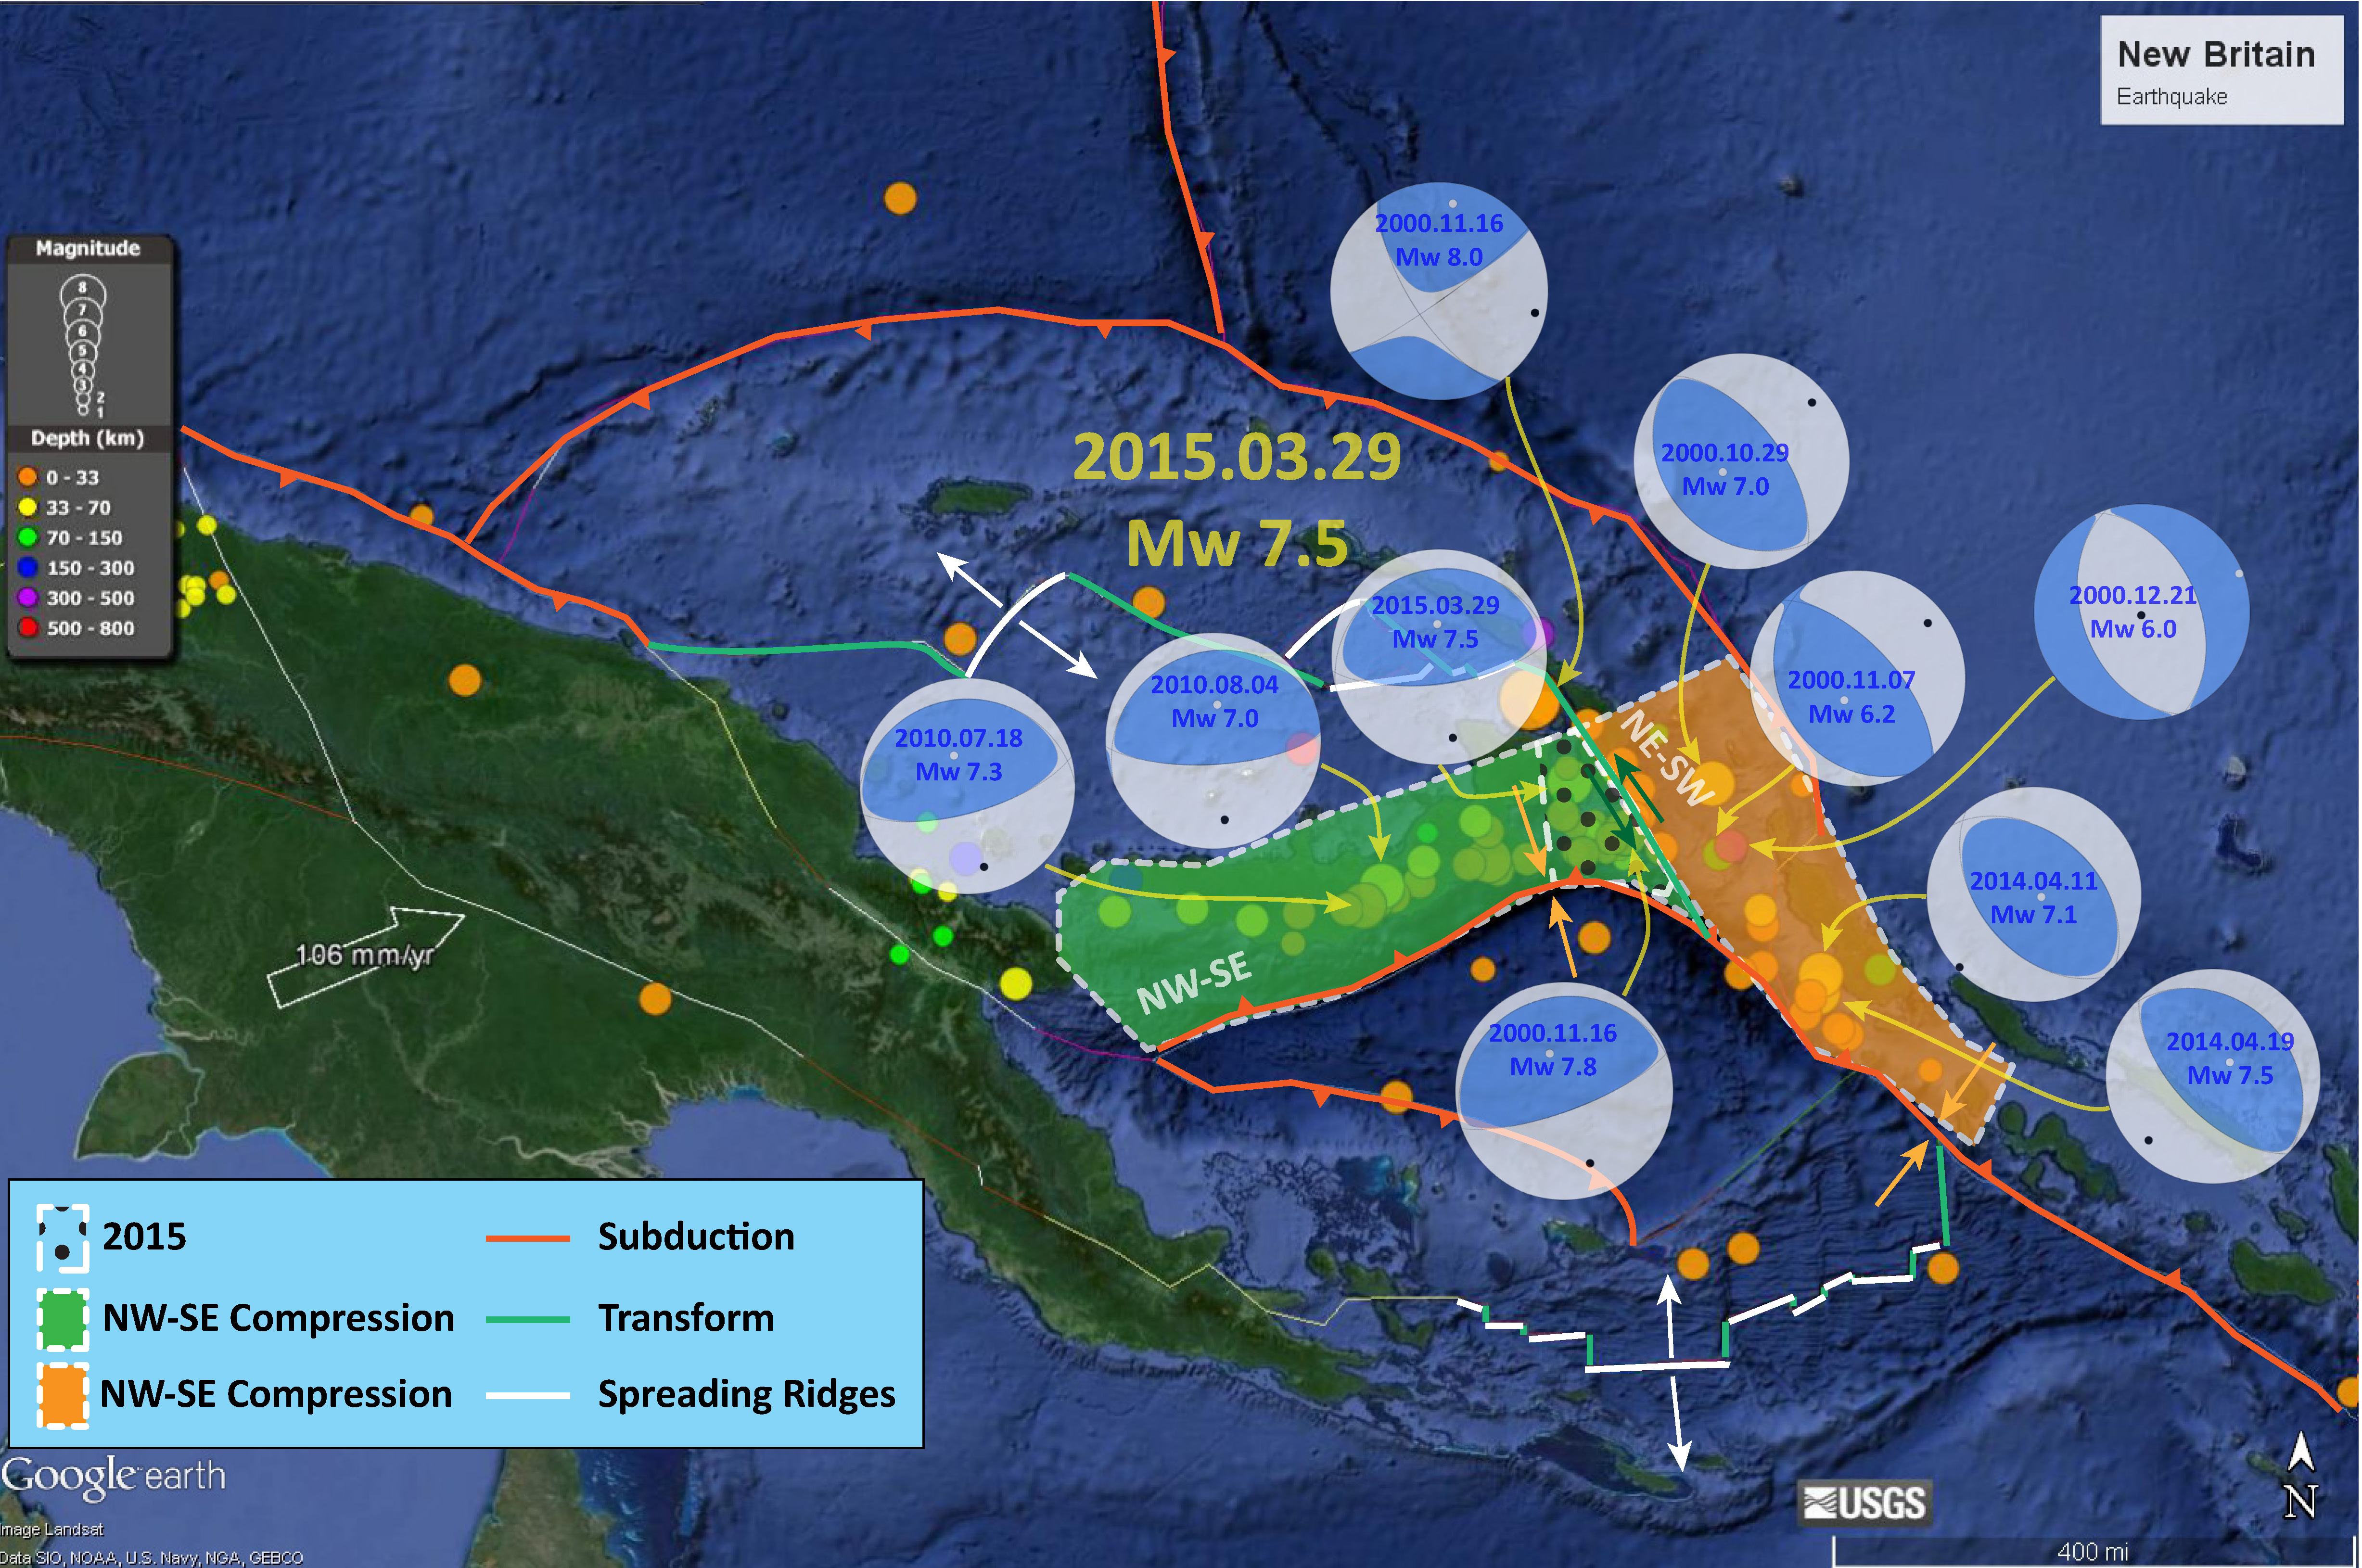
Here is a summary map showing some of the seismicity in the New Britain trench region. The first one shows the seismicity and moment tensors plotted with the slab contours from Hayes et al. (2012). The second map shows how the NBT transitions eastward to the South Solomon Sea trench. Note how the moment tensors show that the slip partitioning rotates with the strike of the subduction zone faults.
-
References:
- Baldwin, S.L., Fitzgerald, P.G., and Webb, L.E., 2012. Tectonics of the New Guinea Region, Annu. Rev. Earth Planet Sci., vol. 40, p. 495-520.
- Baldwin, S.L., Monteleone, B.D., Webb, L.E., Fitzgerald, P.G., Grove, M., and Hill, E.J., 2004. Pliocene eclogite exhumation at plate tectonic rates in eastern Papua New Guinea in Nature, v. 431, p/ 263-267, doi:10.1038/nature02846.
- Hamilton, W., 1979. Tectonics of the Indonesian region: U.S. Geological Survey Prof. Paper 1078.
- Hayes, G.P., Wald, D.J., and Johnson, R.L., 2012. Slab1.0: A three-dimensional model of global subduction zone geometries in, J. Geophys. Res., 117, B01302, doi:10.1029/2011JB008524