
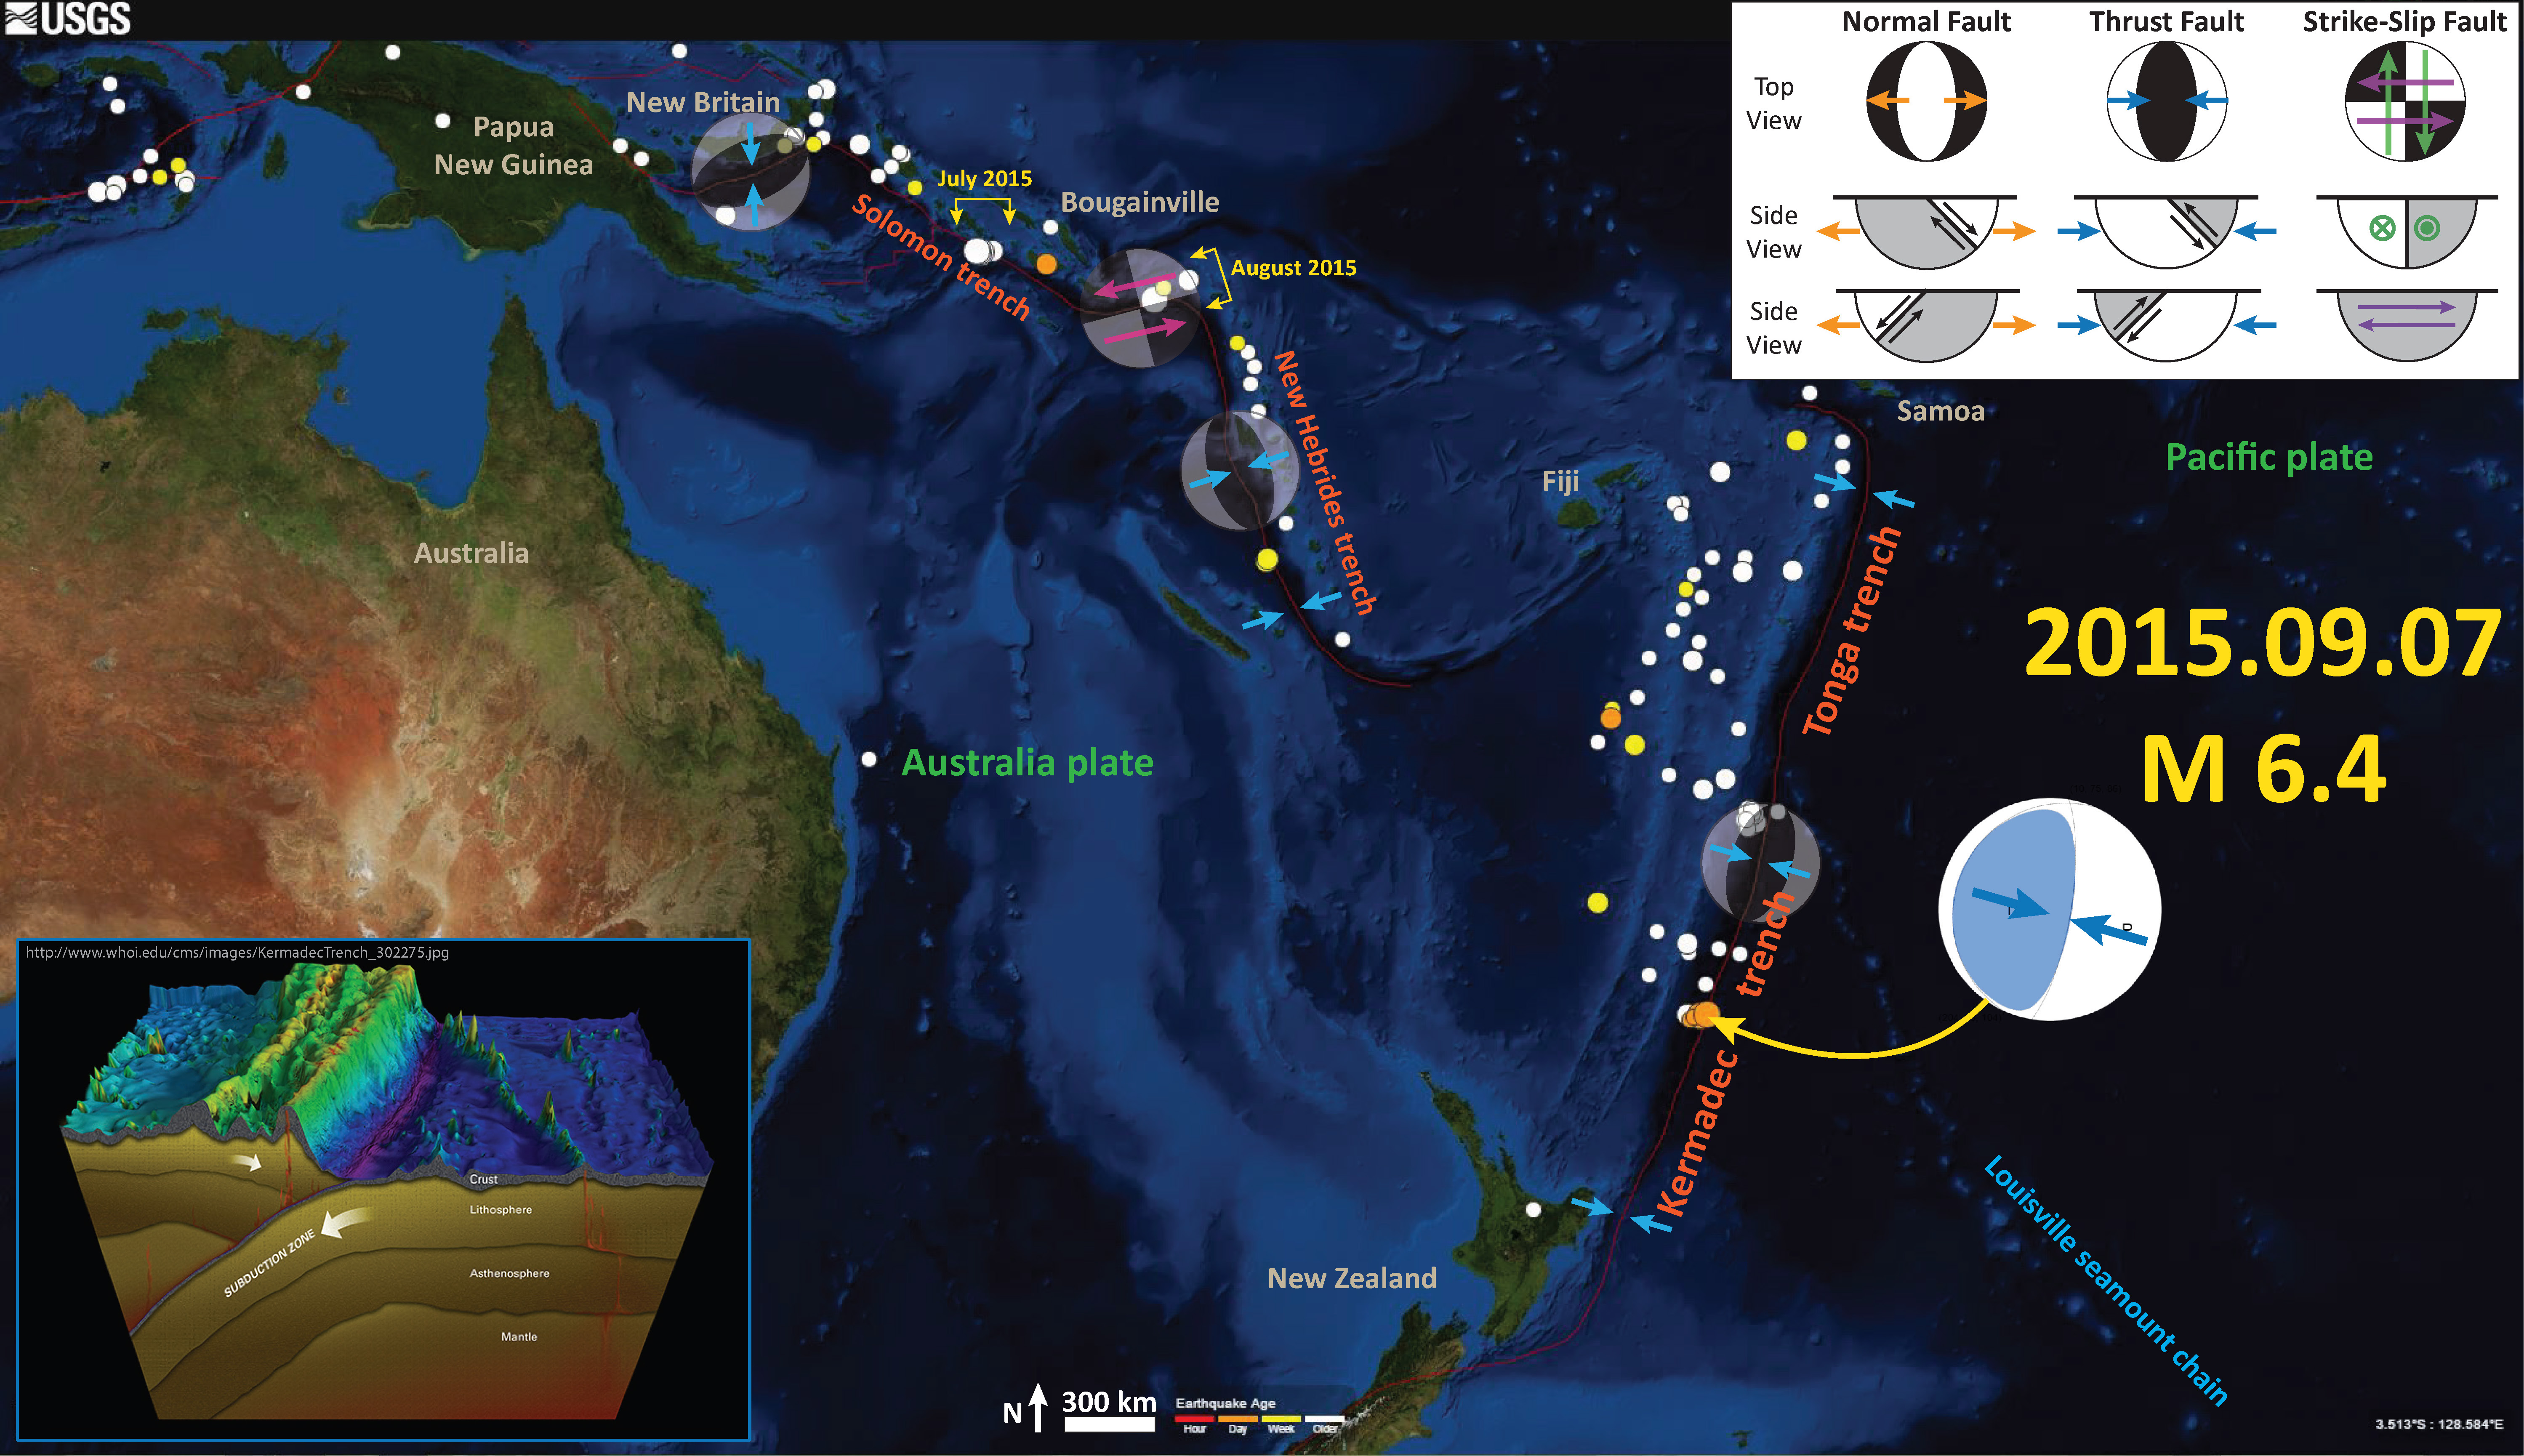
Last night there were a few earthquakes along the Kermadec trench, which is a convergent plate boundary (subduction zone) where the Pacific plate subducts westward beneath the Australia plate. Here is the USGS website for this M 6.4 earthquake. Recent seismicity in nearby regions include July / August and August 2015 along the Solomon trench and the transform plate boundary that connects the South Solomon trench with the New Hebrides trench.
Here is a map that shows the epicenters of the seismic swarm from the past day. I plot the moment tensor, which shows west-northwest compression. I placed a moment tensor / focal mechanism legend in the upper right corner of the map. There is more material from the USGS web sites about moment tensors and focal mechanisms (the beach ball symbols). Both moment tensors and focal mechanisms are solutions to seismologic data that reveal two possible interpretations for fault orientation and sense of motion. One must use other information, like the regional tectonics, to interpret which of the two possibilities is more likely.
There is also a cross section of the Kermadec trench that includes bathymetry of the region (topography of the sea floor). This graphic was created by scientists at Woods Hole.
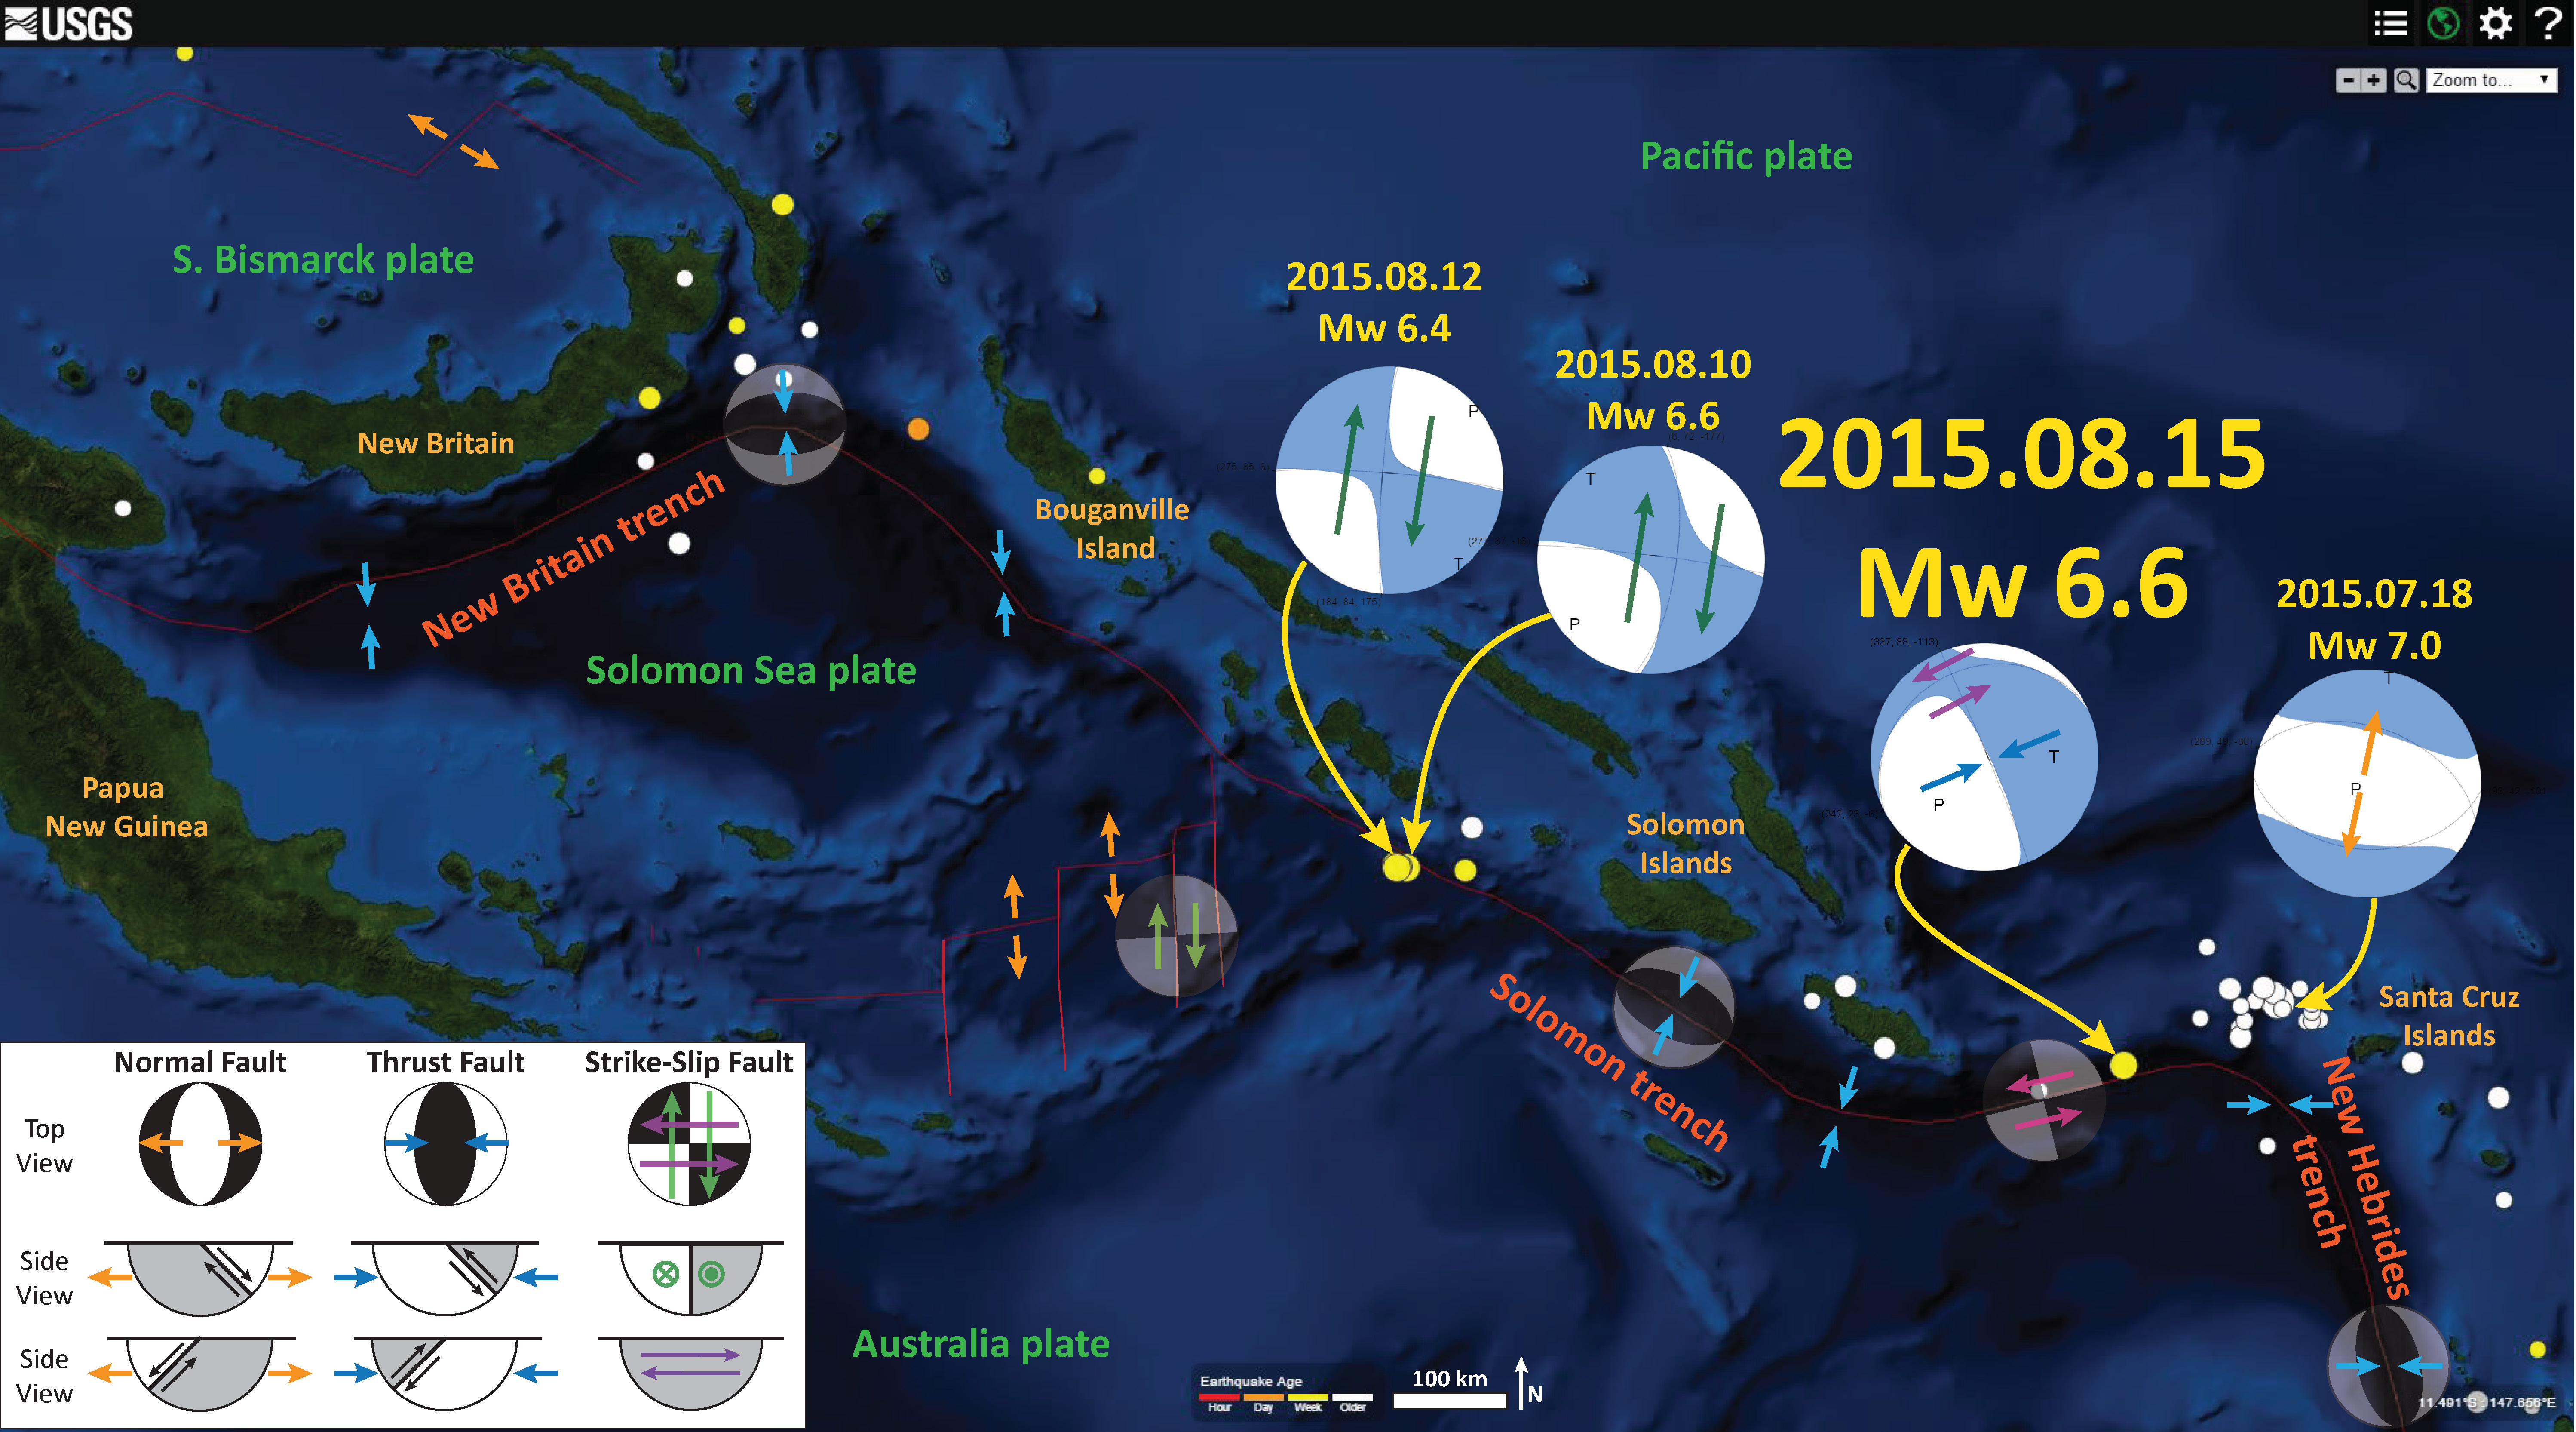
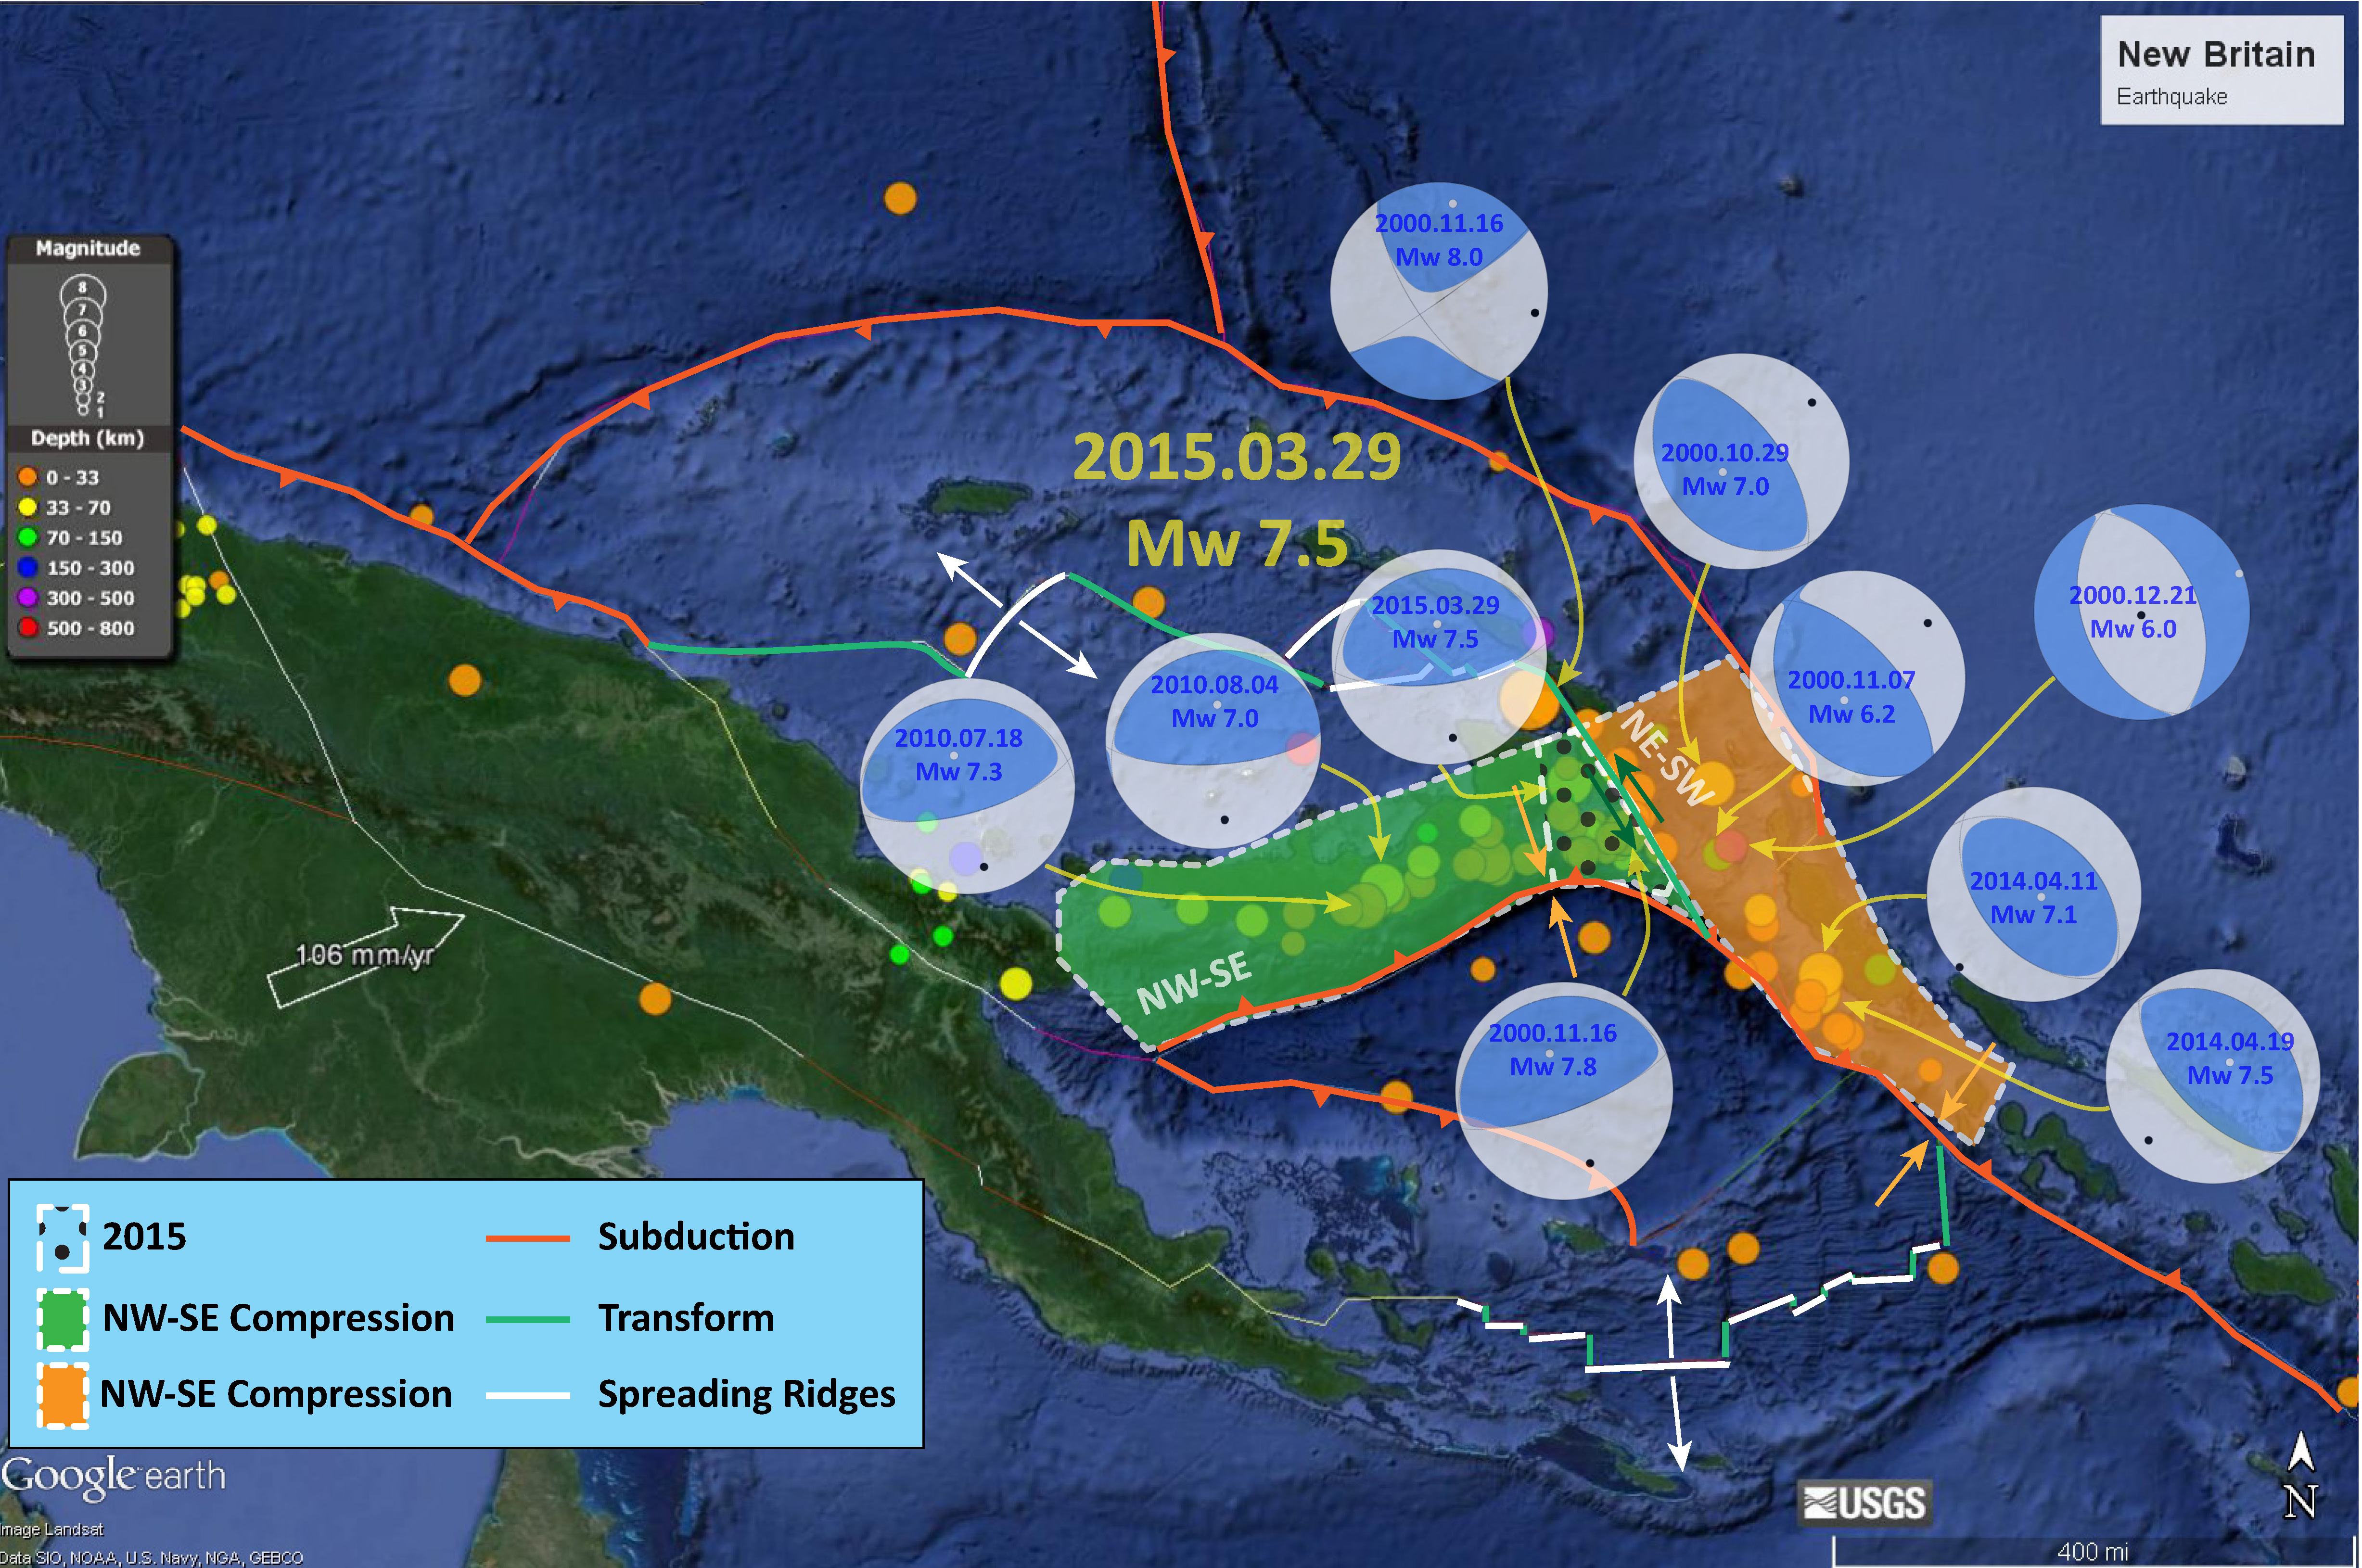
The map also shows the seismic activity along the New Britain trench. This region has been very active recently, with a M 7.5 in May 2015.
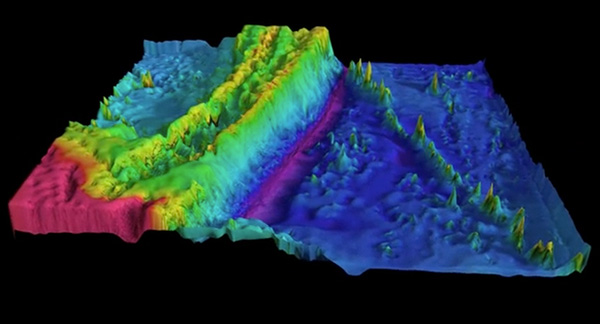
Here is another map of the bathymetry in this region of the Karmadec trench. This was produced by Jack Cook at the Woods Hole Oceanographic Institution. The Lousiville Seamount Chain is clearly visible in this graphic.
I put together an animation of seismicity from 1965 – 2015 Sept. 7. Here is a map that shows the entire seismicity for this period. I plot the slab contours for the subduction zone here. These were created by the USGS (Hayes et al., 2013).
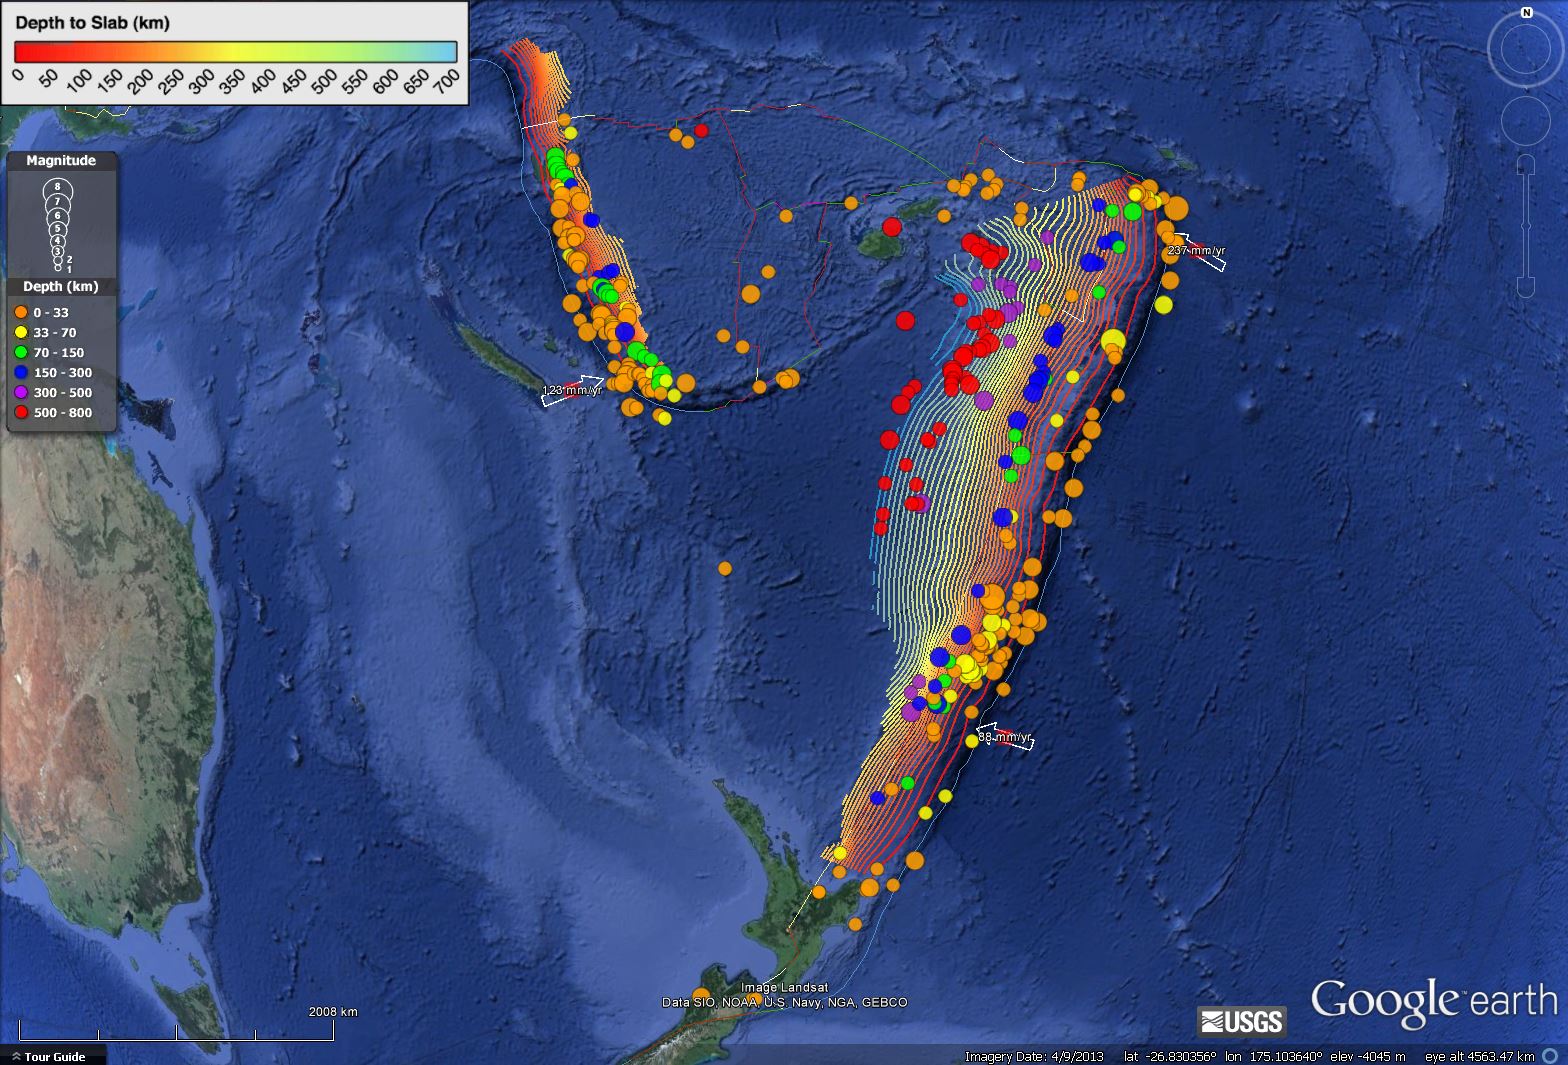
Here is the animation. Download the mp4 file here. This animation includes earthquakes with magnitudes greater than M 6.5 and this is the kml file that I used to make this animation.
Here is a map that shows the aforementioned August 2015 seismicity along the transform plate boundary.
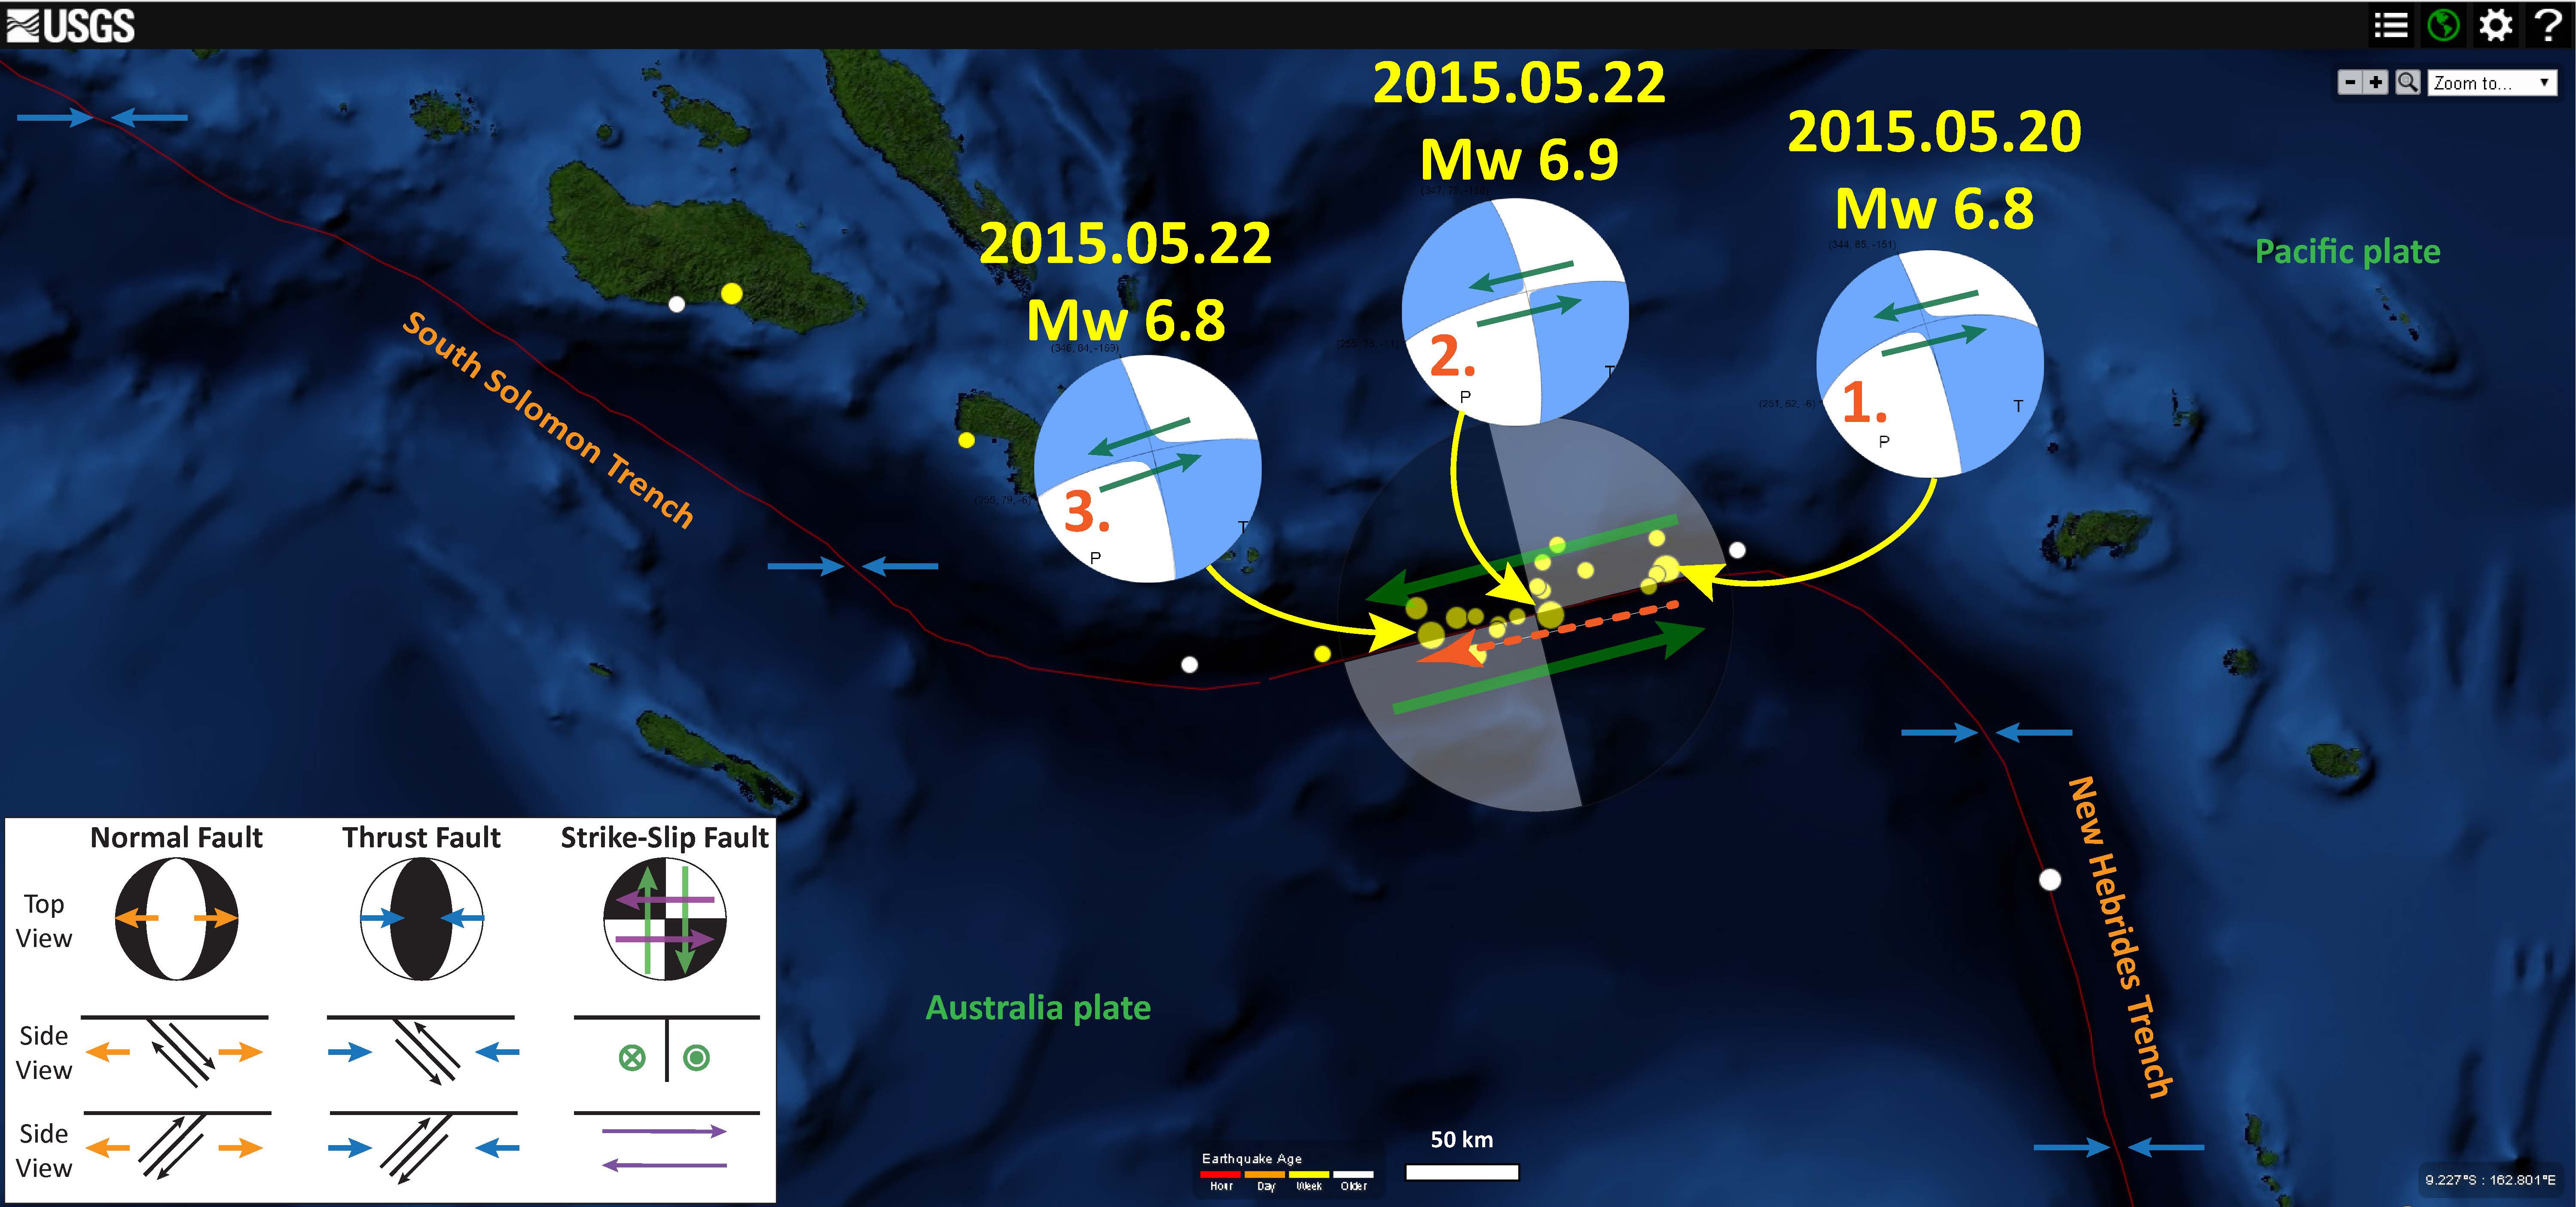
This map shows some seismicity along this transform system that happened in May of 2015.
This map shows the seismicity in the region of New Britain, Papua New Guinea, and Bougainville. I discuss the earthquakes plotted in this map here.
-
References:
- Hayes, G. P., D. J. Wald, and R. L. Johnson (2012), Slab1.0: A three-dimensional model of global subduction zone geometries, J. Geophys. Res., 117, B01302, doi:10.1029/2011JB008524
1 thought on “Kermadec trench earthquake!”