Following yesterday’s seismic swarm along the plate boundary that connects the Solomon Trench with the New Hebrides Trench, we have a M = 6.0 compressional earthquake in the Solomons. Today’s earthquake is in the region of the possibly subduction zone earthquakes from 1977 (April 20, 21) and 1984 (February 7). Given the M = 6.8 strike-slip earthquake yesterday was left-lateral (dextral), we would expect that this would increase stress upon the subduction zone fault (and synthetic faults) along the southern Solomon Trench. Here is my post about the M = 6.8 strike-slip earthquake.
UPDATE 4:45 PM PST: Magnitude has been updated to M = 5.7. Also, it is pretty shallow at 5.0 km! It is possible that the seismometer coverage is not very good, which could contribute to a poorly resolved hypocentral depth.
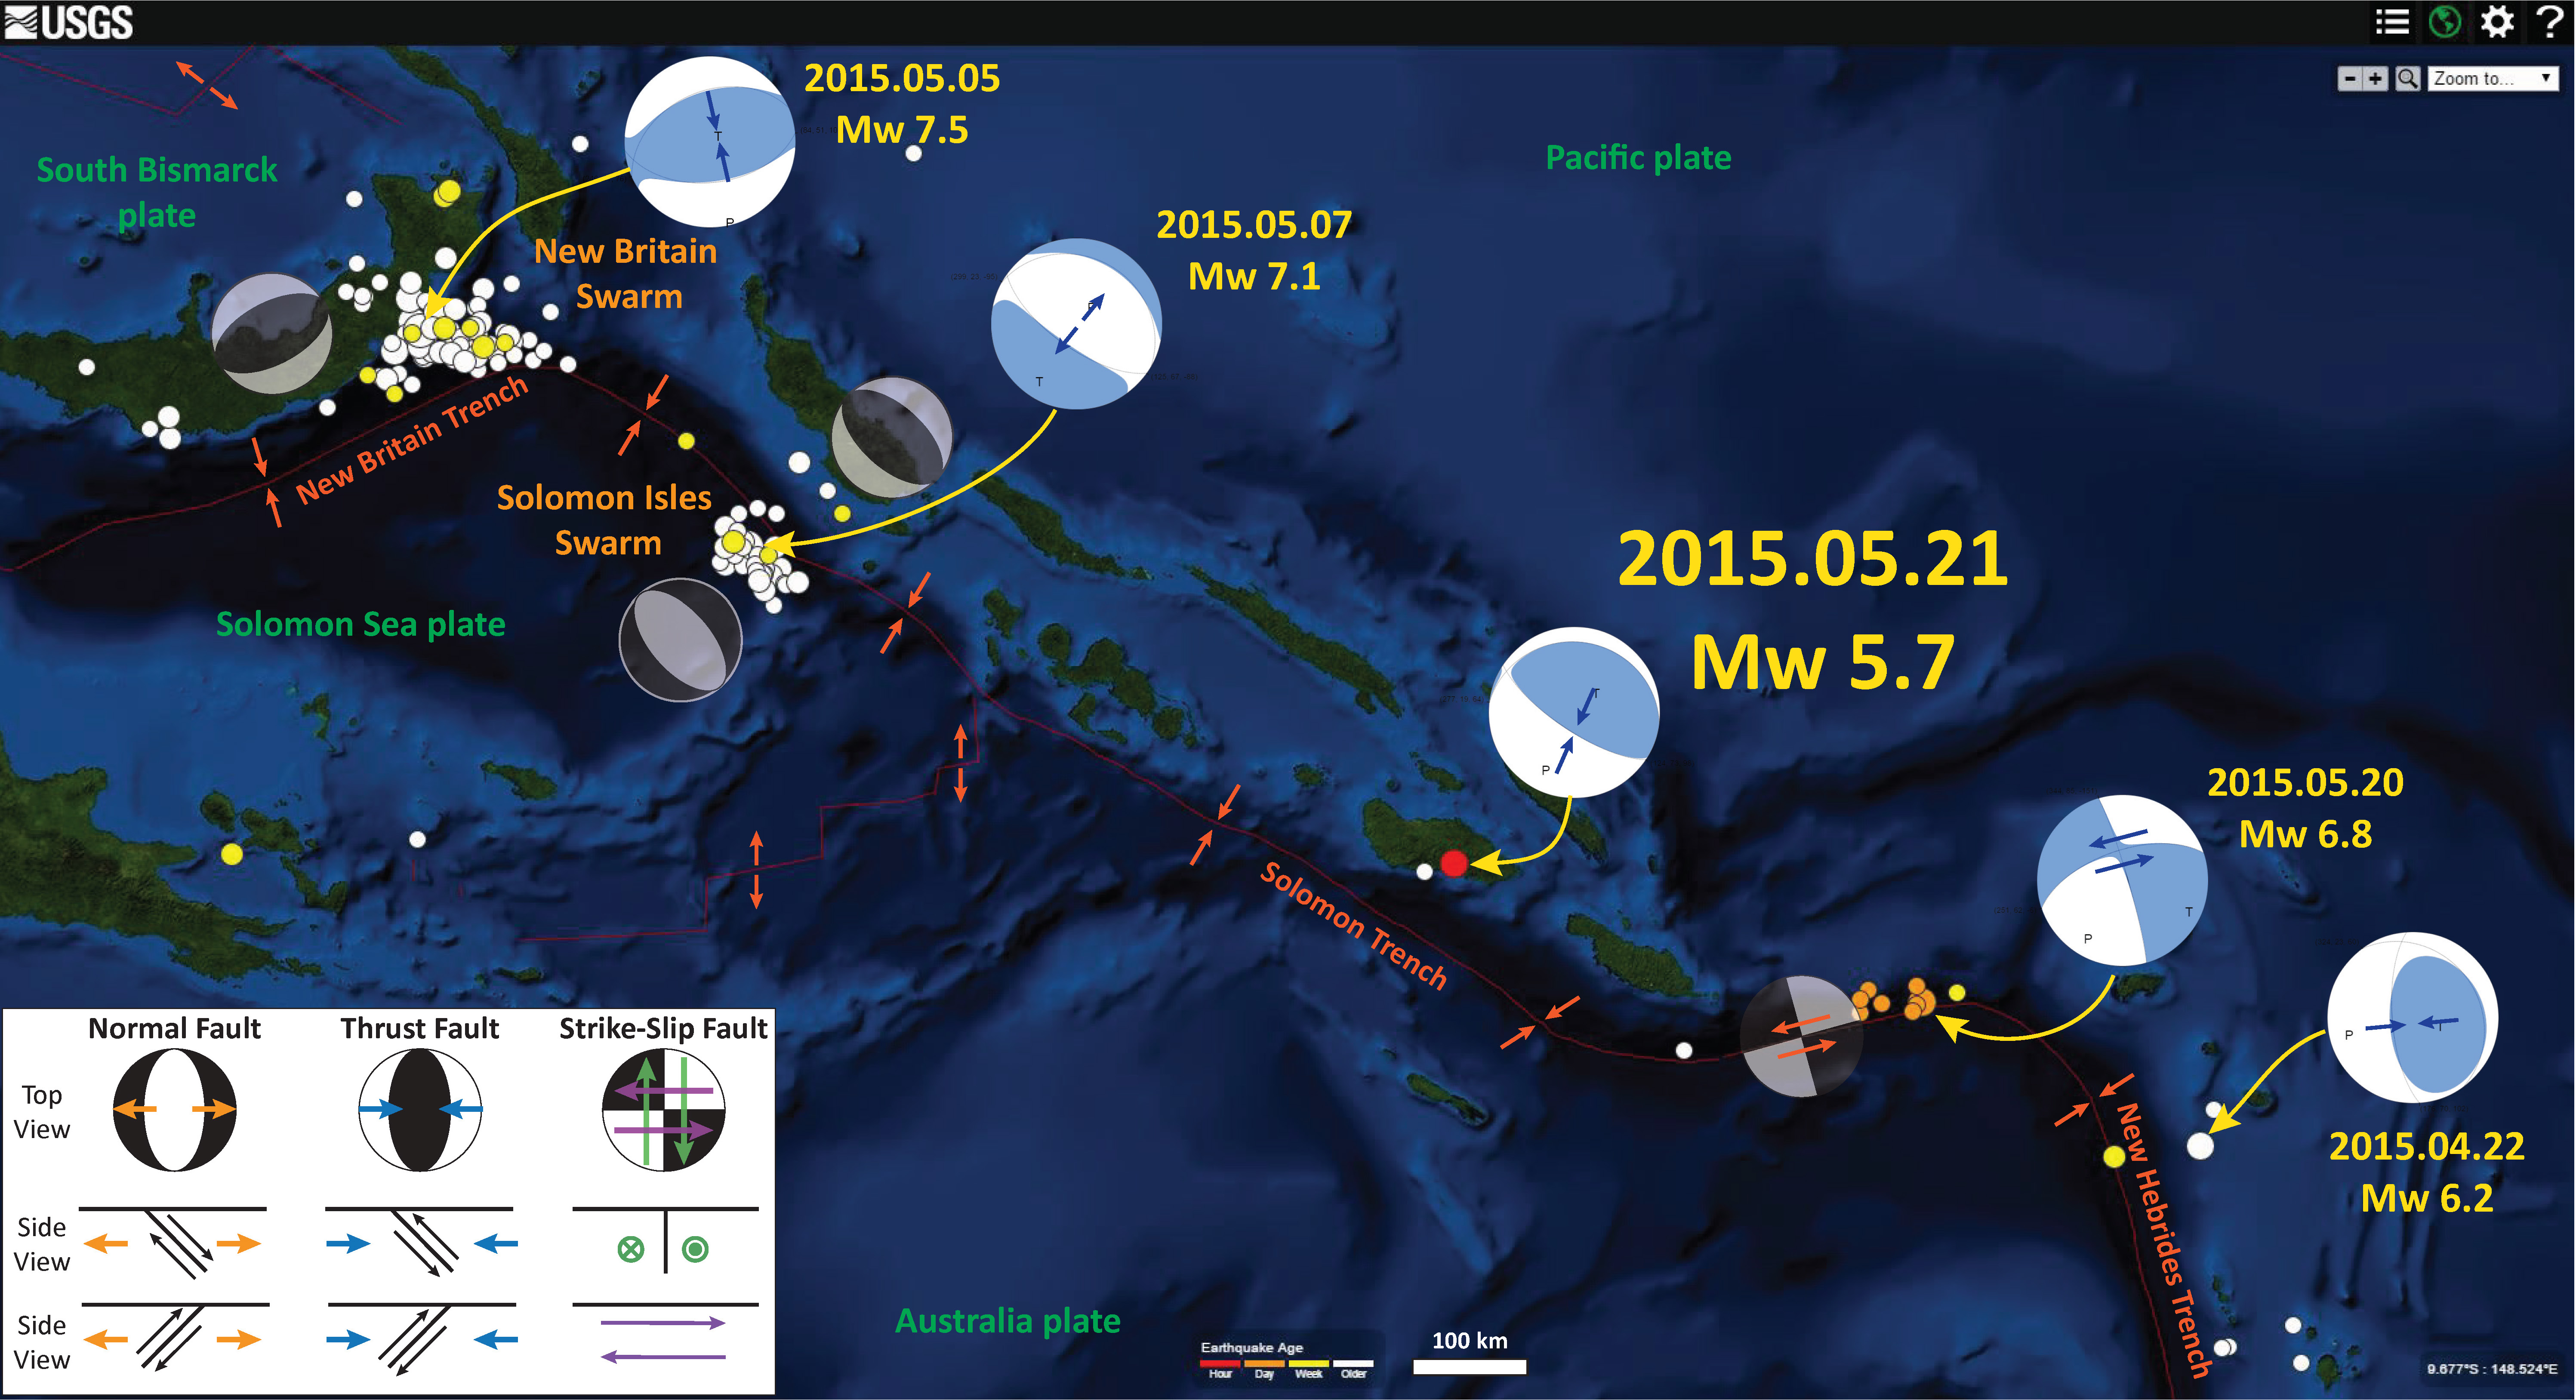
I have also plotted the epicenters of the New Britain Swarm (mainshock 2015.05.05 M = 7.5) and the Solomon Isles Swarm (mainshock 2015.05.07 M = 7.1). I include generic focal mechanism diagrams for these regions. Note how the New Britain swarm is along the subduction zone, so is in compressional strain, while the Solomon Isles swarm is in the Solomon Sea plate and in extensional strain.
I plot the moment tensors for some of these earthquakes. These moment tensor plots are a graphical depiction of a physical/mathematical based solution regarding the forces released during an earthquake based upon seismologic observations. Focal Mechanisms are also a representation of these stress releases, but are calculated differently. Both moment tensors and focal mechanisms are plotted with the same convention: black quadrants represent compression and the white quadrants represent tension. I include a legend that shows how moment tensors and focal mechanisms represent thrust-reverse/compressional, normal/extensional, and strike-slip/shear faults. Find out more about focal mechanisms at the USGS website here and find out more about moment tensors at the USGS website here.
In 2014 there was a strike-slip earthquake about 120 nautical miles to the west of the 2015.05.20 M = 6.8 earthquake. Here is my post about that earthquake. Here is a map showing the Modified Mercalli Intensity contours for the M 7.6 earthquake, as well as MMI contours for a swarm with a mainshock with a magnitude of M = 7.1 which is located to the northwest (Solomon Islands). Note how the M 7.1 earthquake swarm is east of the swarm that I label as the Solomon Isles Swarm (also with a mainshock earthquake of magnitude M = 7.1). The Solomon Isles swarm earthquakes have extensional moment tensor solutions, while the M 7.1 earthquake was compressional. These swarms are probably related! I discuss these earlier earthquakes more in this post.
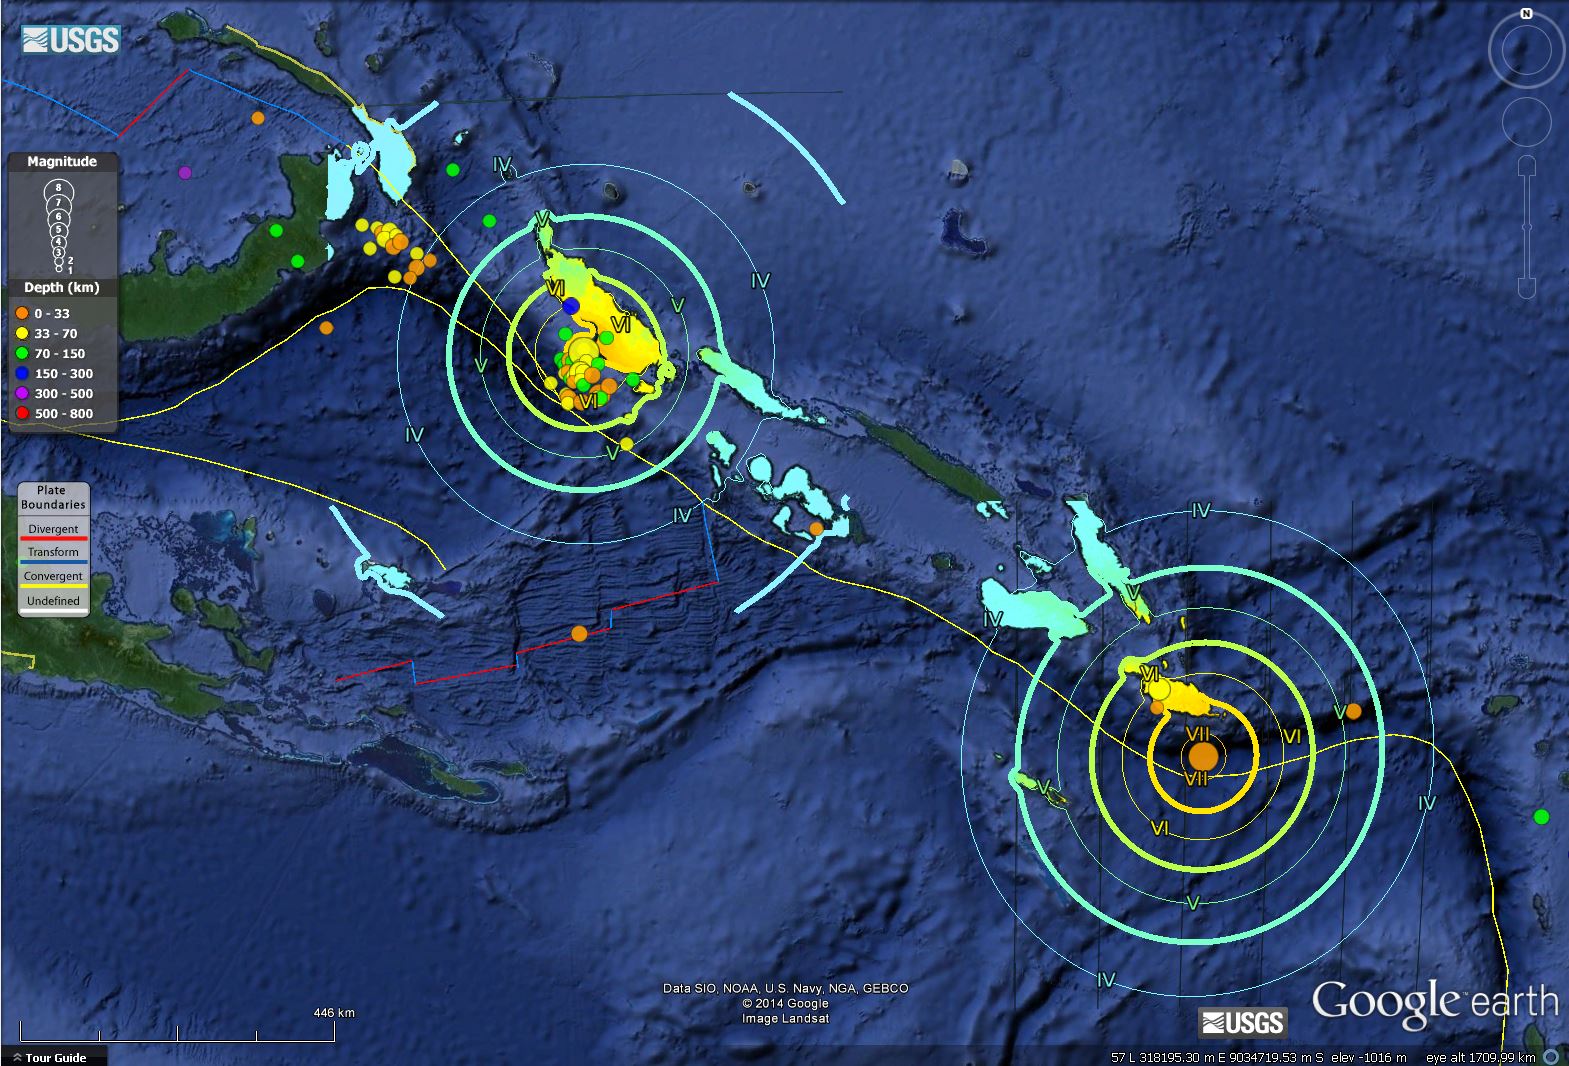
Here is a map showing the slab contours (Hayes et al., 2012), which are contours that represent the depth to the subduction zone fault. These are mostly based upon seismicity. The depths of the earthquakes have considerable error and do not all occur along the subduction zone faults, so these slab contours are simply the best estimate for the location of the fault. Historical seismicity of earthquakes that are magnitude greater or equal to M = 7.0 are plotted as grey circles. More on the historic seismicity of this region is found on a summary poster from the USGS (Benz et al., 2011).

-
References:
- Benz, H.M., Herman, Matthew, Tarr, A.C., Hayes, G.P., Furlong, K.P., Villaseñor, Antonio, Dart, R.L., and Rhea, Susan, 2011, Seismicity of the Earth 1900–2010 New Guinea and vicinity: U.S. Geological Survey Open-File Report 2010–1083-H, scale 1:8,000,000.
- Hayes, G. P., D. J. Wald, and R. L. Johnson (2012), Slab1.0: A three-dimensional model of global subduction zone geometries, J. Geophys. Res., 117, B01302, doi:10.1029/2011JB008524
Did you see the six and change on the MAR, one of the fracture zones? (squee)
Yeah
I did not get a chance to post about it yet. ;-)