Around the beginning of the month, I was helping get a fundraiser prepared for a weekend concert series (audio crew for load in and strike; stage manager during the show). So, I was away from the computers when there was a magnitude M6.9 earthquake offshore of Sumatra and Java, Indonesia.
https://earthquake.usgs.gov/earthquakes/eventpage/us60004zhq/executive
There was also an interesting earthquake in Chile, but I can’t do it all. (If I get a chance, I will write that one up too.)
The tectonics are both simple and complicated in this part of the world. The islands of Sumatra and Java (and more) are rows of volcanoes (called an island arc) formed by the partial melt of mantle material associated with the subduction of the oceanic India-Australia plate beneath the Sunda plate (part of Eurasia).
The downgoing plate has lots of water embedded in the rocks and sediments, when this plate is subducted, those fluids make their way into the overlying mantle. This changes the conditions so that the mantle partially melts, which results in the material being less dense, so it rises and erupts as volcanoes.
We can see some of these volcanoes in the interpretive poster below (look at the eastern part of the Island of Java).
So, the subduction zone is the main player on the scene. But the orientation (strike and changes in strike) of the subduction zone megathrust fault, in comparison to the relative motion between these plates, and in comparison to pre-existing structures in the India-Australia plate, leads to a number of additional faults.
The major fault system that accommodates the different relative plate motions is the Great Sumatra fault. The relative plate motion is oblique (not perpendicular to) the orientation of the subduction zone fault. Therefore, while the megathrust accommodates the fault perpendicular motion, the Sumatra accommodates the fault parallel motion (as a strike slip-fault). There are other strike slip faults too. These faults are called “forearc sliver faults.”
Some of the historic faults in the interpretive poster below are subduction zone earthquakes. The 2007 M 8.4 quake is a great example of this.
There are a couple good examples of “outer rise” earthquakes, temblors that occur in the downgoing plate, where there is flexure of the plate, causing the plate to bend and cause earthquakes along these bends. These are extensional earthquakes (the 2011 & 2013 quakes near Christmas Island).
There are two quakes that appear related to the Sumatra fault (19994 and 1995 quakes).
The 2 Aug 2019 M 6.9 quake is interesting because it does not appear to be a megathrust quake, an outer rise quake, or a Sumatra fault quake. The M 6.9 is (1) too deep for those types of quakes and (2) has an orientation that is not consistent with those types of quakes. This quake is in the India-Australia plate and could be along a reactivated fracture zone. The inset maps shows several of these north-south trending fracture zones (e.g. the Investigator fracture zone).
Thus, I interpret this as a north-south oriented left-lateral strike-slip earthquake. It is pretty deep, and could also be related to some other processes going on within the slab or uppermost mantle. The slab depth at this location is 20 km, so the quake is possibly about 35 km beneath the top of the India Australia plate. Oceanic crust is, on average, 7km. So, this M 6.9 is probably within the mantle beneath the slab.
There is an analogous M 7.0 earthquake on 2009.09.02 to the east, just south of the label “Java” on the interpretive poster. This earthquake shows trench parallel compression (perpendicular to the compression from the subduction zone). This quake is almost 40 km deep, so is also probably beneath the slab, within the uppermost “lithospheric” mantle.
So, these 2019 M 6.9 and 2009 M 7.0 earthquakes are really cool.
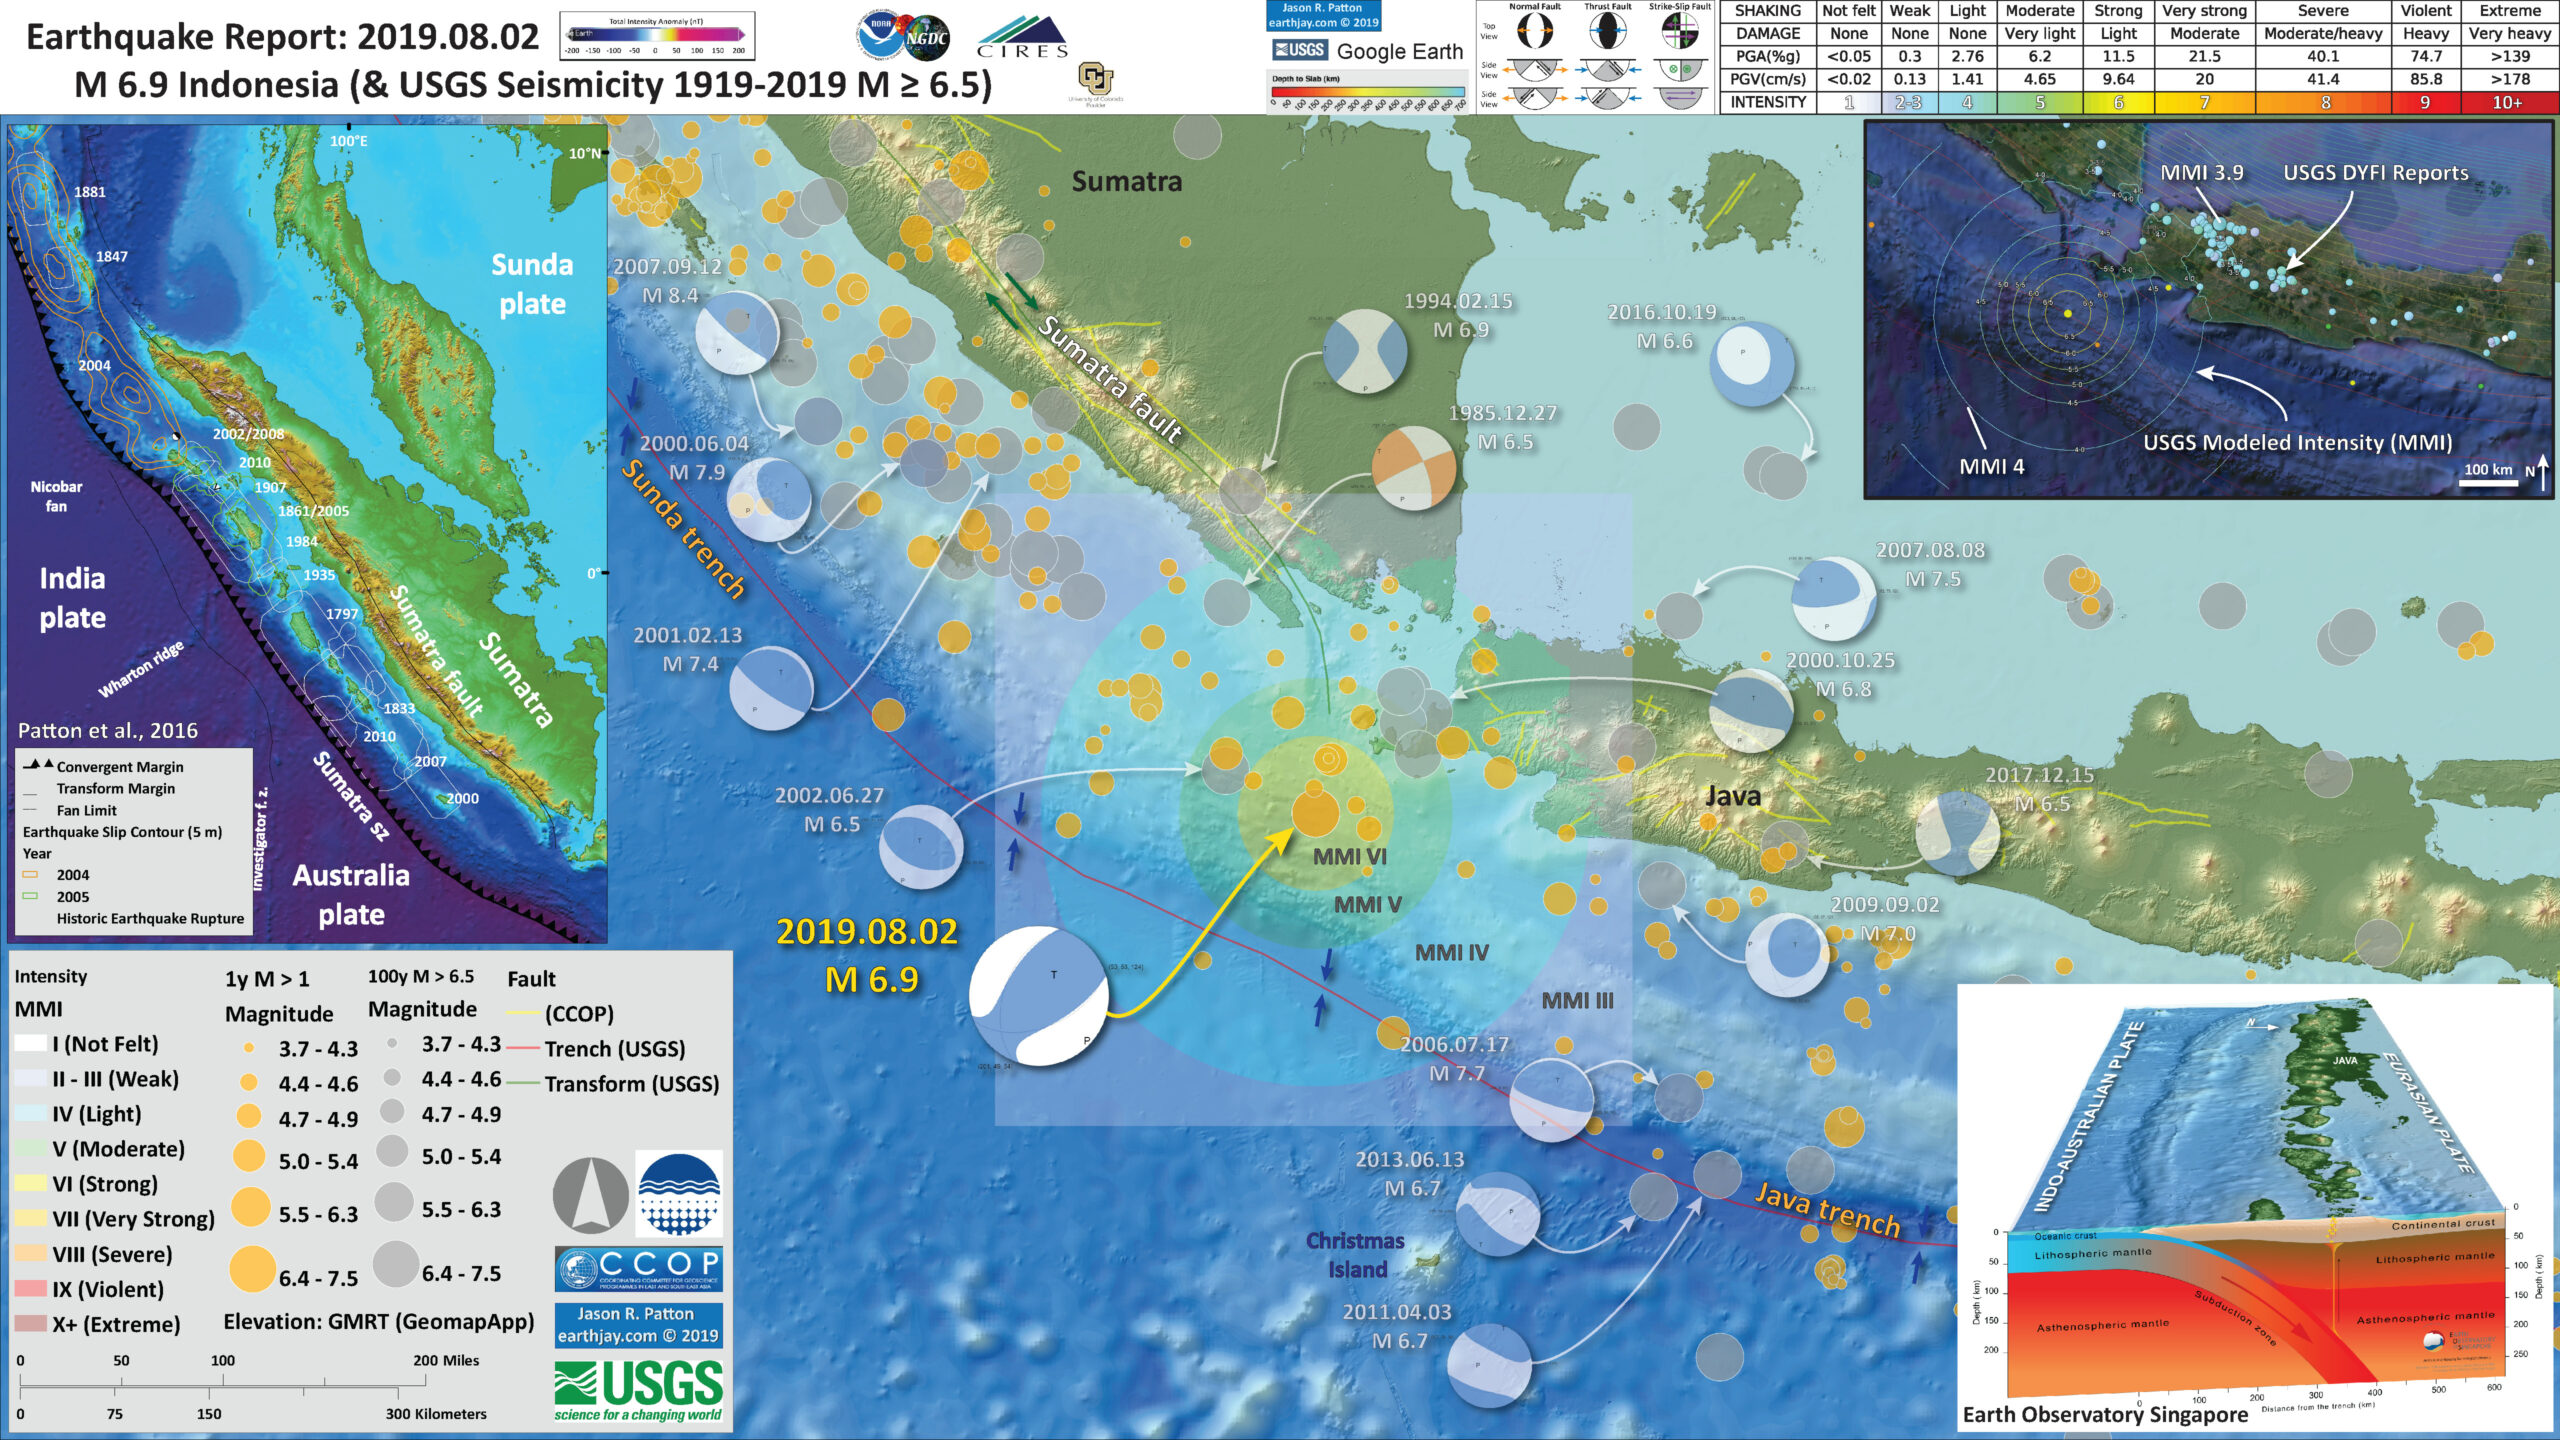
Below is my interpretive poster for this earthquake
I plot the seismicity from the past month, with color representing depth and diameter representing magnitude (see legend). I include earthquake epicenters from 1919-2019 with magnitudes M ≥ 6.5 in one version.
I plot the USGS fault plane solutions (moment tensors in blue and focal mechanisms in orange), in addition to some relevant historic earthquakes.
- I placed a moment tensor / focal mechanism legend on the poster. There is more material from the USGS web sites about moment tensors and focal mechanisms (the beach ball symbols). Both moment tensors and focal mechanisms are solutions to seismologic data that reveal two possible interpretations for fault orientation and sense of motion. One must use other information, like the regional tectonics, to interpret which of the two possibilities is more likely.
- I also include the shaking intensity contours on the map (in transparent shaded colors, see legend). These use the Modified Mercalli Intensity Scale (MMI; see the legend on the map). This is based upon a computer model estimate of ground motions, different from the “Did You Feel It?” estimate of ground motions that is actually based on real observations. The MMI is a qualitative measure of shaking intensity. More on the MMI scale can be found here and here. This is based upon a computer model estimate of ground motions, different from the “Did You Feel It?” estimate of ground motions that is actually based on real observations.
- The inset map that shows a comparison of MMI and DYFI results includes the slab 2.0 contours plotted (Hayes, 2018), which are contours that represent the depth to the subduction zone fault. These are mostly based upon seismicity. The depths of the earthquakes have considerable error and do not all occur along the subduction zone faults, so these slab contours are simply the best estimate for the location of the fault.
- The inset map that shows a comparison of MMI and DYFI results includes a transparent overlay of the magnetic anomaly data from EMAG2 (Meyer et al., 2017). As oceanic crust is formed, it inherits the magnetic field at the time. At different points through time, the magnetic polarity (north vs. south) flips, the North Pole becomes the South Pole. These changes in polarity can be seen when measuring the magnetic field above oceanic plates. This is one of the fundamental evidences for plate spreading at oceanic spreading ridges (like the Gorda rise).
- Regions with magnetic fields aligned like today’s magnetic polarity are colored red in the EMAG2 data, while reversed polarity regions are colored blue. Regions of intermediate magnetic field are colored light purple.
Magnetic Anomalies
- In the upper left corner is a map showing the major plate boundary faults offshore and onshore of Sumatra, Indonesia (Patton et al., 2015). Historic earthquake slip patches are shown (Bilham, 2005; Malik et al., 2011), including slip contours for the 2004 and 2005 subduction zone earthquakes (Chileh et al., 2007, 2008). I include moment tensors for the 2004 and 2005 subduction zone earthquakes, as well as the 2 Aug 2019 M 6.9 quake for reference.
- In the lower right corner is a low angle oblique view of a cut away of the Earth along the subduction zone in Java, Indonesia. The Sunda plate is part of Eurasia. The subduction zone offshore of Sumatra is similar in some ways to Java.
- In the upper right corner is a map that shows a comparison between the USGS computer modeled estimates of ground shaking (shown as MMI contours) and the USGS “Did You Feel It?” (DYFI) results. DYFI data are compiled when real people submit their observations to the USGS DYFI part of the webpage for the earthquake. These levels of intensity are quite close. I spot checked several and the DYFI spot values are generally between the MMI contours for that range of values.
I include some inset figures. Some of the same figures are located in different places on the larger scale map below.
- Here is the map with a year’s (orange) and a century’s (gray) seismicity plotted.

- Keefer (1984) studied a global data set of earthquake triggered landslides and found that larger earthquakes trigger larger and more numerous landslides across a larger area than do smaller earthquakes. Earthquakes can cause landslides because the seismic waves can cause the driving force to increase (the earthquake motions can “push” the land downwards), leading to a landslide. In addition, ground shaking can change the strength of these earth materials (a form of resisting force) with a process called liquefaction.
- Sediment or soil strength is based upon the ability for sediment particles to push against each other without moving. This is a combination of friction and the forces exerted between these particles. This is loosely what we call the “angle of internal friction.” Liquefaction is a process by which pore pressure increases cause water to push out against the sediment particles so that they are no longer touching.
- An analogy that some may be familiar with relates to a visit to the beach. When one is walking on the wet sand near the shoreline, the sand may hold the weight of our body generally pretty well. However, if we stop and vibrate our feet back and forth, this causes pore pressure to increase and we sink into the sand as the sand liquefies. Or, at least our feet sink into the sand.
- Below is the liquefaction susceptibility map. I discuss liquefaction more in my earthquake report on the 28 September 20018 Sulawesi, Indonesia earthquake, landslide, and tsunami here.
- I use the same color scheme that the USGS uses on their website. Note how the areas that are more likely to have experienced earthquake induced liquefaction are in the valleys. The fact that this earthquake happened in the summer time suggests that there may not have been any liquefaction from this earthquake.
Landslide, Liquefaction, and Shaking Intensity

Other Report Pages
Some Relevant Discussion and Figures
- Here is the plate tectonic map from Zahirovic et al (2014).

Regional tectonic setting with plate boundaries (MORs/transforms = black, subduction zones = teethed red) from Bird (2003) and ophiolite belts representing sutures modified from Hutchison (1975) and Baldwin et al. (2012). West Sulawesi basalts are from Polvé et al. (1997), fracture zones are from Matthews et al. (2011) and basin outlines are from Hearn et al. (2003).
- In addition to the orientation of relative plate motion (that controls seismogenic zone and strain partitioning), the Indo Australia plate varies in crustal age (Lasitha et al., 2006). I include their figure caption below as a blockquote.

Tectonic sketch map of the Sumatra–Java trench-arc region in eastern Indian Ocean Benioff Zone configuration. Hatched line with numbers indicates depth to the top of the Benioff Zone (after Newcomb and McCann13). Magnetic anomaly identifications have been considered from Liu et al.14 and Krishna et al.15. Magnitude and direction of the plate motion is obtained from Sieh and Natawidjaja. O indicates the location of the recent major earthquakes of 26 December 2004, i.e. the devastating tsunamigenic earthquake (Mw = 9.3) and the 28 March 2005 earthquake (Mw = 8.6).
- Here is a figure showing the regional geodetic motions (Bock et al., 2003). I include their figure caption below as a blockquote.

Topographic and tectonic map of the Indonesian archipelago and surrounding region. Labeled, shaded arrows show motion (NUVEL-1A model) of the first-named tectonic plate relative to the second. Solid arrows are velocity vectors derived from GPS surveys from 1991 through 2001, in ITRF2000. For clarity, only a few of the vectors for Sumatra are included. The detailed velocity field for Sumatra is shown in Figure 5. Velocity vector ellipses indicate 2-D 95% confidence levels based on the formal (white noise only) uncertainty estimates. NGT, New Guinea Trench; NST, North Sulawesi Trench; SF, Sumatran Fault; TAF, Tarera-Aiduna Fault. Bathymetry [Smith and Sandwell, 1997] in this and all subsequent figures contoured at 2 km intervals.
- Here is a map that shows the subduction zone offshore of Sumatra. Note the fracture zones in the India Australia plate (Krabbenhoeft et al., 2010). These authors looked at deep seismic profiles and seafloor bathymetry to interpret the structures of the accretionary prisms forming above the megathrust faults.
- Here is a cogent summary of their findings:
- Here is a map that shows the subduction zone offshore of Java. Note the fracture zones in the India Australia plate.
We find the differences along the Sunda margin, especially the wider extent of the seismogenic zone off Sumatra, producing larger earthquakes, to result from the interaction of different age and subduction direction of the oceanic plate. We attribute a major role to the sediment income and continental/oceanic upper plate nature of Sumatra/Java influencing the composition and deformation style along the forearc and subduction fault.

Bathymetry off Sumatra (multibeam bathymetry, where available underlain by satellite derived bathymetry; Smith and Sandwell, 1997). Tectonic setting is after Newcomb and McCann, 1987. Fracture zones (after Kopp et al., 2008) on the incoming plate as well as subduction direction and velocity (after Simons et al., 2007) are indicated by annotated black arrows on Indo-Australian plate. Major Mentawai islands as well as major faults are annotated along the forearc. Dashed lines sub-parallel to the trench mark the updip and downdip limit of the SZ. The seaward trench-parallel dashed line marking the updip limit of the SZ coincides with the slope break. Profiles and regions are marked and annotated, where additional investigations were available to constrain or refute their limits of the SZ.
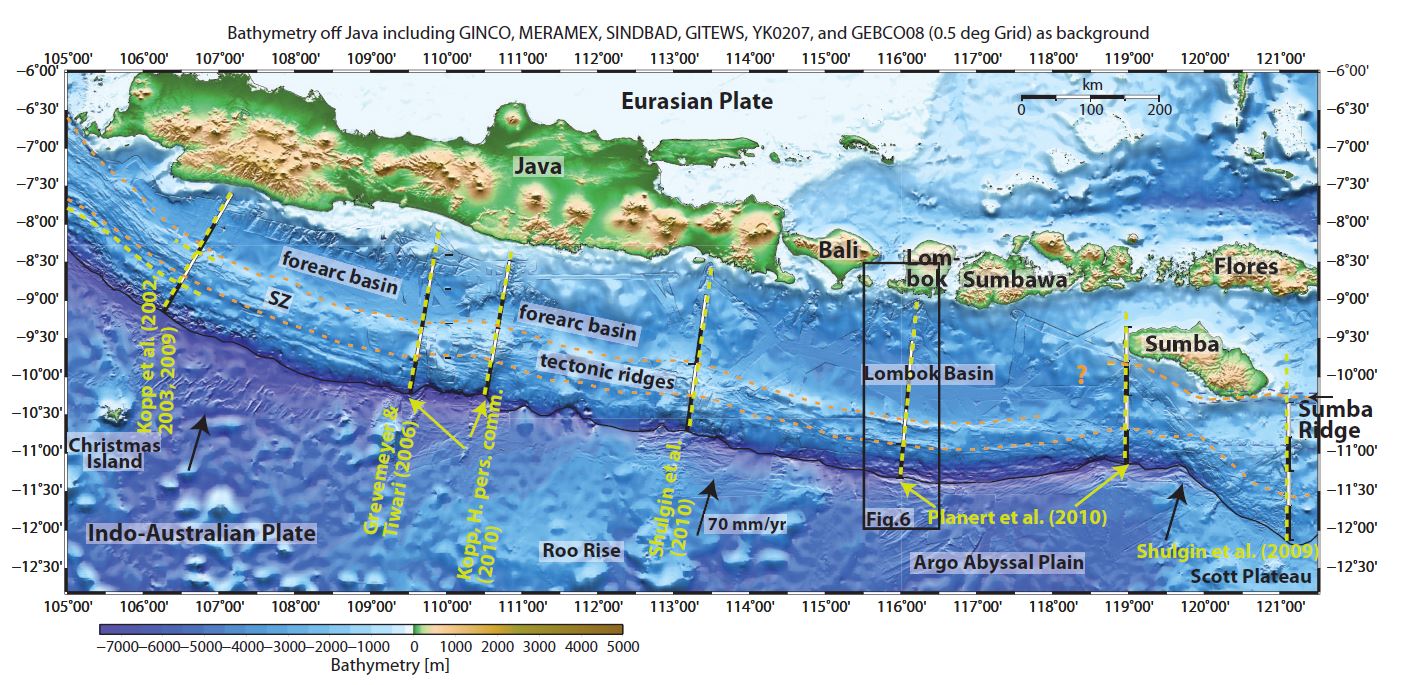
Bathymetry off Java and the Lesser Sunda islands (multibeam bathymetry (for YK0207 see Soh et al., 2002), where available underlain by satellite derived bathymetry; Smith and Sandwell, 1997). Tectonic setting (after Newcomb and McCann, 1987) on the incoming plate as well as subduction direction and velocity (after Simons et al., 2007) are indicated by annotated black arrows on Indo-Australian plate. Lesser Sunda islands as well as major tectonic features are annotated along the forearc. Dashed lines sub-parallel to the trench mark the updip and downdip limit of the SZ. The seaward trench-parallel dashed line marking the updip limit of the SZ coincides with the slope break. Profiles and regions are marked and annotated, where additional investigations were available to constrain or refute their limits of the SZ.
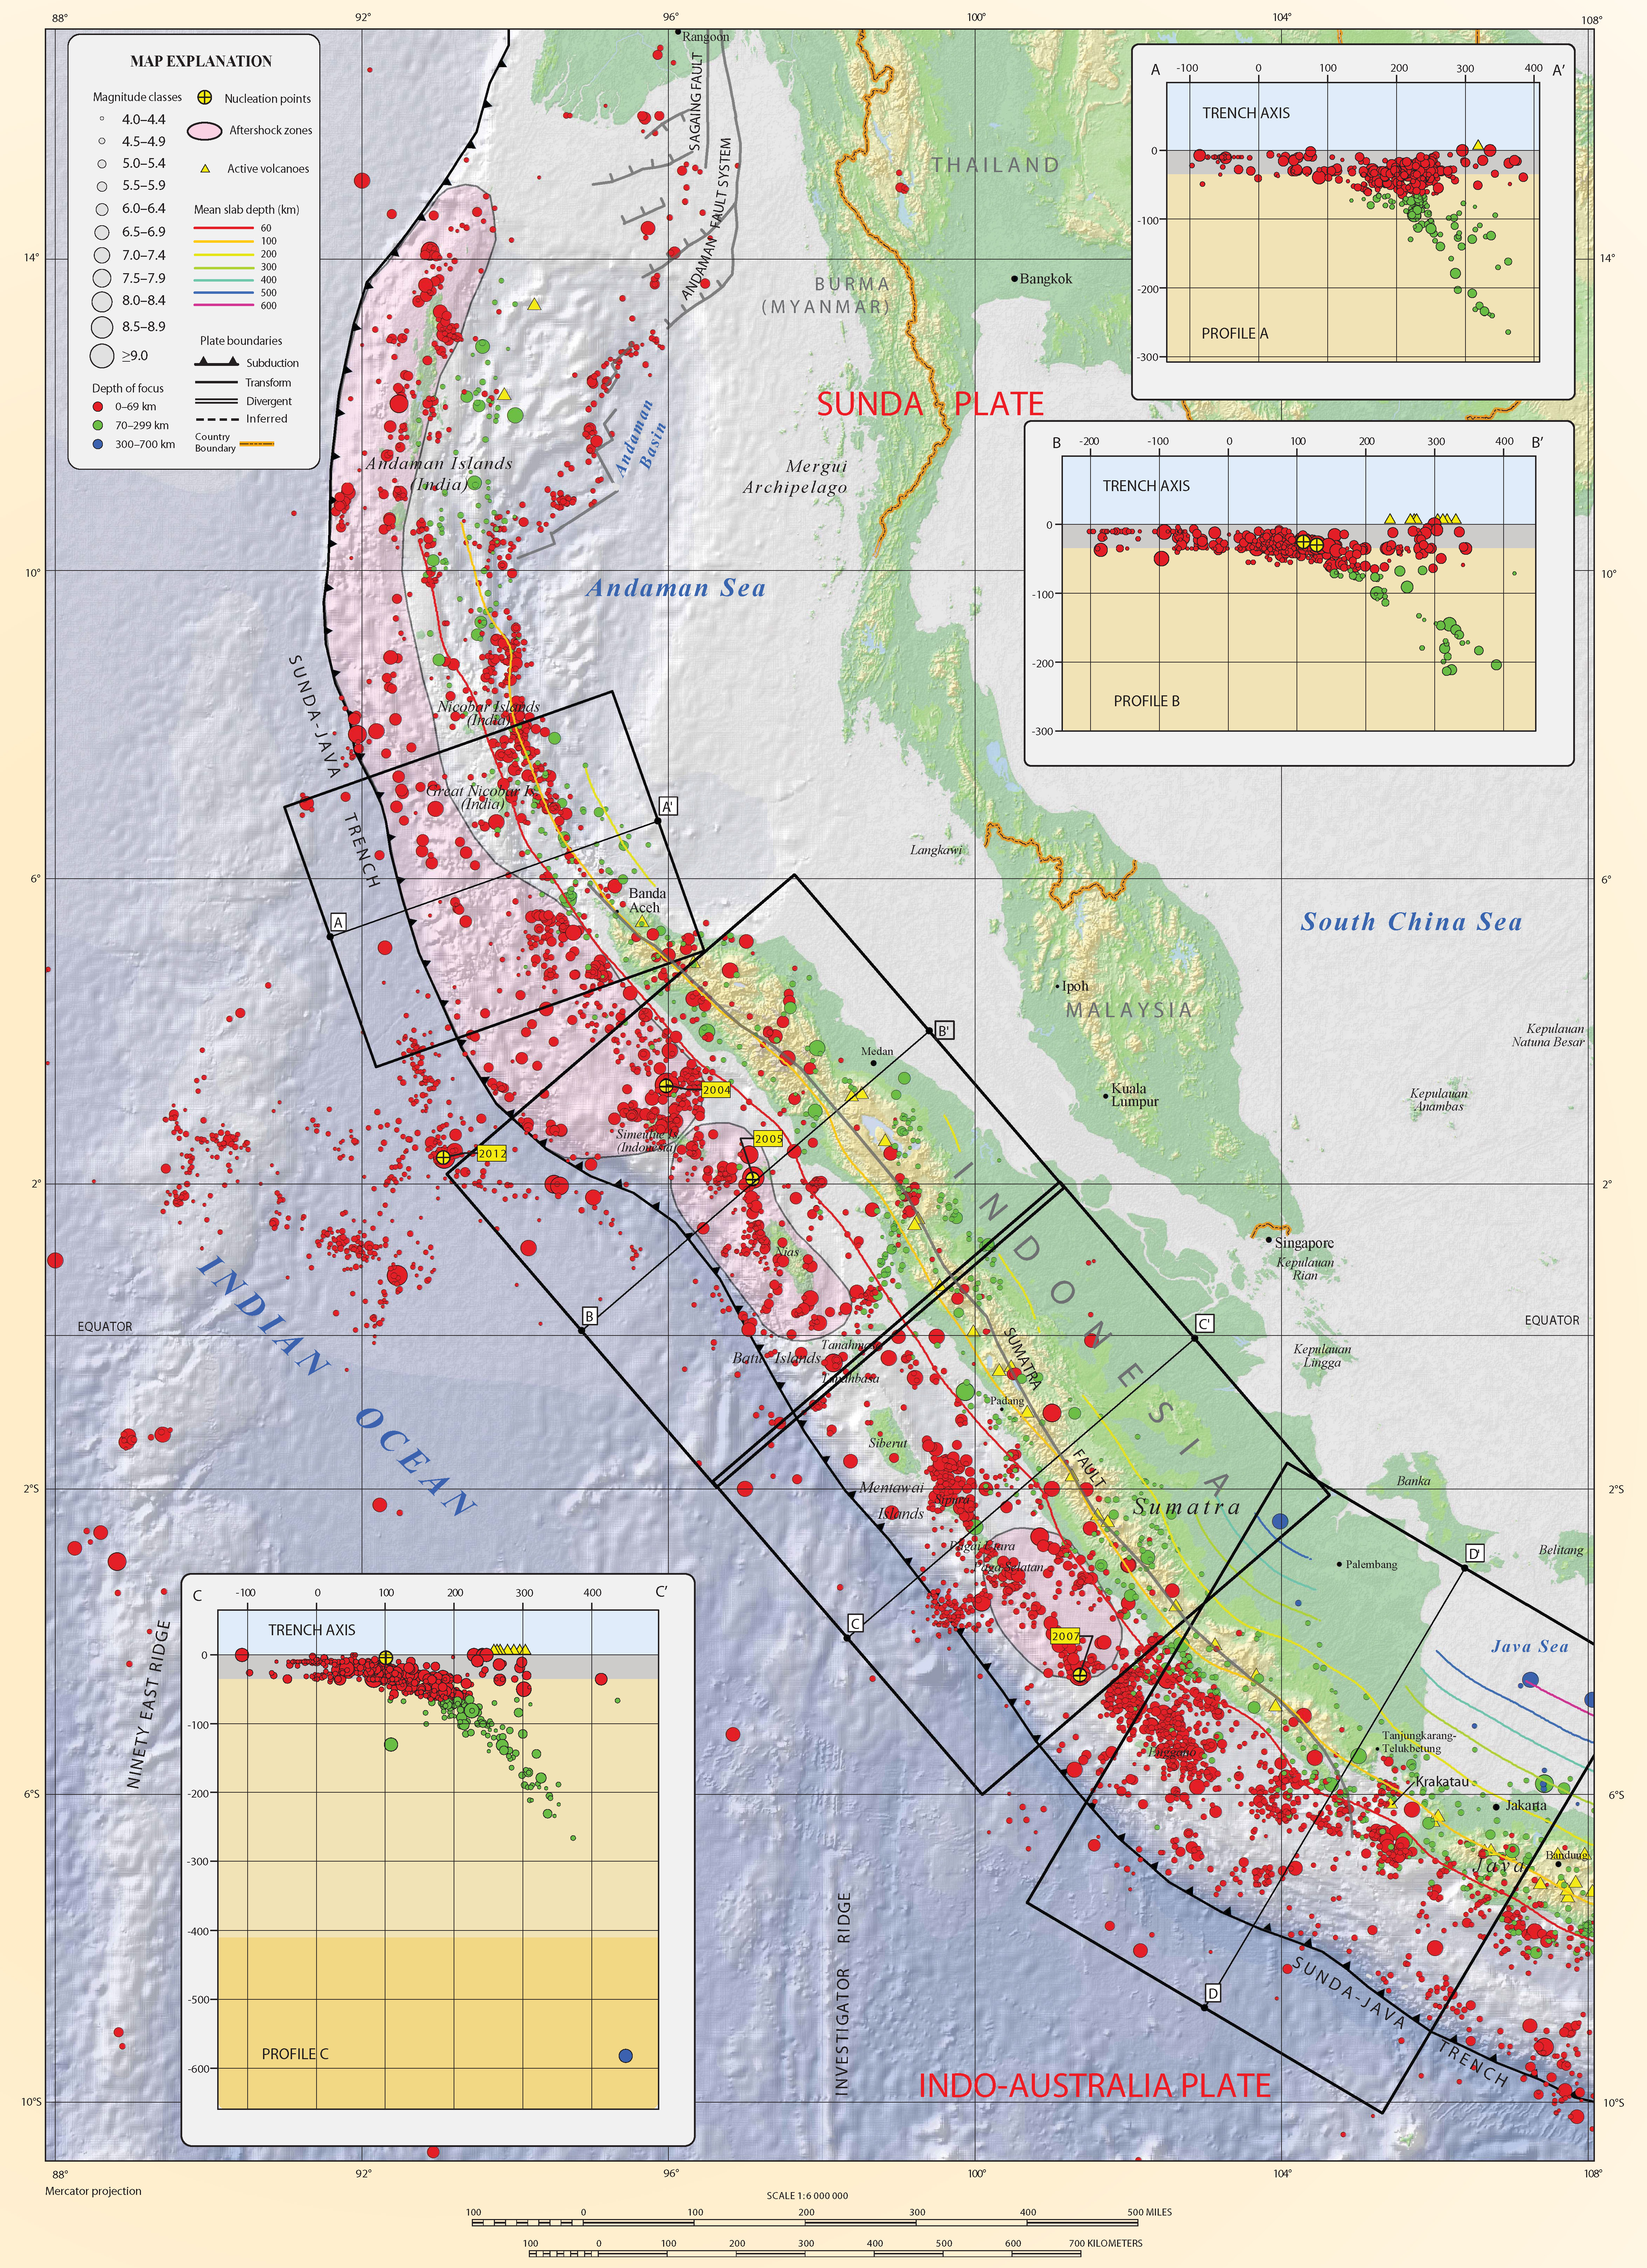
- This is the main figure from Hayes et al. (2013) from the Seismicity of the Earth series. There is a map with the slab contours and seismicity both colored vs. depth. There are also some cross sections of seismicity plotted, with locations shown on the map.
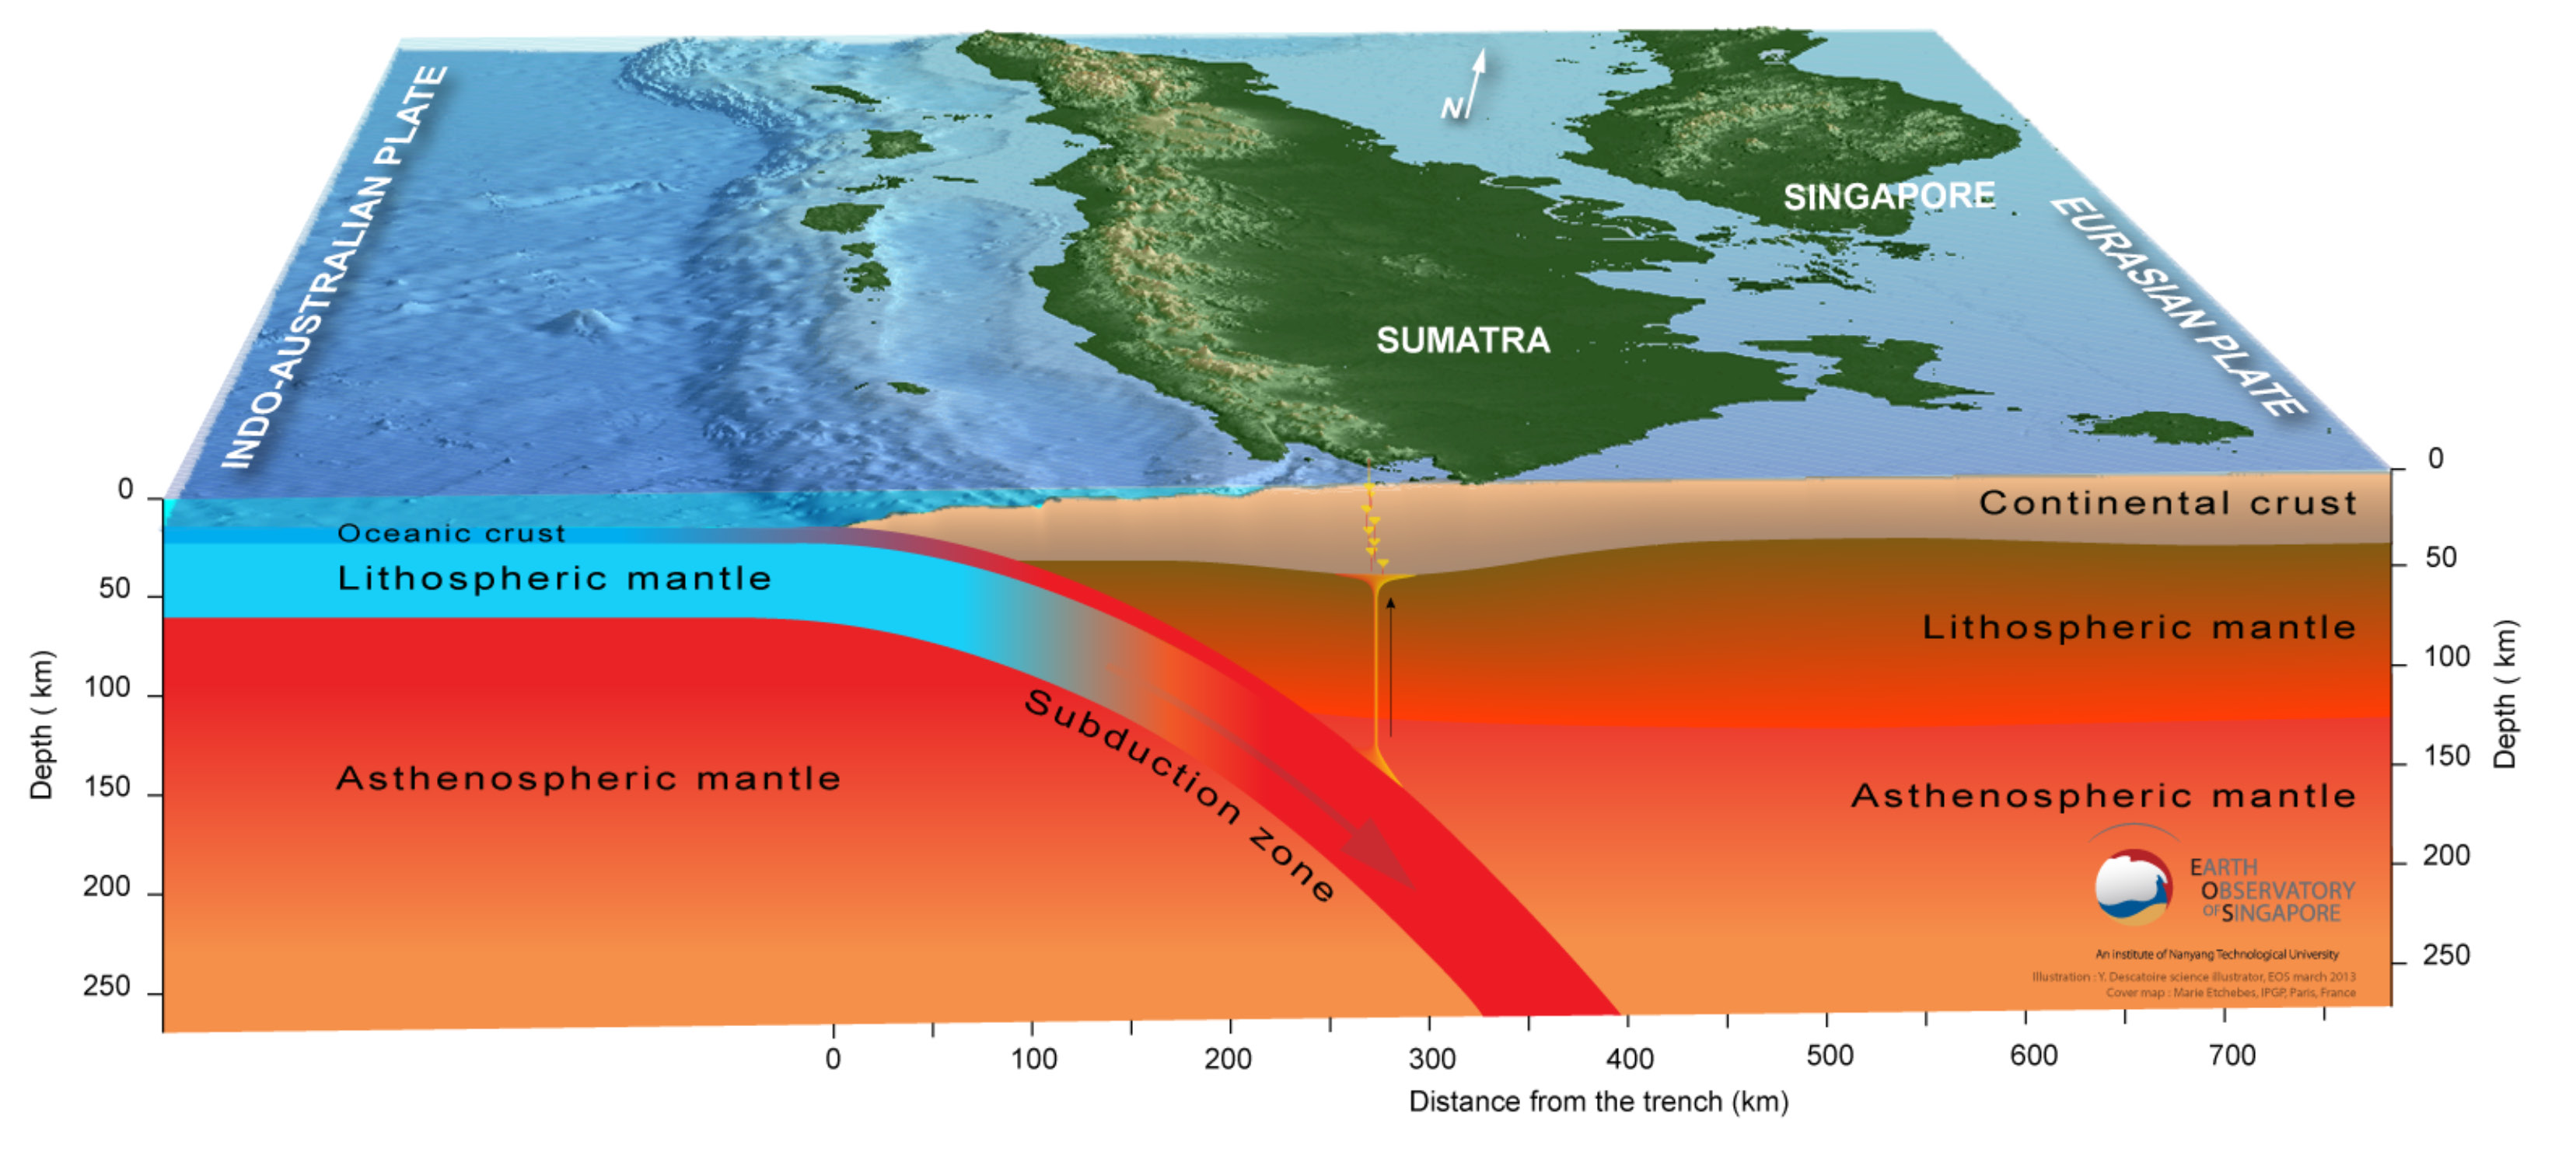
- Here is a cutaway figure showing the subduction zone beneath the island of Sumatra (from Earth Observatory of Singapore).
- Here is a great figure from Philobosian et al. (2014) that shows the slip patches from the subduction zone earthquakes in this region.
- For a review of the 2004 and 2005 Sumatra Andaman subduction zone (SASZ) earthquakes, please check out my Earthquake Report here. Below is the poster from that report. On that report page, I also include some information about the 2012 M 8.6 and M 8.2 Wharton Basin earthquakes.
- I include some inset figures in the poster.
- In the upper left corner, I include a map that shows the extent of historic earthquakes along the SASZ offshore of Sumatra. This map is a culmination of a variety of papers (summarized and presented in Patton et al., 2015).
- In the upper right corner I include a figure that is presented by Chlieh et al. (2007). These figures show model results from several models. Each model is represented by a map showing the amount that the fault slipped in particular regions. I present this figure below.
- In the lower right corner I present a figure from Prawirodirdjo et al. (2010). This figure shows the coseismic vertical and horizontal motions from the 2004 and 2005 earthquakes as measured at GPS sites.
- In the lower left corner are the MMI intensity maps for the two SASZ earthquakes. Note these are at different map scales. I also include the MMI attenuation curves for these earthquakes below the maps. These plots show the reported MMI intensity data as they relate to two plots of modeled estimates (the orange and green lines). These green dots are from the USGS “Did You Feel It?” reports compared to the estimates of ground shaking from Ground Motion Prediction Equation (GMPE) estimates. GMPE are empirical relations between earthquakes and recorded seismologic observations from those earthquakes, largely controlled by distance to the fault, ray path (direction and material properties), and site effects (the local geology). When seismic waves propagate through sediment, the magnitude of the ground motions increases in comparison to when seismic waves propagate through bedrock. The orange line is a regression of data for the central and eastern US and the green line is a regression through data from the western US.
- The 2004/2005 SASZ earthquakes also tended to load strain in the crust in different locations. On 2012.04.11 there was a series of strike-slip earthquakes in the India plate crust to the west of the 2004/2005 earthquakes. The two largest magnitudes for these earthquakes were M 8.6 and M 8.2. The M 8.6 is the largest strike-slip earthquake ever recorded.
- On 2016.03.22 there was another large strike-slip earthquake in the India-Australia plate. This is probably related to this entire suite of subduction zone and intraplate earthquakes. I presented an interpretive poster about this M 7.8 earthquake here. Below is my interpretive poster for the M 7.8 earthquake. Here is the USGS website for this earthquake.
- I include a map in the upper right corner that shows the historic earthquake rupture areas.
- Here is a poster that shows some earthquakes in the Andaman Sea. This is from my earthquake report from 2015.11.08.
- This map shows the fracture zones in the India-Australia plate.
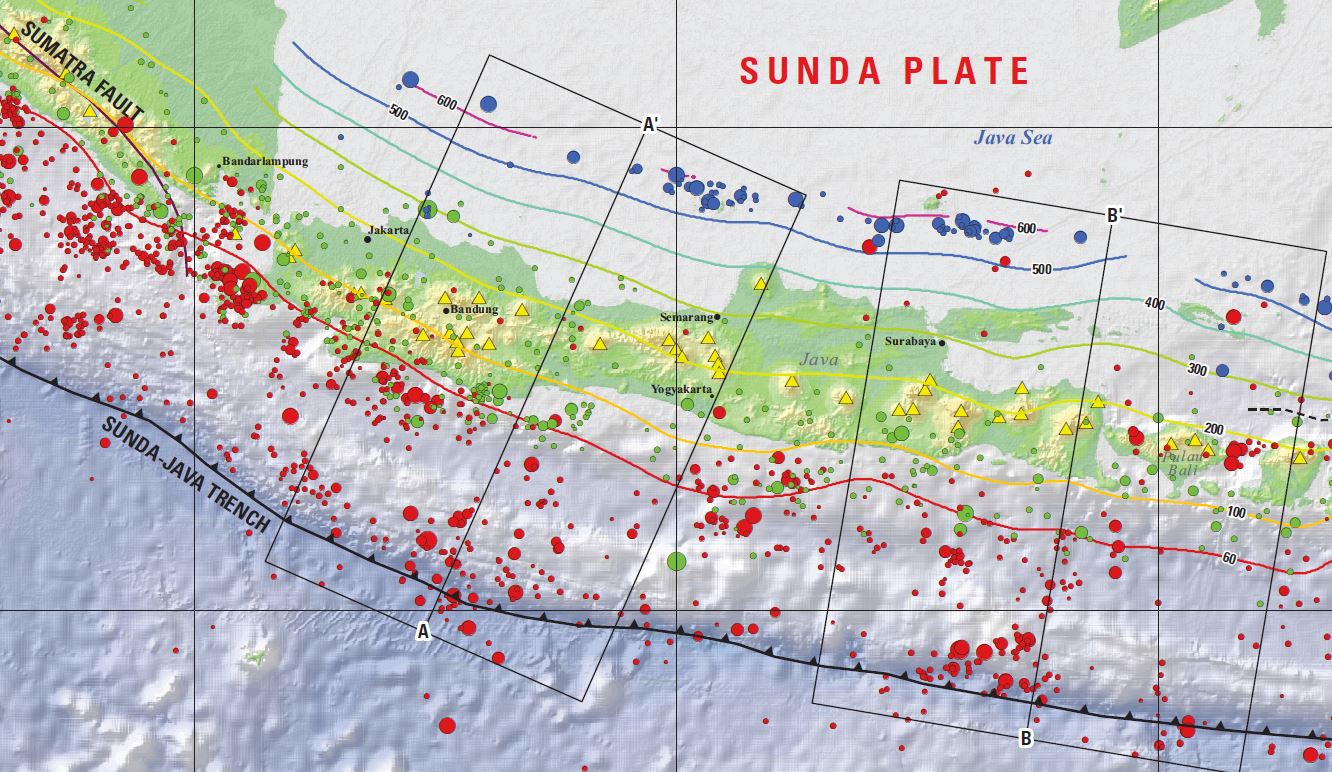
- Here is a map showing seismicity and cross section locations along the Java trench (Jones et al., 2010). Below the map is the seismicity cross section A-A.’ shown on the map.
- Here is a cutaway figure showing the subduction zone beneath the island of Java (from Earth Observatory of Singapore).
- Kopp (2011) presents an analysis of the deep structure of the subduction zone beneath and offshore of Java. Below is their figure that shows how the structure changes along strike (from east to west, a series of cross sections.
- First is a map showing where these sections are located. This figure also shows nicely where this convergent plate boundary changes from a subduction zone on the west (Java trench) to a collision zone on the east (e.g. Timor trough). The India-Australia plate is oceanic on the west and continental crust on the east.
- Here are the structural profiles.
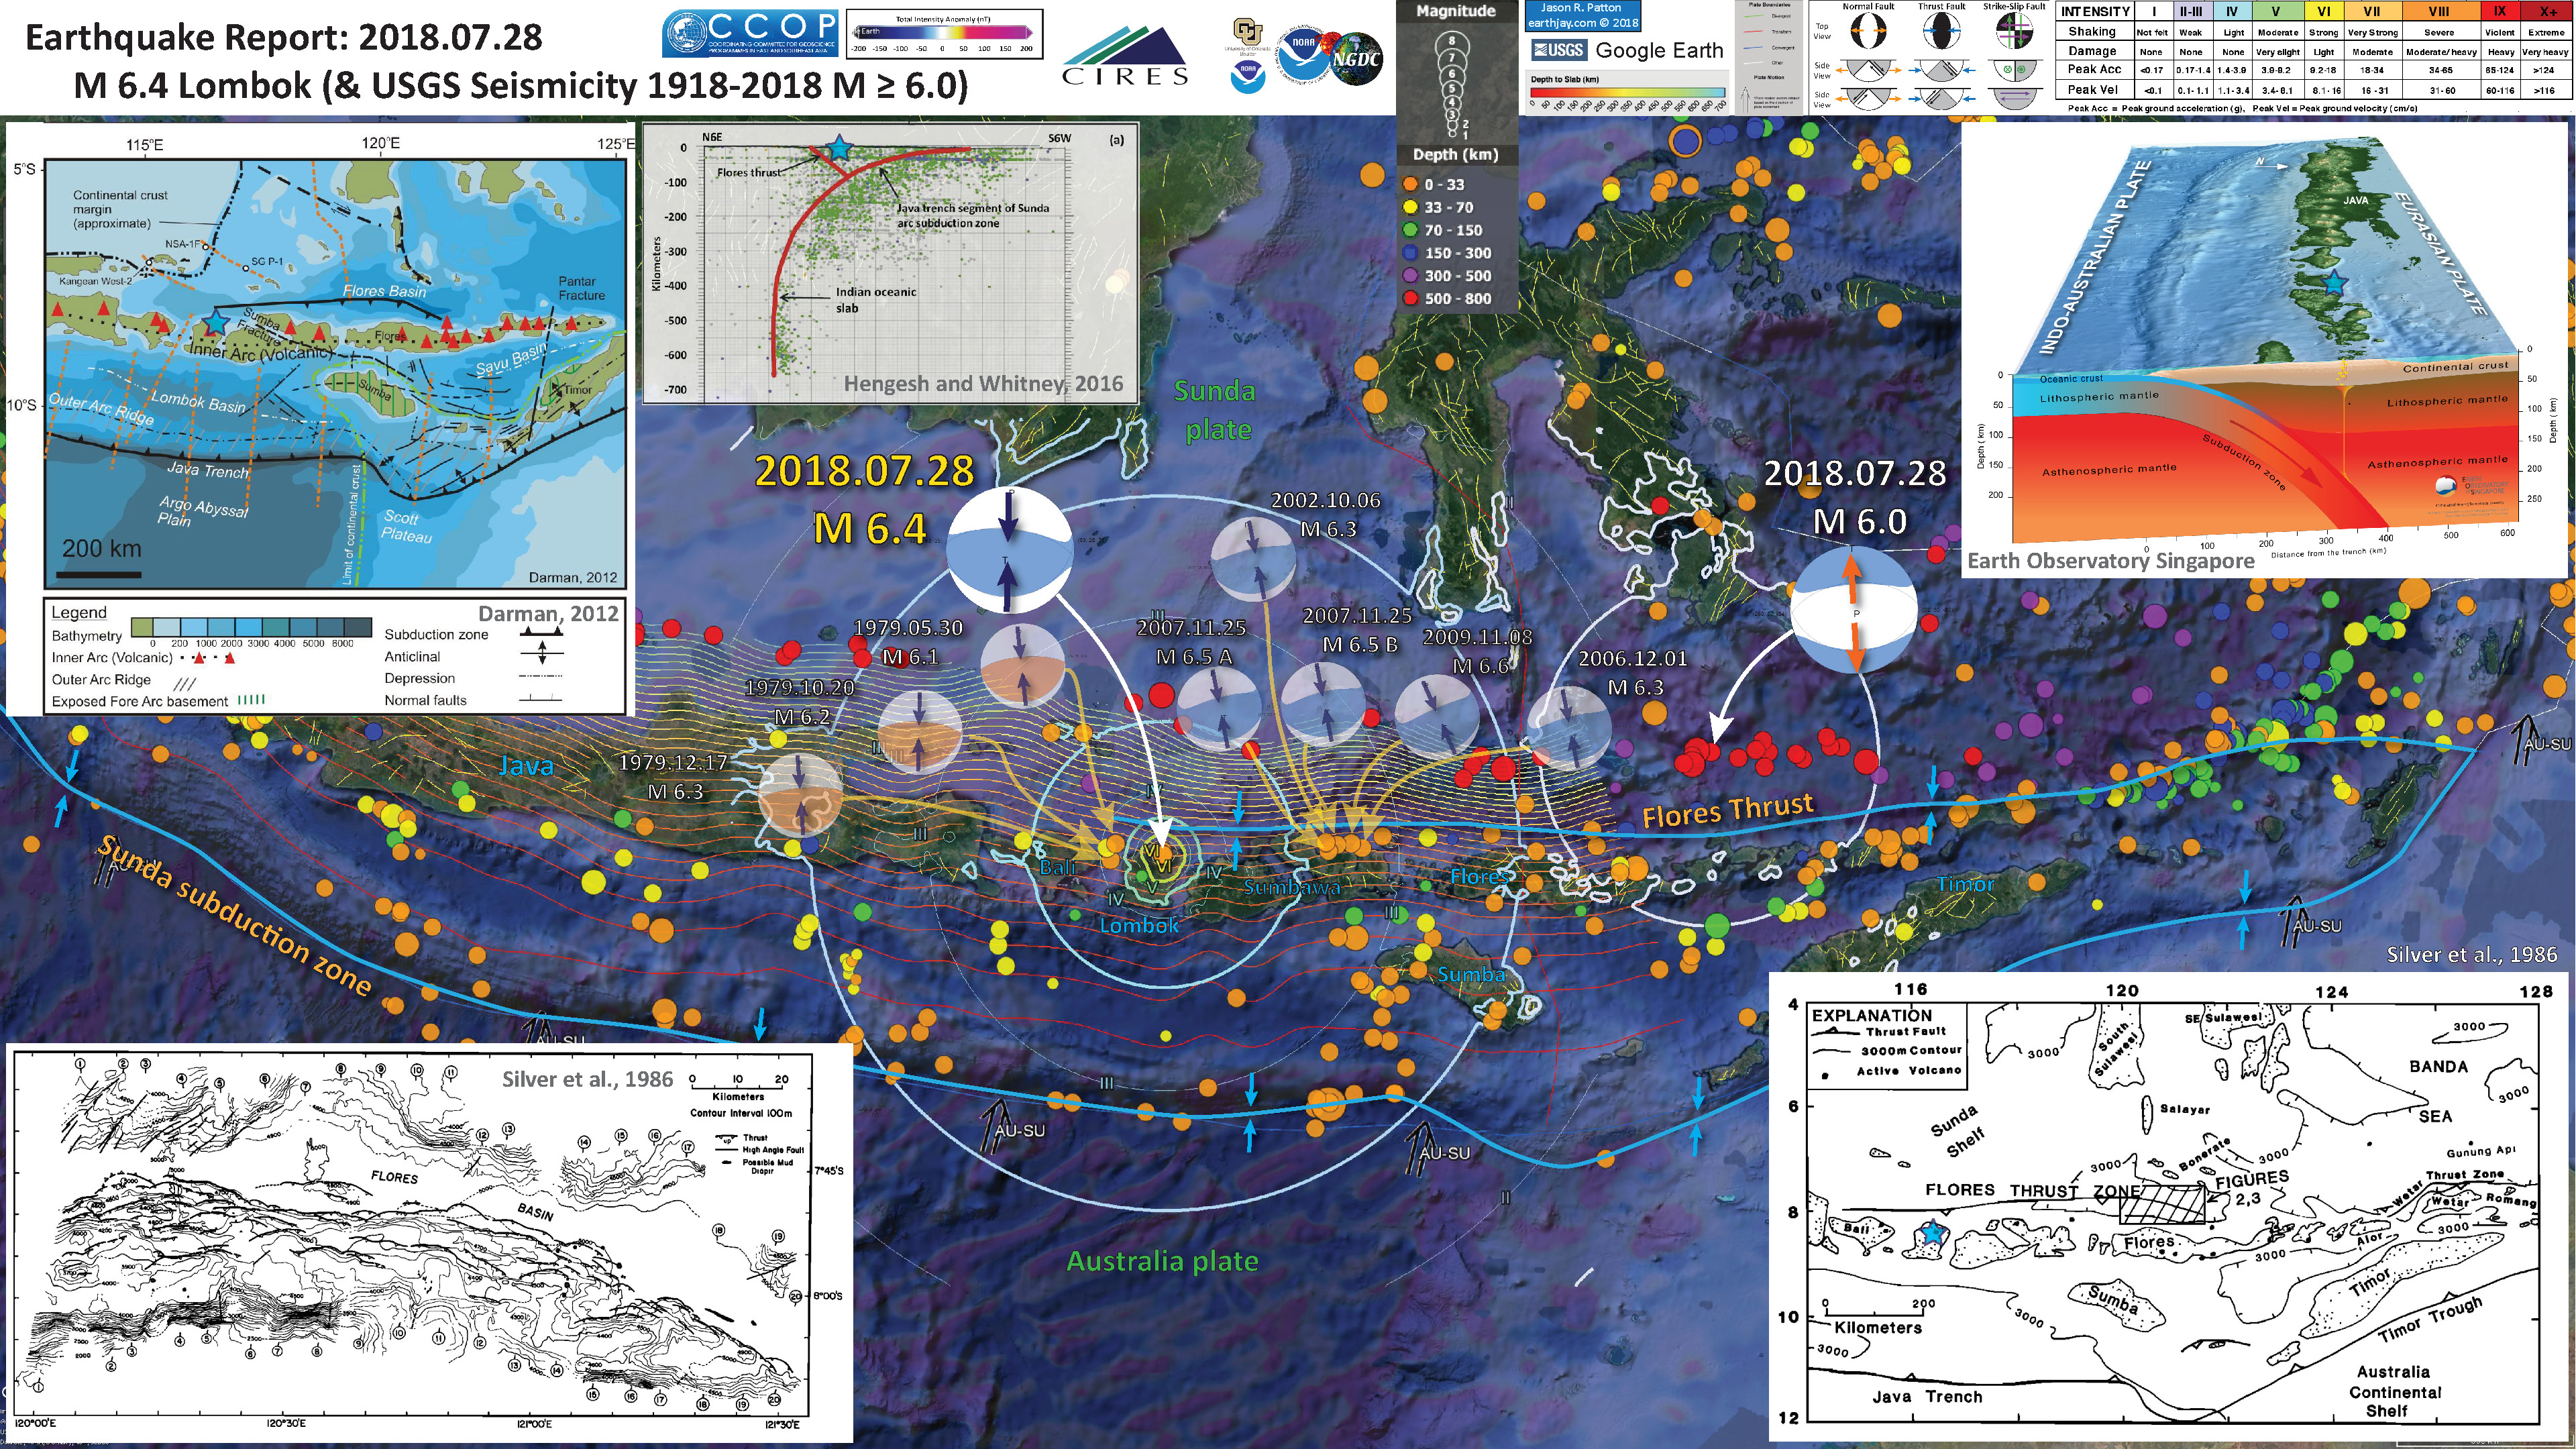
- In 2018, there was a series of earthquakes along the island of Lombok, Indonesia. My third report on that sequence is here. Below is an interpretive poster from the early part of the Lombok sequence, but includes some historic earthquakes associated with the subduction zone. The 2018 Lombok earthquakes were related to a fault that opposes the subduction zone, not on the subduction zone itself. Learn more about these structures in that report series.
- Here is the interpretive posted from the M 6.4 7/28 earthquake, with historic seismicity and earthquake mechanisms.
- Below are the maps and cross sections from Darman et al., 2012.
- Here is the map in the interpretive poster above.
- Here is the seismicity cross section in the interpretive poster above.
- Here is their interpretations of seismic data used to interpret the tectonics of the subduction zone and Flores thrust.
- Here is the tectonic map from Hangesh and Whitney (2016). At the eastern part of the plate boundary, things get more complicated. Check out my earthquake report for a recent intermediate depth earthquake to learn more about this part of the world.

Map of Southeast Asia showing recent and selected historical ruptures of the Sunda megathrust. Black lines with sense of motion are major plate-bounding faults, and gray lines are seafloor fracture zones. Motions of Australian and Indian plates relative to Sunda plate are from the MORVEL-1 global model [DeMets et al., 2010]. The fore-arc sliver between the Sunda megathrust and the strike-slip Sumatran Fault becomes the Burma microplate farther north, but this long, thin strip of crust does not necessarily all behave as a rigid block. Sim = Simeulue, Ni = Nias, Bt = Batu Islands, and Eng = Enggano. Brown rectangle centered at 2°S, 99°E delineates the area of Figure 3, highlighting the Mentawai Islands. Figure adapted from Meltzner et al. [2012] with rupture areas and magnitudes from Briggs et al. [2006], Konca et al. [2008], Meltzner et al. [2010], Hill et al. [2012], and references therein.


Morphology of the Java margin based on satellite altimetry data (Smith & Sandwell 1997). A large bivergent accretionary wedge is expressed as a continuous bathymetric ridge fronting the Java fore-arc basin offshore western Java. This ridge structure is broken and highly deformed offshore central Java, where the oceanic Roo Rise is colliding with the margin. The eastern Java trench offshore Bali to Sumba is characterized by the subduction of smooth oceanic crust of the Argo Abyssal Plain. The transition from oceanic subduction to continent–island arc collision occurs south of Sumba where the Scott plateau enters the trench. Black lines show wide-angle refraction profiles.

Tomographic images and velocity–depth distribution along seven refraction seismic dip lines crossing the fore-arc between western Java and east of Sumba island. The profiles document the variation from the accretionary domain (a and b) to the erosional seamount/plateau subduction regime off central to eastern Java (c and d). To the east, the transition from oceanic subduction offshore Lombok (e) to continent–island arc collision (f and g) occurs. All profiles west of Sumba show a shallow hydrated upper plate mantle, which limits the downdip extent of the seismogenic zone. Profiles are approximately aligned along the vertical stippled line. Vertical exaggeration in all profiles is 2.5.

Tectonic map of the Lesser Sunda Islands, showing the main tectonic units, main faults, bathymetry and location of seismic sections discussed in this paper.

This plot shows the earthquake localizations on a South-North cross section for the lat -14°/-4° long 114°/124° quadrant corresponding to the Lesser Sunda Islands region. The localizations are extracted from the USGS database and corresponds to magnitude greater than 4.5 in the 1973-2004 time period (shallow earthquakes with undetermined depth have been omitted.

Six 15 km deep seismic sections acquired by BGR from west to east traversing oceanic crust, deep sea trench, accretionary prism, outer arc high and fore-arc basin, derived from Kirchoff prestack depth migration (PreSDM) with a frequency range of 4-60 Hz. Profile BGR06-313 shows exemplarily a velocity-depth model according to refraction/wide-angle
seismic tomography on coincident profile P31 (modified after Lüschen et al, 2011).

Illustration of major tectonic elements in triple junction geometry: tectonic features labeled per Figure 1; seismicity from ISC-GEM catalog [Storchak et al., 2013]; faults in Savu basin from Rigg and Hall [2011] and Harris et al. [2009]. Purple line is edge of Australian continental basement and fore arc [Rigg and Hall, 2011]. Abbreviations: AR = Ashmore Reef; SR = Scott Reef; RS = Rowley Shoals; TCZ = Timor Collision Zone; ST = Savu thrust; SB = Savu Basin; TT = Timor thrust; WT =Wetar thrust; WASZ = Western Australia Shear Zone. Open arrows indicate relative direction of motion; solid arrows direction of vergence.
Geologic Fundamentals
- For more on the graphical representation of moment tensors and focal mechanisms, check this IRIS video out:
- Here is a fantastic infographic from Frisch et al. (2011). This figure shows some examples of earthquakes in different plate tectonic settings, and what their fault plane solutions are. There is a cross section showing these focal mechanisms for a thrust or reverse earthquake. The upper right corner includes my favorite figure of all time. This shows the first motion (up or down) for each of the four quadrants. This figure also shows how the amplitude of the seismic waves are greatest (generally) in the middle of the quadrant and decrease to zero at the nodal planes (the boundary of each quadrant).

- Here is another way to look at these beach balls.
The two beach balls show the stike-slip fault motions for the M6.4 (left) and M6.0 (right) earthquakes. Helena Buurman's primer on reading those symbols is here. pic.twitter.com/aWrrb8I9tj
— AK Earthquake Center (@AKearthquake) August 15, 2018
- There are three types of earthquakes, strike-slip, compressional (reverse or thrust, depending upon the dip of the fault), and extensional (normal). Here is are some animations of these three types of earthquake faults. The following three animations are from IRIS.
Strike Slip:
Compressional:
Extensional:
- This is an image from the USGS that shows how, when an oceanic plate moves over a hotspot, the volcanoes formed over the hotspot form a series of volcanoes that increase in age in the direction of plate motion. The presumption is that the hotspot is stable and stays in one location. Torsvik et al. (2017) use various methods to evaluate why this is a false presumption for the Hawaii Hotspot.
- Here is a map from Torsvik et al. (2017) that shows the age of volcanic rocks at different locations along the Hawaii-Emperor Seamount Chain.
- Here is a great tweet that discusses the different parts of a seismogram and how the internal structures of the Earth help control seismic waves as they propagate in the Earth.

A cutaway view along the Hawaiian island chain showing the inferred mantle plume that has fed the Hawaiian hot spot on the overriding Pacific Plate. The geologic ages of the oldest volcano on each island (Ma = millions of years ago) are progressively older to the northwest, consistent with the hot spot model for the origin of the Hawaiian Ridge-Emperor Seamount Chain. (Modified from image of Joel E. Robinson, USGS, in “This Dynamic Planet” map of Simkin and others, 2006.)

Hawaiian-Emperor Chain. White dots are the locations of radiometrically dated seamounts, atolls and islands, based on compilations of Doubrovine et al. and O’Connor et al. Features encircled with larger white circles are discussed in the text and Fig. 2. Marine gravity anomaly map is from Sandwell and Smith.
Today, on #SeismogramSaturday: what are all those strangely-named seismic phases described in seismograms from distant earthquakes? And what do they tell us about Earth’s interior? pic.twitter.com/VJ9pXJFdCy
— Jackie Caplan-Auerbach (@geophysichick) February 23, 2019
- M 9.2 Andaman-Sumatra subduction zone 2014 Earthquake Anniversary
- M 9.2 Andaman-Sumatra subduction zone SASZ Fault Deformation
- M 9.2 Andaman-Sumatra subduction zone 2016 Earthquake Anniversary
- 2019.08.02 M 6.9 Indonesia
- 2019.06.23 M 7.3 Banda Sea
- 2019.04.12 M 6.8 Sulawesi, Indonesia
- 2018.09.28 M 7.5 Sulawesi
- 2018.10.16 M 7.5 Sulawesi UPDATE #1
- 2018.08.19 M 6.9 Lombok, Indonesia
- 2018.08.05 M 6.9 Lombok, Indonesia
- 2018.07.28 M 6.4 Lombok, Indonesia
- 2017.12.15 M 6.5 Java
- 2017.08.31 M 6.3 Mentawai, Sumatra
- 2017.08.13 M 6.4 Bengkulu, Sumatra, Indonesia
- 2017.05.29 M 6.8 Sulawesi, Indonesia
- 2017.03.14 M 6.0 Sumatra
- 2017.03.01 M 5.5 Banda Sea
- 2016.10.19 M 6.6 Java
- 2016.03.02 M 7.8 Sumatra/Indian Ocean
- 2015.07.22 M 5.8 Andaman Sea
- 2015.11.08 M 6.4 Nicobar Isles
- 2012.04.11 M 8.6 Sumatra outer rise
- 2004.12.26 M 9.2 Andaman-Sumatra subduction zone
Indonesia | Sumatra
General Overview
Earthquake Reports
Social Media
Mw=7.0, SOUTHWEST OF SUMATRA, INDONESIA (Depth: 43 km), 2019/08/02 12:03:26 UTC – Full details here: https://t.co/TN6Lbeycmc pic.twitter.com/LuyXLEYFql
— Earthquakes (@geoscope_ipgp) August 2, 2019
- Frisch, W., Meschede, M., Blakey, R., 2011. Plate Tectonics, Springer-Verlag, London, 213 pp.
- Hayes, G., 2018, Slab2 – A Comprehensive Subduction Zone Geometry Model: U.S. Geological Survey data release, https://doi.org/10.5066/F7PV6JNV.
- Holt, W. E., C. Kreemer, A. J. Haines, L. Estey, C. Meertens, G. Blewitt, and D. Lavallee (2005), Project helps constrain continental dynamics and seismic hazards, Eos Trans. AGU, 86(41), 383–387, , https://doi.org/10.1029/2005EO410002. /li>
- Kreemer, C., J. Haines, W. Holt, G. Blewitt, and D. Lavallee (2000), On the determination of a global strain rate model, Geophys. J. Int., 52(10), 765–770.
- Kreemer, C., W. E. Holt, and A. J. Haines (2003), An integrated global model of present-day plate motions and plate boundary deformation, Geophys. J. Int., 154(1), 8–34, , https://doi.org/10.1046/j.1365-246X.2003.01917.x.
- Kreemer, C., G. Blewitt, E.C. Klein, 2014. A geodetic plate motion and Global Strain Rate Model in Geochemistry, Geophysics, Geosystems, v. 15, p. 3849-3889, https://doi.org/10.1002/2014GC005407.
- Meyer, B., Saltus, R., Chulliat, a., 2017. EMAG2: Earth Magnetic Anomaly Grid (2-arc-minute resolution) Version 3. National Centers for Environmental Information, NOAA. Model. https://doi.org/10.7289/V5H70CVX
- Müller, R.D., Sdrolias, M., Gaina, C. and Roest, W.R., 2008, Age spreading rates and spreading asymmetry of the world’s ocean crust in Geochemistry, Geophysics, Geosystems, 9, Q04006, https://doi.org/10.1029/2007GC001743
- Abercrombie, R.E., Antolik, M., Ekstrom, G., 2003. The June 2000 Mw 7.9 earthquakes south of Sumatra: Deformation in the India–Australia Plate. Journal of Geophysical Research 108, 16.
- Bassin, C., Laske, G. and Masters, G., The Current Limits of Resolution for Surface Wave Tomography in North America, EOS Trans AGU, 81, F897, 2000.
- Bock, Y., Prawirodirdjo, L., Genrich, J.F., Stevens, C.W., McCaffrey, R., Subarya, C., Puntodewo, S.S.O., Calais, E., 2003. Crustal motion in Indonesia from Global Positioning System measurements: Journal of Geophysical Research, v. 108, no. B8, 2367, doi: 10.1029/2001JB000324.
- Bothara, J., Beetham, R.D., Brunston, D., Stannard, M., Brown, R., Hyland, C., Lewis, W., Miller, S., Sanders, R., Sulistio, Y., 2010. General observations of effects of the 30th September 2009 Padang earthquake, Indonesia. Bulletin of the New Zealand Society for Earthquake Engineering 43, 143-173.
- Chlieh, M., Avouac, J.-P., Hjorleifsdottir, V., Song, T.-R.A., Ji, C., Sieh, K., Sladen, A., Hebert, H., Prawirodirdjo, L., Bock, Y., Galetzka, J., 2007. Coseismic Slip and Afterslip of the Great (Mw 9.15) Sumatra-Andaman Earthquake of 2004. Bulletin of the Seismological Society of America 97, S152-S173.
- Chlieh, M., Avouac, J.P., Sieh, K., Natawidjaja, D.H., Galetzka, J., 2008. Heterogeneous coupling of the Sumatran megathrust constrained by geodetic and paleogeodetic measurements: Journal of Geophysical Research, v. 113, B05305, doi: 10.1029/2007JB004981.
- DEPLUS, C. et al., 1998 – Direct evidence of active deformation in the eastern Indian oceanic plate, Geology.
- DYMENT, J., CANDE, S.C. & SINGH, S., 2007 – Oceanic lithosphere subducting beneath the Sunda Trench: the Wharton Basin revisited. European Geosciences Union General Assembly, Vienna, 15-20/05.
- Hayes, G. P., Wald, D. J., and Johnson, R. L., 2012. Slab1.0: A three-dimensional model of global subduction zone geometries in J. Geophys. Res., 117, B01302, doi:10.1029/2011JB008524.
- Hayes, G.P., Bernardino, Melissa, Dannemann, Fransiska, Smoczyk, Gregory, Briggs, Richard, Benz, H.M., Furlong, K.P., and Villaseñor, Antonio, 2013. Seismicity of the Earth 1900–2012 Sumatra and vicinity: U.S. Geological Survey Open-File Report 2010–1083-L, scale 1:6,000,000, https://pubs.usgs.gov/of/2010/1083/l/.
- Ishii, M., Shearer, P.M., Houston, H., Vidale, J.E., 2005. Extent, duration and speed of the 2004 Sumatra-Andaman earthquake imaged by the Hi-Net array. Nature 435, 933.
- JACOB, J., DYMENT, J., YATHEESH, V. & BHATTACHARYA, G.C., 2009 – Marine magnetic anomalies in the NE Indian Ocean: the Wharton and Central Indian basins revisited. European Geosciences Union General Assembly, Vienna, 19-24/04.
- Ji, C., D.J. Wald, and D.V. Helmberger, Source description of the 1999 Hector Mine, California earthquake; Part I: Wavelet domain inversion theory and resolution analysis, Bull. Seism. Soc. Am., Vol 92, No. 4. pp. 1192-1207, 2002.
- Kanamori, H., Rivera, L., Lee, W.H.K., 2010. Historical seismograms for unravelling a mysterious earthquake: The 1907 Sumatra Earthquake. Geophysical Journal International 183, 358-374.
- Konca, A.O., Avouac, J., Sladen, A., Meltzner, A.J., Sieh, K., Fang, P., Li, Z., Galetzka, J., Genrich, J., Chlieh, M., Natawidjaja, D.H., Bock, Y., Fielding, E.J., Ji, C., Helmberger, D., 2008. Partial Rupture of a Locked Patch of the Sumatra Megathrust During the 2007 Earthquake Sequence. Nature 456, 631-635.
- Kopp, H., 2011. The Java convergent margin: structure, seismogenesis and subduction processes in Geological Society, London, Special Publications 2011; v. 355; p. 111-137, doi: 10.1144/SP355.6
- Krabbenhoeft, A., Weinrebe, R.W., Kopp, H., Flueh, E.R., Ladage, S., Papenberg, C., Planert, L., and Djajadihardja, Y., 2010. Bathymetry of the Indonesian Sunda margin-relating morphological features of the upper plate slopes to the location and extent of the seismogenic zone in NHESS, v. 10, p. 1899-1911, doi:10.5194/nhess-10-1899-2010
- Lasitha, S., Radhakrishna, M., Sanu, T.D., 2006. Seismically active deformation in the Sumatra–Java trench-arc region: geodynamic implications in Current Science, v. 90, p. 690-696.
- Maus, S., et al., 2009. EMAG2: A 2–arc min resolution Earth Magnetic Anomaly Grid compiled from satellite, airborne, and marine magnetic measurements, Geochem. Geophys. Geosyst., 10, Q08005, doi:10.1029/2009GC002471.
- Malik, J.N., Shishikura, M., Echigo, T., Ikeda, Y., Satake, K., Kayanne, H., Sawai, Y., Murty, C.V.R., Dikshit, D., 2011. Geologic evidence for two pre-2004 earthquakes during recent centuries near Port Blair, South Andaman Island, India: Geology, v. 39, p. 559-562.
- Meltzner, A.J., Sieh, K., Chiang, H., Shen, C., Suwargadi, B.W., Natawidjaja, D.H., Philobosian, B., Briggs, R.W., Galetzka, J., 2010. Coral evidence for earthquake recurrence and an A.D. 1390–1455 cluster at the south end of the 2004 Aceh–Andaman rupture. Journal of Geophysical Research 115, 1-46.
- Meng, L., Ampuero, J.-P., Stock, J., Duputel, Z., Luo, Y., and Tsai, V.C., 2012. Earthquake in a Maze: Compressional Rupture Branching During the 2012 Mw 8.6 Sumatra Earthquake in Science, v. 337, p. 724-726.
- Natawidjaja, D.H., Sieh, K., Chlieh, M., Galetzka, J., Suwargadi, B., Cheng, H., Edwards, R.L., Avouac, J., Ward, S.N., 2006. Source parameters of the great Sumatran megathrust earthquakes of 1797 and 1833 inferred from coral microatolls. Journal of Geophysical Research 111, 37.
- Newcomb, K.R., McCann, W.R., 1987. Seismic History and Seismotectonics of the Sunda Arc. Journal of Geophysical Research 92, 421-439.
- Philibosian, B., Sieh, K., Natawidjaja, D.H., Chiang, H., Shen, C., Suwargadi, B., Hill, E.M., Edwards, R.L., 2012. An ancient shallow slip event on the Mentawai segment of the Sunda megathrust, Sumatra. Journal of Geophysical Research 117, 12.
- Prawirodirdjo, P., McCaffrey,R., Chadwell, D., Bock, Y, and Subarya, C., 2010. Geodetic observations of an earthquake cycle at the Sumatra subduction zone: Role of interseismic strain segmentation, JOURNAL OF GEOPHYSICAL RESEARCH, v. 115, B03414, doi:10.1029/2008JB006139
- Rivera, L., Sieh, K., Helmberger, D., Natawidjaja, D.H., 2002. A Comparative Study of the Sumatran Subduction-Zone Earthquakes of 1935 and 1984. BSSA 92, 1721-1736.
- Shearer, P., and Burgmann, R., 2010. Lessons Learned from the 2004 Sumatra-Andaman Megathrust Rupture, Annu. Rev. Earth Planet. Sci. v. 38, pp. 103–31
- SATISH C. S, CARTON H, CHAUHAN A.S., et al., 2011 – Extremely thin crust in the Indian Ocean possibly resulting from Plume-Ridge Interaction, Geophysical Journal International.
- Sieh, K., Natawidjaja, D.H., Meltzner, A.J., Shen, C., Cheng, H., Li, K., Suwargadi, B.W., Galetzka, J., Philobosian, B., Edwards, R.L., 2008. Earthquake Supercycles Inferred from Sea-Level Changes Recorded in the Corals of West Sumatra. Science 322, 1674-1678.
- Singh, S.C., Carton, H.L., Tapponnier, P, Hananto, N.D., Chauhan, A.P.S., Hartoyo, D., Bayly, M., Moeljopranoto, S., Bunting, T., Christie, P., Lubis, H., and Martin, J., 2008. Seismic evidence for broken oceanic crust in the 2004 Sumatra earthquake epicentral region, Nature Geoscience, v. 1, pp. 5.
- Smith, W.H.F., Sandwell, D.T., 1997. Global seafloor topography from satellite altimetry and ship depth soundings: Science, v. 277, p. 1,957-1,962.
- Sorensen, M.B., Atakan, K., Pulido, N., 2007. Simulated Strong Ground Motions for the Great M 9.3 Sumatra–Andaman Earthquake of 26 December 2004. BSSA 97, S139-S151.
- Subarya, C., Chlieh, M., Prawirodirdjo, L., Avouac, J., Bock, Y., Sieh, K., Meltzner, A.J., Natawidjaja, D.H., McCaffrey, R., 2006. Plate-boundary deformation associated with the great Sumatra–Andaman earthquake: Nature, v. 440, p. 46-51.
- Tolstoy, M., Bohnenstiehl, D.R., 2006. Hydroacoustic contributions to understanding the December 26th 2004 great Sumatra–Andaman Earthquake. Survey of Geophysics 27, 633-646.
- Zhu, Lupei, and Donald V. Helmberger. “Advancement in source estimation techniques using broadband regional seismograms.” Bulletin of the Seismological Society of America 86.5 (1996): 1634-1641.
References:
Basic & General References
Specific References
Return to the Earthquake Reports page.