Earlier today there was a shallow M 6.4 earthquake with an epicenter on the island of Lombok, Indonesia. With a hypocentral depth of about 7.5 km, this size of an earthquake can be quite damaging. The USGS PAGER estimate of impact suggests that there is about a 10% chance that there are more than 10 fatalities. Hopefully there are none. There have been several aftershocks, two M > 5.
This earthquake is probably along a thrust fault associated with the Flores thrust fault, a north vergent (dipping into the earth in a southerly direction) back thrust fault to the Sunda subduction zone fault. The Flores thrust possibly extends from east of Timor on the east to the northern shore of Java (McCaffrey and Nabelek, 1987). Others suggest that the Flores thrust ends at a cross fault just east of Lombok (Hengresh and Whitney, 2016). However, the seismic profiles from Silver et al. (1986) are convincing that there are east-west compressional structures extending between the northern shore of Java to where the Flores thrust is mapped.
Detailed mapping of the seafloor to the east of Lombok, north of the island of Sumbawa, reveals that there are imbricate (overlapping) thrust faults (Silver et al., 1986). I think that it is reasonable to presume that there are similar structures on the northern flank of Lombok.
Lombok is also a volcano complex as part of the Sunda magmatic arc. There may be fault systems associated with the volcanic activity. I include tectonic faults that are included in the global scale fault data set from the Coordinating Committee for Geoscience Programme in East and Southeast Asia. The most active volcano on Lombok is the Rinjani volcano. Here is a great place to learn about this volcano (the Volcano Discovery website).
If the M 6.4 earthquake was on the Flores fault, it would need to dip at about 10°. The Flores thrust fault proposed by Hengesh and Whitney (2016) has a much steeper dip. So this sequence is probably in the upper plate somewhere.
There was a M 6.0 earthquake to the east of the M 6.4, but it was much deeper (almost 600 km), so is unlikely to be genetically related to the M 6.4 sequence.
Magnetic Anomalies
- In the map below, I include a transparent overlay of the magnetic anomaly data from EMAG2 (Meyer et al., 2017). As oceanic crust is formed, it inherits the magnetic field at the time. At different points through time, the magnetic polarity (north vs. south) flips, the north pole becomes the south pole. These changes in polarity can be seen when measuring the magnetic field above oceanic plates. This is one of the fundamental evidences for plate spreading at oceanic spreading ridges (like the Gorda rise).
- Regions with magnetic fields aligned like today’s magnetic polarity are colored red in the EMAG2 data, while reversed polarity regions are colored blue. Regions of intermediate magnetic field are colored light purple.
- We can see the roughly east-west trends of these red and blue stripes. These lines are parallel to the ocean spreading ridges from where they were formed. The stripes disappear at the subduction zone because the oceanic crust with these anomalies is diving deep beneath the Sunda plate (part of Eurasia), so the magnetic anomalies from the overlying Sunda plate mask the evidence for the Australia plate.
Historic Seismicity
- Below I discuss analogues to today’s M 6.4 earthquake.
- To the west, between Lombok and Bali, there was a series of earthquakes all in 1979. They happened several months apart, but had a similar magnitude and orientation. The hypocentral depths were in the 25-40 km depth range, so some of these may have been on the Flores thrust system. These alone suggest that the Flores thrust extends at least this far west.
- To the east, along the eastern part of Sumbawa, there was a series of earthquakes in the first decade of the 21st century, from 2002-2009. These also all share a similar magnitude range and orientation. These earthquakes all happened within a narrow range of depths (18-20 km; though the 2002 earthquake has a default depth on 10 km).
- Based on earthquakes in the regions to the east and to the west, it is possible that this M 6.4 is the first of a series of mid M 6 earthquakes (either within a year like in Bali or over several years like Sumbawa).
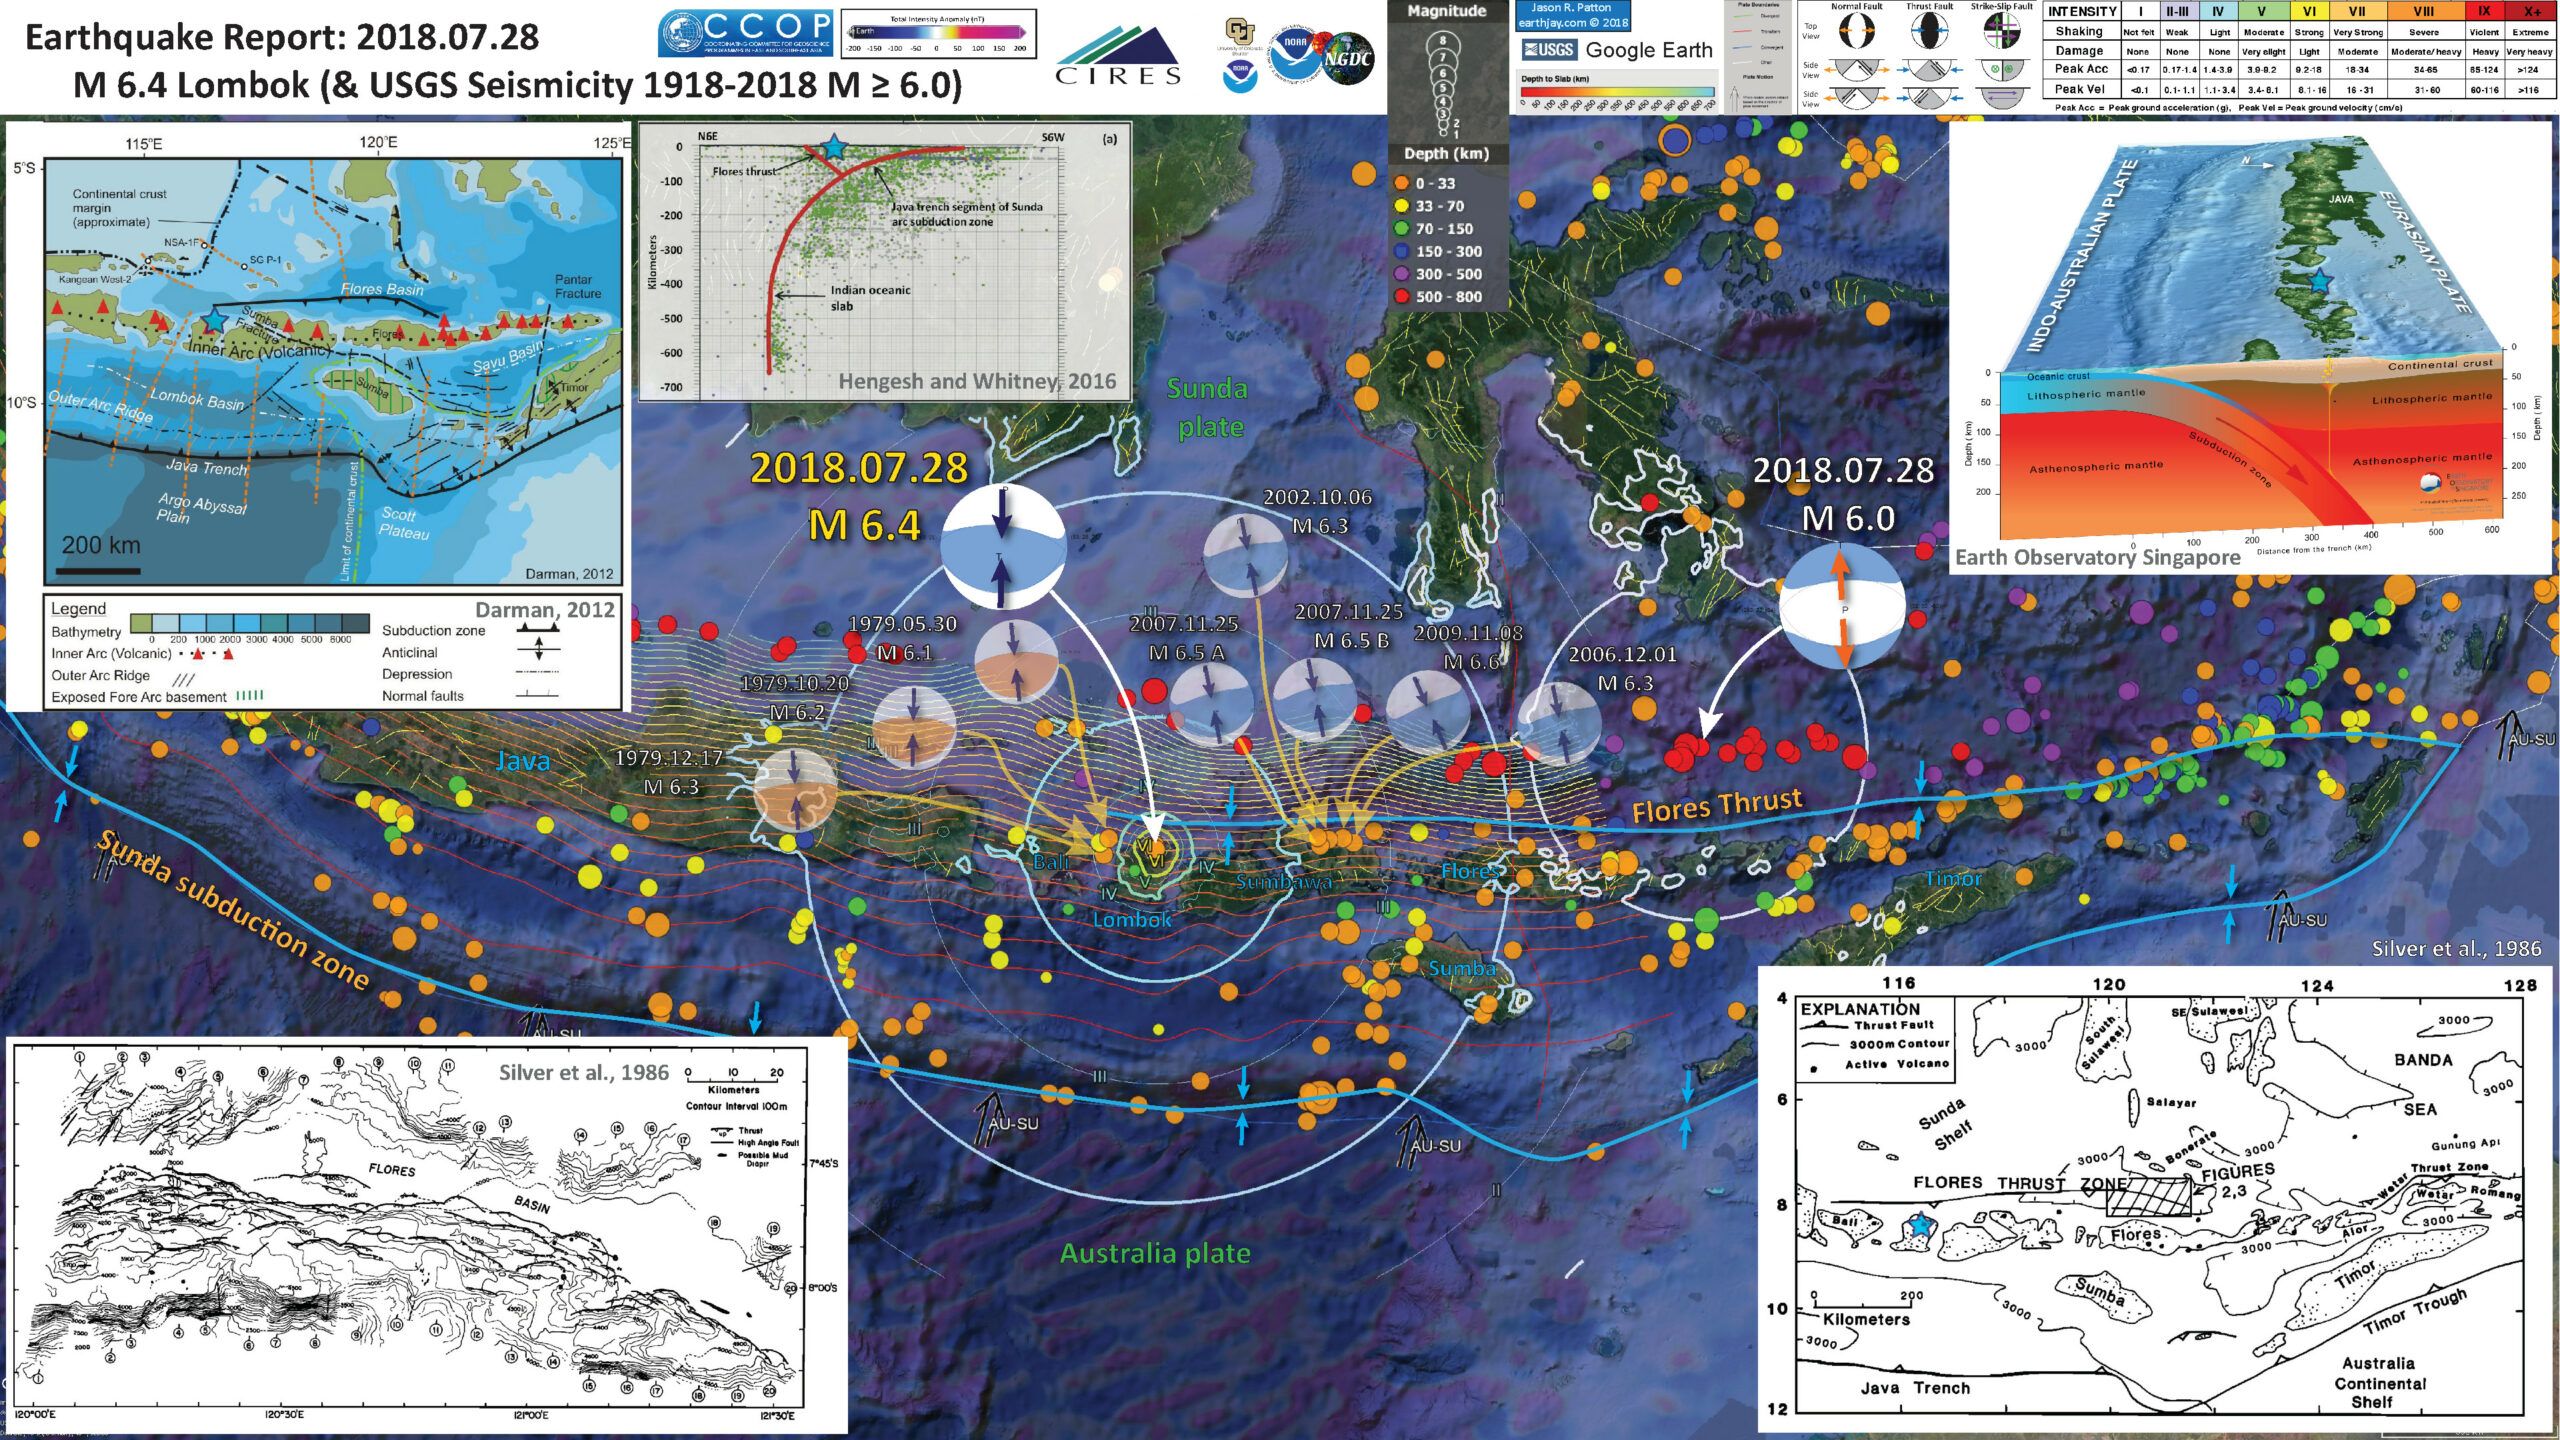
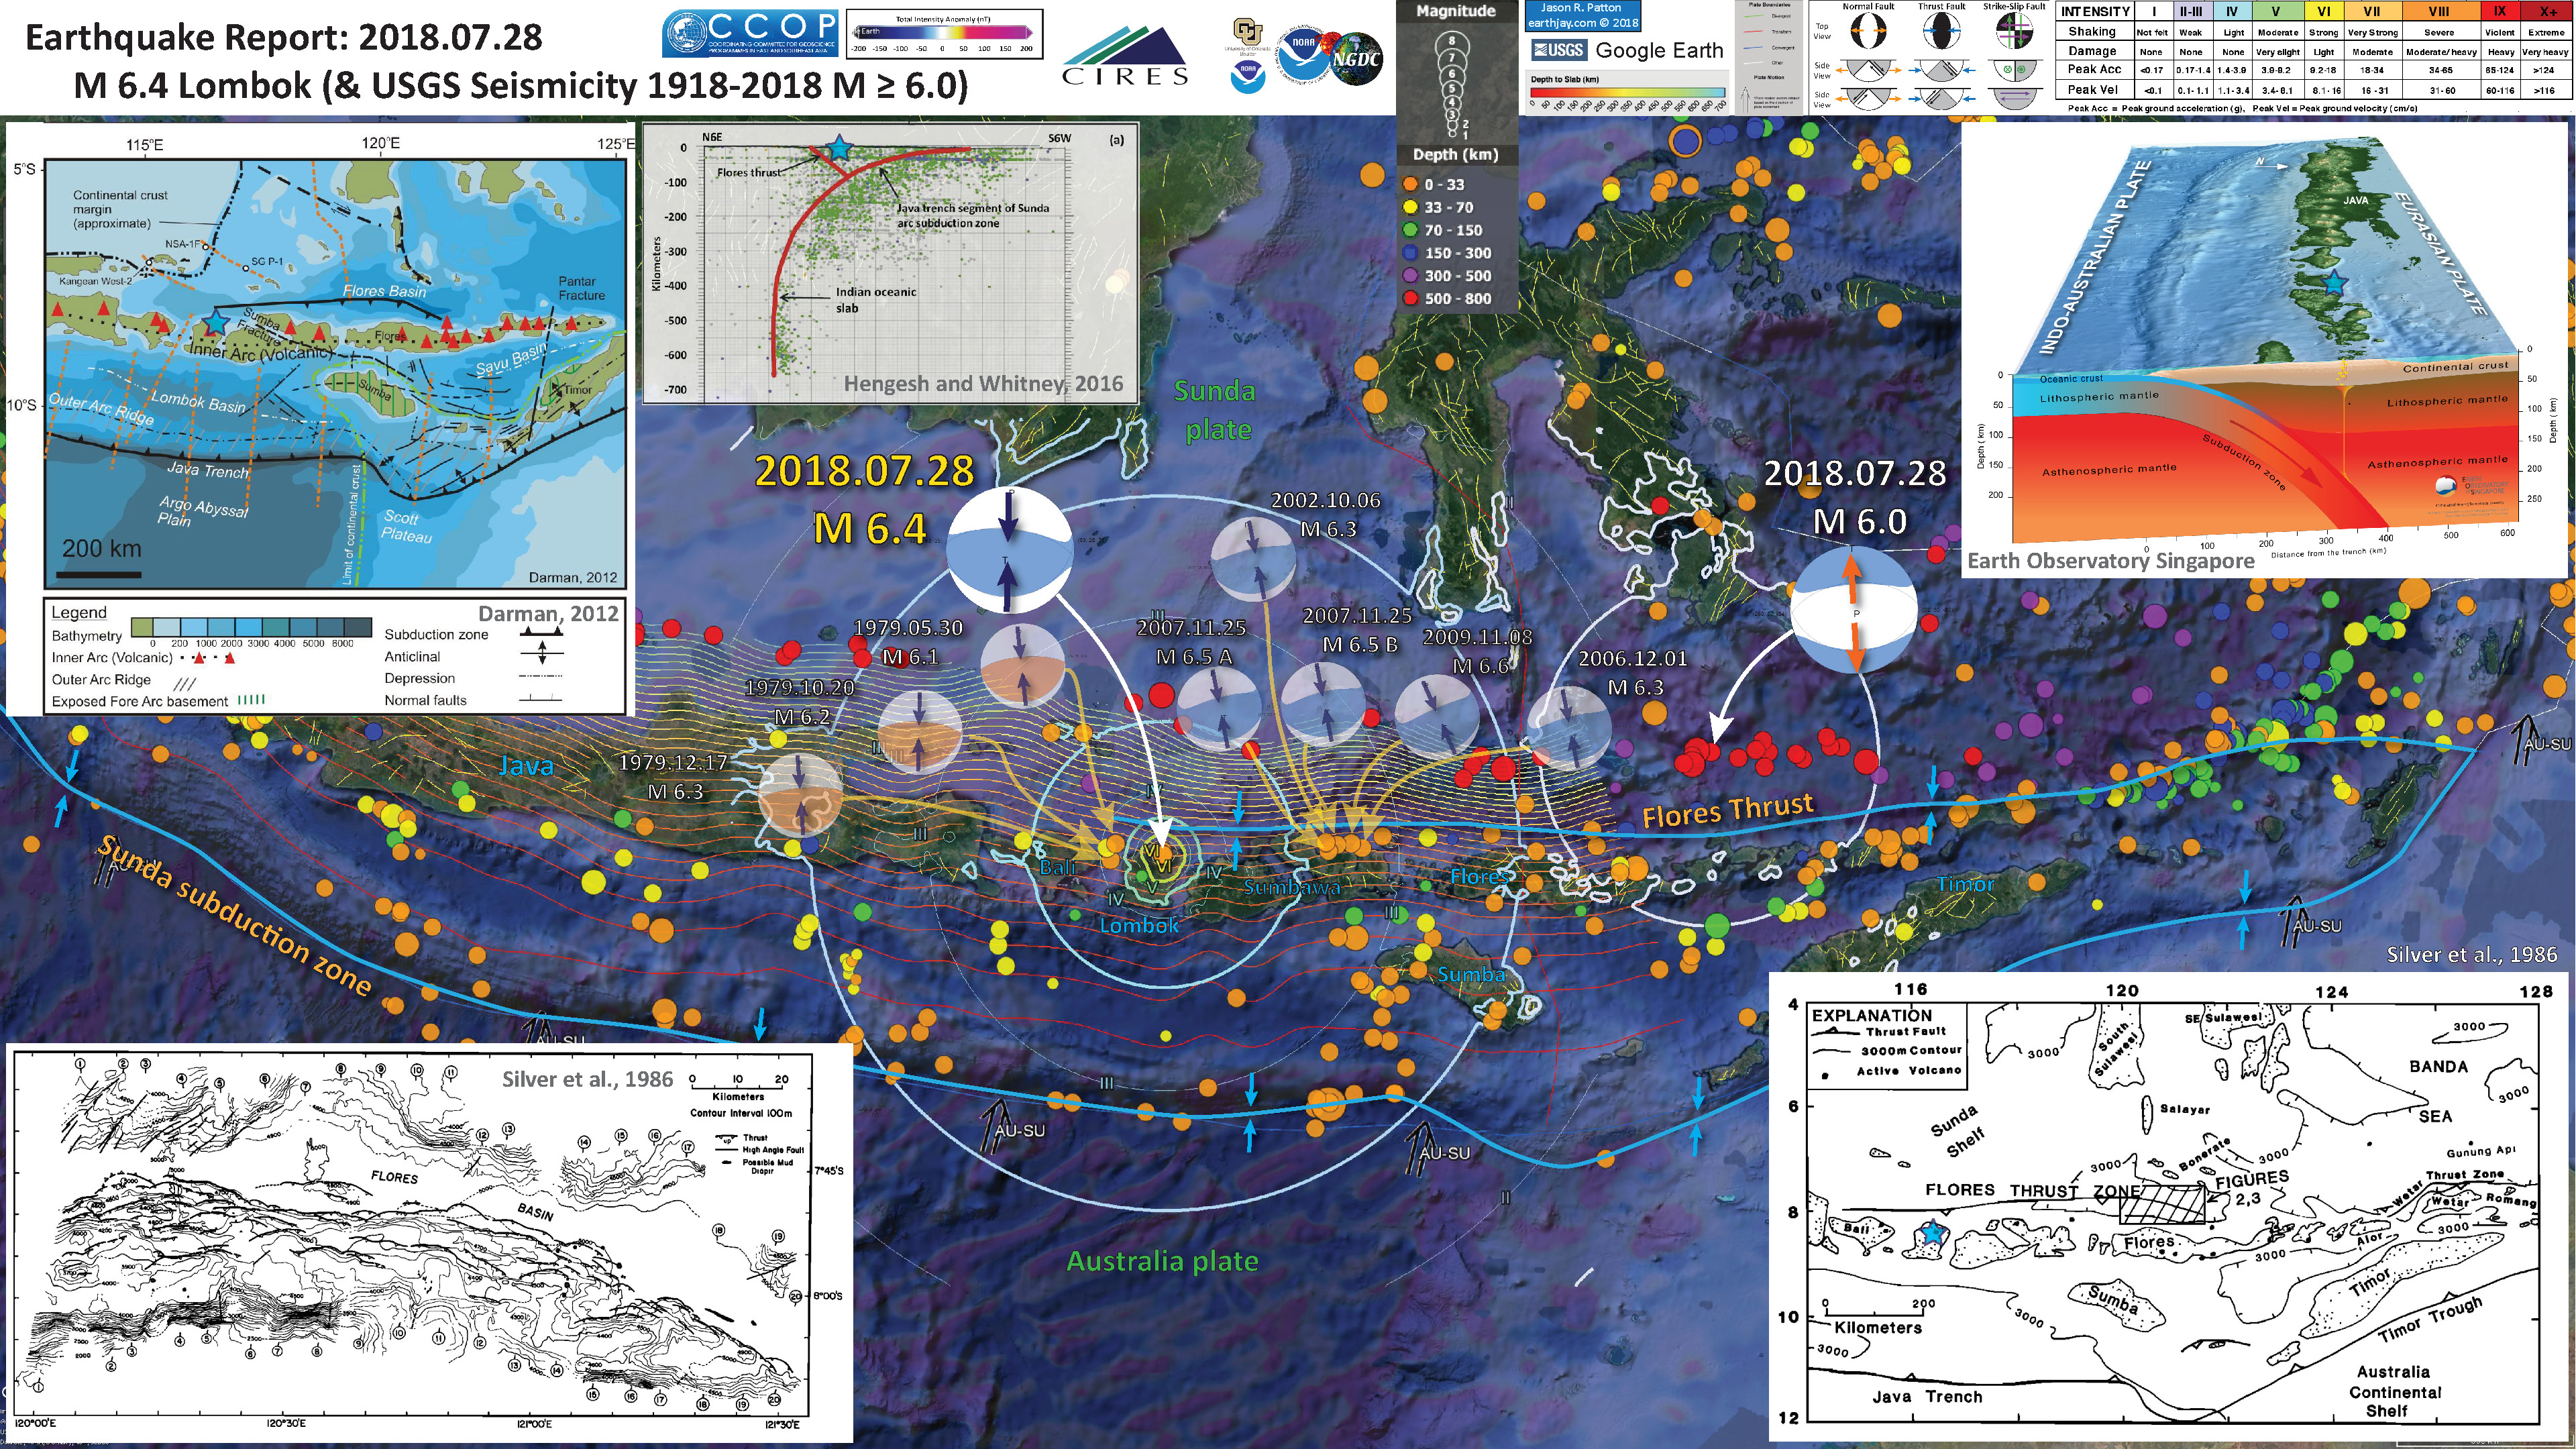
Below is my interpretive poster for this earthquake
I plot the seismicity from the past month, with color representing depth and diameter representing magnitude (see legend). I include earthquake epicenters from 1918-2018 with magnitudes M ≥ 6.0.
I plot the USGS fault plane solutions (moment tensors in blue and focal mechanisms in orange), possibly in addition to some relevant historic earthquakes.
- I placed a moment tensor / focal mechanism legend on the poster. There is more material from the USGS web sites about moment tensors and focal mechanisms (the beach ball symbols). Both moment tensors and focal mechanisms are solutions to seismologic data that reveal two possible interpretations for fault orientation and sense of motion. One must use other information, like the regional tectonics, to interpret which of the two possibilities is more likely.
- I also include the shaking intensity contours on the map. These use the Modified Mercalli Intensity Scale (MMI; see the legend on the map). This is based upon a computer model estimate of ground motions, different from the “Did You Feel It?” estimate of ground motions that is actually based on real observations. The MMI is a qualitative measure of shaking intensity. More on the MMI scale can be found here and here. This is based upon a computer model estimate of ground motions, different from the “Did You Feel It?” estimate of ground motions that is actually based on real observations.
- I include the slab contours plotted (Hayes et al., 2012), which are contours that represent the depth to the subduction zone fault. These are mostly based upon seismicity. The depths of the earthquakes have considerable error and do not all occur along the subduction zone faults, so these slab contours are simply the best estimate for the location of the fault.
-
I include some inset figures.
- In the upper right corner is a low angle oblique view of the Sunda subduction zone beneath Java, Bali, Lombok, and Sumbawa (from Earth Observatory Singapore). I place a blue star in the general location of today’s earthquake’s epicenter (as for all figures here). The India-Australia plate is subducting northwards beneath the Sunda plate (part of the Eurasia plate).
- In the upper left corner is a plate tectonic map showing the major fault systems, volcanic arc islands, and oceanic plateaus and basins of the region (Darman, 2012). The map shows the Flores thrust extending as far west as Lombok. Compare the complicated tectonics in the eastern portion of this region compared to the western portion of this region.
- To the right of the Darman (2012) map is a cross section of seismicity presented by Hengresh and Whitney (2016). These authors argue for a north vergent Flores thrust in this region, though most of their work was on the subduction/collision zone.
- In the lower right corner is another, earlier, tectonic map from Silver et al. (1986). These authors use seismic reflection and multibeam bathymetry data to map the Flores thrust as far as Java, west of Bali. The location for the map in the lower left corner of this interpretive poster is outlined here as a dashed line rectangle.
- In the lower left corner is a map from Silver et al. (1986) that shows the detailed mapping of imbricate north (and some south) vergent thrust faults.
- Here is the same map but with seismicity from the past month.

- Here is the same map but with historic seismicity.
USGS Earthquake Pages
- 2018-07-28 17:07:23 UTC M 6.0
- 2018-07-28 22:47:37 UTC M 6.4
- 2018-07-28 23:06:49 UTC M 5.4
- 2018-07-29 01:50:32 UTC M 5.3
These are from this current sequence
These are from earlier
Other Report Pages
Some Relevant Discussion and Figures
- Below is a map showing historic seismicity (Jones et al., 2014). Cross sections B-B’ and C-C’ are shown. The seismicity for the cross sections below are sourced from within each respective rectangle.
- Here are the seismcity cross sections.


- Here is the map from McCaffrey and Nabelek (1987). They used seismic reflection profiles, gravity modeling along these profiles, seismicity, and earthquake source mechanism analyses to support their interpretations of the structures in this region.

Tectonic and geographic map of the eastern Sunda arc and vicinity. Active volcanoes are represented by triangles, and bathymetric contours are in kilometers. Thrust faults are shown with teeth on the upper plate. The dashed box encloses the study area.
- Here is the Audley (2011) cross section showing how the backthrust relates to the subduction zone beneath Timor. I include their figure caption in blockquote below.

Cartoon cross section of Timor today, (cf. Richardson & Blundell 1996, their BIRPS figs 3b, 4b & 7; and their fig. 6 gravity model 2 after Woodside et al. 1989; and Snyder et al. 1996 their fig. 6a). Dimensions of the filled 40 km deep present-day Timor Tectonic Collision Zone are based on BIRPS seismic, earthquake seismicity and gravity data all re-interpreted here from Richardson & Blundell (1996) and from Snyder et al. (1996). NB. The Bobonaro Melange, its broken formation and other facies are not indicated, but they are included with the Gondwana mega-sequence. Note defunct Banda Trench, now the Timor TCZ, filled with Australian continental crust and Asian nappes that occupy all space between Wetar Suture and the 2–3 km deep deformation front north of the axis of the Timor Trough. Note the much younger decollement D5 used exactly the same part of the Jurassic lithology of the Gondwana mega-sequence in the older D1 decollement that produced what appears to be much stronger deformation.
- This are the seismicity cross sections from Hangesh and Whitney (2016). These are shown to compare the subduction zone offshore of Java and the collision zone in the Timor region.

Comparison of hypocentral profiles across the (a) Java subduction zone and (b) Timor collision zone (paleo-Banda trench). Catalog compiled from multiple reporting agencies listed in Table 1. Events of Mw>4.0 are shown for period 1815 to 2015.
- Here is a map of the same general area from Silver et al. (1986), used here to locate the following large scale map.

Location of SeaMARC II survey (Plate 1 and Figures 2) and geographic features discussed in text. Triangles on upper plates of thrust zones.
- This is the large scale map showing the detailed thrust fault mapping (Silver et al., 1986).
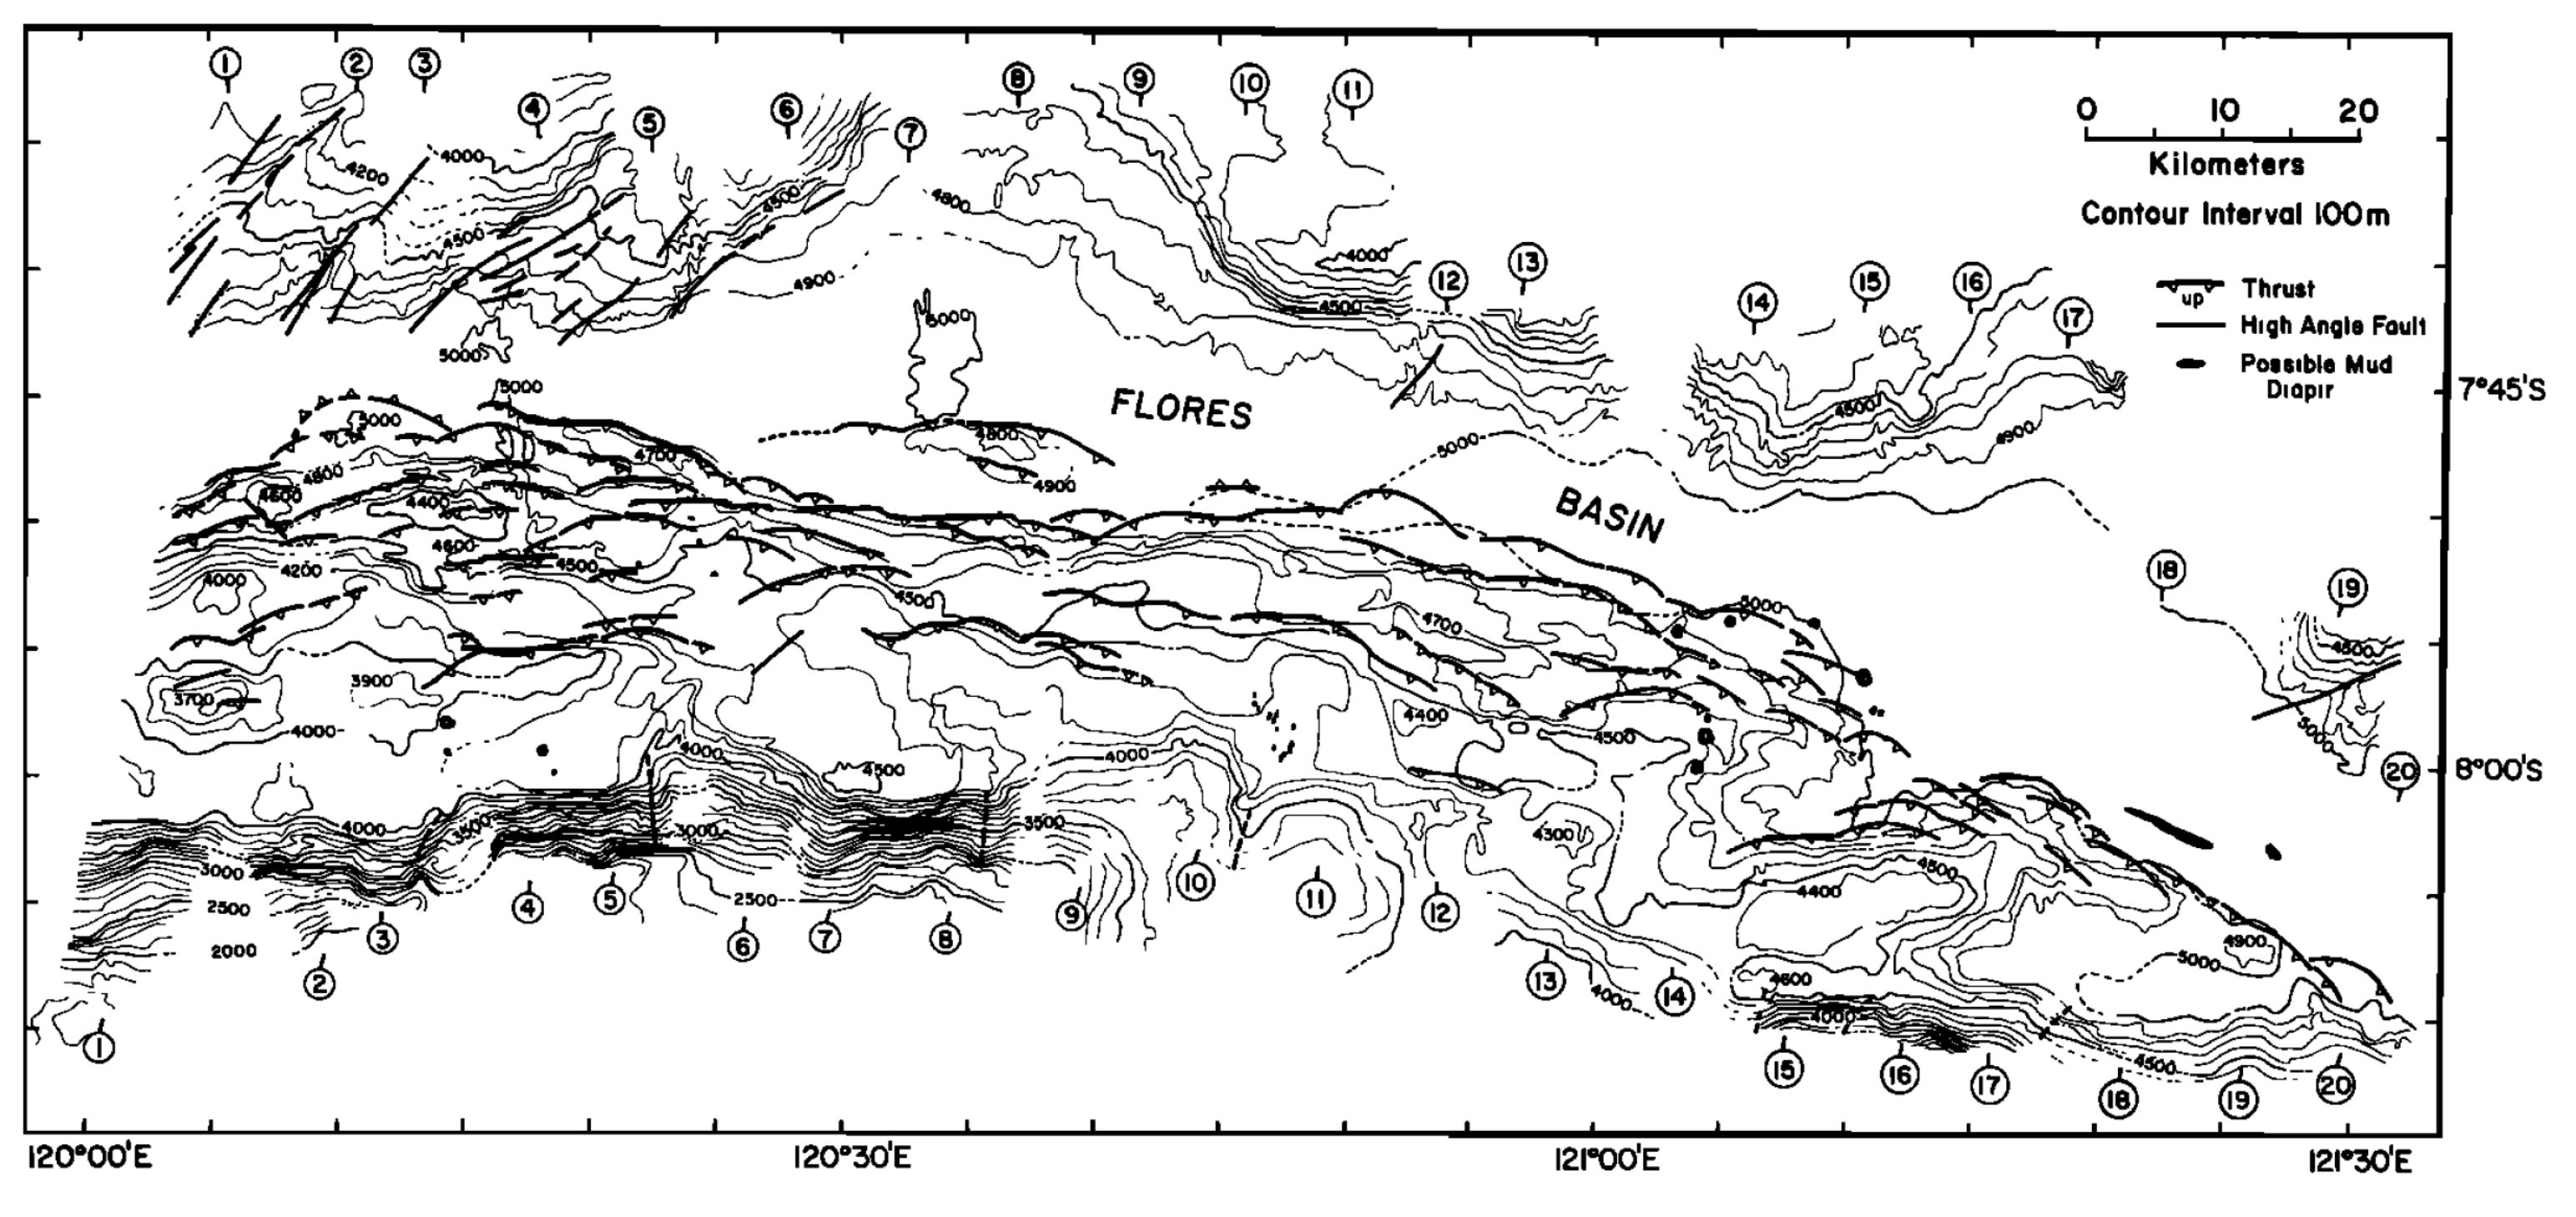
Bathymetry, faults, and mud diapirs of the central Flores thrust zone, based on interpretation of SeaMARC II data and seismic reflection profiles. Shown also are locations (circled numbers) of all seismic profiles. Mud diapirs are solid black. Triangles on upper plates of thrust faults.
- Here is the tectonic map from Hangesh and Whitney (2016).

Illustration of major tectonic elements in triple junction geometry: tectonic features labeled per Figure 1; seismicity from ISC-GEM catalog [Storchak et al., 2013]; faults in Savu basin from Rigg and Hall [2011] and Harris et al. [2009]. Purple line is edge of Australian continental basement and fore arc [Rigg and Hall, 2011]. Abbreviations: AR = Ashmore Reef; SR = Scott Reef; RS = Rowley Shoals; TCZ = Timor Collision Zone; ST = Savu thrust; SB = Savu Basin; TT = Timor thrust; WT =Wetar thrust; WASZ = Western Australia Shear Zone. Open arrows indicate relative direction of motion; solid arrows direction of vergence.
- Here are some focal mechanisms from earthquakes in the region from Hangesh and Whitney (2016). Symbol color represents depth.

(a) Focal mechanism solutions for the study region. The focal mechanisms are classified based on depth intervals to illustrate the style of faulting within the different structural domains. Note (b) sinistral reverse motion along Timor trough, (c) subduction related pattern along Java trench, and dextral solutions along the western Australia extended margin (Figure 4a) north of 20°S. Centroid moment tensor (CMT) solutions [Dziewonski et al., 1981] are from the CMT project [Ekström et al., 2012; http://www.globalcmt.org/CMTcite.html] for events of Mw>5.0 for the period 1976 onward.
- Here is a figure showing the regional geodetic motions (Bock et al., 2003). I include their figure caption below as a blockquote.

Topographic and tectonic map of the Indonesian archipelago and surrounding region. Labeled, shaded arrows show motion (NUVEL-1A model) of the first-named tectonic plate relative to the second. Solid arrows are velocity vectors derived from GPS surveys from 1991 through 2001, in ITRF2000. For clarity, only a few of the vectors for Sumatra are included. The detailed velocity field for Sumatra is shown in Figure 5. Velocity vector ellipses indicate 2-D 95% confidence levels based on the formal (white noise only) uncertainty estimates. NGT, New Guinea Trench; NST, North Sulawesi Trench; SF, Sumatran Fault; TAF, Tarera-Aiduna Fault. Bathymetry [Smith and Sandwell, 1997] in this and all subsequent figures contoured at 2 km intervals.
- This map from Hangesh and Whitney (2016) shows the GPS velocities in this region. Note the termination of the Flores thrust and the north-northeast striking (oriented) cross fault between Lombok and Sumbawa.

GPS velocities of Sunda and Banda arc region. Large black and grey arrow shows motion of Australia relative to Eurasia [DeMets et al., 1994]. Thin black arrows show GPS velocities of Sunda and Banda arc regions relative to Australia [Nugroho et al., 2009]. Seismicity from ISC-GEM catalog [Storchak et al., 2013]. Note reduction of station velocities from west to east indicating progressive coupling of the Banda arc to the Australian plate compared to the area along the Sunda arc.
Geologic Fundamentals
- For more on the graphical representation of moment tensors and focal mechnisms, check this IRIS video out:
- Here is a fantastic infographic from Frisch et al. (2011). This figure shows some examples of earthquakes in different plate tectonic settings, and what their fault plane solutions are. There is a cross section showing these focal mechanisms for a thrust or reverse earthquake. The upper right corner includes my favorite figure of all time. This shows the first motion (up or down) for each of the four quadrants. This figure also shows how the amplitude of the seismic waves are greatest (generally) in the middle of the quadrant and decrease to zero at the nodal planes (the boundary of each quadrant).

- There are three types of earthquakes, strike-slip, compressional (reverse or thrust, depending upon the dip of the fault), and extensional (normal). Here is are some animations of these three types of earthquake faults. The following three animations are from IRIS.
Strike Slip:
Compressional:
Extensional:
- This is an image from the USGS that shows how, when an oceanic plate moves over a hotspot, the volcanoes formed over the hotspot form a series of volcanoes that increase in age in the direction of plate motion. The presumption is that the hotspot is stable and stays in one location. Torsvik et al. (2017) use various methods to evaluate why this is a false presumption for the Hawaii Hotspot.
- Here is a map from Torsvik et al. (2017) that shows the age of volcanic rocks at different locations along the Hawaii-Emperor Seamount Chain.

A cutaway view along the Hawaiian island chain showing the inferred mantle plume that has fed the Hawaiian hot spot on the overriding Pacific Plate. The geologic ages of the oldest volcano on each island (Ma = millions of years ago) are progressively older to the northwest, consistent with the hot spot model for the origin of the Hawaiian Ridge-Emperor Seamount Chain. (Modified from image of Joel E. Robinson, USGS, in “This Dynamic Planet” map of Simkin and others, 2006.)

Hawaiian-Emperor Chain. White dots are the locations of radiometrically dated seamounts, atolls and islands, based on compilations of Doubrovine et al. and O’Connor et al. Features encircled with larger white circles are discussed in the text and Fig. 2. Marine gravity anomaly map is from Sandwell and Smith.
- M 9.2 Andaman-Sumatra subduction zone 2014 Earthquake Anniversary
- M 9.2 Andaman-Sumatra subduction zone SASZ Fault Deformation
- M 9.2 Andaman-Sumatra subduction zone 2016 Earthquake Anniversary
- 2018.07.28 M 6.4 Lombok, Indonesia
- 2017.12.15 M 6.5 Java
- 2017.08.31 M 6.3 Mentawai, Sumatra
- 2017.08.13 M 6.4 Bengkulu, Sumatra, Indonesia
- 2017.05.29 M 6.8 Sulawesi, Indonesia
- 2017.03.14 M 6.0 Sumatra
- 2017.03.01 M 5.5 Banda Sea
- 2016.10.19 M 6.6 Java
- 2016.03.02 M 7.8 Sumatra/Indian Ocean
- 2015.07.22 M 5.8 Andaman Sea
- 2015.11.08 M 6.4 Nicobar Isles
- 2012.04.11 M 8.6 Sumatra outer rise
- 2004.12.26 M 9.2 Andaman-Sumatra subduction zone
Indonesia | Sumatra Earthquake Reports
General Overview
Earthquake Reports
Social Media
Map and cross-section of historical seismicity of the area around the deadly M6.4 earthquake on Lombok Island, Indonesia, that occurred a few days ago. The Flores Backarc Thrust has been suggested as a possible causative fault. pic.twitter.com/sxxLMT4Kep
— Jascha Polet (@CPPGeophysics) July 30, 2018
The latest update about our response in #Lombok earthquake (29/7/2018) #PMISiapBantu pic.twitter.com/apZyv9dSH7
— Indonesian Red Cross (@palangmerah) July 29, 2018
#UPDATE Death toll rises to 13, with hundreds injured, after a powerful M6.4 #earthquake struck popular tourist island of #Lombok in Indonesia early morning
pic.twitter.com/drvvxcZAis— Bali Promotion Center💅 (@translatorbali) July 29, 2018
A 6.4 magnitude earthquake had hit Lombok and Sumbawa Islands today, killing at least 10, including a Malaysian. Here is a footage from Mt Rinjani. Our thoughts and prayers are with them. pic.twitter.com/hZ2zc4tV70
— | outdoorian (@twt_outdoor) July 29, 2018
BBC News – Indonesia earthquake: 10 dead on tourist island Lombok https://t.co/mC1ytJrsfV
— Anthony Lomax 🌍🇪🇺 (@ALomaxNet) July 29, 2018
Deadly #earthquake in #Lombok, #Indonesia – Link to our in-depth article – https://t.co/Dex2gm12Wh pic.twitter.com/KgiqYvUHSO
— Armand Vervaeck 🎗️ (@ArmandVervaeck) July 29, 2018
Surveying the damage in Lombok after a powerful earthquake hit the popular tourist destination in Indonesiahttps://t.co/WIi1D8YuK5 pic.twitter.com/myRoTCMguy
— BBC News (World) (@BBCWorld) July 29, 2018
Mw=6.5, SUMBAWA REGION, INDONESIA (Depth: 14 km), 2018/07/28 22:47:37 UTC – Full details here: https://t.co/3sCPDO5xqv pic.twitter.com/3yeO7KZrnk
— Earthquakes (@geoscope_ipgp) July 28, 2018
Korban gempa Sembalun Lombok Timur pic.twitter.com/wdug832T8M
— #2019GantiPresiden (@IpungLombok) July 28, 2018
Beberapa kondisi bangunan setelah Gempa di Lombok. Semoga tidak ada korban jiwa 🙏🏻 pic.twitter.com/kz4E9gm98O
— baiq tanisya ellya m (@tanisyaEM) July 28, 2018
🇮🇩💢#Indonesia #Earthquake Mw 6.4 depth 10 km Lombok Región.
-El Sismo ha destruido viviendas como era probable , especialmente las de Construcción no asísmica. #PrayforIndonesia 🙏 pic.twitter.com/jWDzUSAUiB— 🌎 (@Geo__Data) July 28, 2018
Estimated population in the felt area: 3.7 millions inhabitants pic.twitter.com/GcP4108N8u
— EMSC (@LastQuake) July 28, 2018
strong #earthquake on #Lombok, #Indonesia, well felt on #Bali, #Sumbawa, damage expected pic.twitter.com/8yft7KEZmN
— CATnews (@CATnewsDE) July 28, 2018
Wake up in the morning with the shaking bed !
Got called from farm and so many facility broke down..#agendafreetv #lombok #earthquake pic.twitter.com/GbANUMLpxW
— Reyn (@suharja_reynard) July 28, 2018
#Earthquake_alert – The impact of 7/29/18 – 06:47 local time Mag 6.4 SR quake at 28 km NW of East Lombok w/ 10 km hypocenter, some structures & houses are damaged in Sambelia, East Lombok. The BPBD is still collecting the data. Source: @Sutopo_PN #Lombok pic.twitter.com/EewC7iPDQ4 https://t.co/bH7VHxVjFL
— Desianto F. Wibisono (@TDesiantoFW) July 29, 2018
#UPDATE Death toll rises to 10, with 40 injured, after a powerful M6.4 #earthquake struck popular tourist island of #Lombok in Indonesia early morning pic.twitter.com/gpojRbC5iI
— CGTN (@CGTNOfficial) July 29, 2018
At least 3 killed after powerful 6.4-magnitude earthquake strikes off Indonesian island of #Lombok https://t.co/rgma2EEZe9 pic.twitter.com/3sOESVHmjM
— The Straits Times (@STcom) July 29, 2018
Sorry to say that reports of casualties are starting to filter through from the 6.4 magnitude #Lombok #Earthquake this morning, updates to come #LombokEarthquake https://t.co/w93y8aIOvj
— Alison Bevege (@AlisonBevege) July 29, 2018
Thinking of many friends in #Lombok … never a dull moment https://t.co/8eaPNQljQr
— Krista Slade (@krista_slade) July 29, 2018
#Update Indonesia's disaster response agency spokesman says 10 were dead, 40 injured after a M6.4 earthquake struck popular tourist island of #Lombok in Indonesia early morning. pic.twitter.com/CTjub5UG7A
— China Daily (@ChinaDailyUSA) July 29, 2018
Powerful #Earthquake hits #Indonesia's #Lombok, 10 killed, houses damagedhttps://t.co/6ae6C4mNuB — https://t.co/qIz2A1IP5X pic.twitter.com/fwgcXfjeBX
— Z9 (@Z9Network) July 29, 2018
- Audley-Charles, M.G., 1986. Rates of Neogene and Quaternary tectonic movements in the Southern Banda Arc based on micropalaeontology in: Journal of fhe Geological Society, London, Vol. 143, 1986, pp. 161-175.
- Audley-Charles, M.G., 2011. Tectonic post-collision processes in Timor, Hall, R., Cottam, M. A. &Wilson, M. E. J. (eds) The SE Asian Gateway: History and Tectonics of the Australia–Asia Collision. Geological Society, London, Special Publications, 355, 241–266.
- Baldwin, S.L., Fitzgerald, P.G., and Webb, L.E., 2012. Tectonics of the New Guinea Region in Annu. Rev. Earth Planet. Sci., v. 41, p. 485-520.
- Benz, H.M., Herman, Matthew, Tarr, A.C., Hayes, G.P., Furlong, K.P., Villaseñor, Antonio, Dart, R.L., and Rhea, Susan, 2011. Seismicity of the Earth 1900–2010 New Guinea and vicinity: U.S. Geological Survey Open-File Report 2010–1083-H, scale 1:8,000,000.
- Darman, H., 2012. Seismic Expression of Tectonic Features in the Lesser Sunda Islands, Indonesia in Berita Sedimentologi, Indonesian Journal of Sedimentary Geology, no. 25, po. 16-25.
- Hall, R., 2011. Australia-SE Asia collision: plate tectonics and crustal flow in Geological Society, London, Special Publications 2011; v. 355; p. 75-109 doi: 10.1144/SP355.5
- Hangesh, J. and Whitney, B., 2014. Quaternary Reactivation of Australia’s Western Passive Margin: Inception of a New Plate Boundary? in: 5th International INQUA Meeting on Paleoseismology, Active Tectonics and Archeoseismology (PATA), 21-27 September 2014, Busan, Korea, 4 pp.
- Hayes, G.P., Wald, D.J., and Johnson, R.L., 2012. Slab1.0: A three-dimensional model of global subduction zone geometries in, J. Geophys. Res., 117, B01302, doi:10.1029/2011JB008524
- Jones, E.S., Hayes, G.P., Bernardino, Melissa, Dannemann, F.K., Furlong, K.P., Benz, H.M., and Villaseñor, Antonio, 2014. Seismicity of the Earth 1900–2012 Java and vicinity: U.S. Geological Survey Open-File Report 2010–1083-N, 1 sheet, scale 1:5,000,000, https://dx.doi.org/10.3133/ofr20101083N.
- McCaffrey, R., and Nabelek, J.L., 1984. The geometry of back arc thrusting along the Eastern Sunda Arc, Indonesia: Constraints from earthquake and gravity data in JGR, Atm., vol., 925, no. B1, p. 441-4620, DOI: 10.1029/JB089iB07p06171
- Okal, E. A., & Reymond, D., 2003. The mechanism of great Banda Sea earthquake of 1 February 1938: applying the method of preliminary determination of focal mechanism to a historical event in EPSL, v. 216, p. 1-15.
- Silver, E.A., Breen, N.A., and Prastyo, H., 1986. Multibeam Study of the Flores Backarc Thrust Belt, Indonesia, in JGR., vol. 91, no. B3, p. 3489-3500
- Zahirovic, S., Seton, M., and Müller, R.D., 2014. The Cretaceous and Cenozoic tectonic evolution of Southeast Asia in Solid Earth, v. 5, p. 227-273, doi:10.5194/se-5-227-2014