On 26 December 2004 there was an earthquake with a magnitude of M 9.2 along the Sumatra-Andaman subduction zone (SASZ).
This earthquake is the third largest earthquake ever recorded by modern seismometers and ruptured nearly 2,000 km of the megathrust fault offshore of Sumatra, the Andaman Isles, and the Nicobar Isles.
The 22 may 2960 Chile M 9.5 and 27 March 1964 M 9.2 Good Friday earthquake in Alaska are the first and second largest.
This 2004 M 9.2 earthquake triggered submarine landslides and deformed the seafloor to generate a trans-oceanic tsunami that killed almost a quarter of a million people.
A few months later, on 28 March 2005, there was another megathrust earthquake, further to the south, with a magnitude of M 8.6. The M 8.6 earthquake ruptured in a region of the megathrust that had an increase in coulomb stress imparted to it by the M 9.2 earthquake to the north.
The increase in stress is small, so for the stress increase to be able to trigger an earthquake, the fault must be within a margin of critical stress prior to the first earthquake in order to be triggered.
In prior years, I have written some material about the 2004 earthquake, including some observations made by others. Today I prepared an interpretive poster for the 2004 and 2005 SASZ earthquakes (while waking up at my mom’s house, where I was for the holiday; I was driving home to Arcata in 2004 when I heard about the SASZ earthquake.).
I updated this page for the 2017 anniversary of this 2004 earthquake in some places.
- M 9.2 Andaman-Sumatra subduction zone 2014 Earthquake Anniversary
- M 9.2 Andaman-Sumatra subduction zone SASZ Fault Deformation
Here are my other reports on these earthquakes.
- 2004.12.26 M 9.2
Here is a summary page from IRIS.
Below is my interpretive poster for this earthquake.
I plot the seismicity from the past month, with color representing depth and diameter representing magnitude (see legend). I also include the region of the fault slip solution as modeled by the USGS (slightly transparent blue polygons). Note how the 2005 earthquake slips along a section of the fault that is further down-dip compared to the 2004 earthquake. This probably owes to the smaller tsunami triggered by the 2005 earthquake (and the smaller turbidite; Patton et al., 2015).
- I placed a moment tensor / focal mechanism legend on the poster. There is more material from the USGS web sites about moment tensors and focal mechanisms (the beach ball symbols). Both moment tensors and focal mechanisms are solutions to seismologic data that reveal two possible interpretations for fault orientation and sense of motion. One must use other information, like the regional tectonics, to interpret which of the two possibilities is more likely. The moment tensor shows northeast-southwest compression, perpendicular to the convergence at this plate boundary. Most of the recent seismicity in this region is associated with convergence along the New Britain trench or the South Solomon trench.
- I also include the shaking intensity contours on the map. These use the Modified Mercalli Intensity Scale (MMI; see the legend on the map). This is based upon a computer model estimate of ground motions, different from the “Did You Feel It?” estimate of ground motions that is actually based on real observations. The MMI is a qualitative measure of shaking intensity. More on the MMI scale can be found here and here. This is based upon a computer model estimate of ground motions, different from the “Did You Feel It?” estimate of ground motions that is actually based on real observations.
- I include the MMI contours for both 2004 and 2005 earthquakes.
- I include the slab contours plotted (Hayes et al., 2012), which are contours that represent the depth to the subduction zone fault. These are mostly based upon seismicity. The depths of the earthquakes have considerable error and do not all occur along the subduction zone faults, so these slab contours are simply the best estimate for the location of the fault. The hypocentral depth plots this close to the location of the fault as mapped by Hayes et al. (2012).
- In the upper left corner, I include a map that shows the extent of historic earthquakes along the SASZ offshore of Sumatra. This map is a culmination of a variety of papers (summarized and presented in Patton et al., 2015).
- In the upper right corner I include a figure that is presented by Chlieh et al. (2007). These figures show model results from several models. Each model is represented by a map showing the amount that the fault slipped in particular regions. I present this figure below.
- In the lower right corner I present a figure from Prawirodirdjo et al. (2010). This figure shows the coseismic vertical and horizontal motions from the 2004 and 2005 earthquakes as measured at GPS sites.
- In the lower left corner are the MMI intensity maps for the two SASZ earthquakes. Note these are at different map scales. I also include the MMI attenuation curves for these earthquakes below the maps. These plots show the reported MMI intensity data as they relate to two plots of modeled estimates (the orange and green lines). These green dots are from the USGS “Did You Feel It?” reports compared to the estimates of ground shaking from Ground Motion Prediction Equation (GMPE) estimates. GMPE are empirical relations between earthquakes and recorded seismologic observations from those earthquakes, largely controlled by distance to the fault, ray path (direction and material properties), and site effects (the local geology). When seismic waves propagate through sediment, the magnitude of the ground motions increases in comparison to when seismic waves propagate through bedrock. The orange line is a regression of data for the central and eastern US and the green line is a regression through data from the western US.
I include some inset figures in the poster.
- Here is the USGS poster for this earthquake. These results were put out very soon after the earthquake and later reports made more refined analyses. For example, there are over a dozen earthquake slip models for this earthquake, most all are better than this initial USGS version.
- Here are the map and attenuation plots as a single figure.

- Here is a figure that shows the wave height observations from satellites that happened to be passing over the Indian Ocean as the tsunami crossed towards India and Sri Lanka (Shearer and Burgman 2010).
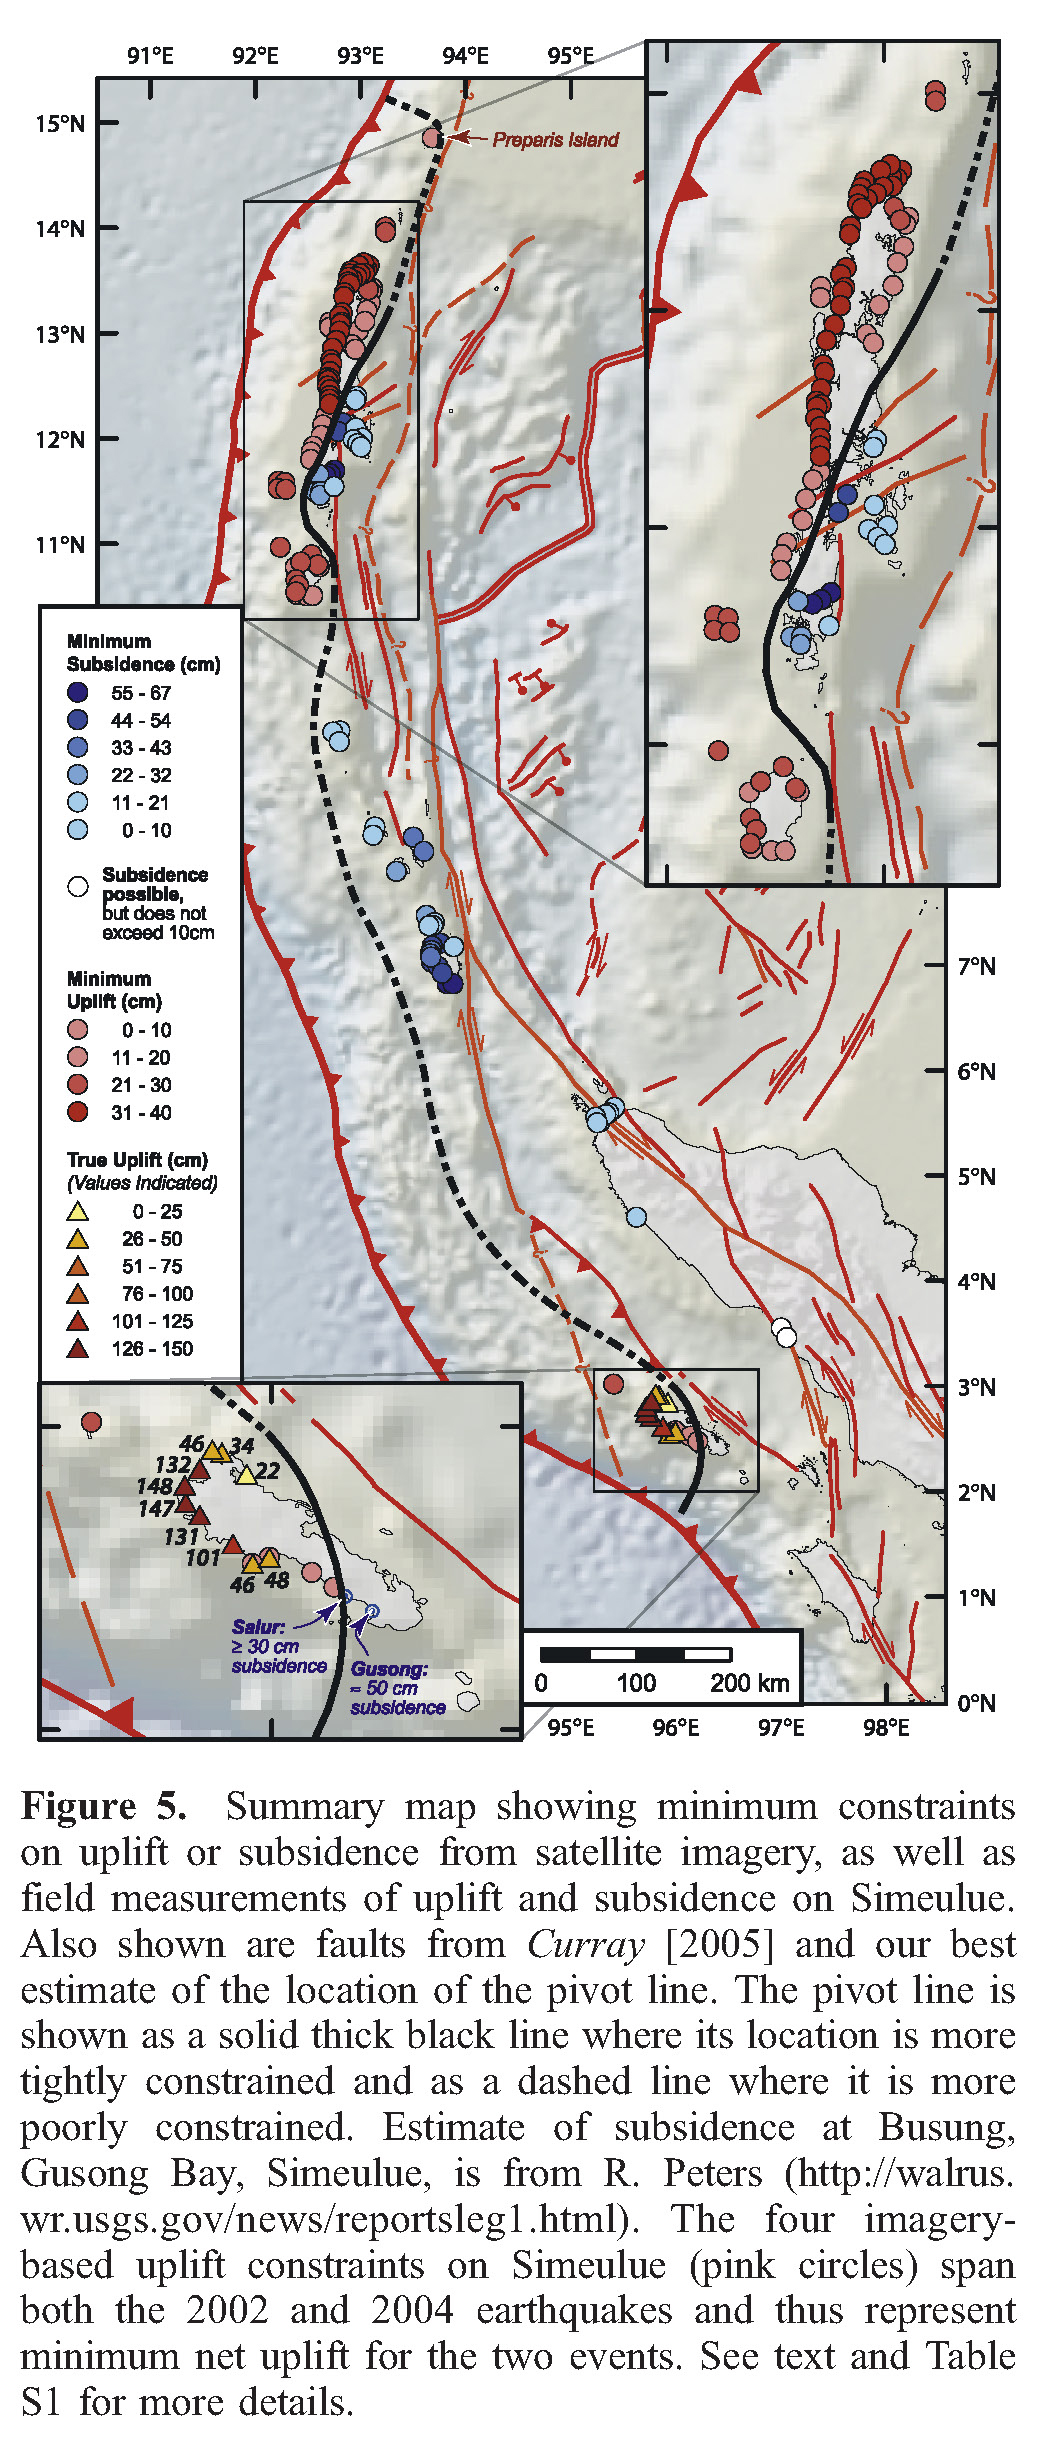
- This figure from Meltzner et al. (2010) shows measurements of vertical deformation collected from coral microatolls (which are sensitive to the tides, basically, they cannot survive above a certain level of tidal elevation. Read his and related papers to learn more about this method.). These are observations that are independent of GPS data.
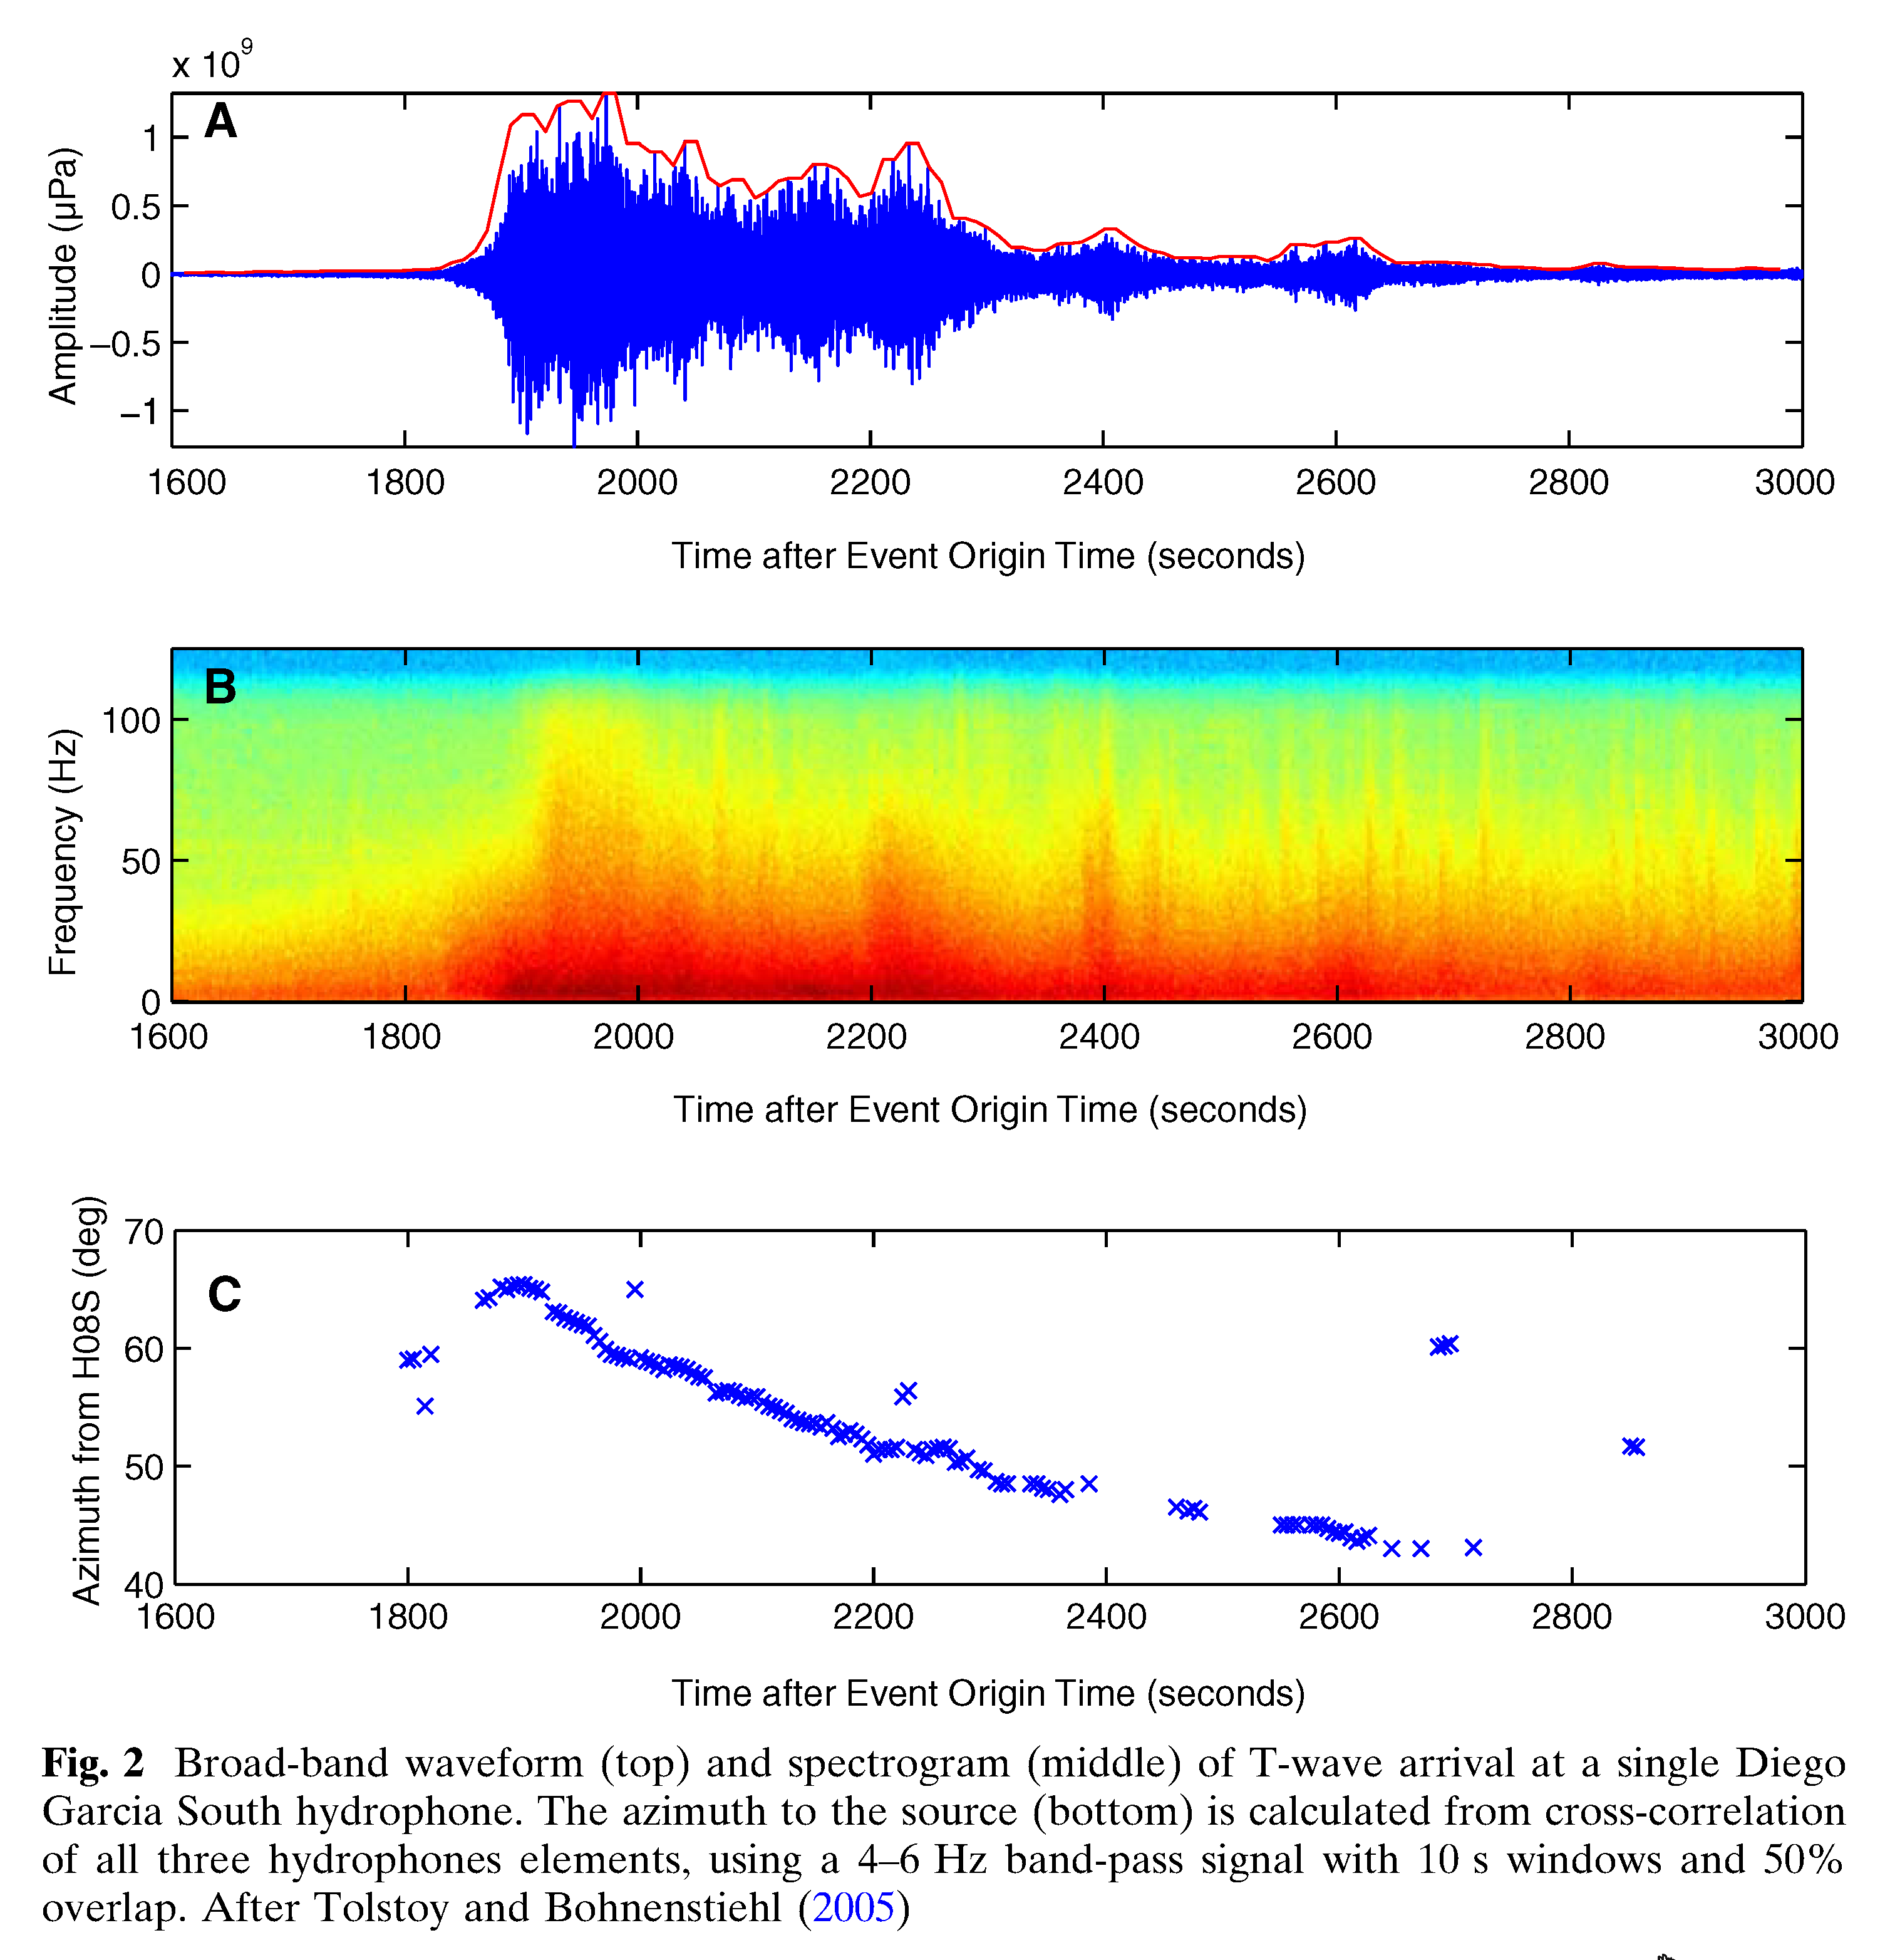
- Here is the source time function from Ishi et al. (2005). Note the similarity between this plot and the above one from Chlieh et al. (2007). These results are more comparable that the slip models we saw earlier.
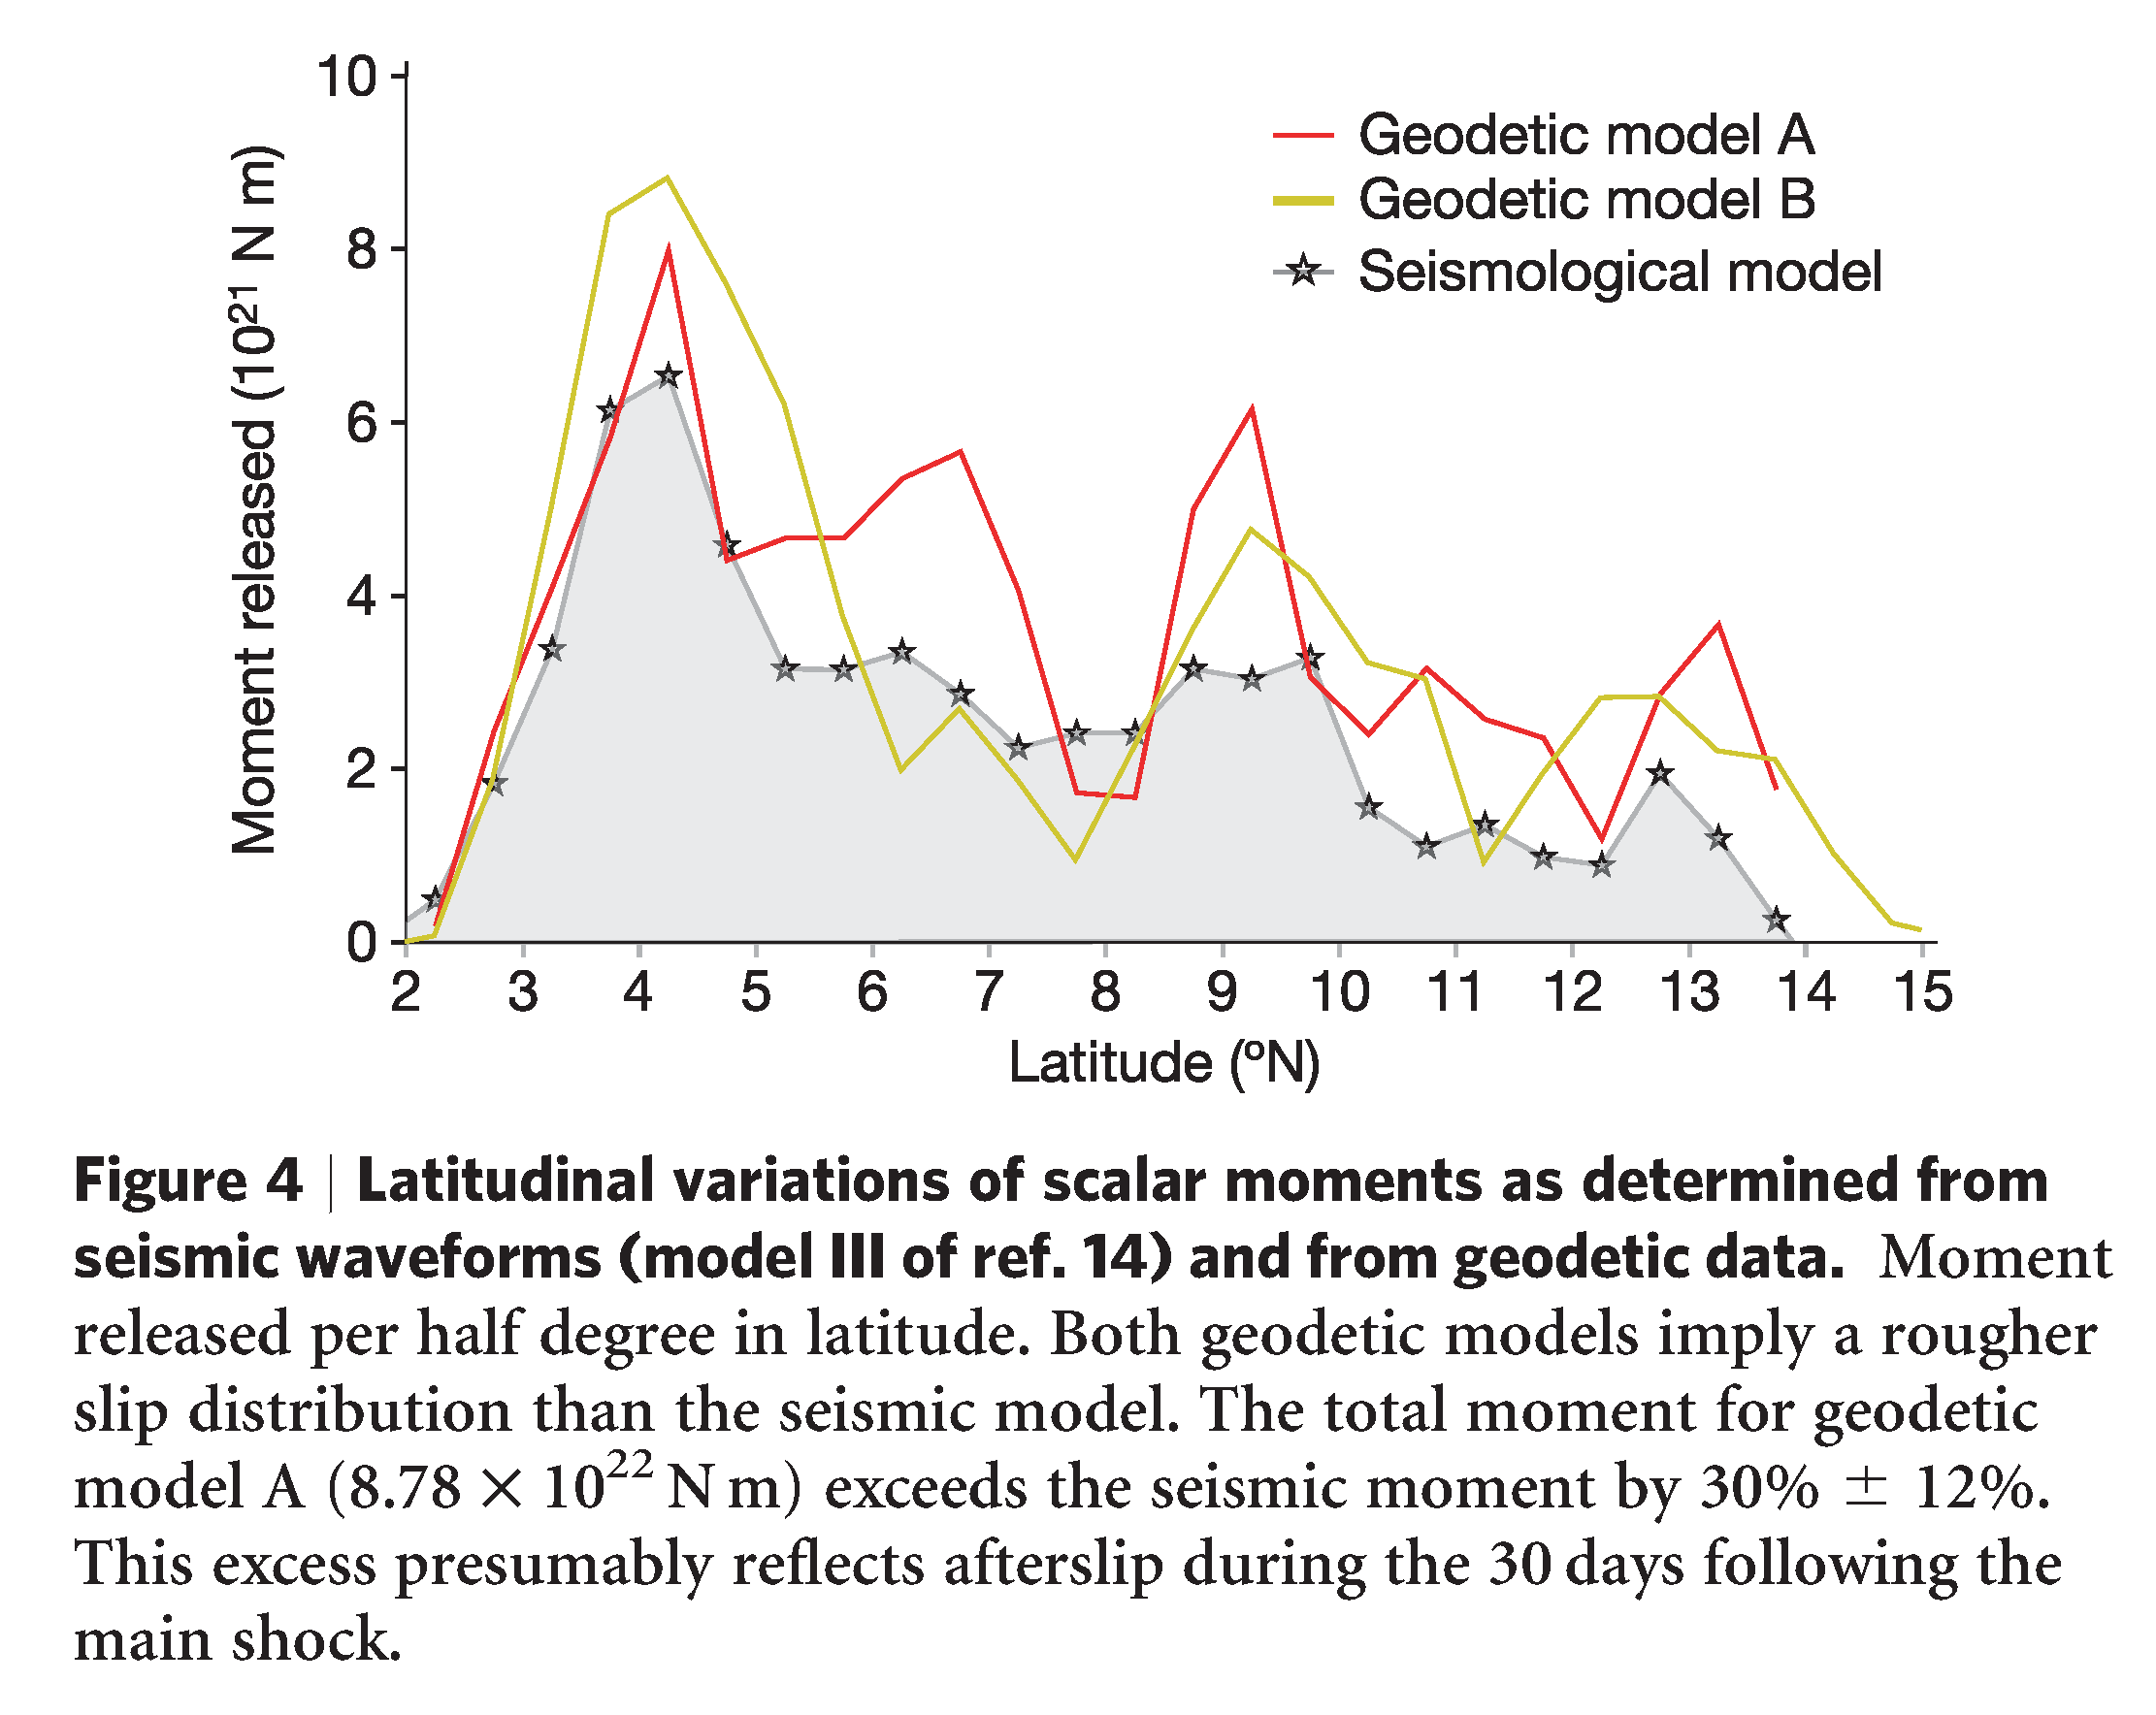
- This is from Subarya et al. (2006), an earlier plot, but still similar to Chlieh et al. (2007) and Ishii et al. (2007).
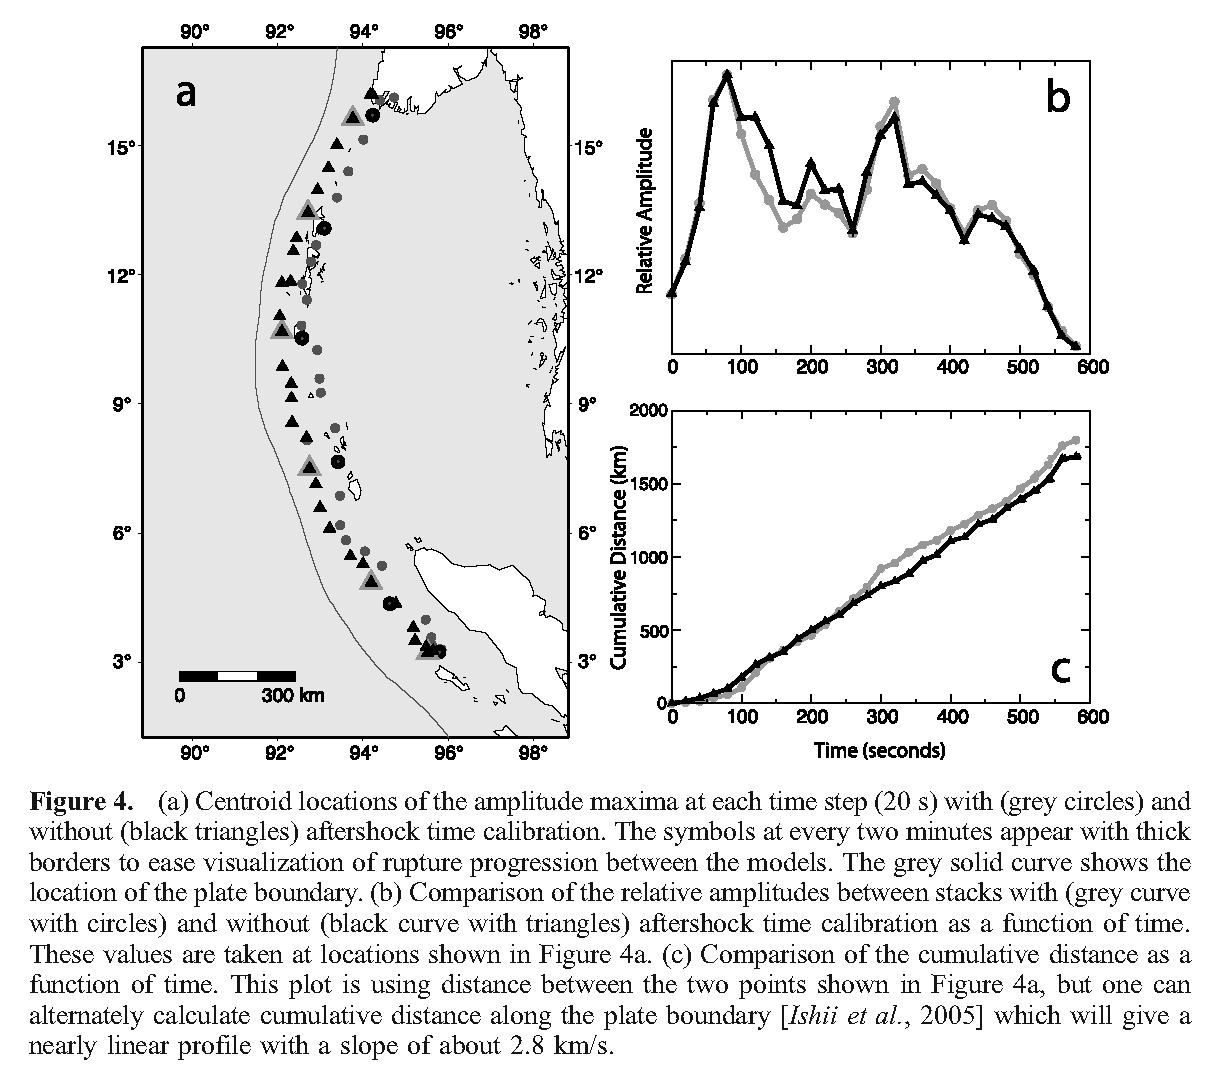
- This is another estimate published also in 2006 (Tolstoy and Bohnenstiehl, 2006), again showing similarities with the other plots (though this is the most different). There are a number of other examples as well (e.g. Okal).
- UPDATE 2017: Below is a plot of the seismographs from a global data set, prepared by IRIS and others.

This record section plot displays vertical displacements of the Earth’s surface recorded by seismometers plotted with time (since the earthquake initiation) on the horizontal axis, and vertical displacements of the Earth on the vertical axis (note the 1 cm scale bar at the bottom for scale). The traces are arranged by distance from the epicenter in degrees. The earliest, lower amplitude, signal is that of the compressional (P) wave, which takes about 22 minutes to reach the other side of the planet (the antipode). The largest amplitude signals are seismic surface waves that reach the antipode after about 100 minutes. The surface waves can be clearly seen to reinforce near the antipode (with the closest seismic stations in Ecuador), and to subsequently circle the planet to return to the epicentral region after about 200 minutes. A major aftershock (magnitude 7.1) can be seen at the closest stations starting just after the 200 minute mark (note the relative size of this aftershock, which would be considered a major earthquake under ordinary circumstances, compared to the mainshock).
- UPDATE 2017:This is a video showing a visualization of the seismic waves transmitted from the 2004 SASZ earthquake from IRIS and others.
This movie illustrates simulation of seismic wave propagation generated by Dec. 26 Sumatra earthquake. Colors indicate amplitude of vertical displacement at the surface of the Earth. Red is upward and blue is downward. Total duration of this simulation is 20 minutes. Source model we used is that of Chen Ji of Caltech. Simulation was performed by using the Earth Simulator of JAMSTEC.
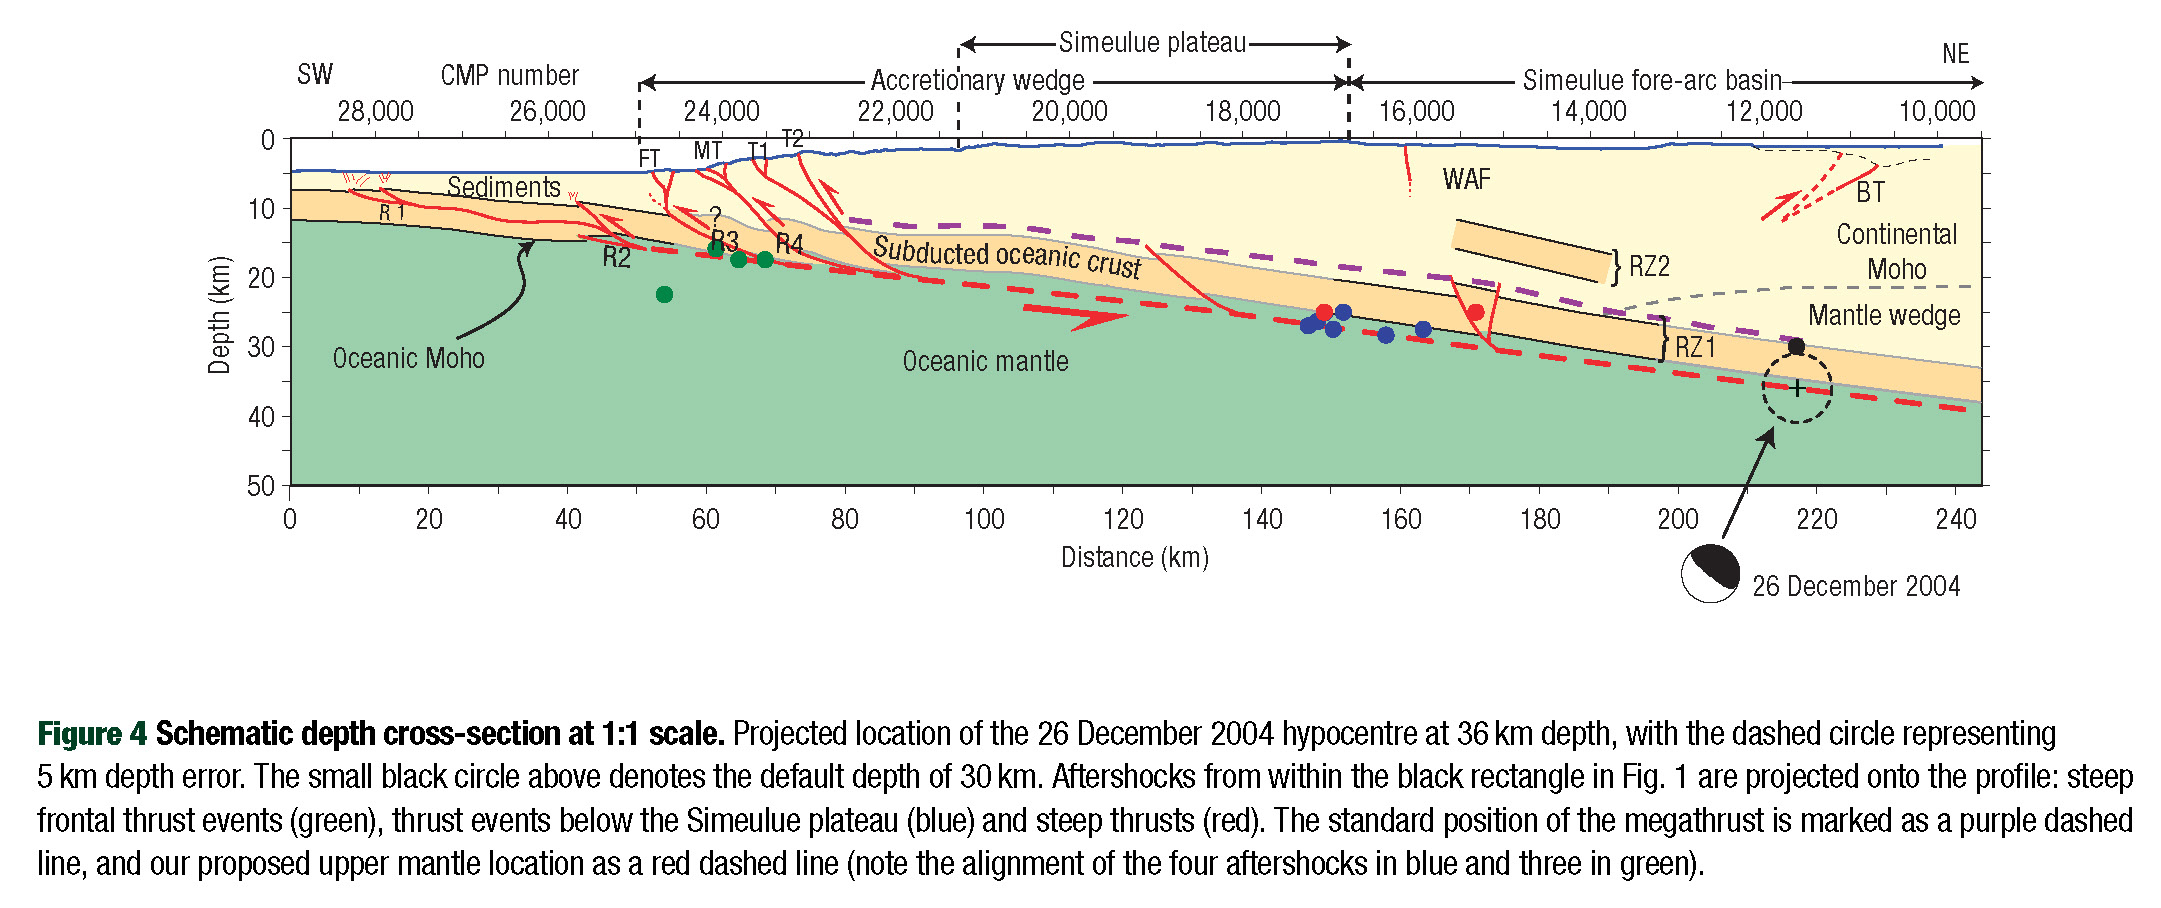
- These next two figures from Singh et al. (2008 ) show a map and cross section at the location of the earthquake. The 2004 SASZ earthquake ruptured very deep in a location previously thought to not harbor strain to be accumulated and released during an earthquake.
- In 2007 Dr. Chris Goldfinger and myself led a coring expedition in this region within Indonesian EEZ and international waters offshore of Sumatra. Our goal was to evaluate the sedimentary record of earthquakes in the form of submarine landslide deposits (called turbidites). We collected over 100 sediment cores and have prepared several papers documenting some of our results (Patton et al., 2013, 2015).
- I will be preparing a website that documents this 2007 cruise aboard the R/V Roger Revelle. Here is the website. On this website, I provide a link to my research cruise blog, where I documented my cruise in real time. This is the first blog post for the RR0705 cruise.
- Below is a figure where I present evidence for a sedimentary deposit from the 2004 SASZ earthquake (Patton et al., 2015). Sumner et al. (2013) also present sedimentary evidence for the 2004 earthquake. Especially convincing because they observed computer paper within the turbidite! I include a figure caption below the image in blockquote.

The uppermost (2004?) turbidite from cores 96PC and 96TC, plotted as a composite core. A. From left to right: mean particle size, point magnetic susceptibility, CT density, gamma density, turbidite classification, RGB imagery, CT imagery, turbidite structure classification division, depth (cm), turbidite structure (lithologic log), texture, and the lithologic notes are plotted vs. depth. Geophysical logs symbolized as in Figure 2. B. Detailed turbidite structure based on CT imagery. From left to right: i. CT imagery uninterpreted, ii. CT imagery interpreted, iii. Turbidite structure interpretation, iv. Turbidite structure division classification, and v. turbidite structure description. C. Results from smear slide based vertical biostratigraphic transects for core 96PC. Percent biogenic and percent lithologic are plotted vs. depth in m. D. The mean, minimum, and maximum particle size distribution for sediments collected within the uppermost turbidite (in purple) and within hemipelagic sediments underlying the uppermost turbidite (in green) are plotted. These are compared with the combined distributions (in blue).
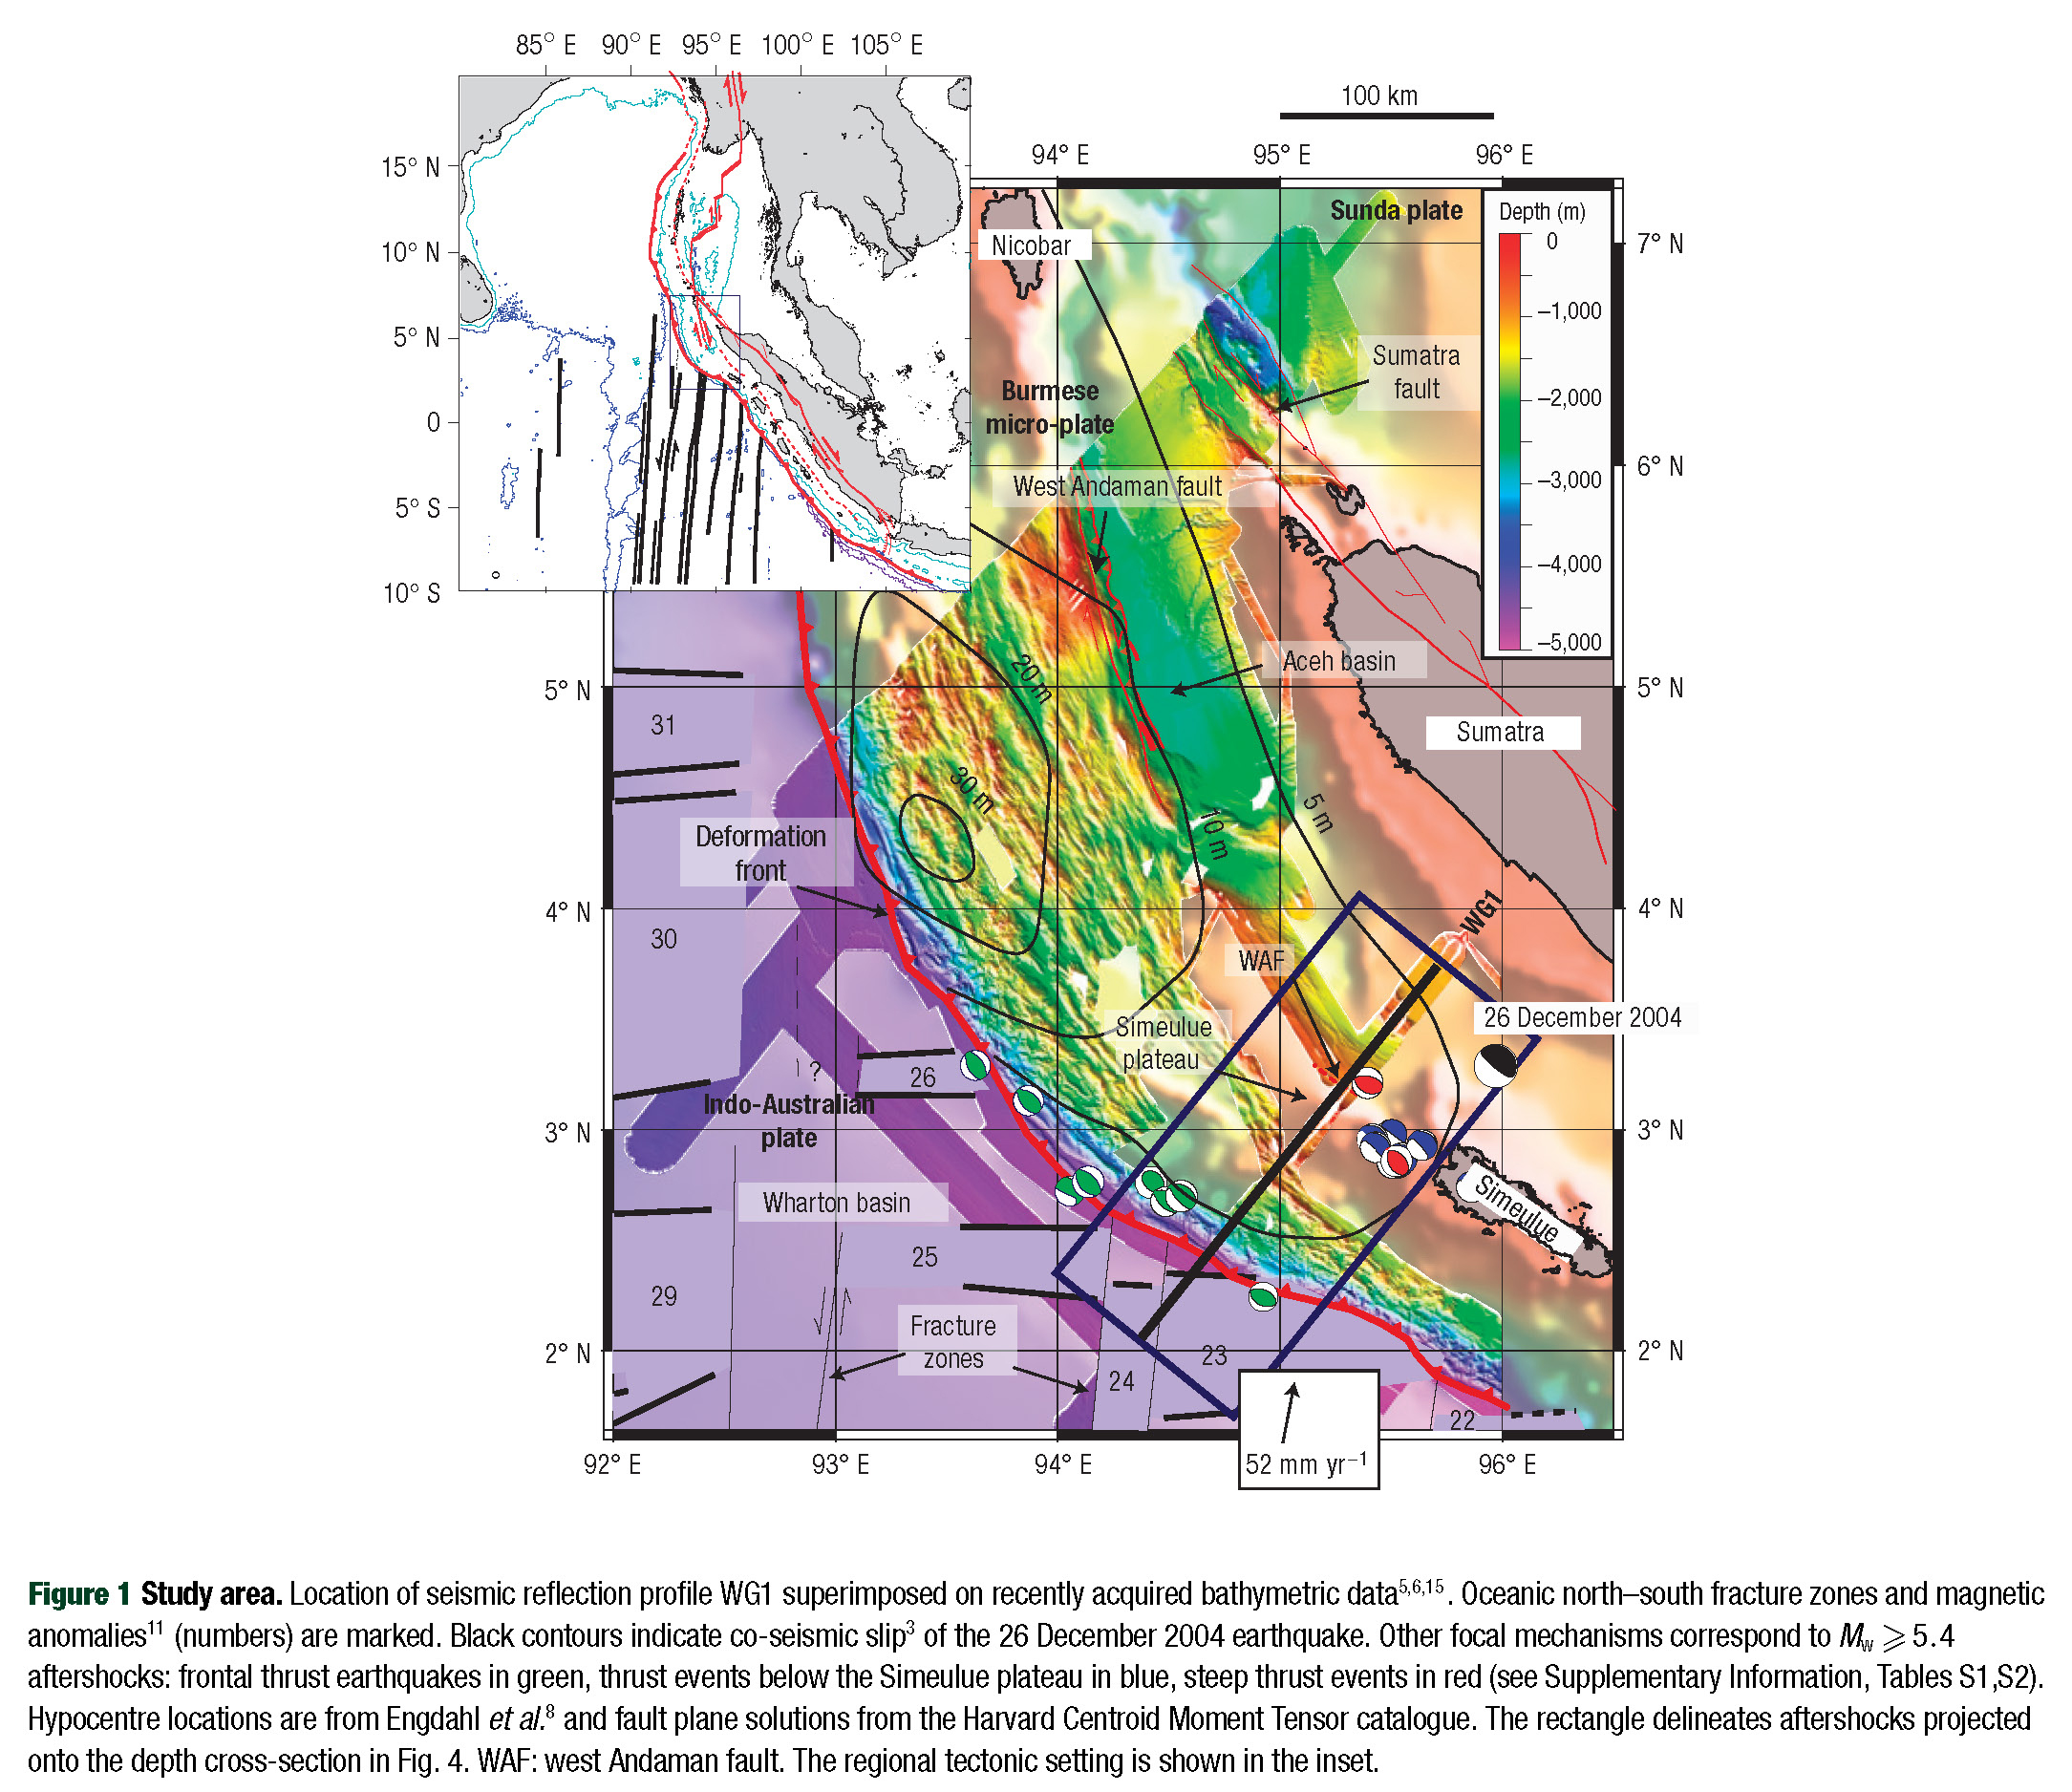
- Here is the cross section showing where the earthquake hypocenter is compared to where we think the mantle exists. We have not been here, so nobody actually knows… These interpretations are based on industry deep seismic data (Singh et al., 2008 ).
- Here is the historic rupture map again. I include a figure caption below that I wrote as blockquote.

India-Australia plate subducts northeastwardly beneath the Sunda plate (part of Eurasia) at modern rates (GPS velocities are based on regional modeling of Bock et al, 2003 as plotted in Subarya et al., 2006). Historic earthquake ruptures (Bilham, 2005; Malik et al., 2011) are plotted in orange. 2004 earthquake and 2005 earthquake 5 meter slip contours are plotted in orange and green respectively (Chlieh et al., 2007, 2008). Bengal and Nicobar fans cover structures of the India-Australia plate in the northern part of the map. RR0705 cores are plotted as light blue. SRTM bathymetry and topography is in shaded relief and colored vs. depth/elevation (Smith and Sandwell, 1997).
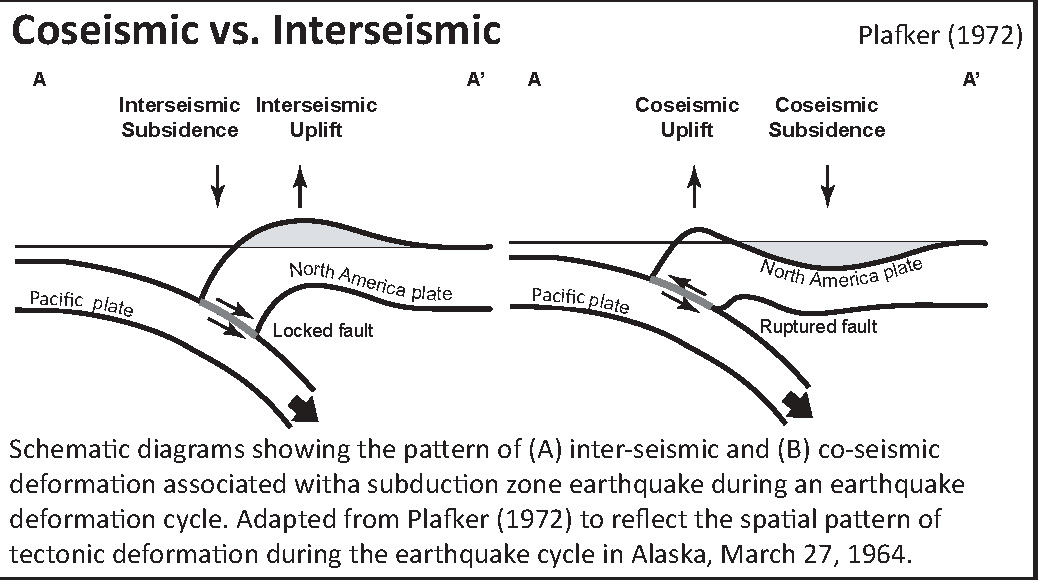
- Here is a cross section showing the differences of vertical deformation between the coseismic (during the earthquake) and interseismic (between earthquakes). This diagram was created to explain the deformation observed during the Good Friday Alaska earthquake, but these observations are observed during earthquakes at subduction zones globally.
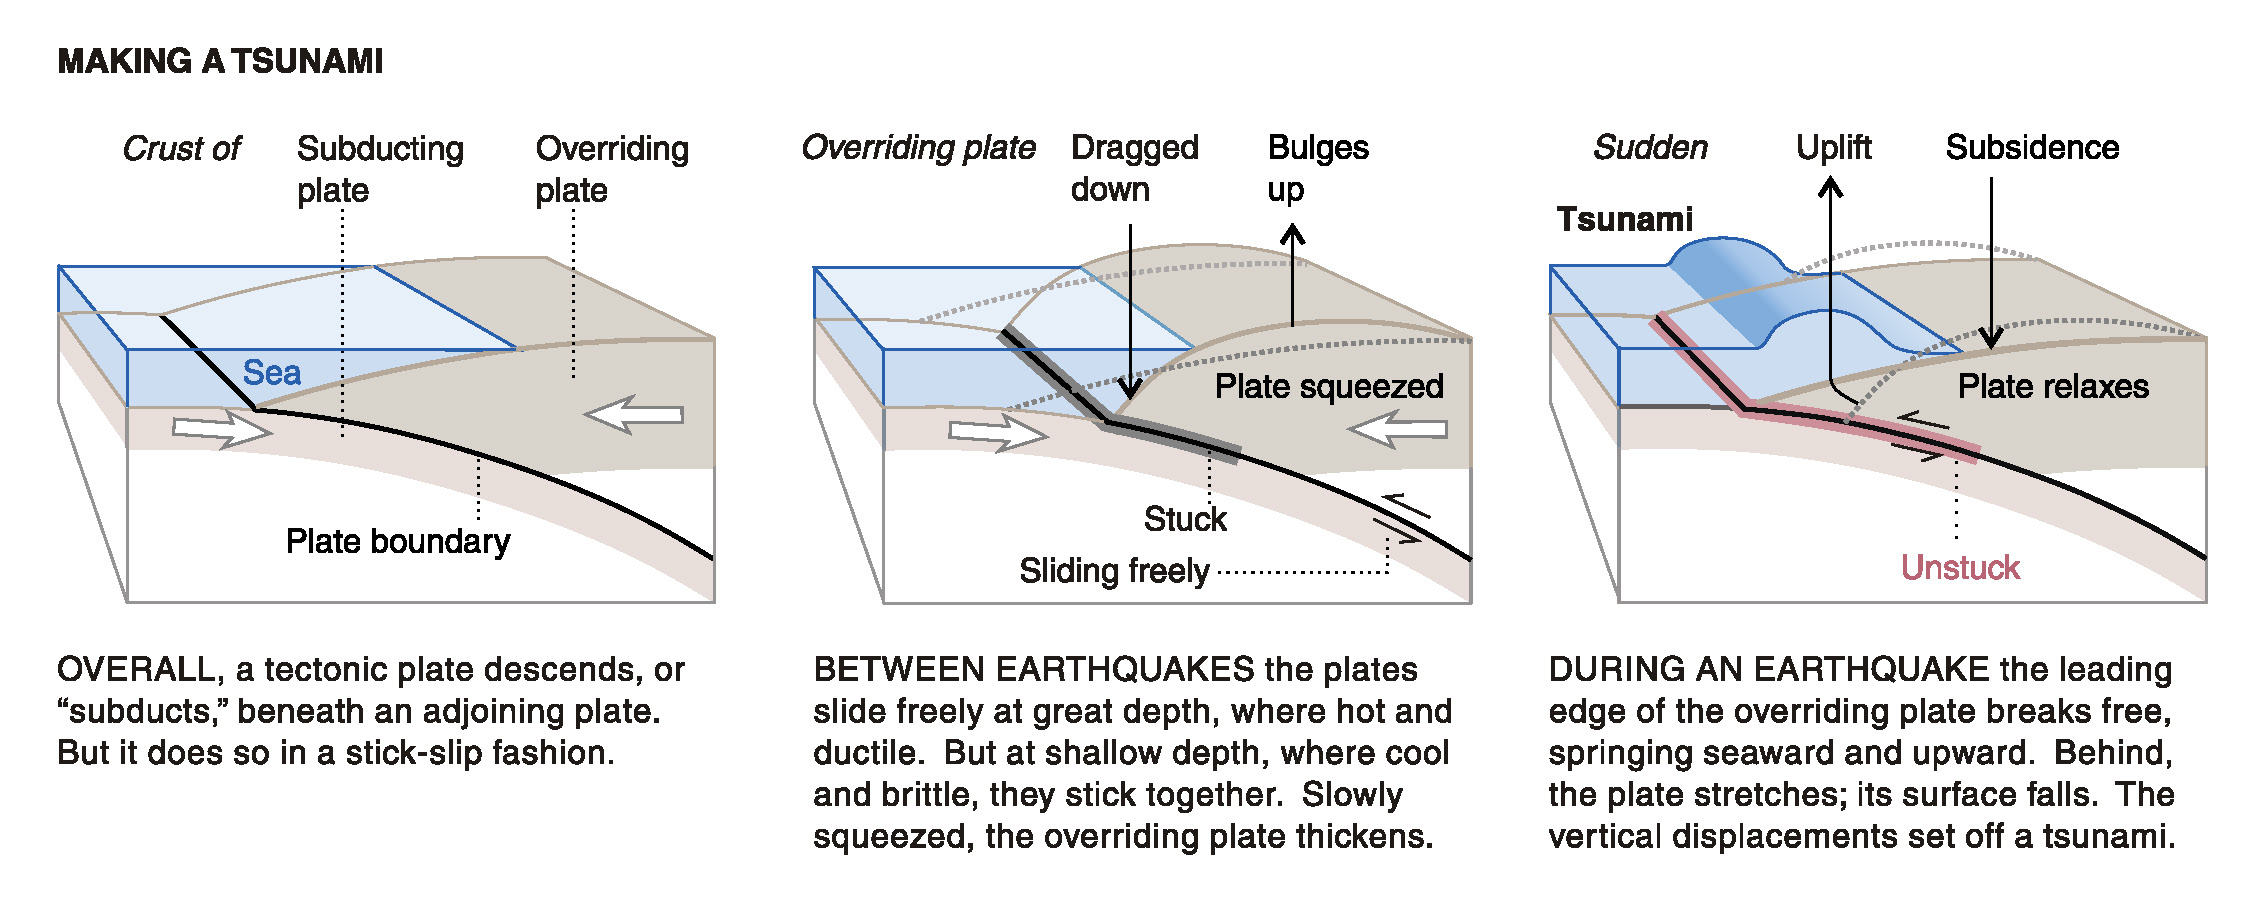
- This figure, from Atwater et al. (2005) shows the earthquake deformation cycle and includes the aspect that the uplift deformation of the seafloor can cause a tsunami.
- Here is the inset figure from Chlieh et al. (2007). I include a figure caption below in blockquote.
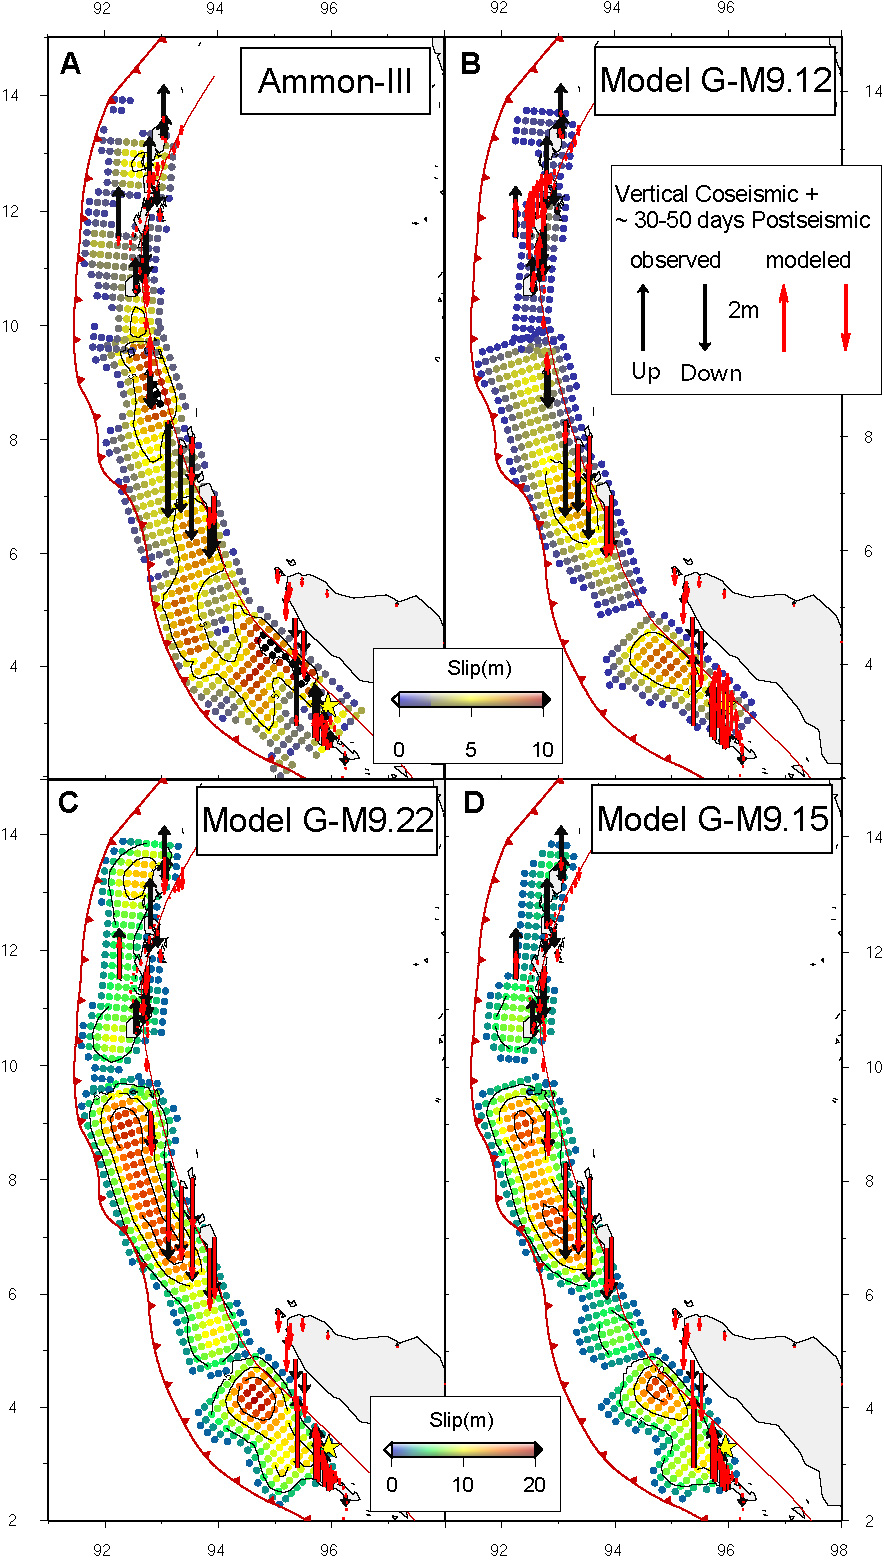
Observed (black) and Predicted (red) vertical displacements associated to model Ammon-III [Ammon et al. 2005] (A, See figure 5 in the main text), model G-M9.12 (B, figure 6), model G-M9.22 (C, figure 7) and our preferred coseismic model G-M9.15 (D, figure 9 in the main text).
- 2014.12.21 General Overview of the regional tectonics and SASZ earthquakes
- 2014.12.25 Sumatra-Andaman subduction zone 2014/12/26: Slip, Deformation, and Energy
Here are some pages where I present information about these SASZ earthquakes.
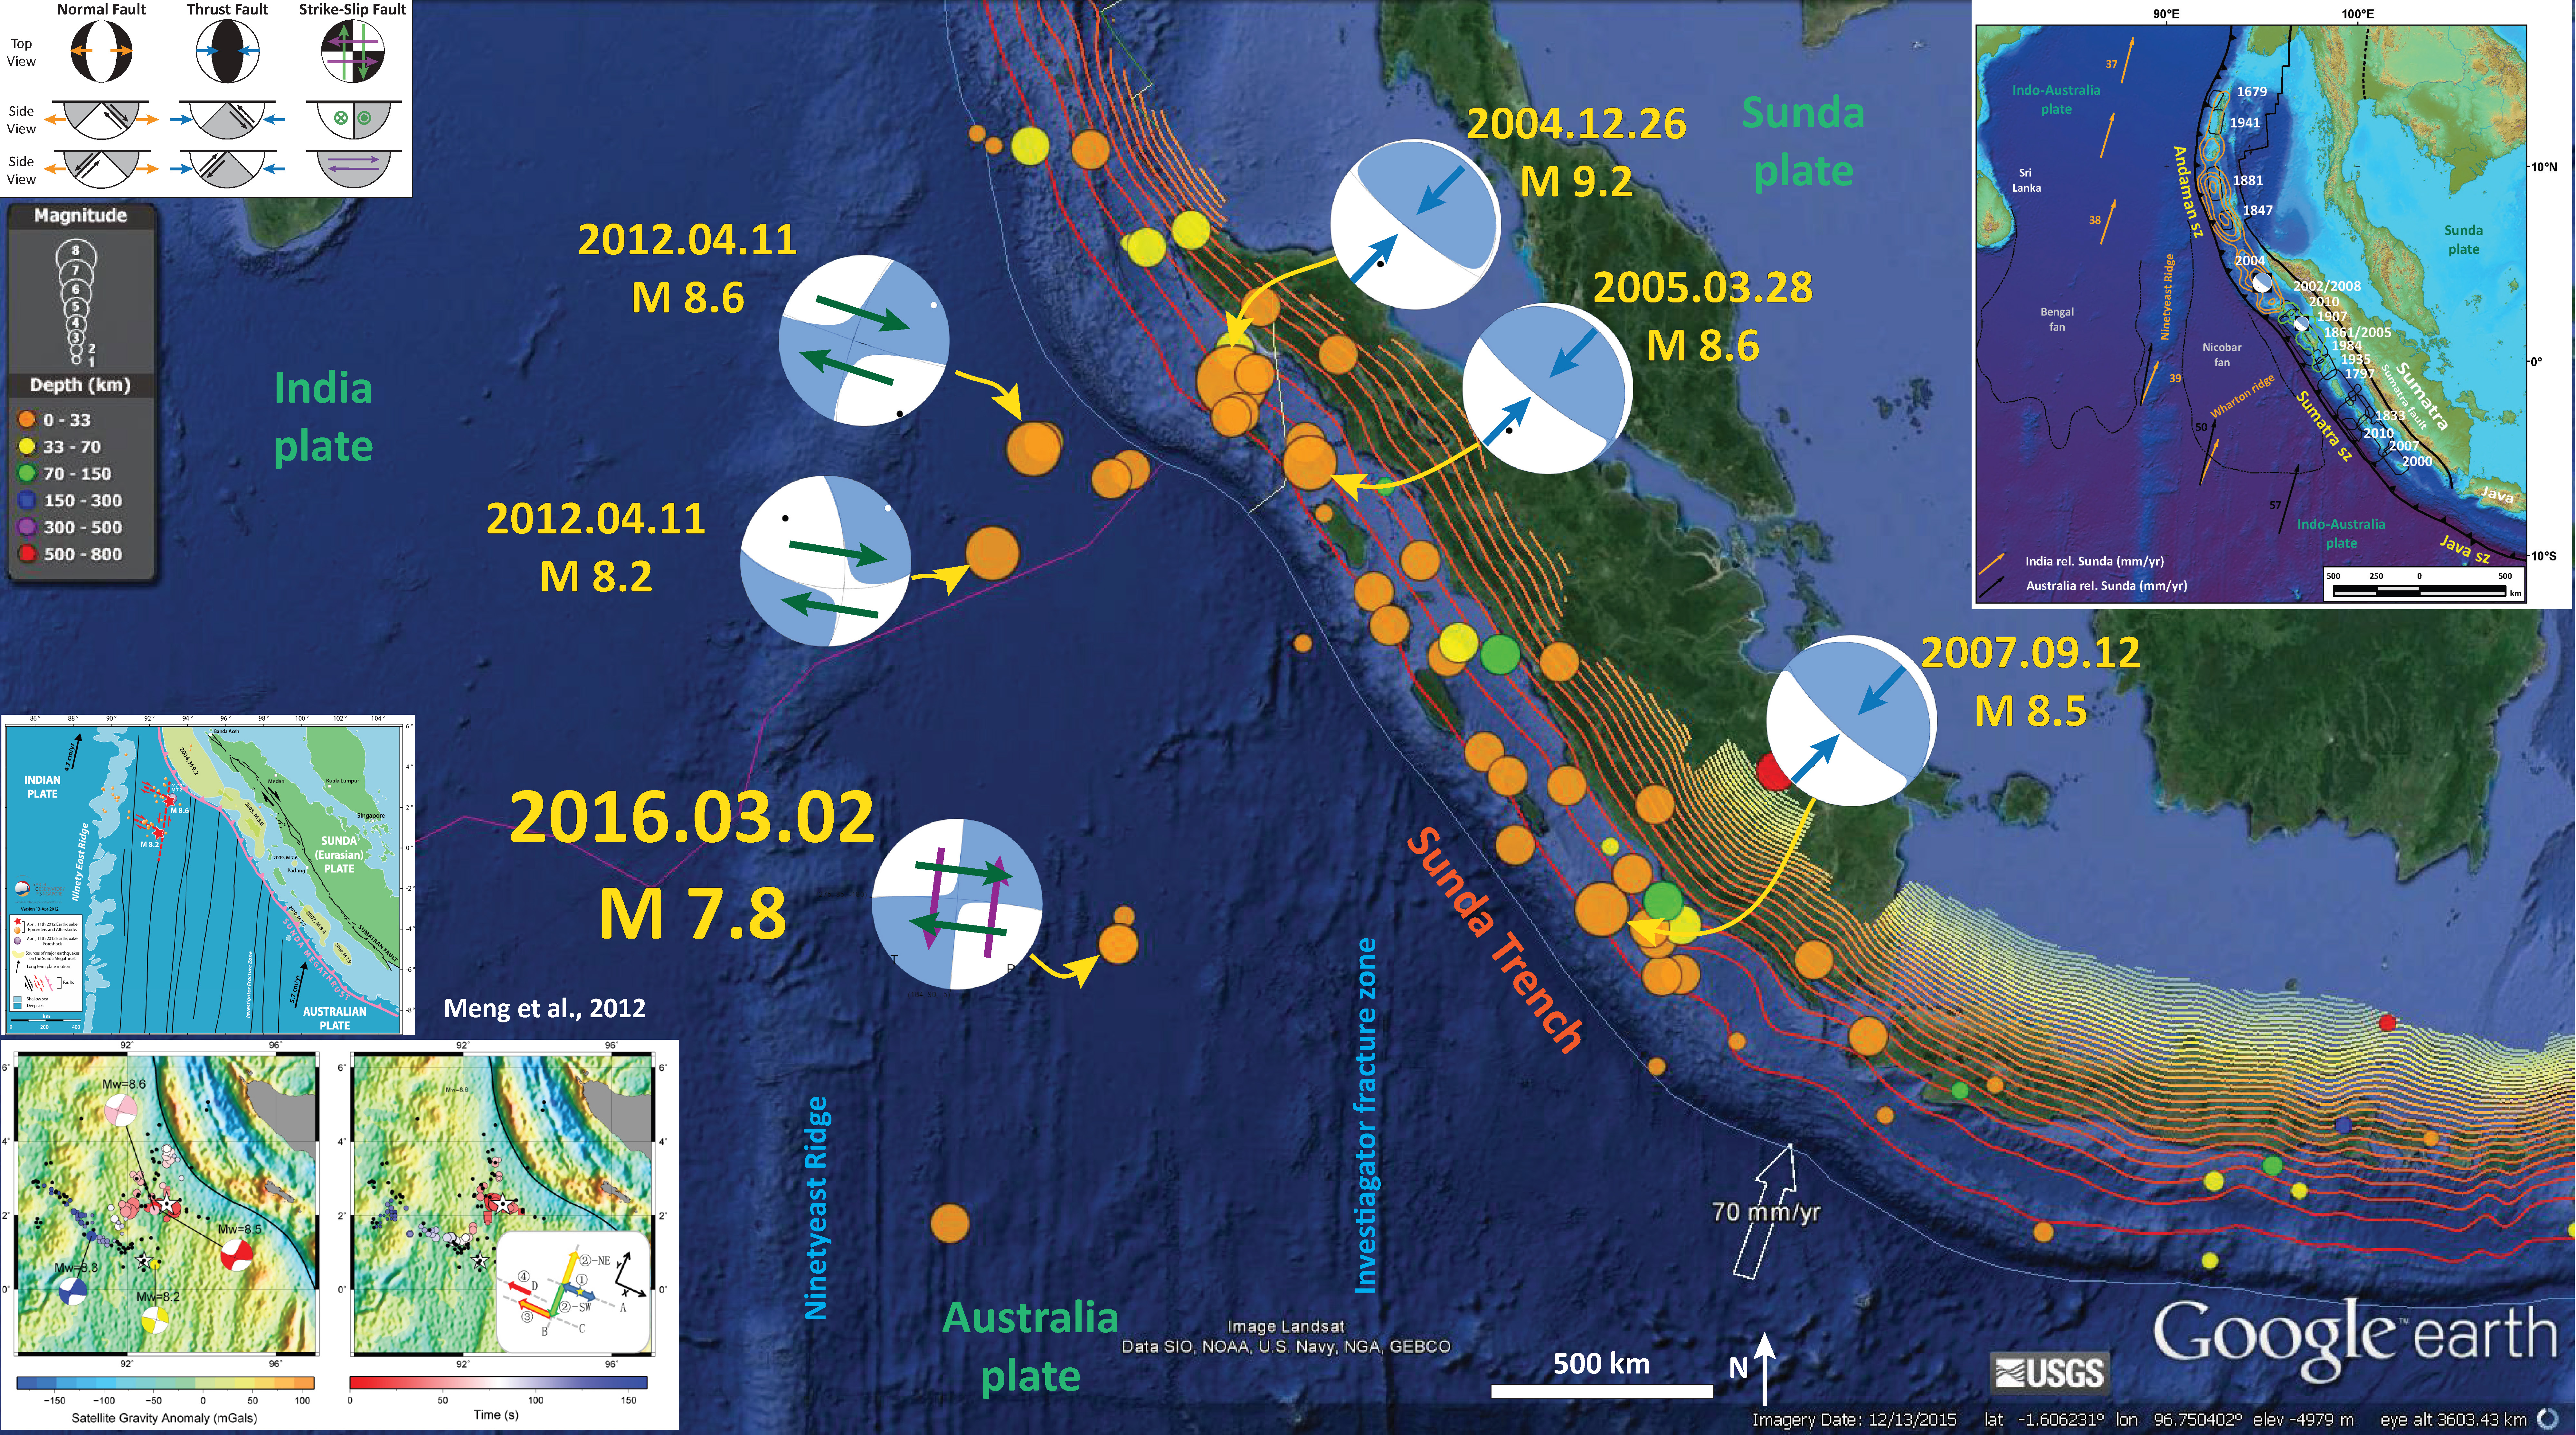
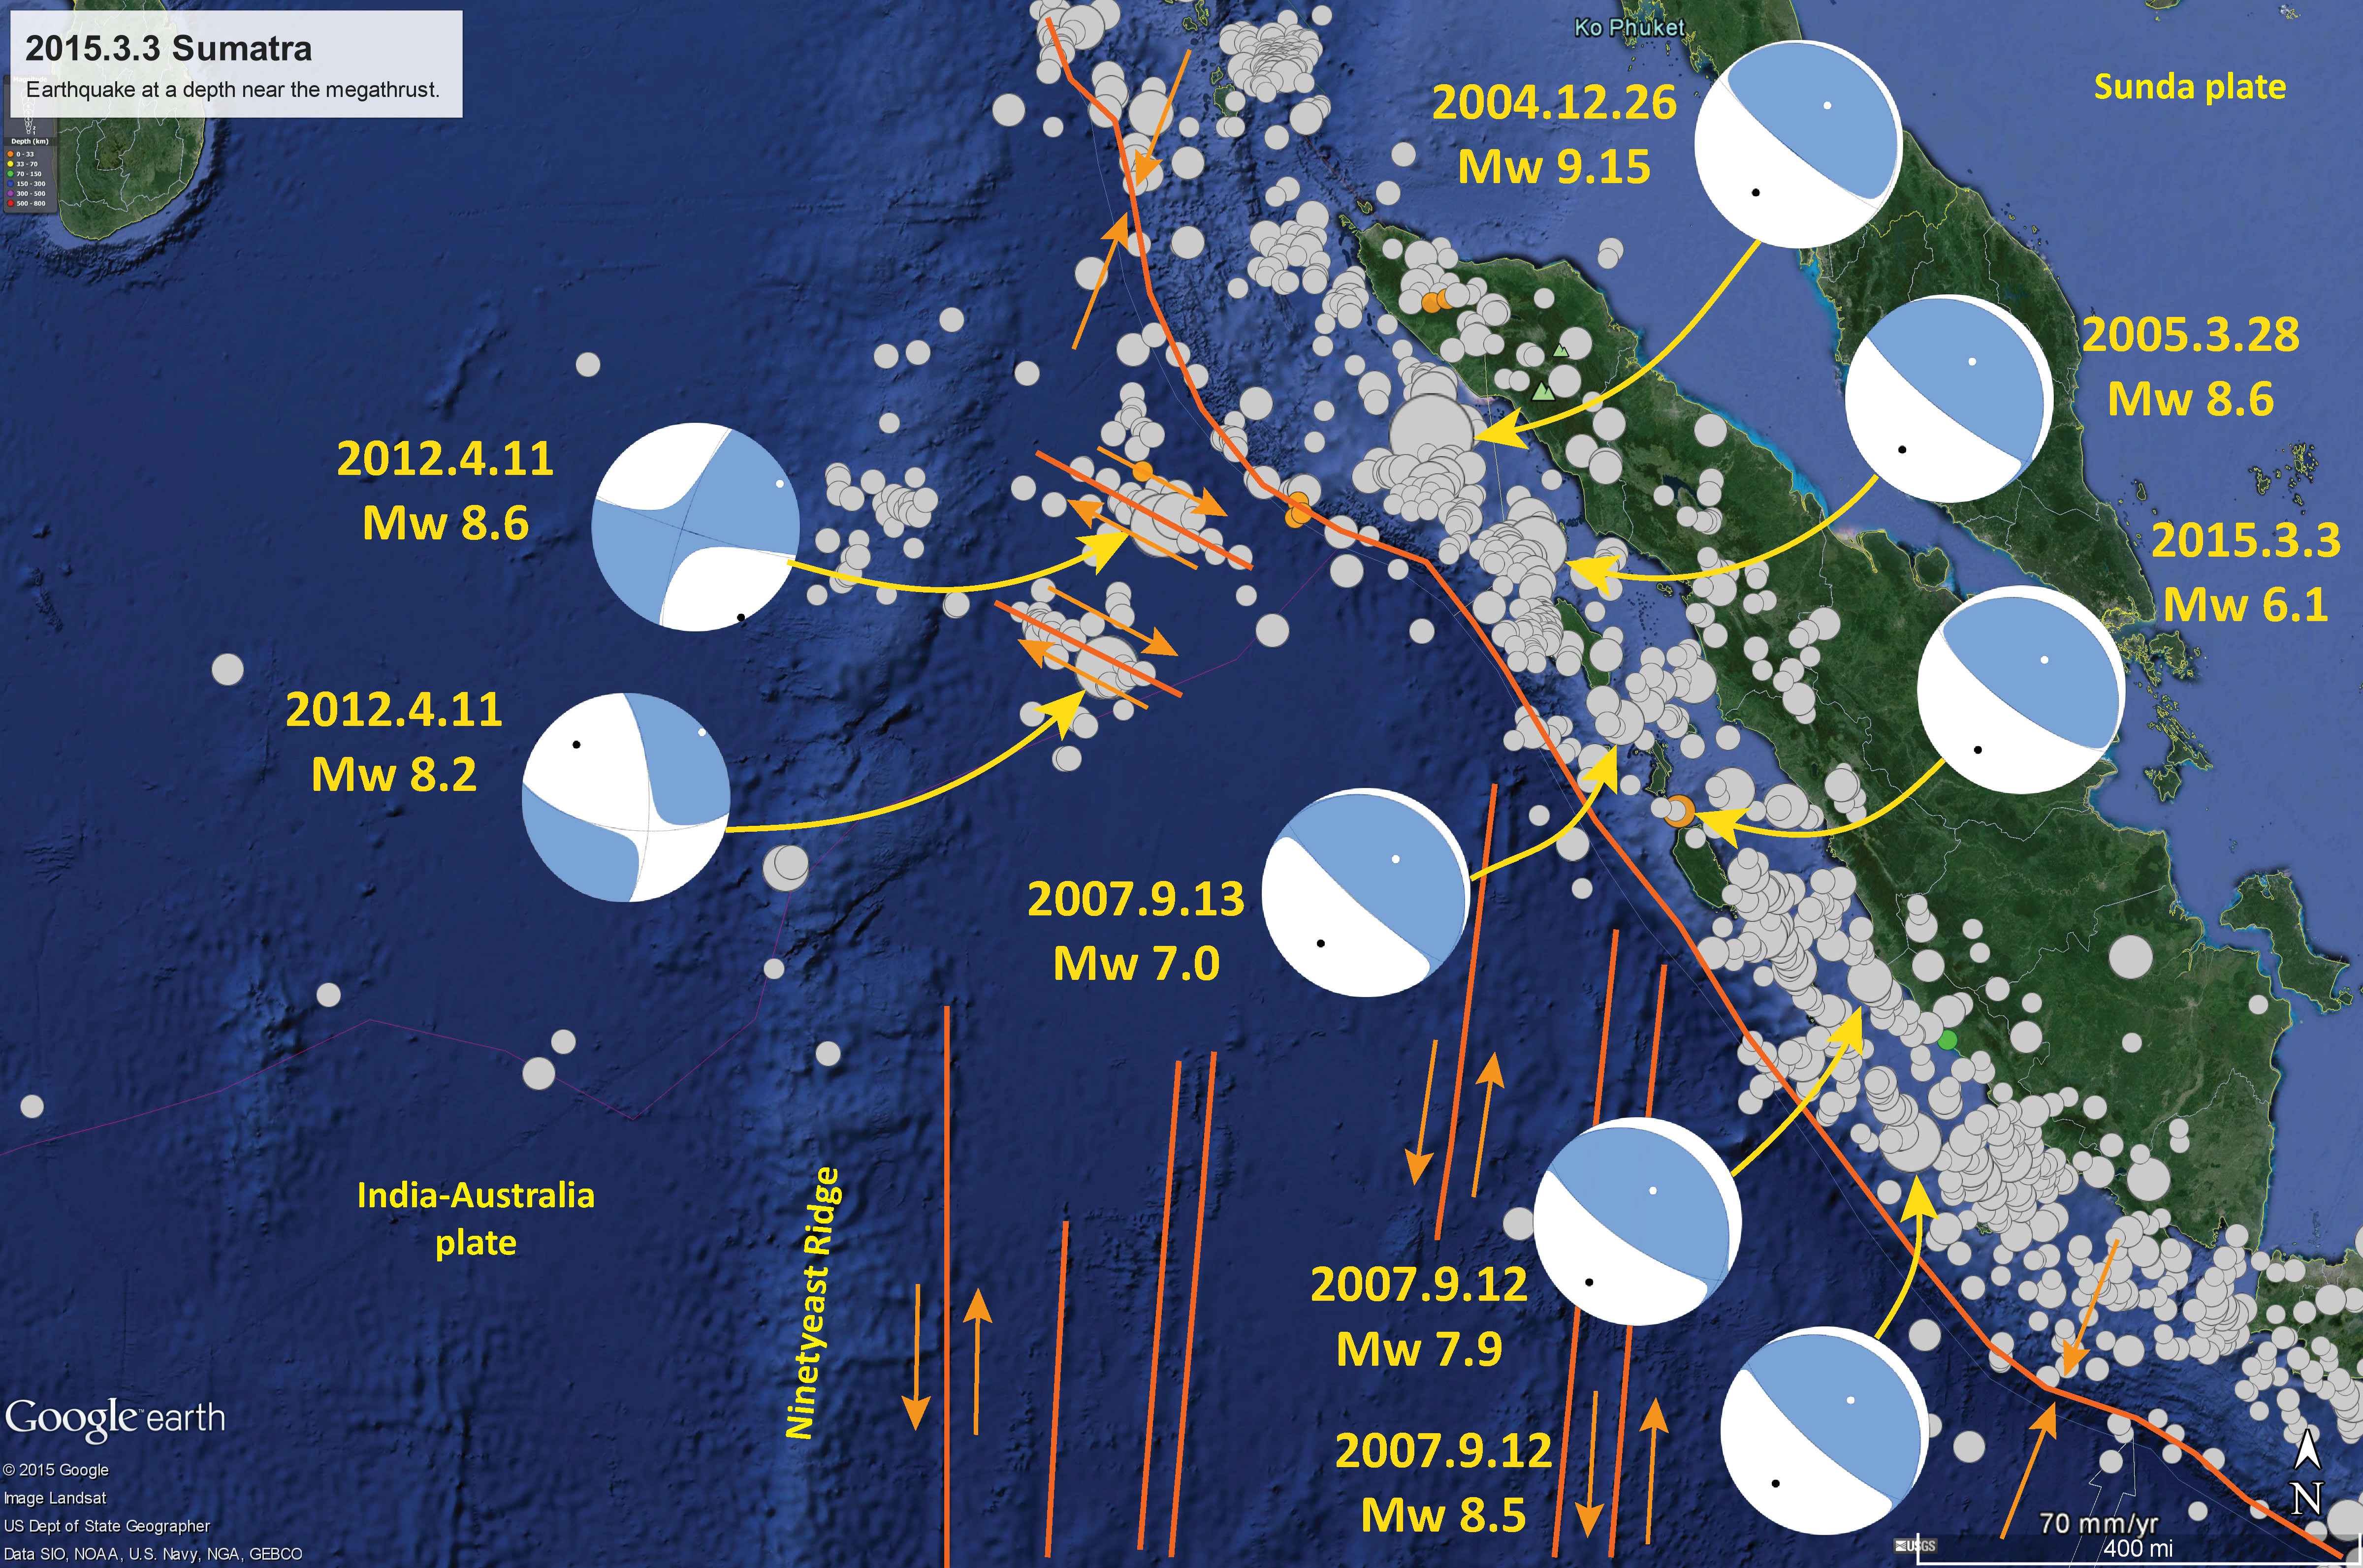
- The 2004/2005 SASZ earthquakes also tended to load strain in the crust in different locations. On 2012.04.11 there was a series of strike-slip earthquakes in the India plate crust to the west of the 2004/2005 earthquakes. The two largest magnitudes for these earthquakes were M 8.6 and M 8.2. The M 8.6 is the largest strike-slip earthquake ever recorded.
- On 2016.03.22 there was another large strike-slip earthquake in the India-Australia plate. This is probably related to this entire suite of subduction zone and intraplate earthquakes. I presented an interpretive poster about this M 7.8 earthquake here. Below is my interpretive poster for the M 7.8 earthquake. Here is the USGS website for this earthquake.
- I include a map in the upper right corner that shows the historic earthquake rupture areas.
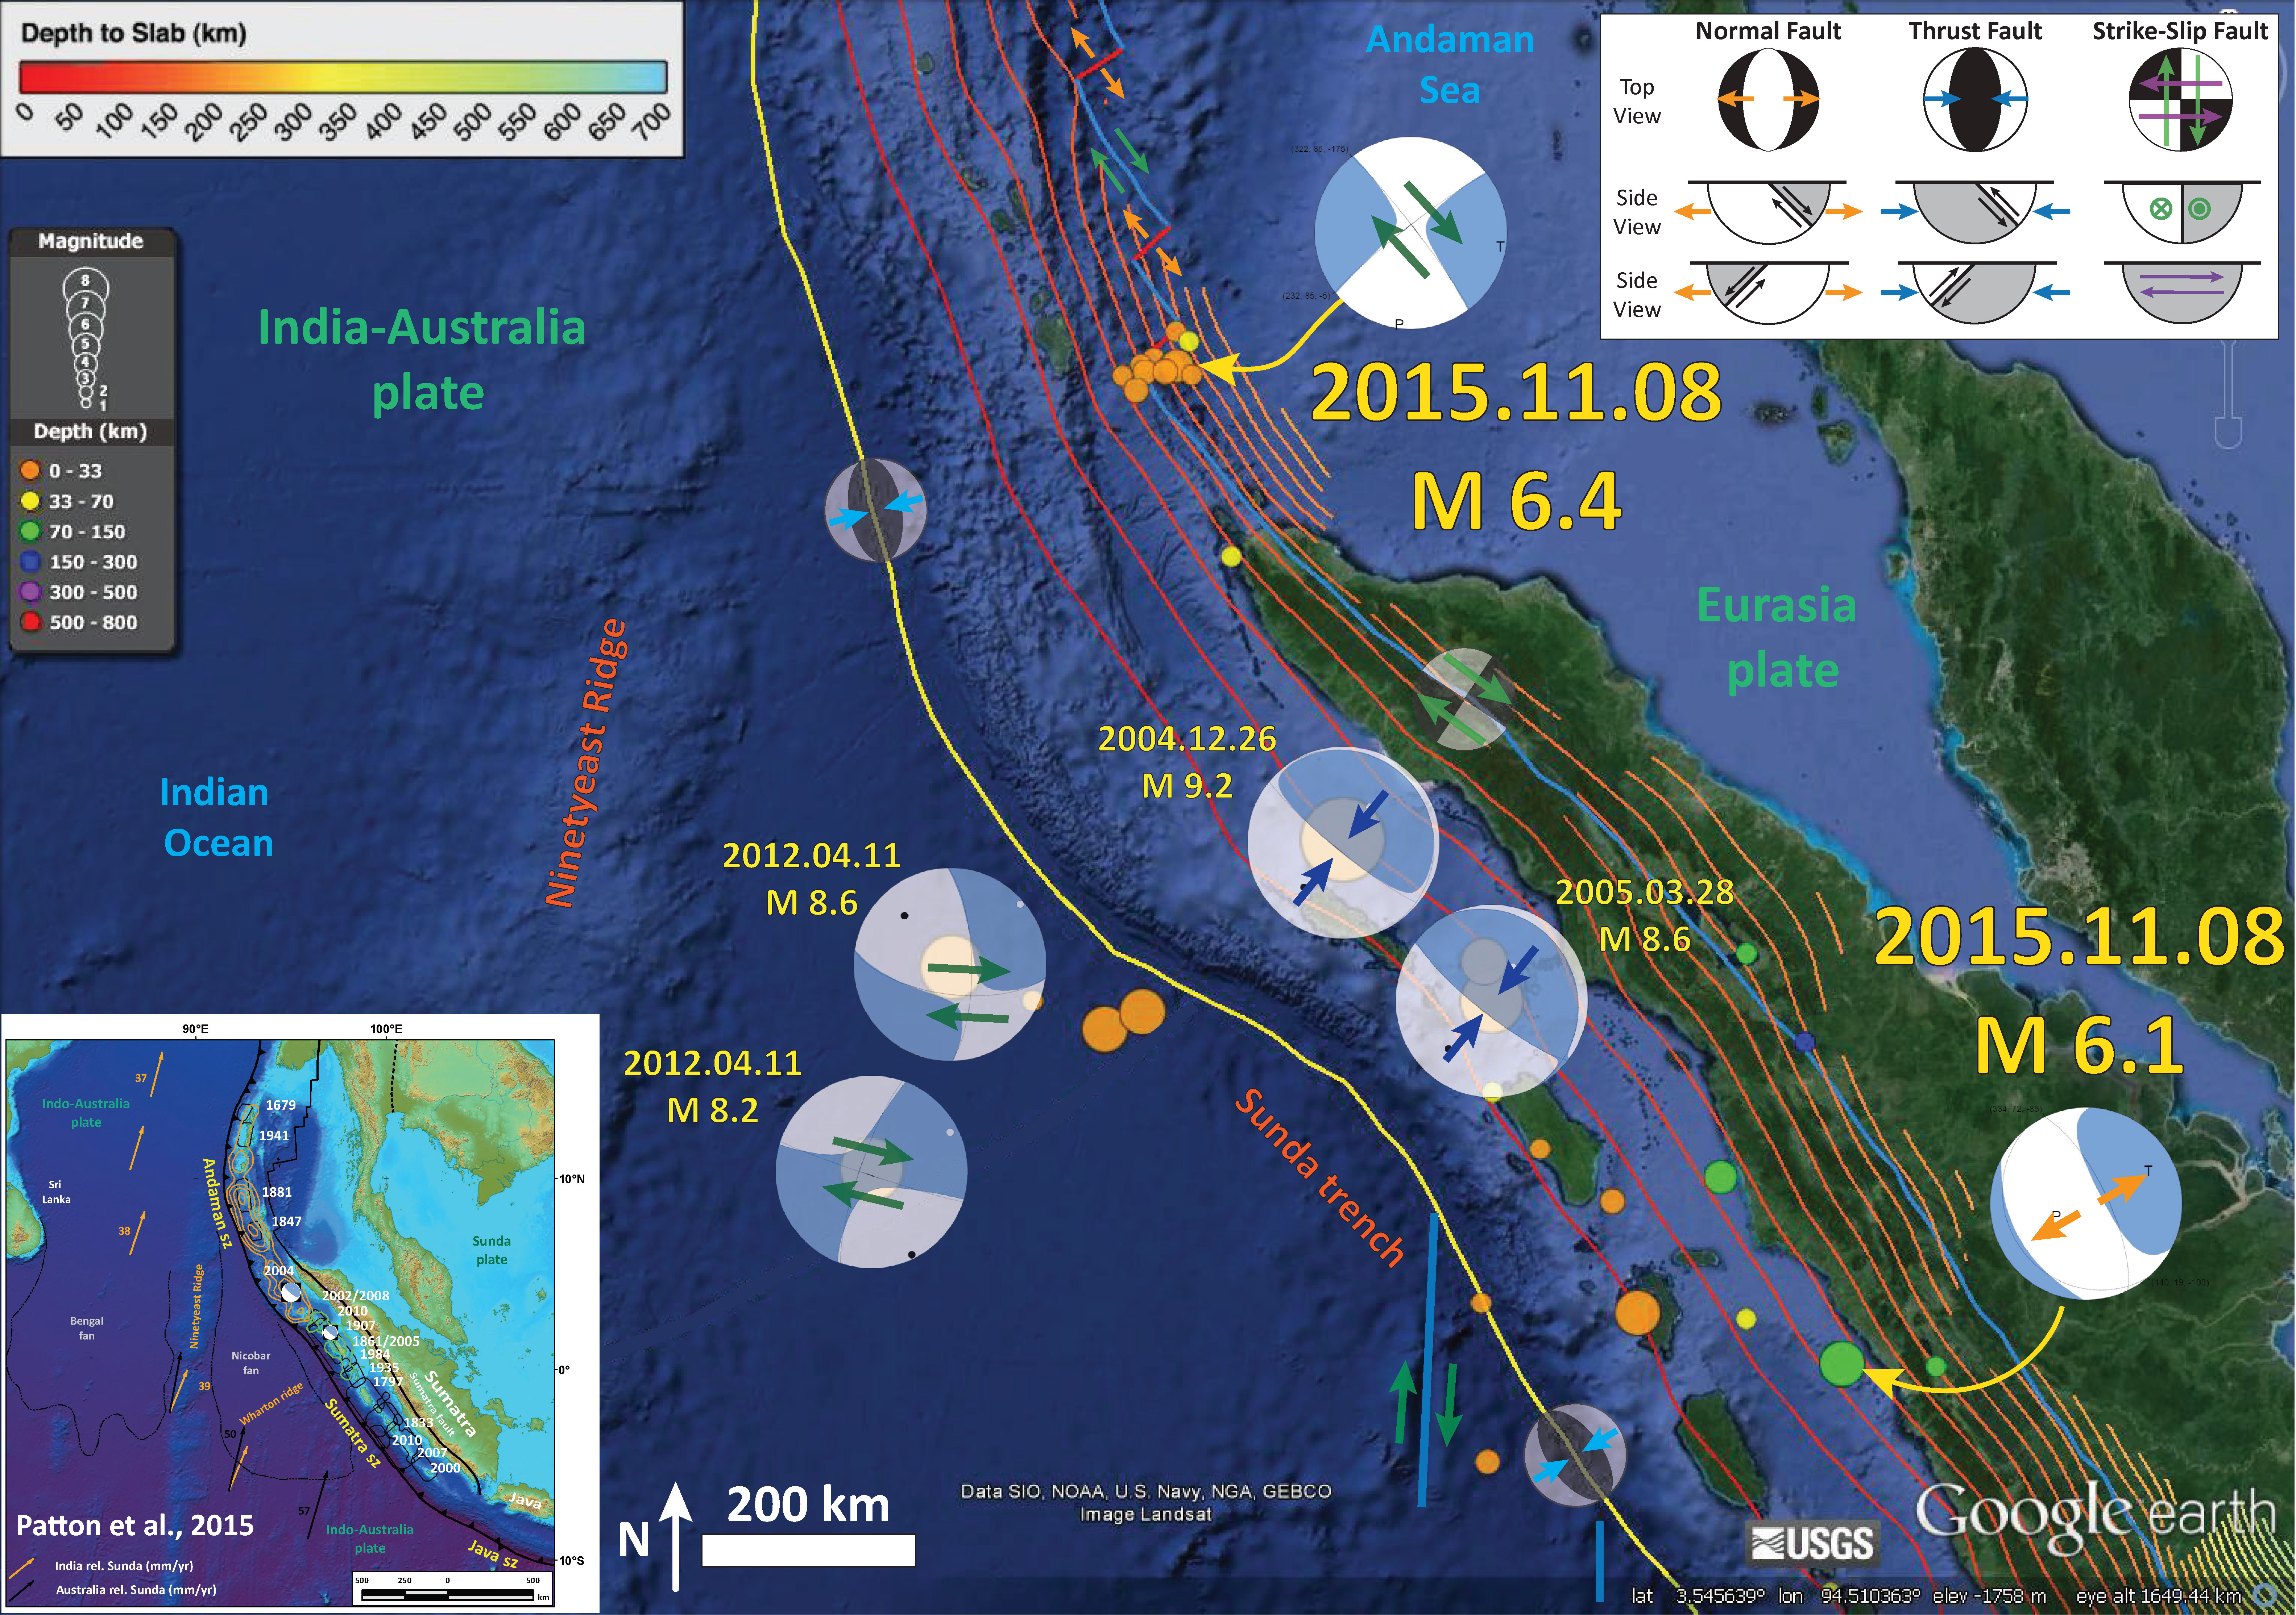
- Here is a poster that shows some earthquakes in the Andaman Sea. This is from my earthquake report from 2015.11.08.
- This map shows the fracture zones in the India-Australia plate.
Additional Static Stress Triggering!
- UPDATE 2017: Below is a video from IRIS that discusses the 2004 and 2012 earthquakes.
Data released in the Sept 2012 Nature journal yielded new information about the 2012 Sumatra earthquake. Surprising elements of this earthquake include, that it was both the largest intra-plate earthquake and the largest strike-slip earthquake ever recorded, plus the 10th largest earthquake of any kind ever recorded. Not to mention the most complex.
In 2004 a Magnitude 9.1 interplate subduction earthquake triggered a tsunami that killed over 230,000 people. Yet a nearby magnitude 8.7 intraplate earthquake in 2012, caused little damage and generated minimal ocean waves. Although the earthquakes appeared similar in magnitude and were close in proximity, they were caused by different tectonic processes related to the greater Indo Australian plate.
This animation describes the different tectonic settings of the two plates, and how the Indo-Australian plate seems destined to become two distinct tectonic plates: the Indian and the Australian plates.
Yue, Lay, Koper Nature article:
https://www.nature.com/articles/nature11492
Animation by Jenda Johnson, Earth Sciences Animated
- 2004 SASZ Earthquake Decadal Commemorative Review
- SASZ Fault Deformation
- 2017.12.15 M 6.5 Java
- 2017.08.31 M 6.3 Mentawai, Sumatra
- 2017.08.13 M 6.4 Bengkulu, Sumatra, Indonesia
- 2017.05.29 M 6.8 Sulawesi, Indonesia
- 2017.03.14 M 6.0 Sumatra
- 2017.03.01 M 5.5 Banda Sea
- 2016.10.19 M 6.6 Java
- 2016.03.02 M 7.8 Sumatra/Indian Ocean
- 2015.07.22 M 5.8 Andaman Sea
- 2015.11.08 M 6.4 Nicobar Isles
- 2012.04.11 M 8.6 Sumatra outer rise
- 2004.12.26 M 9.2 Andaman-Sumatra subduction zone
Earthquake Reports: Indonesia-Sumatra
General Overview
Earthquake Reports
, doi:10.1038/nature11492
References:
- Atwater, B.F., Yamaguchi, D.K., Bondevik, S., Barnhardt, W.A., Amidon, L.J., Benson, B.E., Skjerdal, G., Shulene, J.A., and Nanalyama ,F., 2001. Rapid resetting of an estuarine recorder of the 1964 Alaska earthquake in Geology, v. 113, no. 9, p. 1193-1204.
- Bilham, R., 2005. Partial and Complete Rupture of the Indo-Andaman Plate Boundary 1847 – 2004: Seismological Research Letters, v. 76, p. 299-311.
- Bock, Y., Prawirodirdjo, L., Genrich, J.F., Stevens, C.W., McCaffrey, R., Subarya, C., Puntodewo, S.S.O., Calais, E., 2003. Crustal motion in Indonesia from Global Positioning System measurements: Journal of Geophysical Research, v. 108, no. B8, 2367, doi: 10.1029/2001JB000324.
- Briggs, R.W., Sieh, K., Meltzner, A.J., Natawidjaja, D., Galetzka, J., Suwargadi, B., Hsu, Y.-j., Simons, M., Hananto, N., Suprihanto, I., Prayudi, D., Avouac, J.-P., Prawirodirdjo, L., Bock, Y., 2006. Deformation and Slip Along the Sunda Megathrust in the Great 2005 Nias-Simeulue Earthquake: Science, v. 311, p. 1,897-1,901.
- Chlieh, M., Avouac, J.-P., Hjorleifsdottir, V., Song, T.-R.A., Ji, C., Sieh, K., Sladen, A., Hebert, H., Prawirodirdjo, L., Bock, Y., Galetzka, J., 2007. Coseismic Slip and Afterslip of the Great (Mw 9.15) Sumatra-Andaman Earthquake of 2004: Bulletin of the Seismological Society of America, v. 97, no. 1A, p. S152-S173, doi: 10.1785/0120050631.
- Chlieh, M., Avouac, J.P., Sieh, K., Natawidjaja, D.H., Galetzka, J., 2008. Heterogeneous coupling of the Sumatran megathrust constrained by geodetic and paleogeodetic measurements: Journal of Geophysical Research, v. 113, B05305, doi: 10.1029/2007JB004981.
- Hayes, G.P., Wald, D.J., and Johnson, R.L., 2012. Slab1.0: A three-dimensional model of global subduction zone geometries in, J. Geophys. Res., 117, B01302, doi:10.1029/2011JB008524
- Ishii, M., Shearer, P.M., Houston, H., Vidale, J.E., 2005. Extent, duration and speed of the 2004 Sumatra-Andaman earthquake imaged by the Hi-Net array. Nature 435, 933.
- Malik, J.N., Shishikura, M., Echigo, T., Ikeda, Y., Satake, K., Kayanne, H., Sawai, Y., Murty, C.V.R., Dikshit, D., 2011. Geologic evidence for two pre-2004 earthquakes during recent centuries near Port Blair, South Andaman Island, India: Geology, v. 39, p. 559-562.
- Meltzner, A.J., Sieh, K., Chiang, H., Shen, C., Suwargadi, B.W., Natawidjaja, D.H., Philobosian, B., Briggs, R.W., Galetzka, J., 2010. Coral evidence for earthquake recurrence and an A.D. 1390–1455 cluster at the south end of the 2004 Aceh–Andaman rupture. Journal of Geophysical Research 115, 1-46.
- Patton, J. R., Goldfinger, C., Morey, A. E., Romsos, C., Black, B., Djadjadihardja, Y., Udrekh, 2013, Seismoturbidite Record as Preserved at Core Sites at the Cascadia and Sumatra‐Andaman Subduction Zones: : The Offshore Search of Large Holocene Earthquakes: Obergurgl, Austria, Natural Hazards and Earth System Sciences, 13, p. 833‐867
- Patton, J. R., Goldfinger, C., Morey, A. E., Ikehara, K., Romsos, C., Stoner, J., Djadjadihardja, Y., Udrekh, Ardhyastuti, S., Gaffar, E.Z., and Viscaino, A. A 6500 year earthquake history in the region of the 2004 Sumatra‐Andaman subduction zone Earthquake, Geosphere, vol. 11, no. 6, p. 1‐62, doi:10.1130/GES01066.1
- Plafker, G., 1969. Tectonics of the March 27, 1964 Alaska earthquake: U.S. Geological Survey Professional Paper 543–I, 74 p., 2 sheets, scales 1:2,000,000 and 1:500,000, http://pubs.usgs.gov/pp/0543i/.
- Prawirodirdjo, P., McCaffrey,R., Chadwell, D., Bock, Y, and Subarya, C., 2010. Geodetic observations of an earthquake cycle at the Sumatra subduction zone: Role of interseismic strain segmentation, JOURNAL OF GEOPHYSICAL RESEARCH, v. 115, B03414, doi:10.1029/2008JB006139
- Rajendran, C.P., Rajendran, K., Anu, R., Earnest, A., Machado, T., Mohan, P.M., Freymueller, J., 2007. Crustal Deformation and Seismic History Associated with the 2004 Indian Ocean Earthquake: A Perspective from the Andaman–Nicobar Islands: Bulletin of The Seismological Society of America, v. 97, S174-S191, doi: 10.1785/0120050630.
- Shearer, P., and Burgmann, R., 2010. Lessons Learned from the 2004 Sumatra-Andaman Megathrust Rupture, Annu. Rev. Earth Planet. Sci. v. 38, pp. 103–31
- Singh, S.C., Carton, H.L., Tapponnier, P, Hananto, N.D., Chauhan, A.P.S., Hartoyo, D., Bayly, M., Moeljopranoto, S., Bunting, T., Christie, P., Lubis, H., and Martin, J., 2008. Seismic evidence for broken oceanic crust in the 2004 Sumatra earthquake epicentral region, Nature Geoscience, v. 1, pp. 5.
- Smith, W.H.F., Sandwell, D.T., 1997. Global seafloor topography from satellite altimetry and ship depth soundings: Science, v. 277, p. 1,957-1,962.
- Sumner, E., Siti, M., McNeil, L.C., Talling, P.J., Henstock, T., Wynn, R., Djadjadihardja, Y., Permana, H., 2013. Can turbidites be used to reconstruct a paleoearthquake record for the central Sumatran margin?: Geology, v. 41, p. 763-766.
- Subarya, C., Chlieh, M., Prawirodirdjo, L., Avouac, J., Bock, Y., Sieh, K., Meltzner, A.J., Natawidjaja, D.H., McCaffrey, R., 2006. Plate-boundary deformation associated with the great Sumatra–Andaman earthquake: Nature, v. 440, p. 46-51.
- Tolstoy, M., Bohnenstiehl, D.R., 2006. Hydroacoustic contributions to understanding the December 26th 2004 great Sumatra–Andaman Earthquake. Survey of Geophysics 27, 633-646.
- Yue, H., Lay, T., and Koper, K.D., 2012. En échelon and orthogonal fault ruptures of the 11 April 2012 great intraplate earthquakes. in Nature, v. 490, p. 245-249, doi:10.1038/nature11492
1 thought on “Earthquake Anniversary: Sumatra-Andaman 2004 M 9.2 & 2005 M 8.6”