While I was spending time with my friend Steve Tillinghast (he is getting married on Saturday), there was a Great Earthquake offshore of Chiapas, Mexico. This is one of four M 8 or greater earthquakes ever recorded along the subduction zone forming the Middle American Trench. There has recently been some seismic activity to the east of this current M 8.1 earthquake (now 8.2). These earthquakes happened near the boundary between the North America (NAP) and Caribbean (CP) upper plates.
This M 8.1 earthquake happened in a region of the subduction zone that is interpreted to have a higher coupling ratio than further to the south (higher proportion of the plate convergence rate is accumulated as elastic strain due to seismogenic coupling of the megathrust fault). Faults that are aseismic (fully slipping) have a coupling ratio of zero. The Polochic-Motagua fault zone marks this NAP-CP boundary. The recent seismicity offshore of Guatemala (June 2017) comprised a series of thrust earthquakes along the upper megathrust, along with some down-dip extensional faulting.
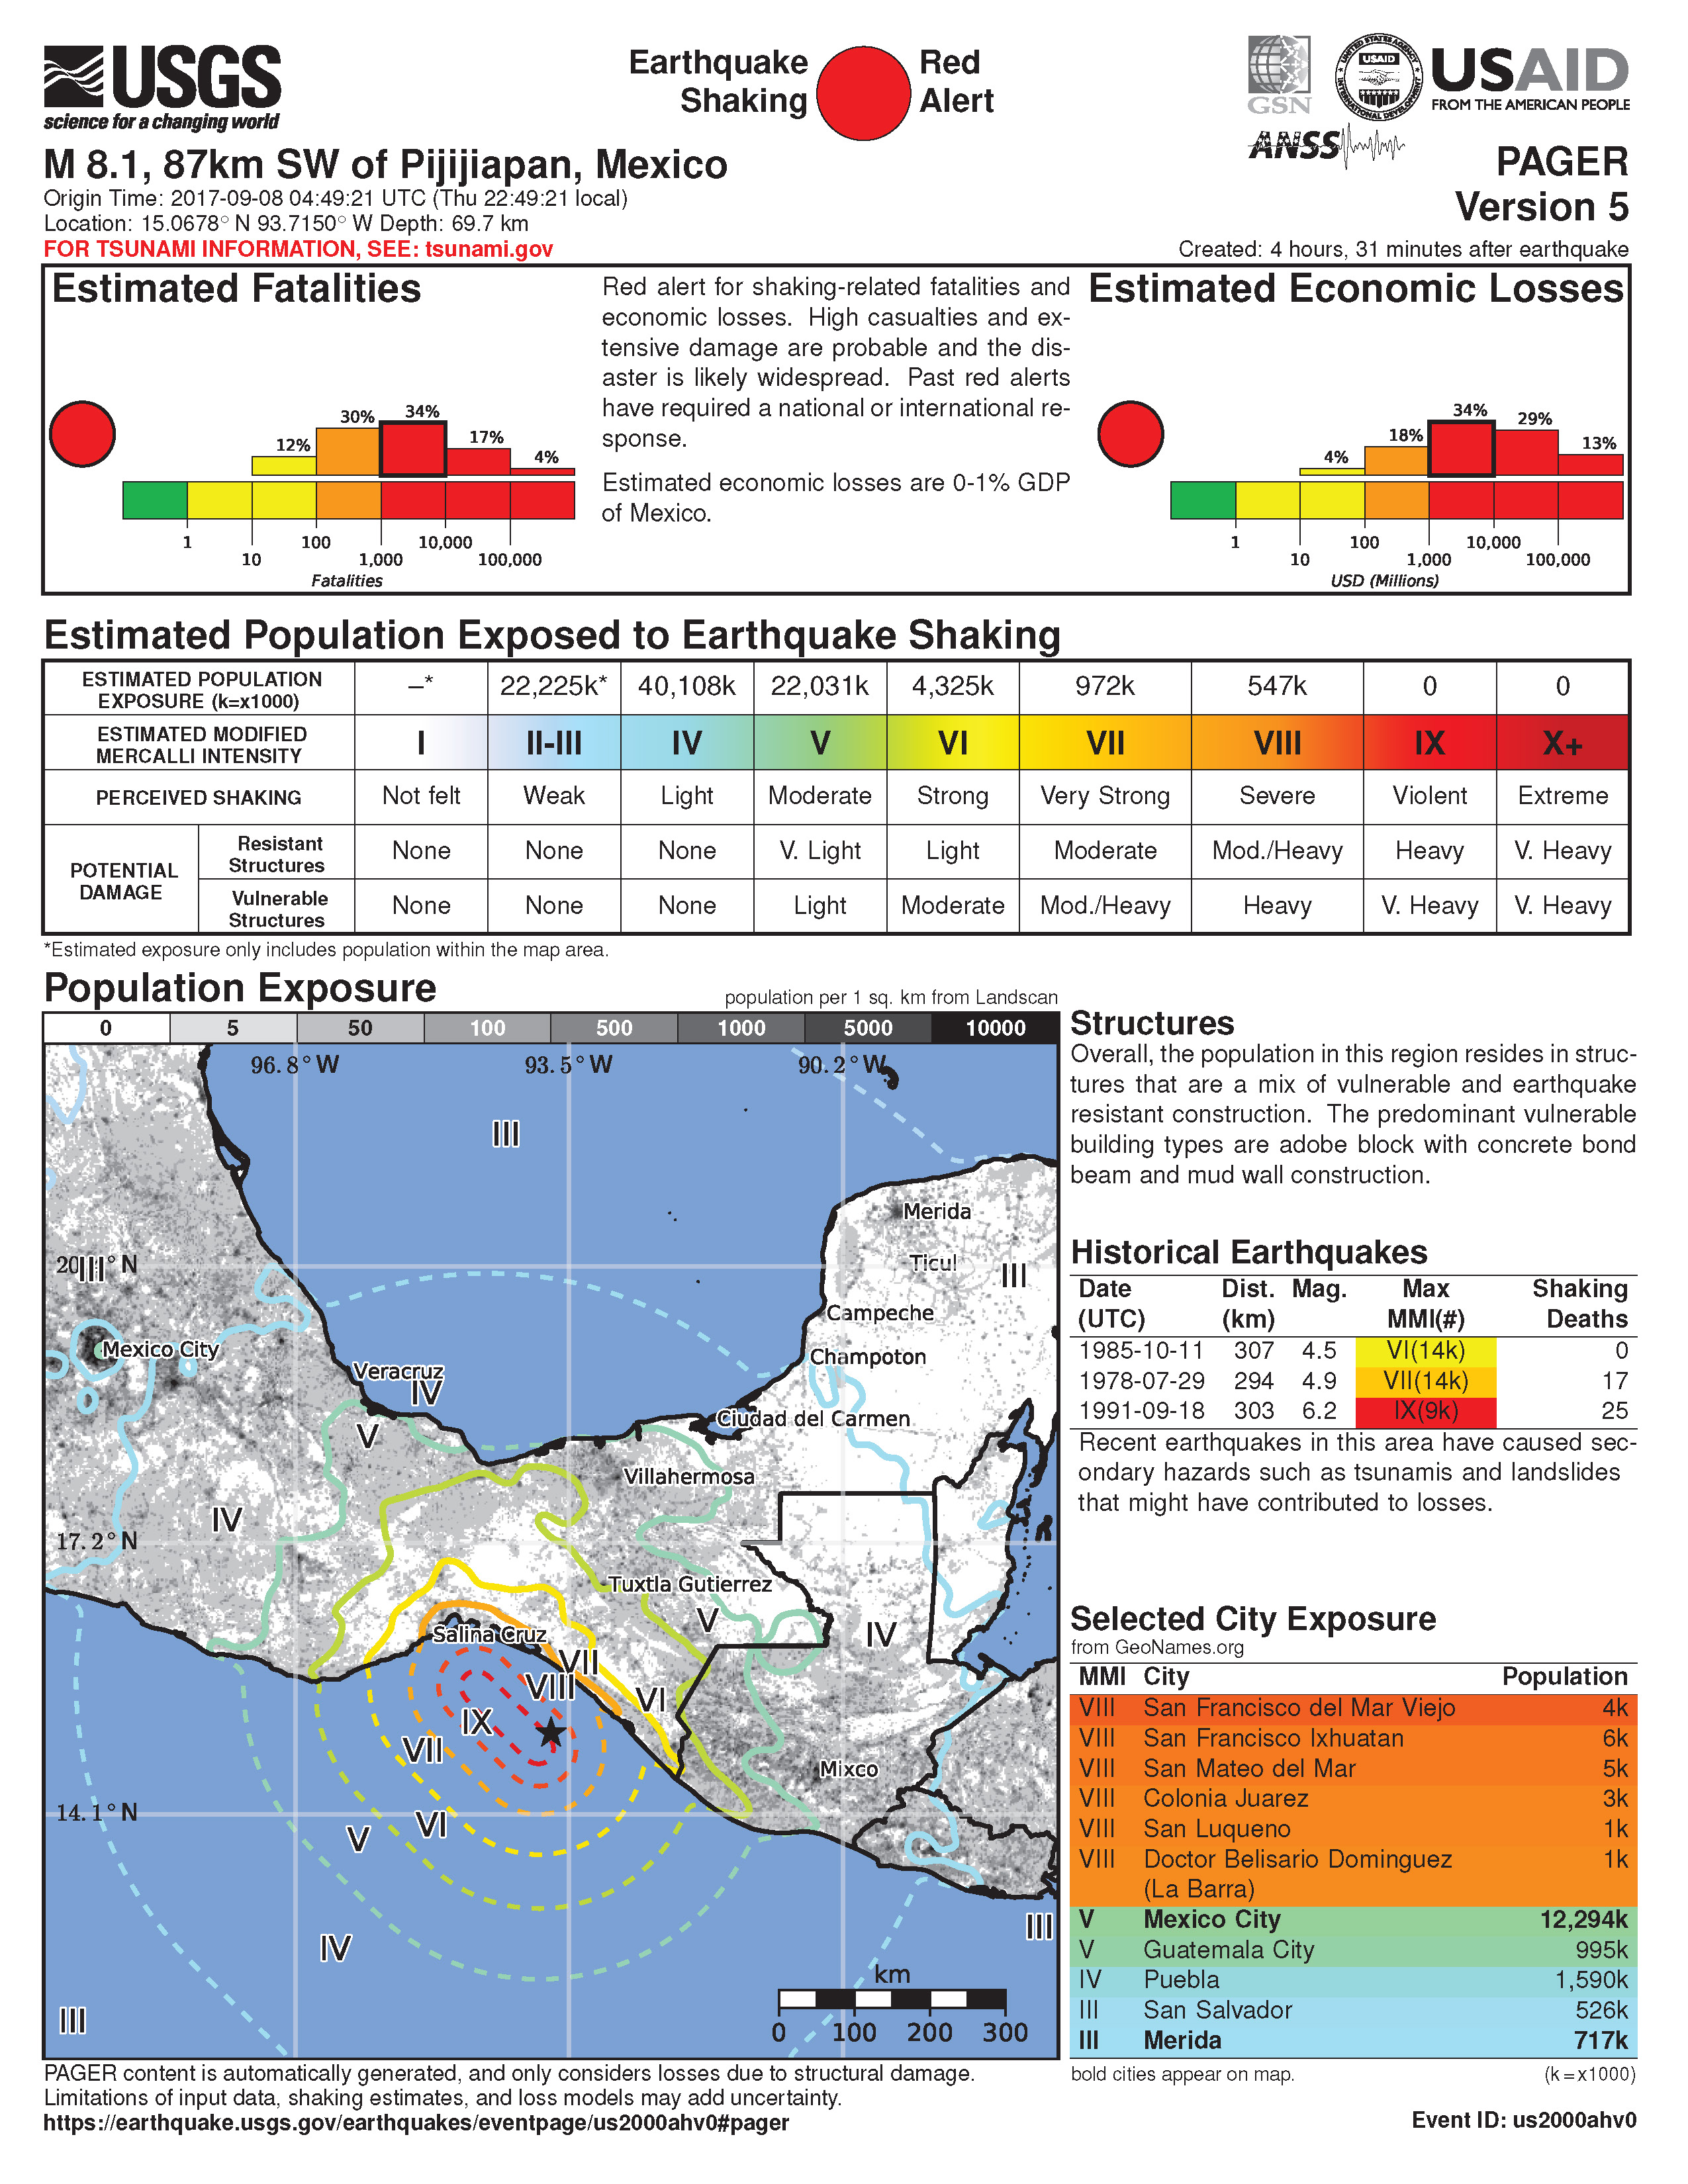
Tonight’s earthquake will be a very damaging and deadly earthquake and, based upon the shake map, possibly more damaging than either the 1985 or 1995 earthquakes. The 1985 earthquake caused severe damage in Mexico City. The PAGER alert shows an estimate of 34% probability for between 1000 and 10,000 fatalities. However, please read below about the PAGER alert and go to the USGS website about PAGER alerts (link below). These are just model based estimates of damage, so we won’t really know the damage until this is evaluated with “boots on the ground.” One might consider PAGER alerts to be the “armchair estimate” of damage. Thanks to Dr. Lori Dengler for reviewing my report (though any mistakes are only to be credited to me).
This M 8.1 (8.2) earthquake is deeper than the megathrust fault and has an extensional moment tensor. This is not a megathrust earthquake, but is related to slip on a fault in the downgoing Cocos plate. At this depth, it may be due to bending in the downgoing oceanic lithosphere.
There is no danger of a tsunami here along the west coast of the U.S. West Coast, British Colombia, or Alaska. There have been some tsunami observations.
- Here are the USGS web pages for these four Great Earthquakes.
- 1932.06.03 M 8.1 Jalisco, Mexico
- 1985.09.19 M 8.0 Colima, Mexico
- 1995.10.09 M 8.0 Colima, Mexico
- 2017.09.08 M 8.2 Chiapas, Mexico
- UC Berkeley Seismo Blog
- earthquake report dot com
- Callan Bentley’s AGU blog, “Mountain Beltway“
- IPGP Geoscope
Here are some additional reports found elsewhere on the internets (President G. W. Bush used to call the internet, “the internets”. heheh).
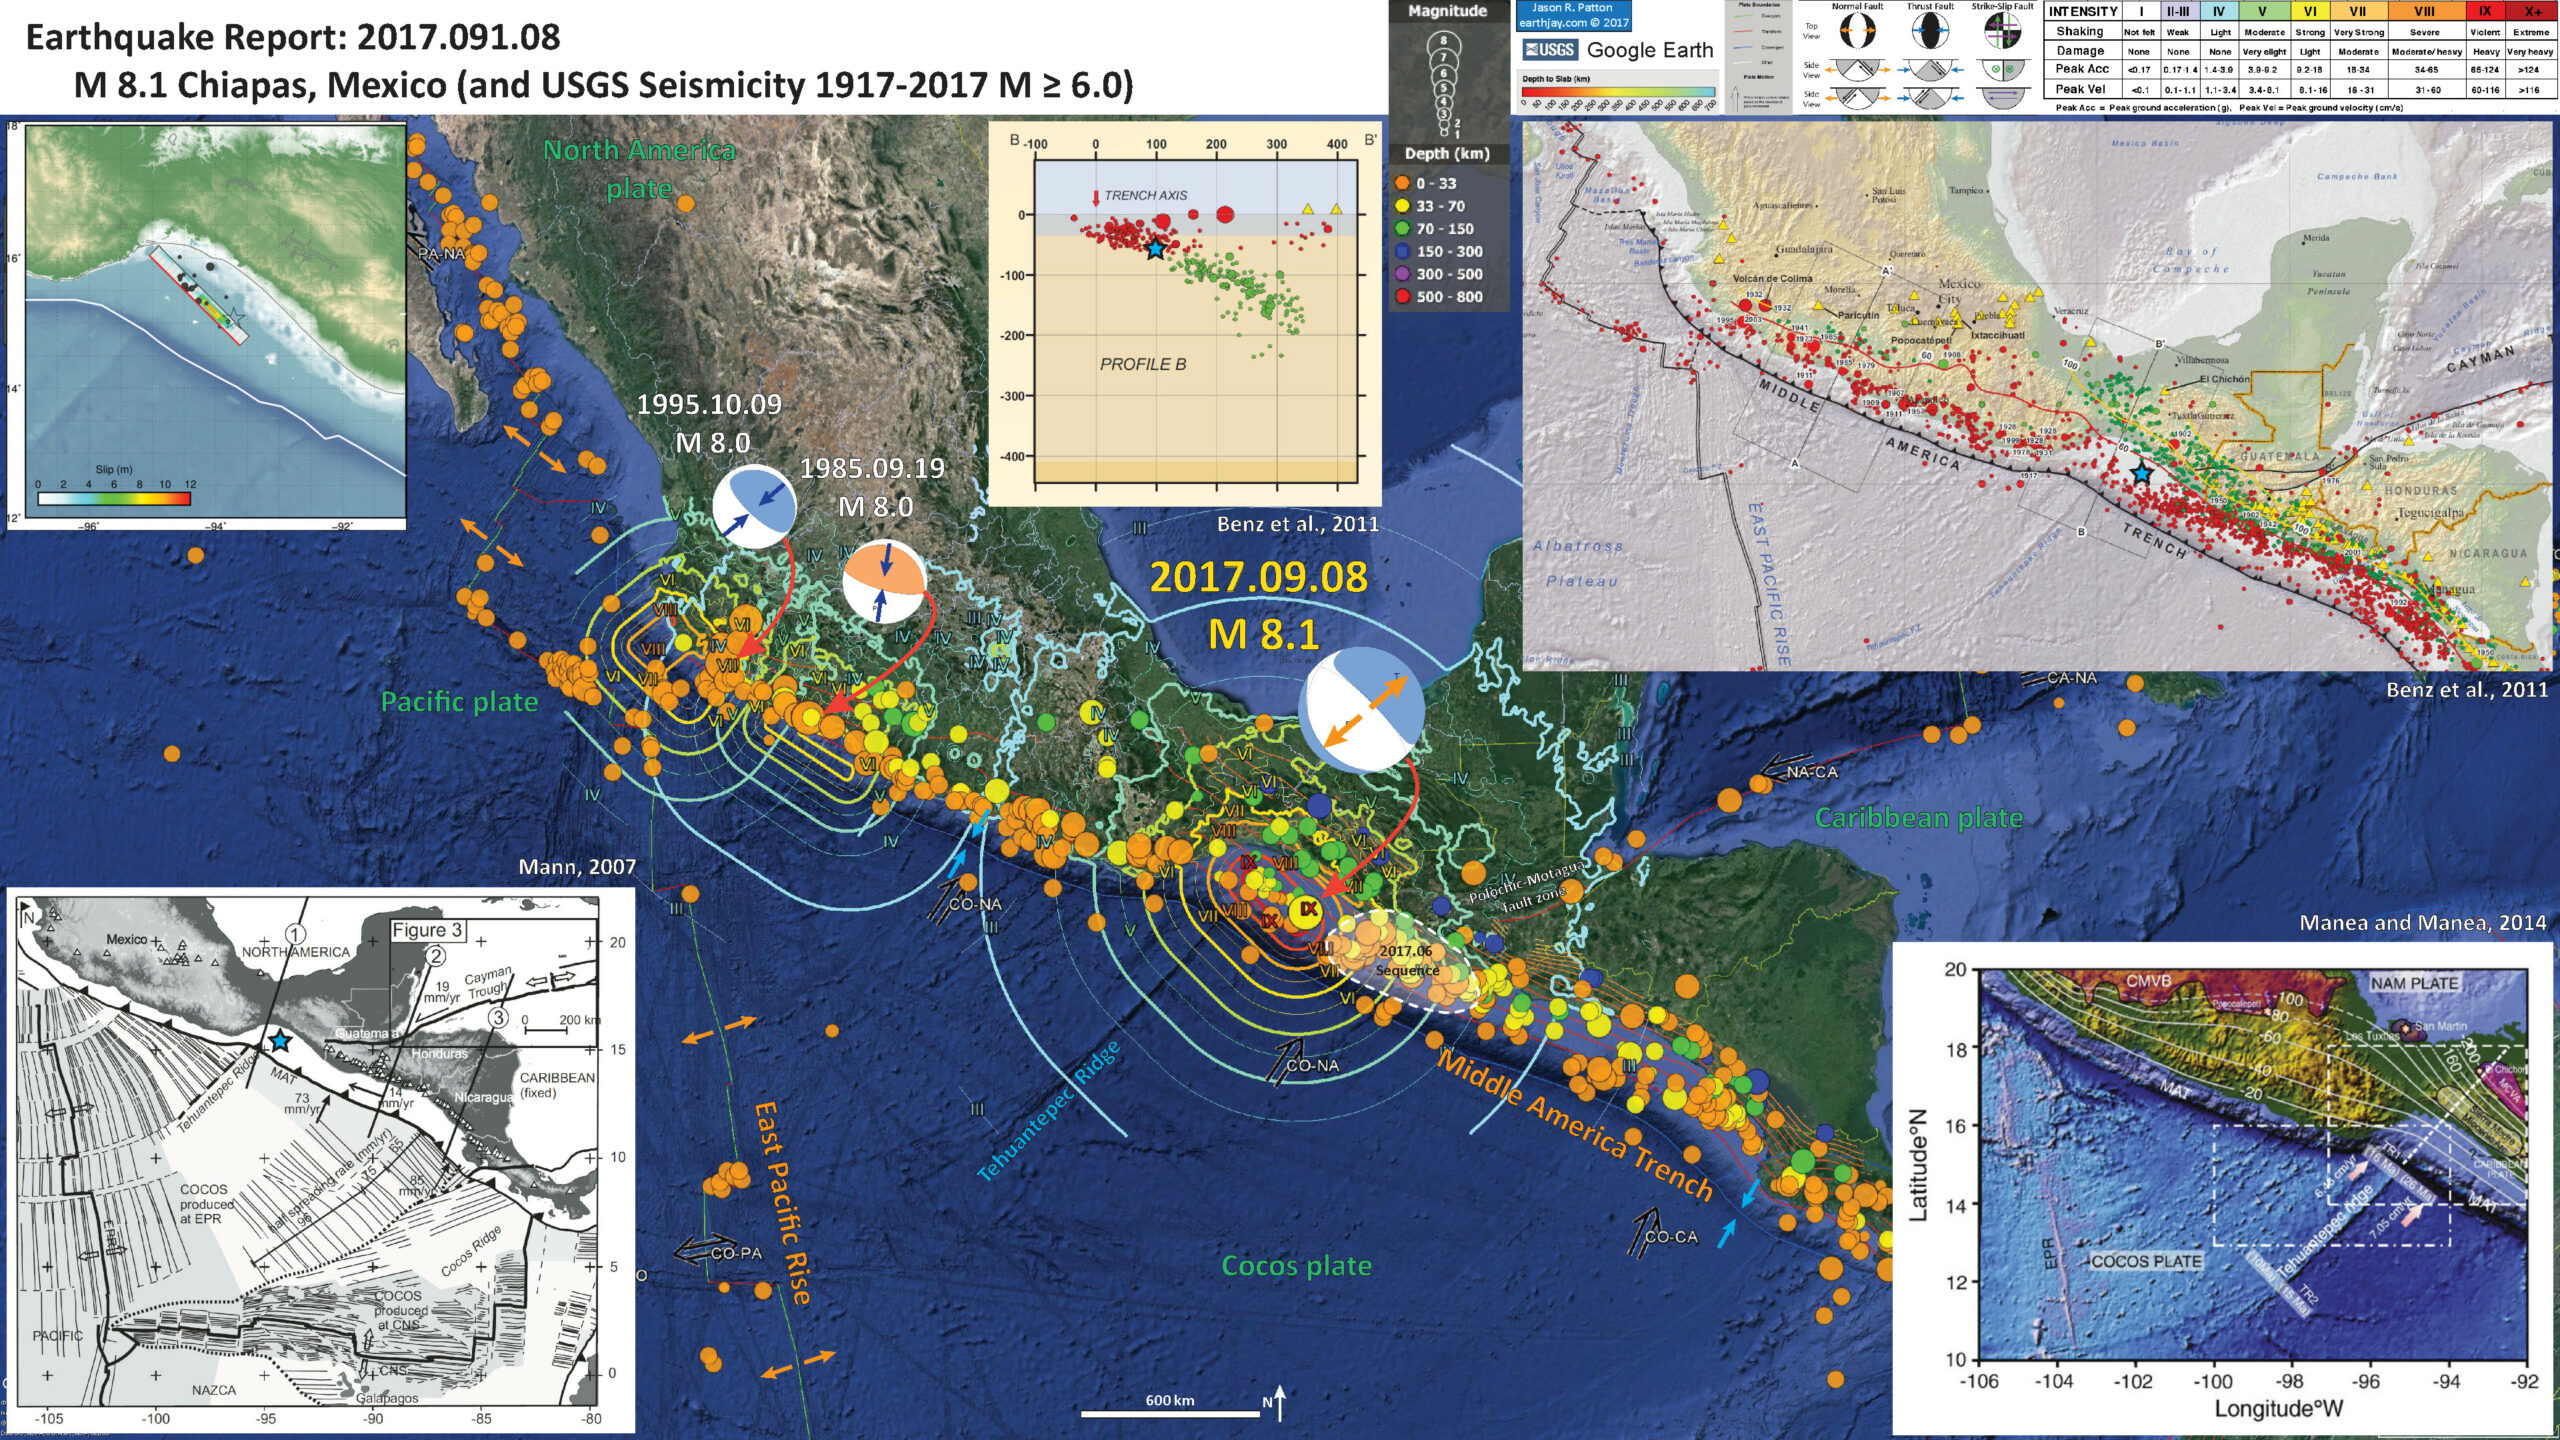
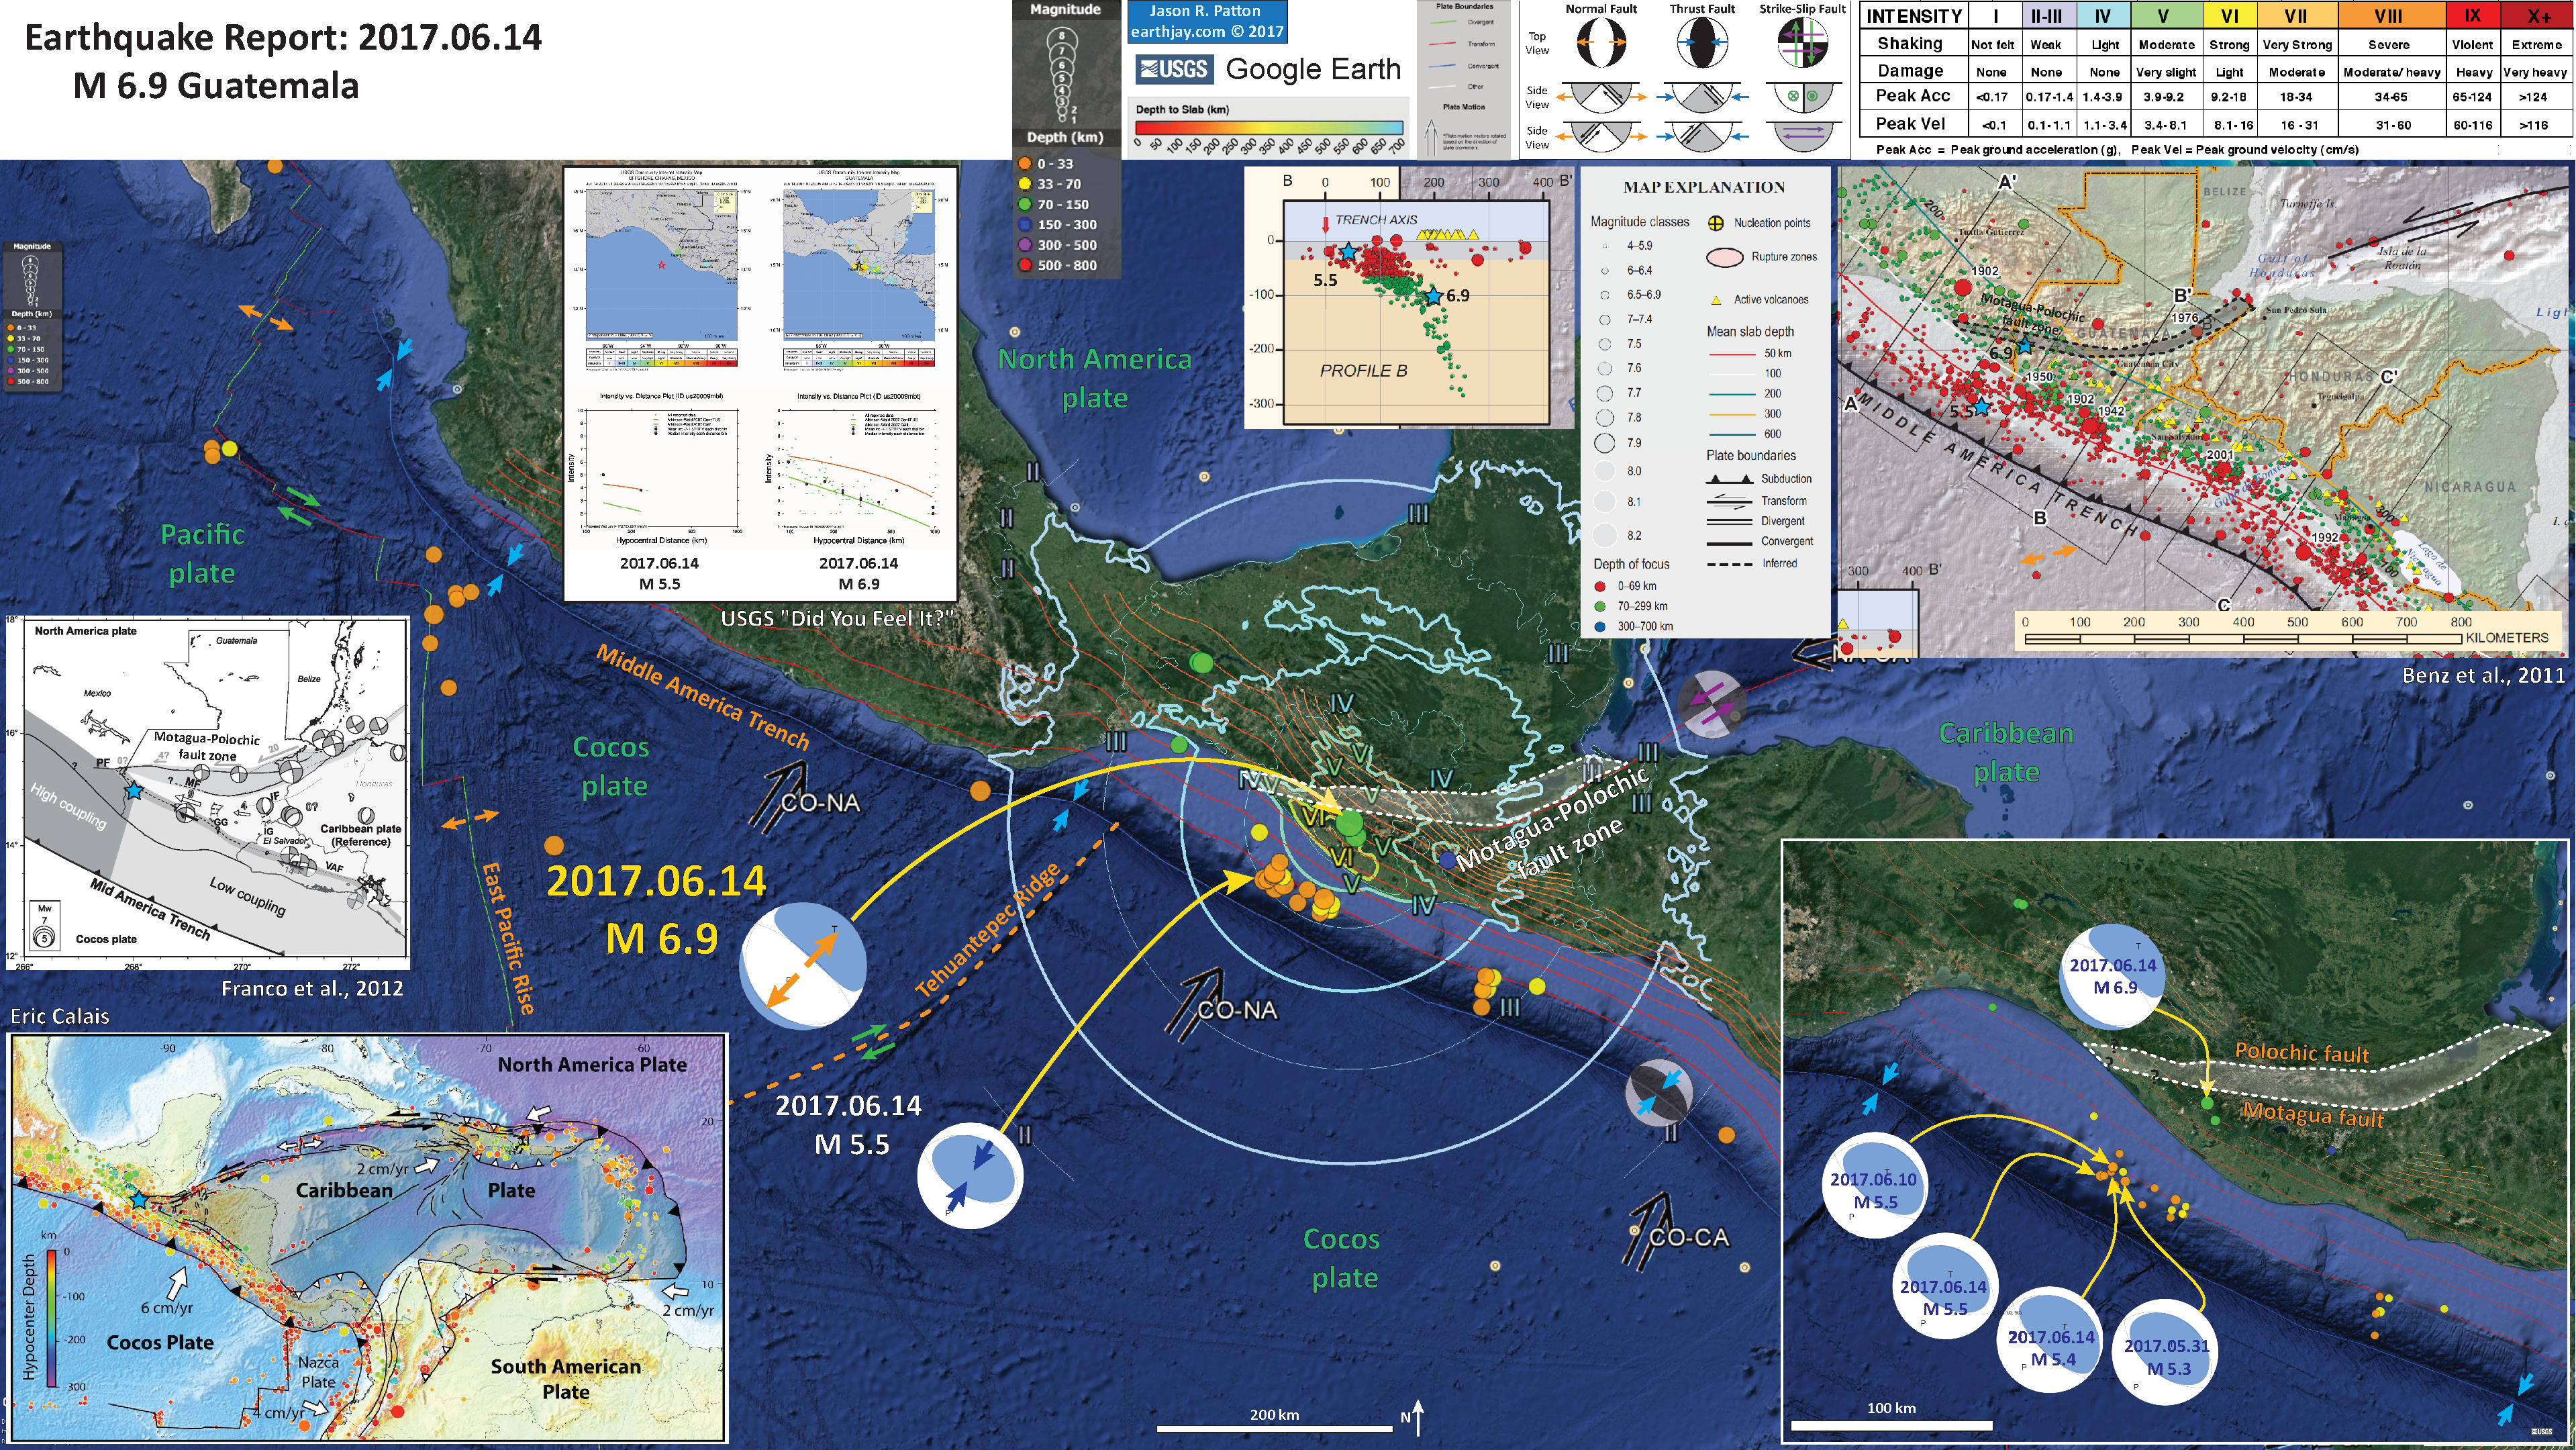
Below is my interpretive poster for this earthquake
I plot the seismicity from the past month, with color representing depth and diameter representing magnitude (see legend). I also include USGS epicenters from 1917-2017 for magnitudes M ≥ 8.0. I include fault plane solutions for the 1985 and 1995 earthquakes (along with the MMI contours for those earthquakes, see below for a discussion of MMI contours).
- I placed a moment tensor / focal mechanism legend on the poster. There is more material from the USGS web sites about moment tensors and focal mechanisms (the beach ball symbols). Both moment tensors and focal mechanisms are solutions to seismologic data that reveal two possible interpretations for fault orientation and sense of motion. One must use other information, like the regional tectonics, to interpret which of the two possibilities is more likely.
- I also include the shaking intensity contours on the map. These use the Modified Mercalli Intensity Scale (MMI; see the legend on the map). This is based upon a computer model estimate of ground motions, different from the “Did You Feel It?” estimate of ground motions that is actually based on real observations. The MMI is a qualitative measure of shaking intensity. More on the MMI scale can be found here and here. This is based upon a computer model estimate of ground motions, different from the “Did You Feel It?” estimate of ground motions that is actually based on real observations. Note how much larger the MMI intensity is for this earthquake, compared to the 1985 and 1995 earthquakes.
- I include the slab contours plotted (Hayes et al., 2012), which are contours that represent the depth to the subduction zone fault. These are mostly based upon seismicity. The depths of the earthquakes have considerable error and do not all occur along the subduction zone faults, so these slab contours are simply the best estimate for the location of the fault.
- In the lower left corner is a map from Mann (2007) that shows the regional tectonics. Plate boundary faults are in bold line, while lineations representing the spreading history are represented by thinner lines. I place a blue star in the general location of tonight’s M 8.1 earthquake (also in other inset maps).
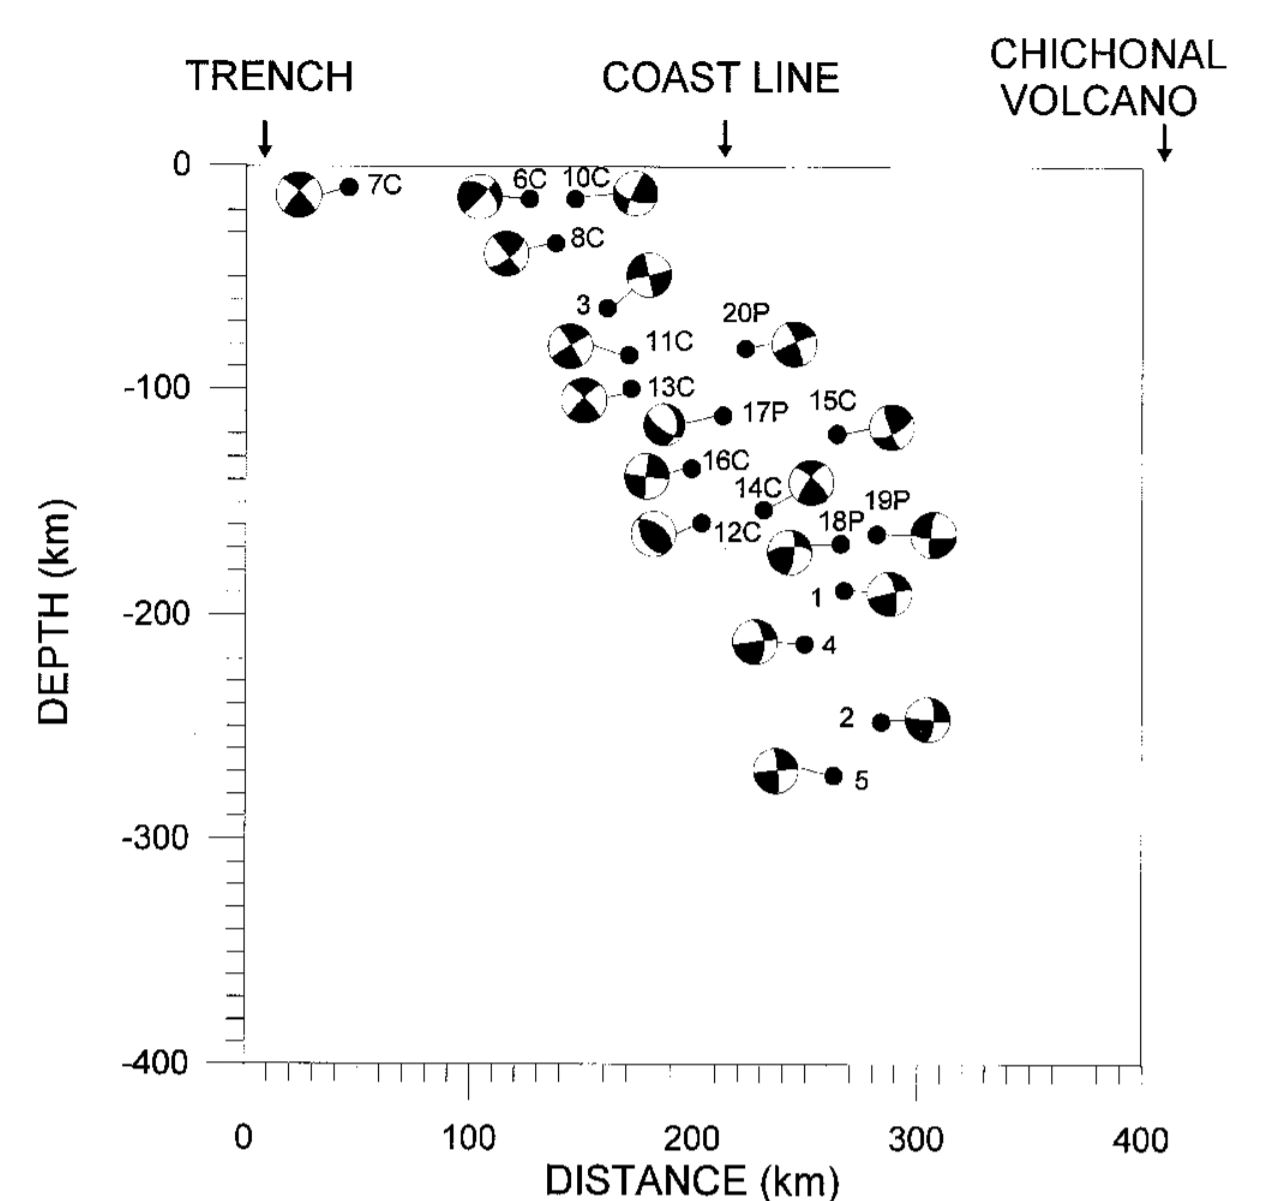
- in the upper right corner is a map showing USGS seismicity in this region (Benz et al., 2011 a). To the left I present their cross section B-B’ showing USGS hypocenters. This cross section is shown as a blue line on the map.
- In the upper left corner is the USGS fault slip model.
- In the lower right corner is a map that shows the Tehuantepec Ridge and how the oceanic lithosphere varies across this boundary. The crust has different ages on either side of this transform fault, which can control the stresses imposed upon the fault on either side of this fault.
I include some inset figures in the poster.
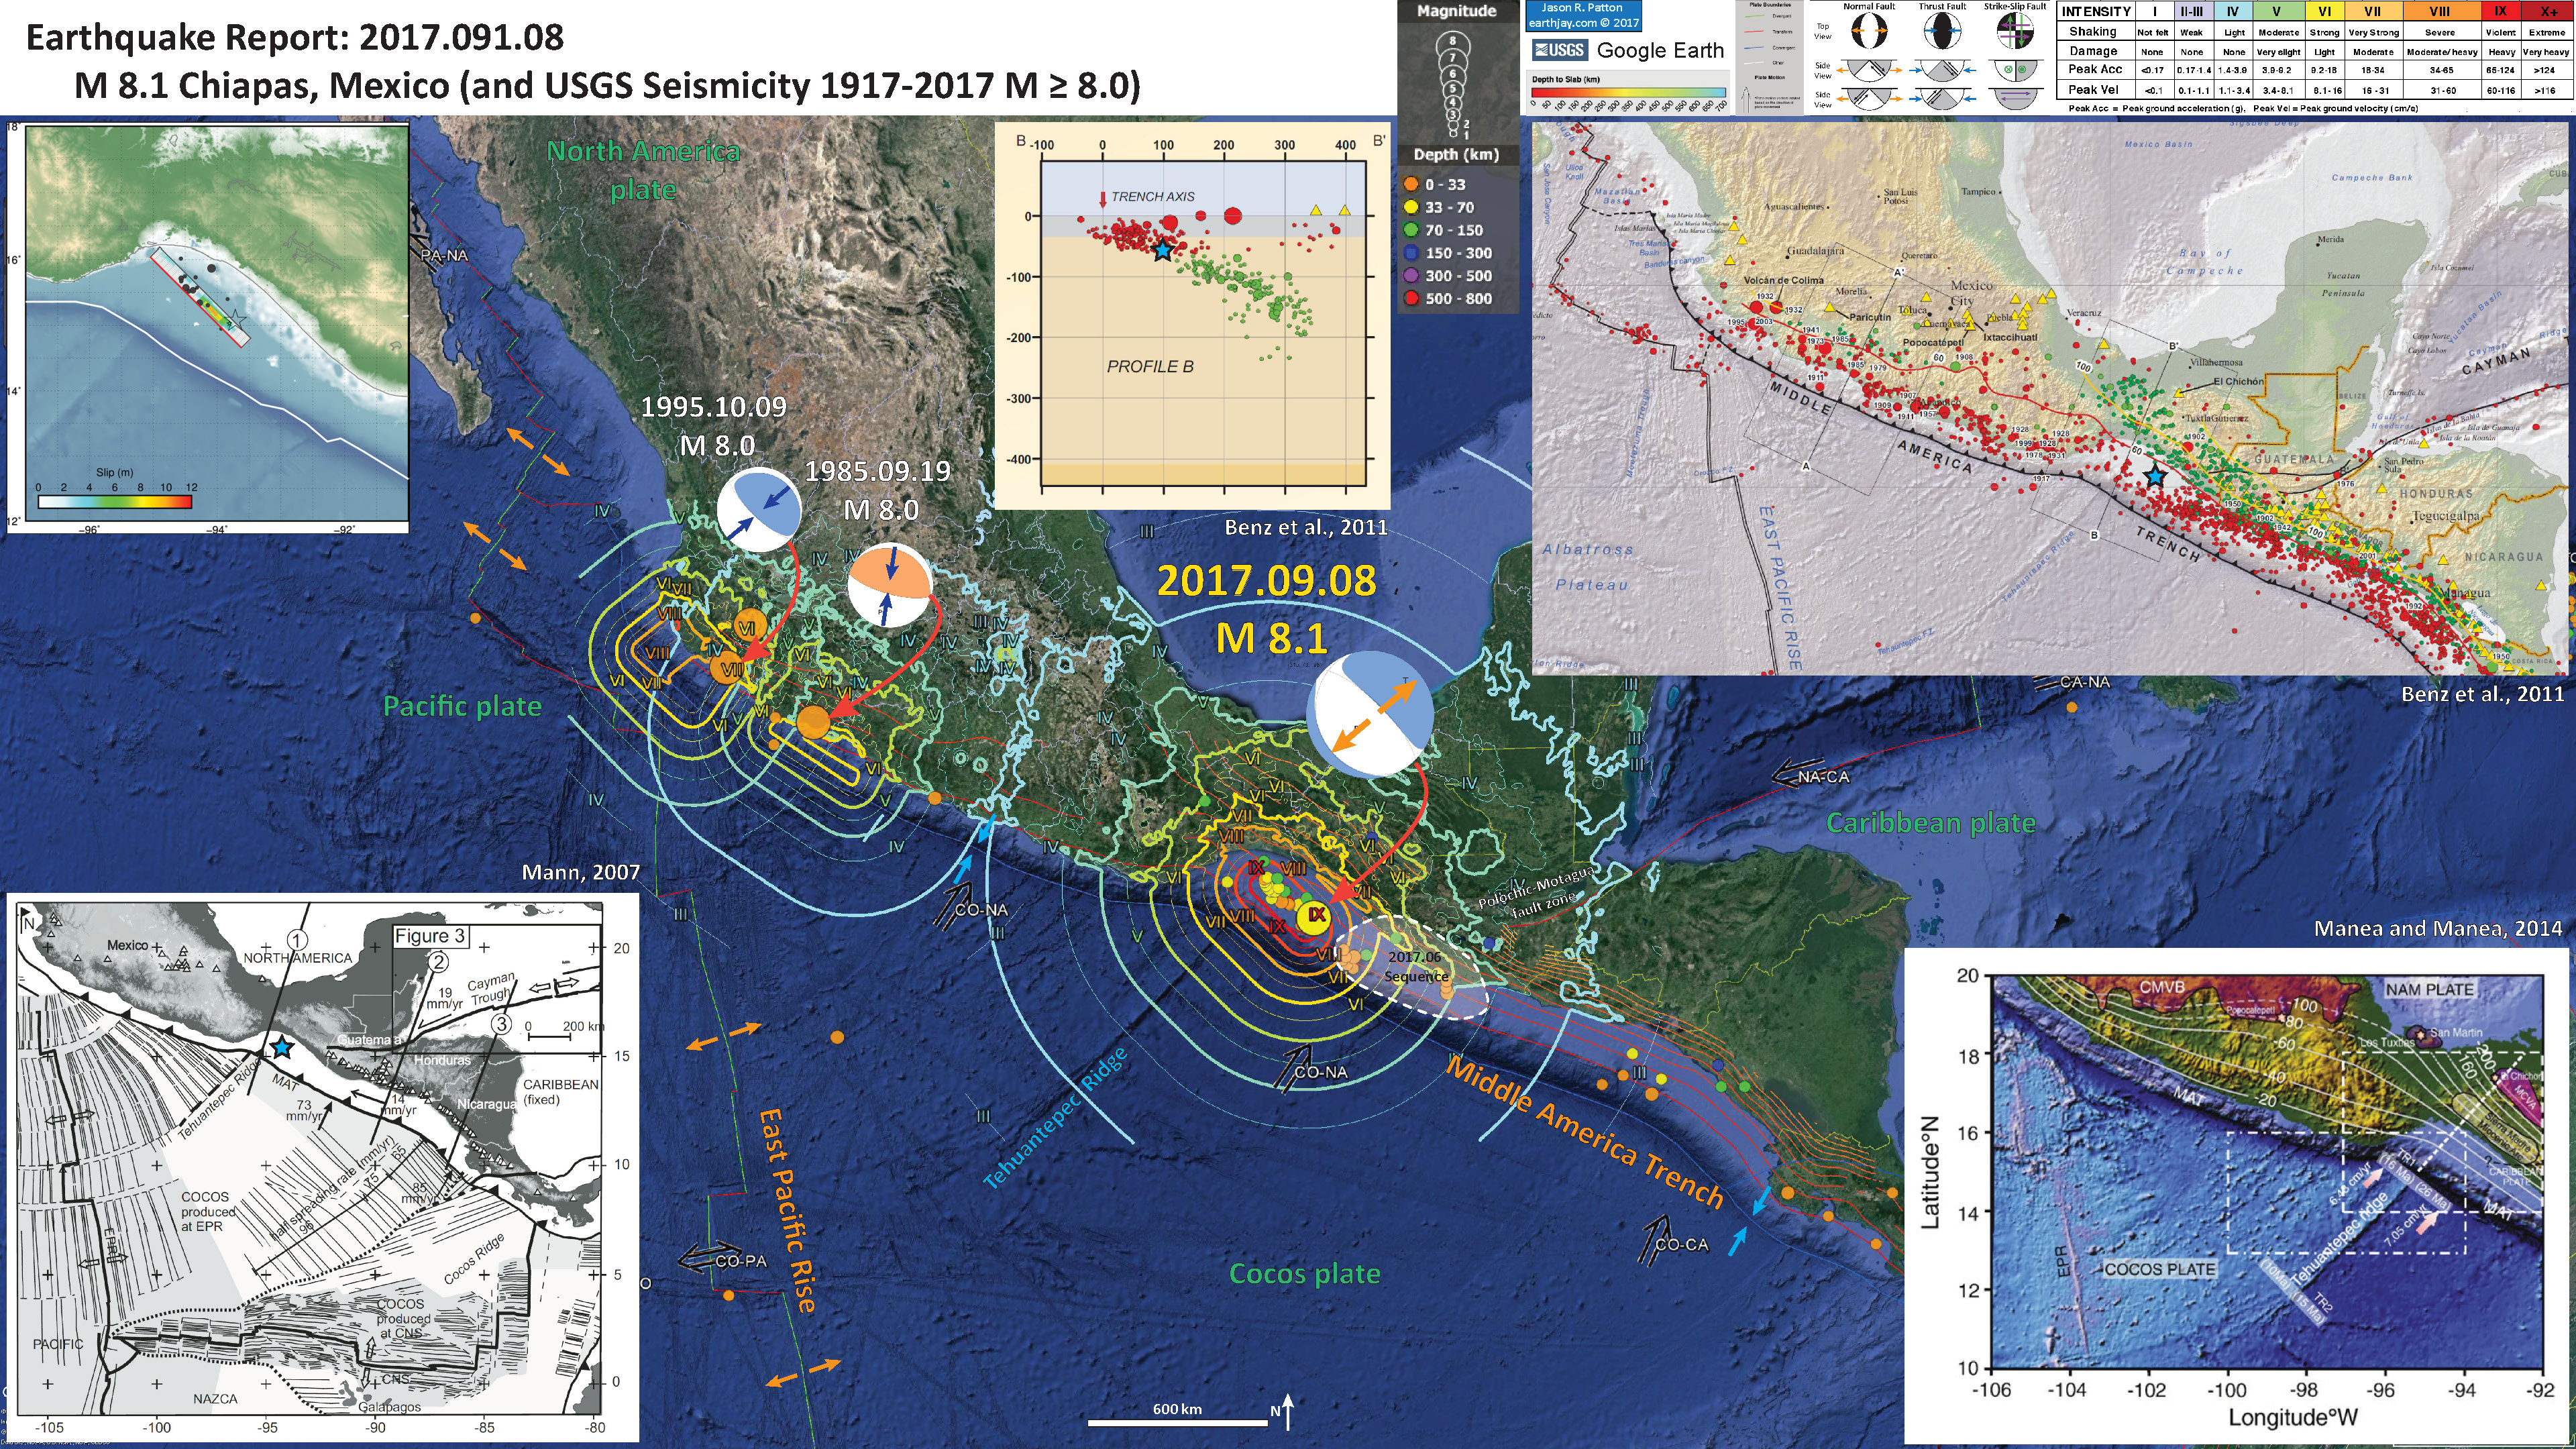
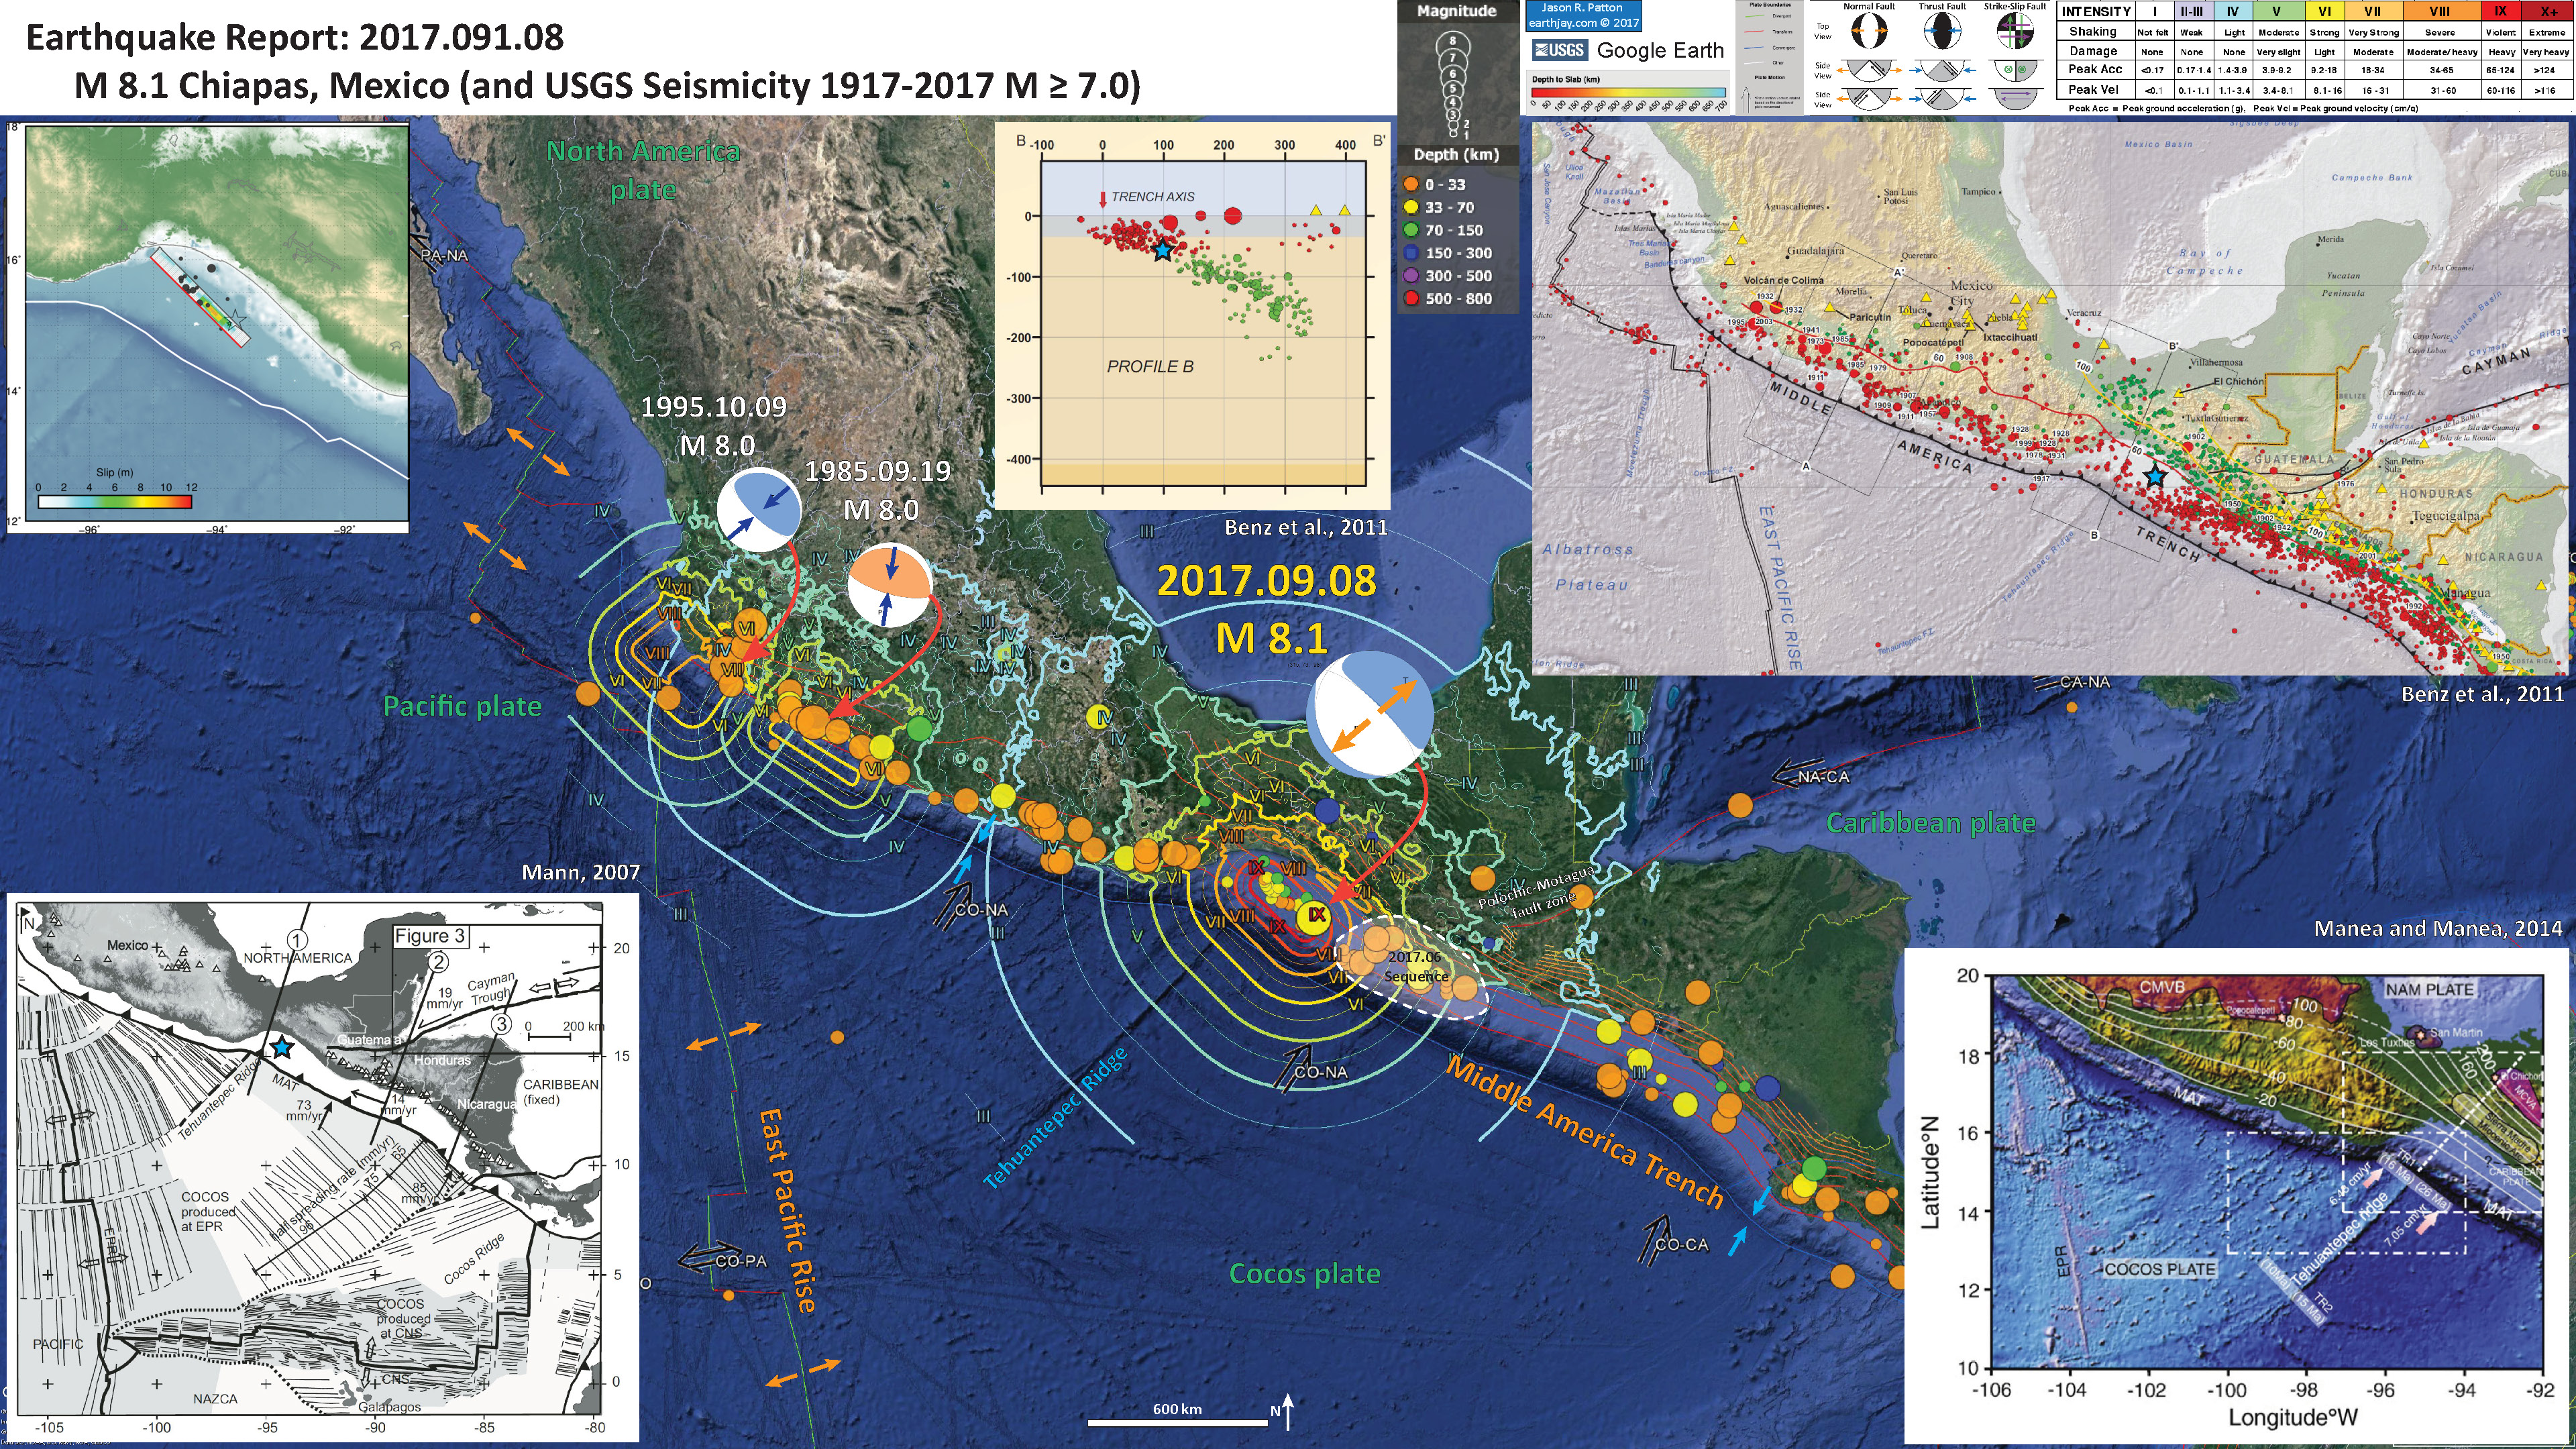
- Here is the same poster, but shows seismicity with earthquakes of smaller magnitudes (M 7).
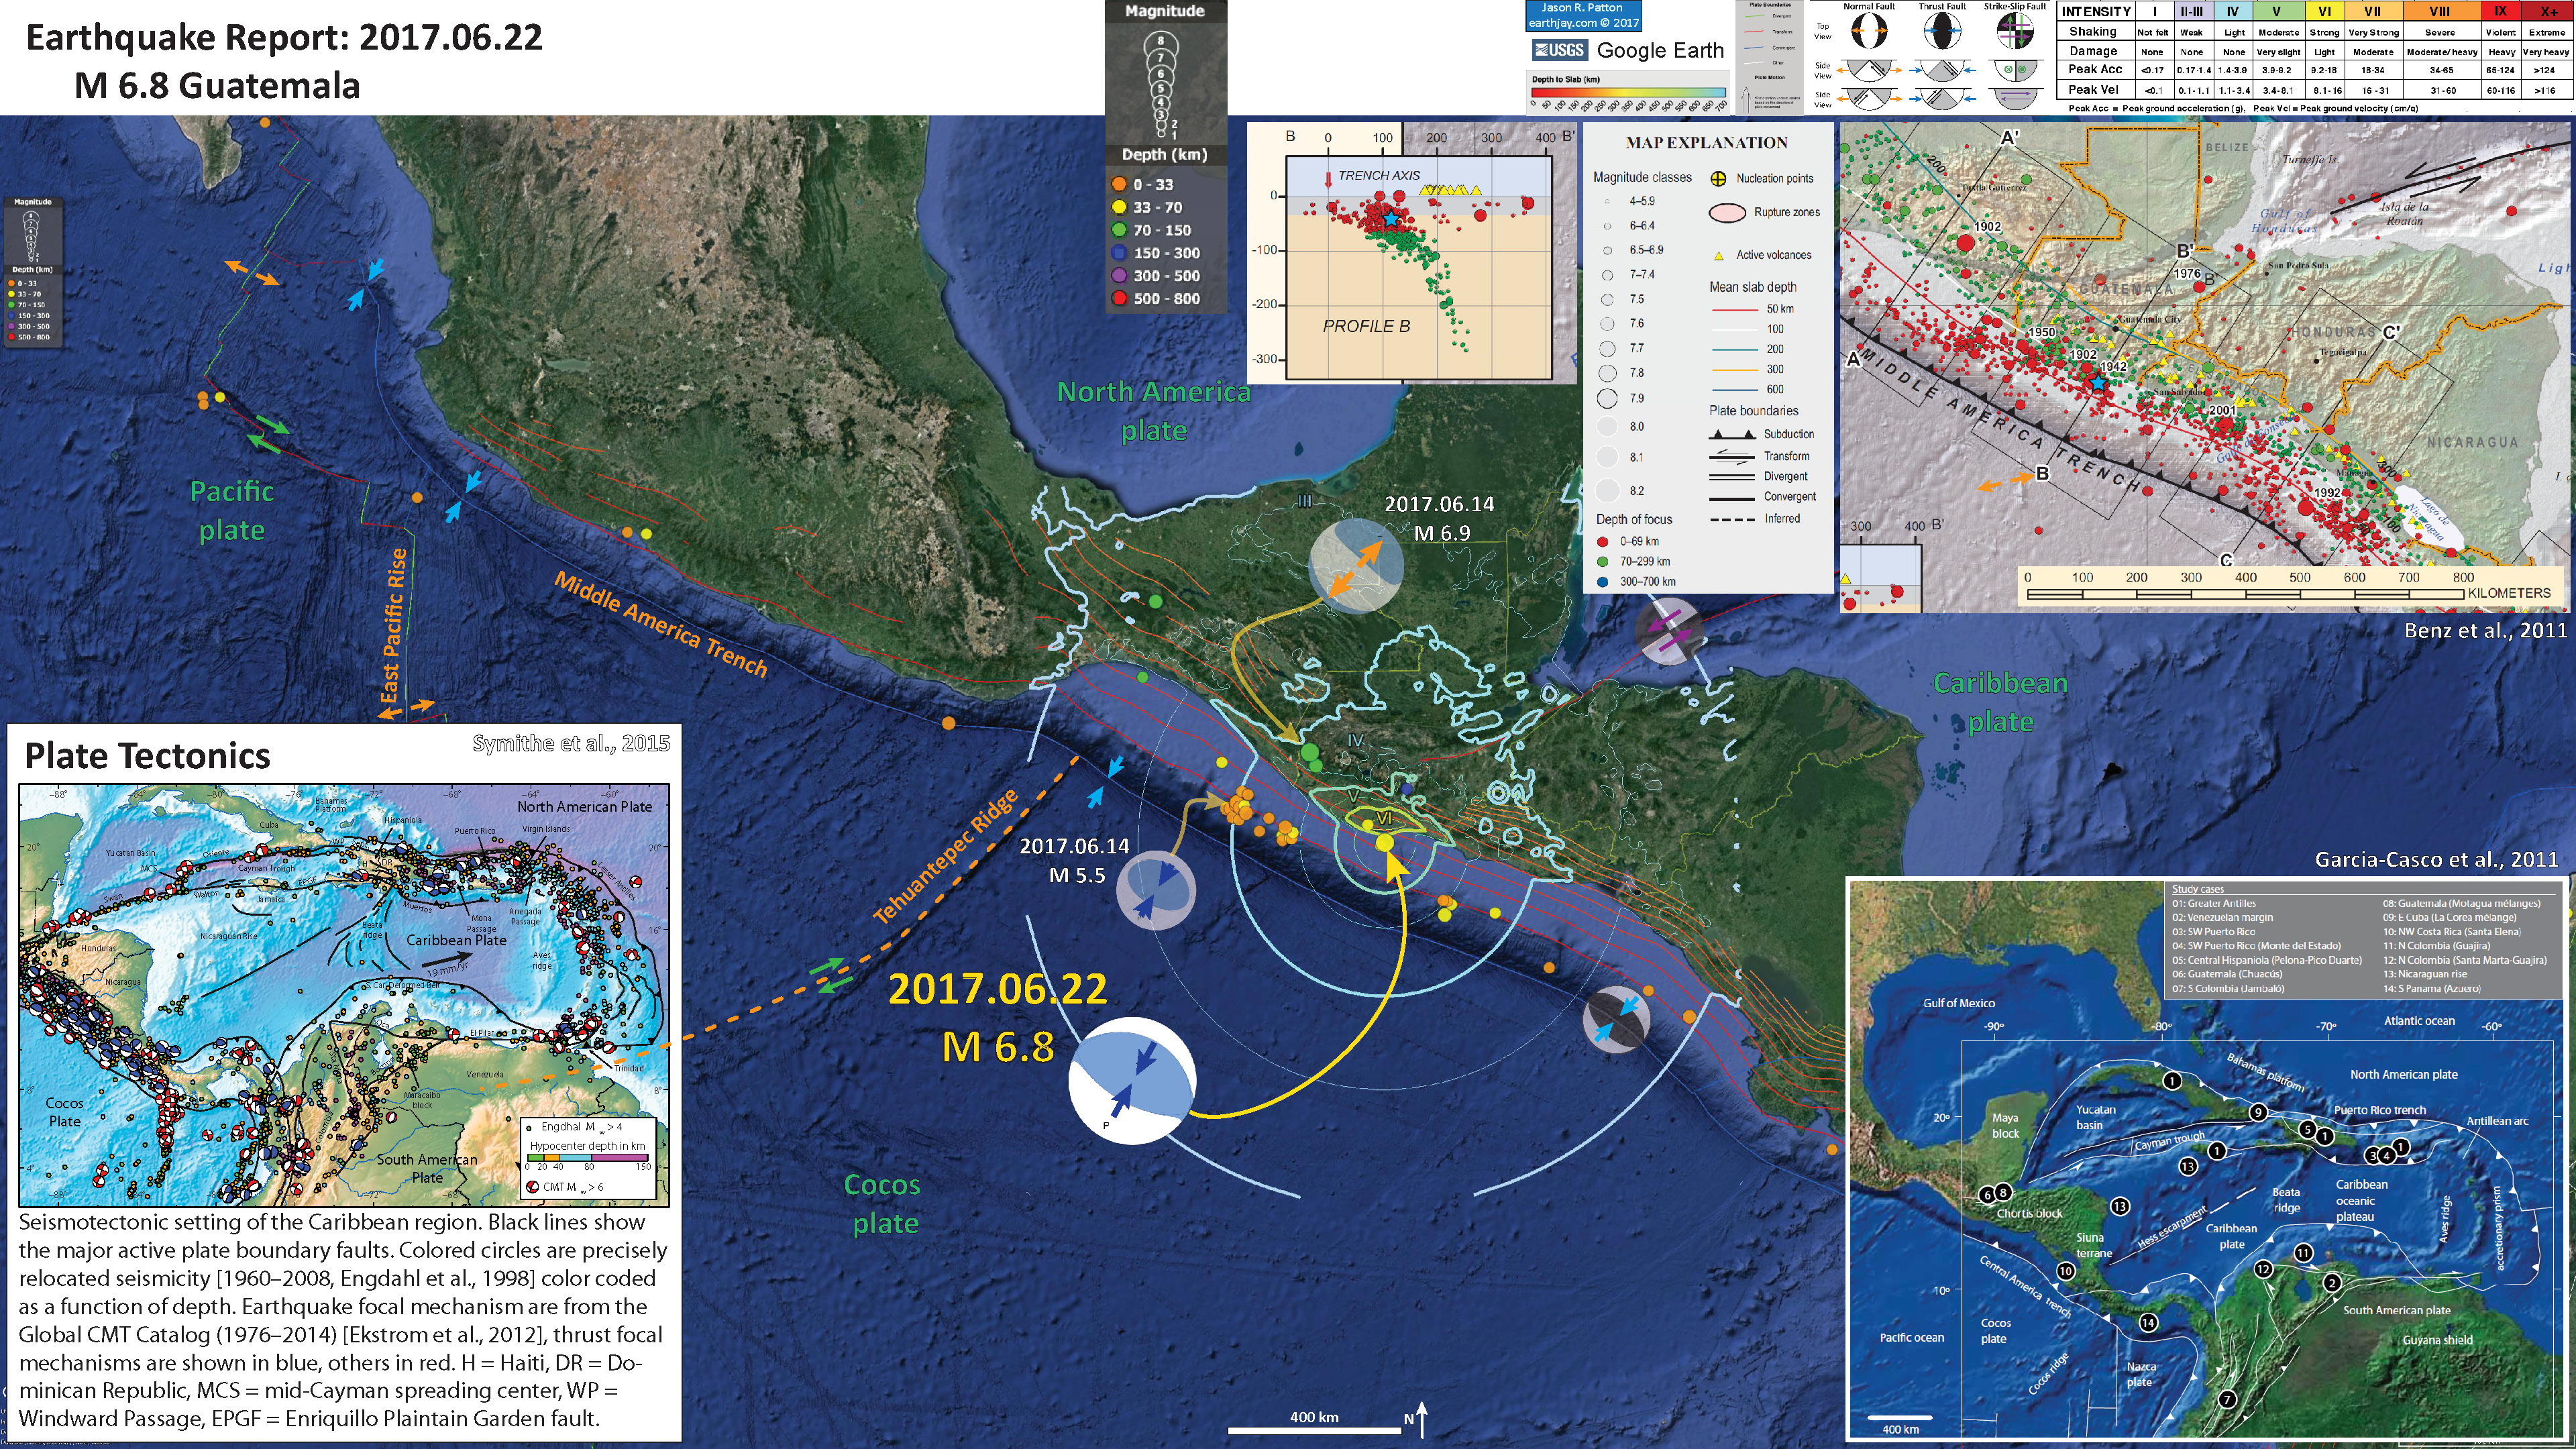
- Here is the interpretive poster from the recent earthquakes in Guatemala. This is my report for this earthquake.
- This is also from this sequence, but includes some other inset figures. From this report.
- As mentioned above, this earthquake has the potential to cause much harm to people and their belongings and infrastructure. Below is the USGS report that includes estimates of damage to people (possible fatalities) and their belongings from the Rapid Assessment of an Earthquake’s Impact (PAGER) report. More on the PAGER program can be found here. An explanation of a PAGER report can be found here. PAGER reports are modeled estimates of damage. On the top is a histogram showing estimated casualties and on the right is an estimate of possible economic losses. This PAGER report suggests that there will be quite a bit of damage from this earthquake (and casualties). This earthquake has a high probability of damage to people and their belongings.
- Here is the threat forecast from the Pacific Tsunami Warning Center. The below all come from this report.
TSUNAMI THREAT FORECAST
———————–
* TSUNAMI WAVES REACHING MORE THAN 3 METERS ABOVE THE TIDE
LEVEL ARE POSSIBLE ALONG SOME COASTS OF
MEXICO.
* TSUNAMI WAVES REACHING 0.3 TO 1 METERS ABOVE THE TIDE LEVEL
ARE POSSIBLE FOR SOME COASTS OF
AMERICAN SAMOA… ANTARCTICA… COOK ISLANDS… ECUADOR…
EL SALVADOR… FIJI… FRENCH POLYNESIA… GUATEMALA…
KIRIBATI… NEW ZEALAND… SAMOA… TOKELAU… TUVALU…
VANUATU… AND WALLIS AND FUTUNA.
* TSUNAMI WAVES ARE FORECAST TO BE LESS THAN 0.3 METERS ABOVE
THE TIDE LEVEL FOR THE COASTS OF
AUSTRALIA… CHILE… CHINA… CHUUK… COLOMBIA… COSTA
RICA… GUAM… HAWAII… HONDURAS… HOWLAND AND BAKER…
INDONESIA… JAPAN… JARVIS ISLAND… JOHNSTON ATOLL…
KERMADEC ISLANDS… KOSRAE… MALAYSIA… MARSHALL
ISLANDS… MIDWAY ISLAND… NAURU… NEW CALEDONIA…
NICARAGUA… NIUE… NORTHERN MARIANAS… NORTHWESTERN
HAWAIIAN ISLANDS… PALAU… PALMYRA ISLAND… PANAMA…
PAPUA NEW GUINEA… PERU… PHILIPPINES… PITCAIRN
ISLANDS… POHNPEI… RUSSIA… SOLOMON ISLANDS…
TAIWAN… TONGA… VIETNAM… WAKE ISLAND… AND YAP.
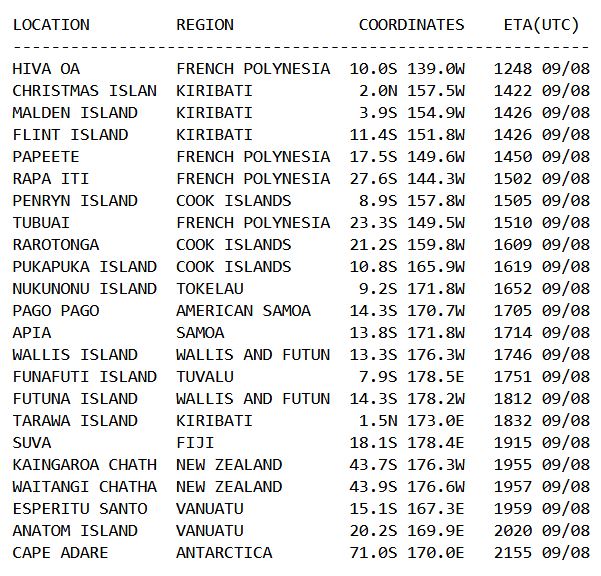
- Here are the arrival time estimates. The below all come from this report.
ESTIMATED TIMES OF ARRIVAL
————————–
* ESTIMATED TIMES OF ARRIVAL -ETA- OF THE INITIAL TSUNAMI WAVE
FOR PLACES WITHIN THREATENED REGIONS ARE GIVEN BELOW. ACTUAL
ARRIVAL TIMES MAY DIFFER AND THE INITIAL WAVE MAY NOT BE THE
LARGEST. A TSUNAMI IS A SERIES OF WAVES AND THE TIME BETWEEN
WAVES CAN BE FIVE MINUTES TO ONE HOUR.
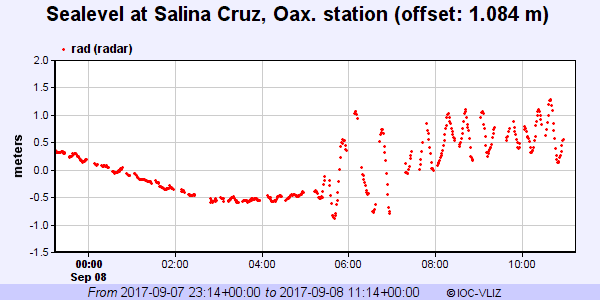
- Here are the tsunami observations. The below all come from this report.
TSUNAMI OBSERVATIONS
——————–
* THE FOLLOWING ARE TSUNAMI WAVE OBSERVATIONS FROM COASTAL
AND/OR DEEP-OCEAN SEA LEVEL GAUGES AT THE INDICATED
LOCATIONS. THE MAXIMUM TSUNAMI HEIGHT IS MEASURED WITH
RESPECT TO THE NORMAL TIDE LEVEL.
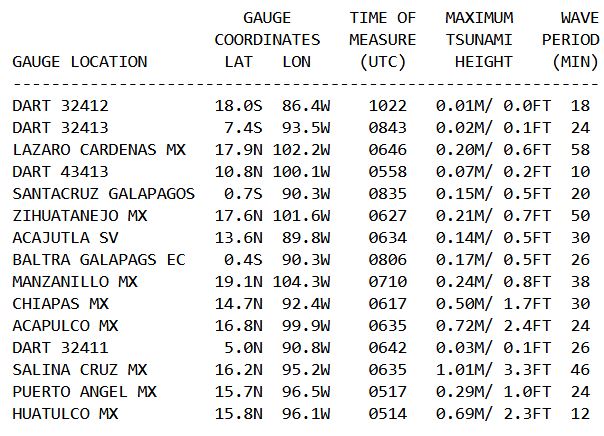
- Below is the record from the most proximal tide gage to the earthquake in Salina Cruz, Oaxaca, Mexico.
- Here is a map showing the spreading ridge features, along with the plate boundary faults (Mann, 2007). This is similar to the inset map in the interpretive poster.
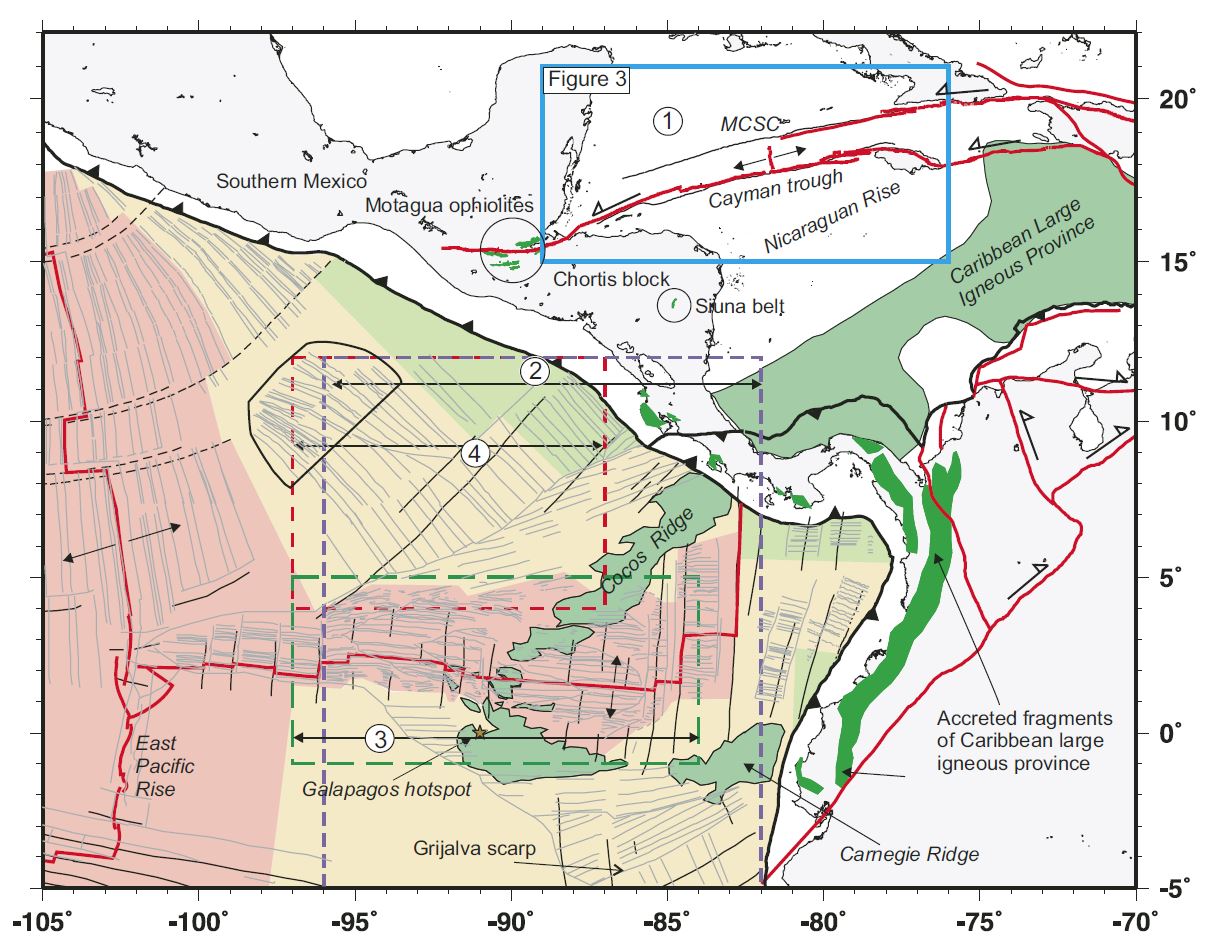
Marine magnetic anomalies and fracture zones that constrain tectonic reconstructions such as those shown in Figure 4 (ages of anomalies are keyed to colors as explained in the legend; all anomalies shown are from University of Texas Institute for Geophysics PLATES [2000] database): (1) Boxed area in solid blue line is area of anomaly and fracture zone picks by Leroy et al. (2000) and Rosencrantz (1994); (2) boxed area in dashed purple line shows anomalies and fracture zones of Barckhausen et al. (2001) for the Cocos plate; (3) boxed area in dashed green line shows anomalies and fracture zones from Wilson and Hey (1995); and (4) boxed area in red shows anomalies and fracture zones from Wilson (1996). Onland outcrops in green are either the obducted Cretaceous Caribbean large igneous province, including the Siuna belt, or obducted ophiolites unrelated to the large igneous province (Motagua ophiolites). The magnetic anomalies and fracture zones record the Cenozoic relative motions of all divergent plate pairs infl uencing the Central American subduction zone (Caribbean, Nazca, Cocos, North America, and South America). When incorporated into a plate model, these anomalies and fracture zones provide important constraints on the age and thickness of subducted crust, incidence angle of subduction, and rate of subduction for the Central American region. MCSC—Mid-Cayman Spreading Center.
- Here is the Manea and Manea (2007) map showing the lithospheric contrast across the Tehuantepec Ridge, a fracture zone.
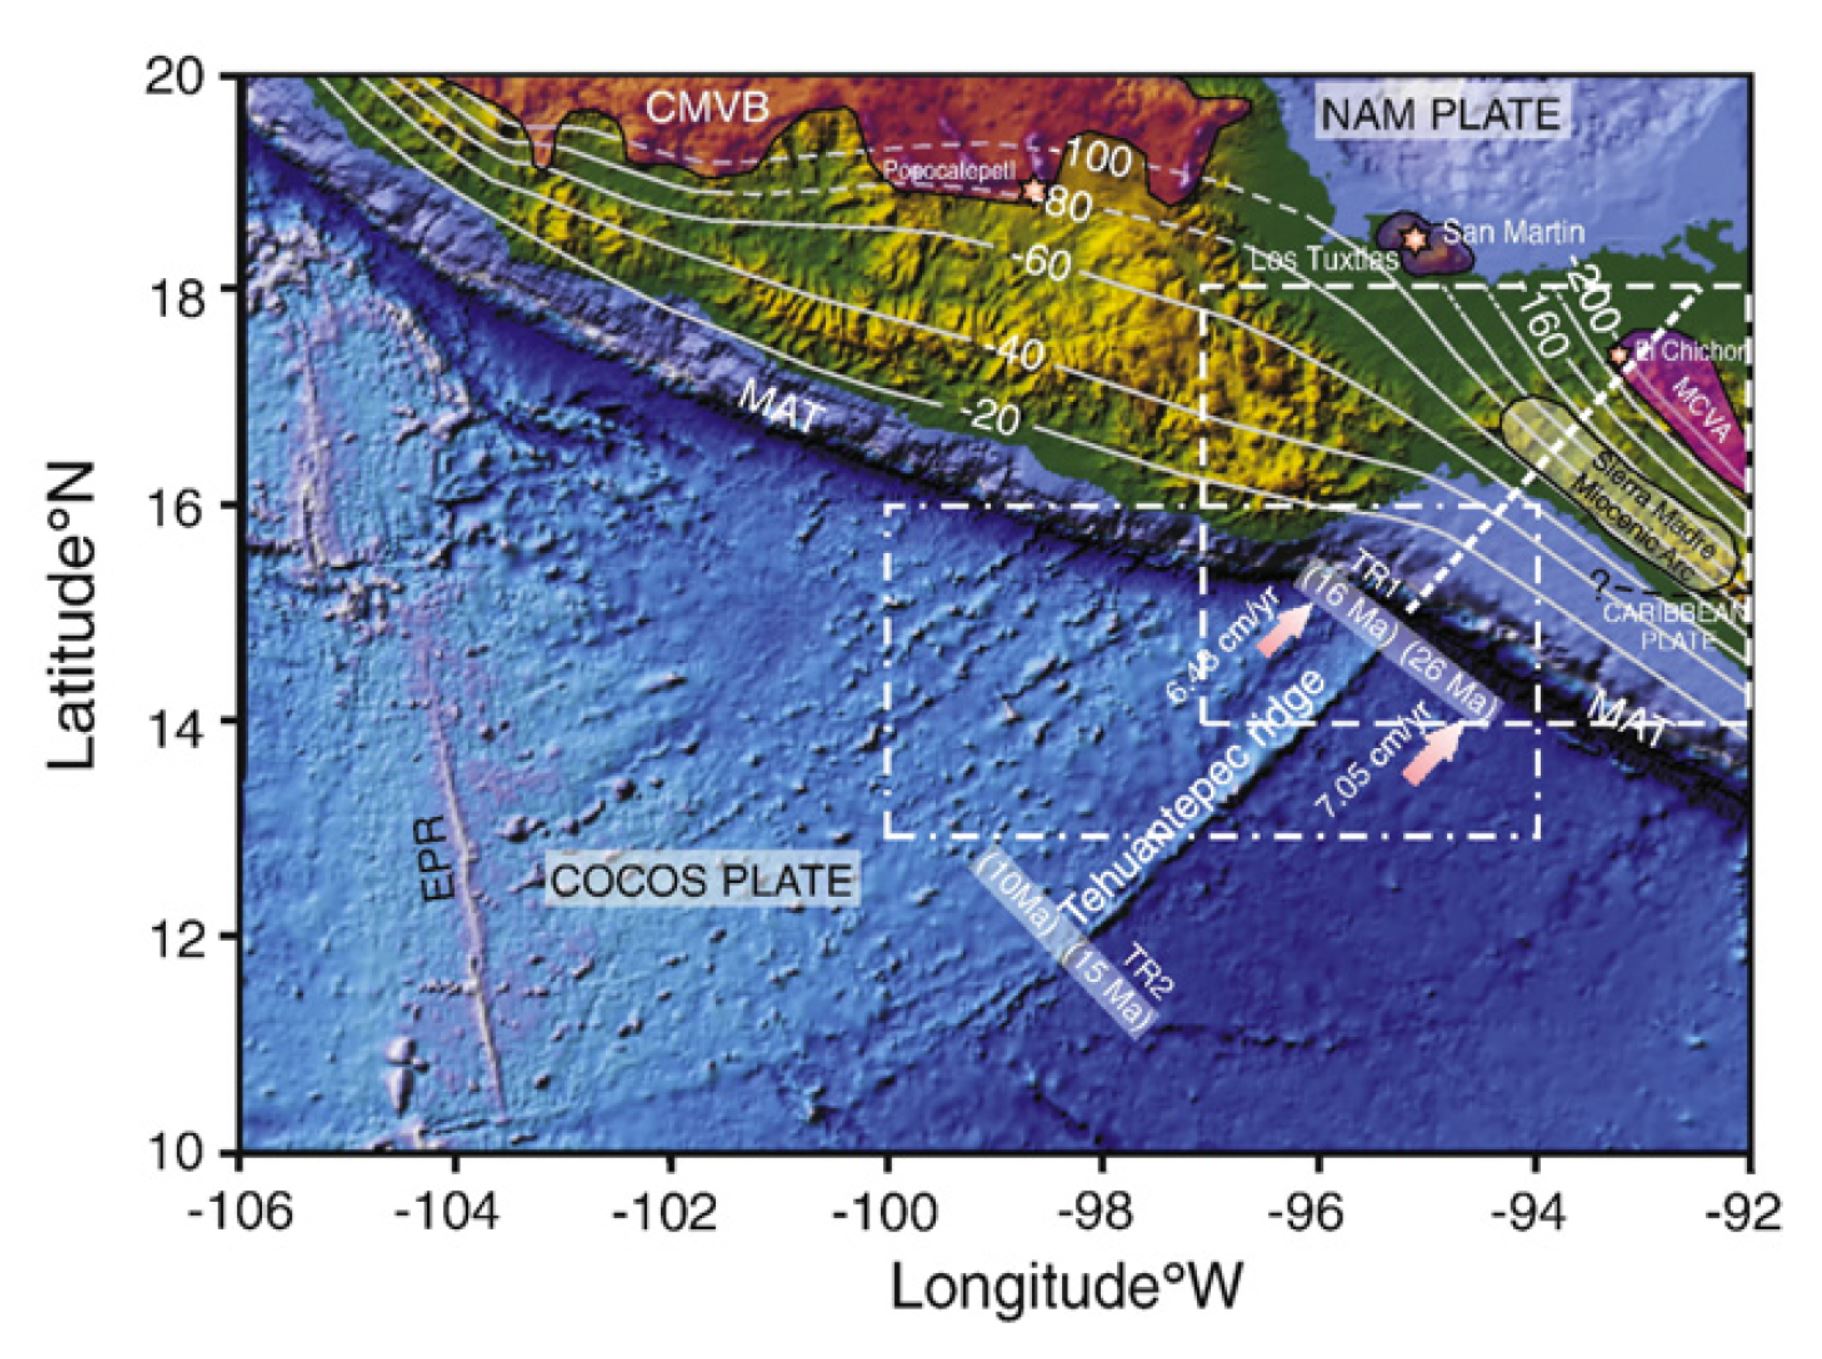
Generalized tectonic map of the study area. Transparent red zones show the location of active volcanic belts in México: CMVB — Central Mexican Volcanic Belt, MCVA — Modern Chiapanecan Volcanic Arc. Transparent gray area: the extinct Sierra Madre Miocenic Arc. Orange stars are the El Chichón and San Martin active volcanoes. EPR — East Pacific Rise. MAT — Middle American Trench. Right black dashed line with a question mark is the hypothetical prolongation of Polochic–Montagua fault system which represents the limit between North America (NAM) and Caribbean plates. White dashed line is the onshore prolongation of Tehuantepec Ridge. Onshore white contours represent the slab isodepths (Bravo et al., 2004; Pardo and Suarez, 1995). Arrows show convergence velocities between the Cocos and North American plates (DeMets et al., 1994). TR1 and TR2 are the cross-sections where we calculate the thermal structure across TR (Fig. 10). Cocos plate ages are from Manea et al. (2005). White line dashed squares show the location of magnetic and gravity maps (Figs. 3, 5, 6). Blue dots represent continental heat-flow measurements (mW/m2) from Ziagos et al. (1985).
- This figure from Rebollar et al., 1999 shows focal mechanisms for some earthauakes in this area. Earthquake 6C has a similar mechanism and location as tonight’s M 8.1 earthquake.
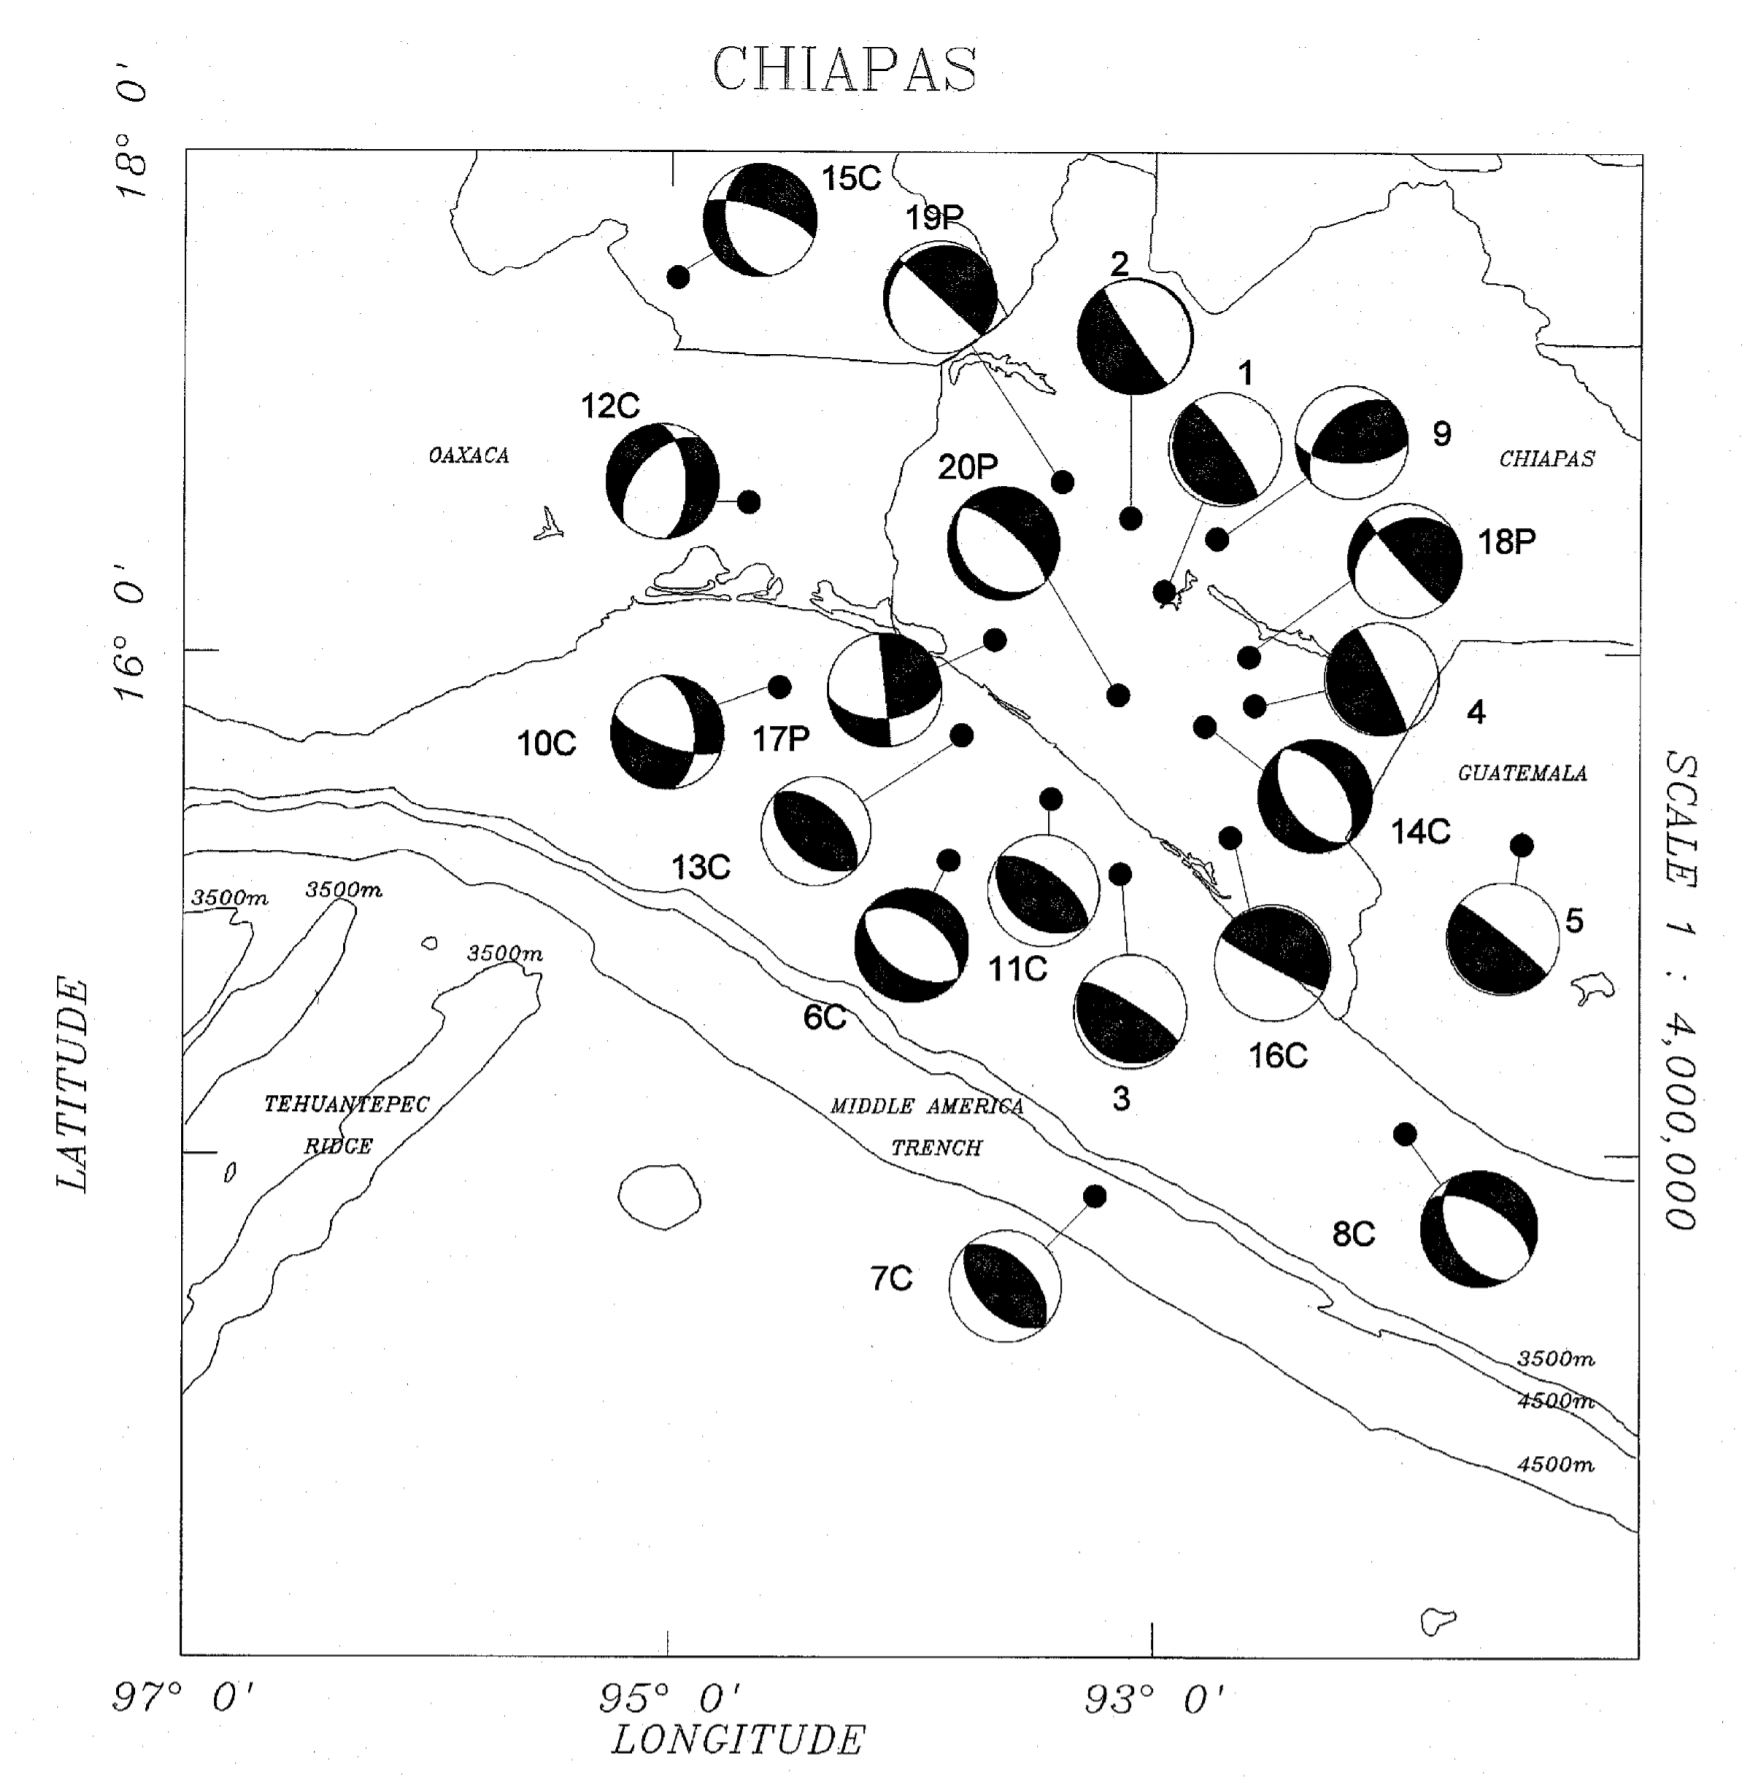
- However, this is the cross section from Rebollar et al. (1999) that shows earthquake 6C to be much much shallower.
- In 1902, there was an M 7.8 earthquake in the same region as tonight’s M 8.1. Here is a map from Franco et al. (2015) that shows the rupture patches for historic earthquakes in this region.

The study area encompasses Guerrero and Oaxaca states of Mexico. Shaded ellipse-like areas annotated with the years are rupture areas of the most recent major thrust earthquakes (M≥6.5) in the Mexican subduction zone. Triangles show locations of permanent GPS stations. Small hexagons indicate campaign GPS sites. Arrows are the Cocos-North America convergence vectors from NUVEL-1A model (DeMets et al., 1994). Double head arrow shows the extent of the Guerrero seismic gap. Solid and dashed curves annotated with negative numbers show the depth in km down to the surface of subducting Cocos plate (modified from Pardo and Su´arez, 1995, using the plate interface configuration model for the Central Oaxaca from this study, the model for Guerrero from Kostoglodov et al. (1996), and the last seismological estimates in Chiapas by Bravo et al. (2004). MAT, Middle America trench.
- Initially, I forgot to include these figures from Franco et al. (2012). These figures show various estimates of the amount of seismogenic coupling along the megathrust. I include these because the M 8.1 earthquake happened in this region of higher seismogenic coupling.
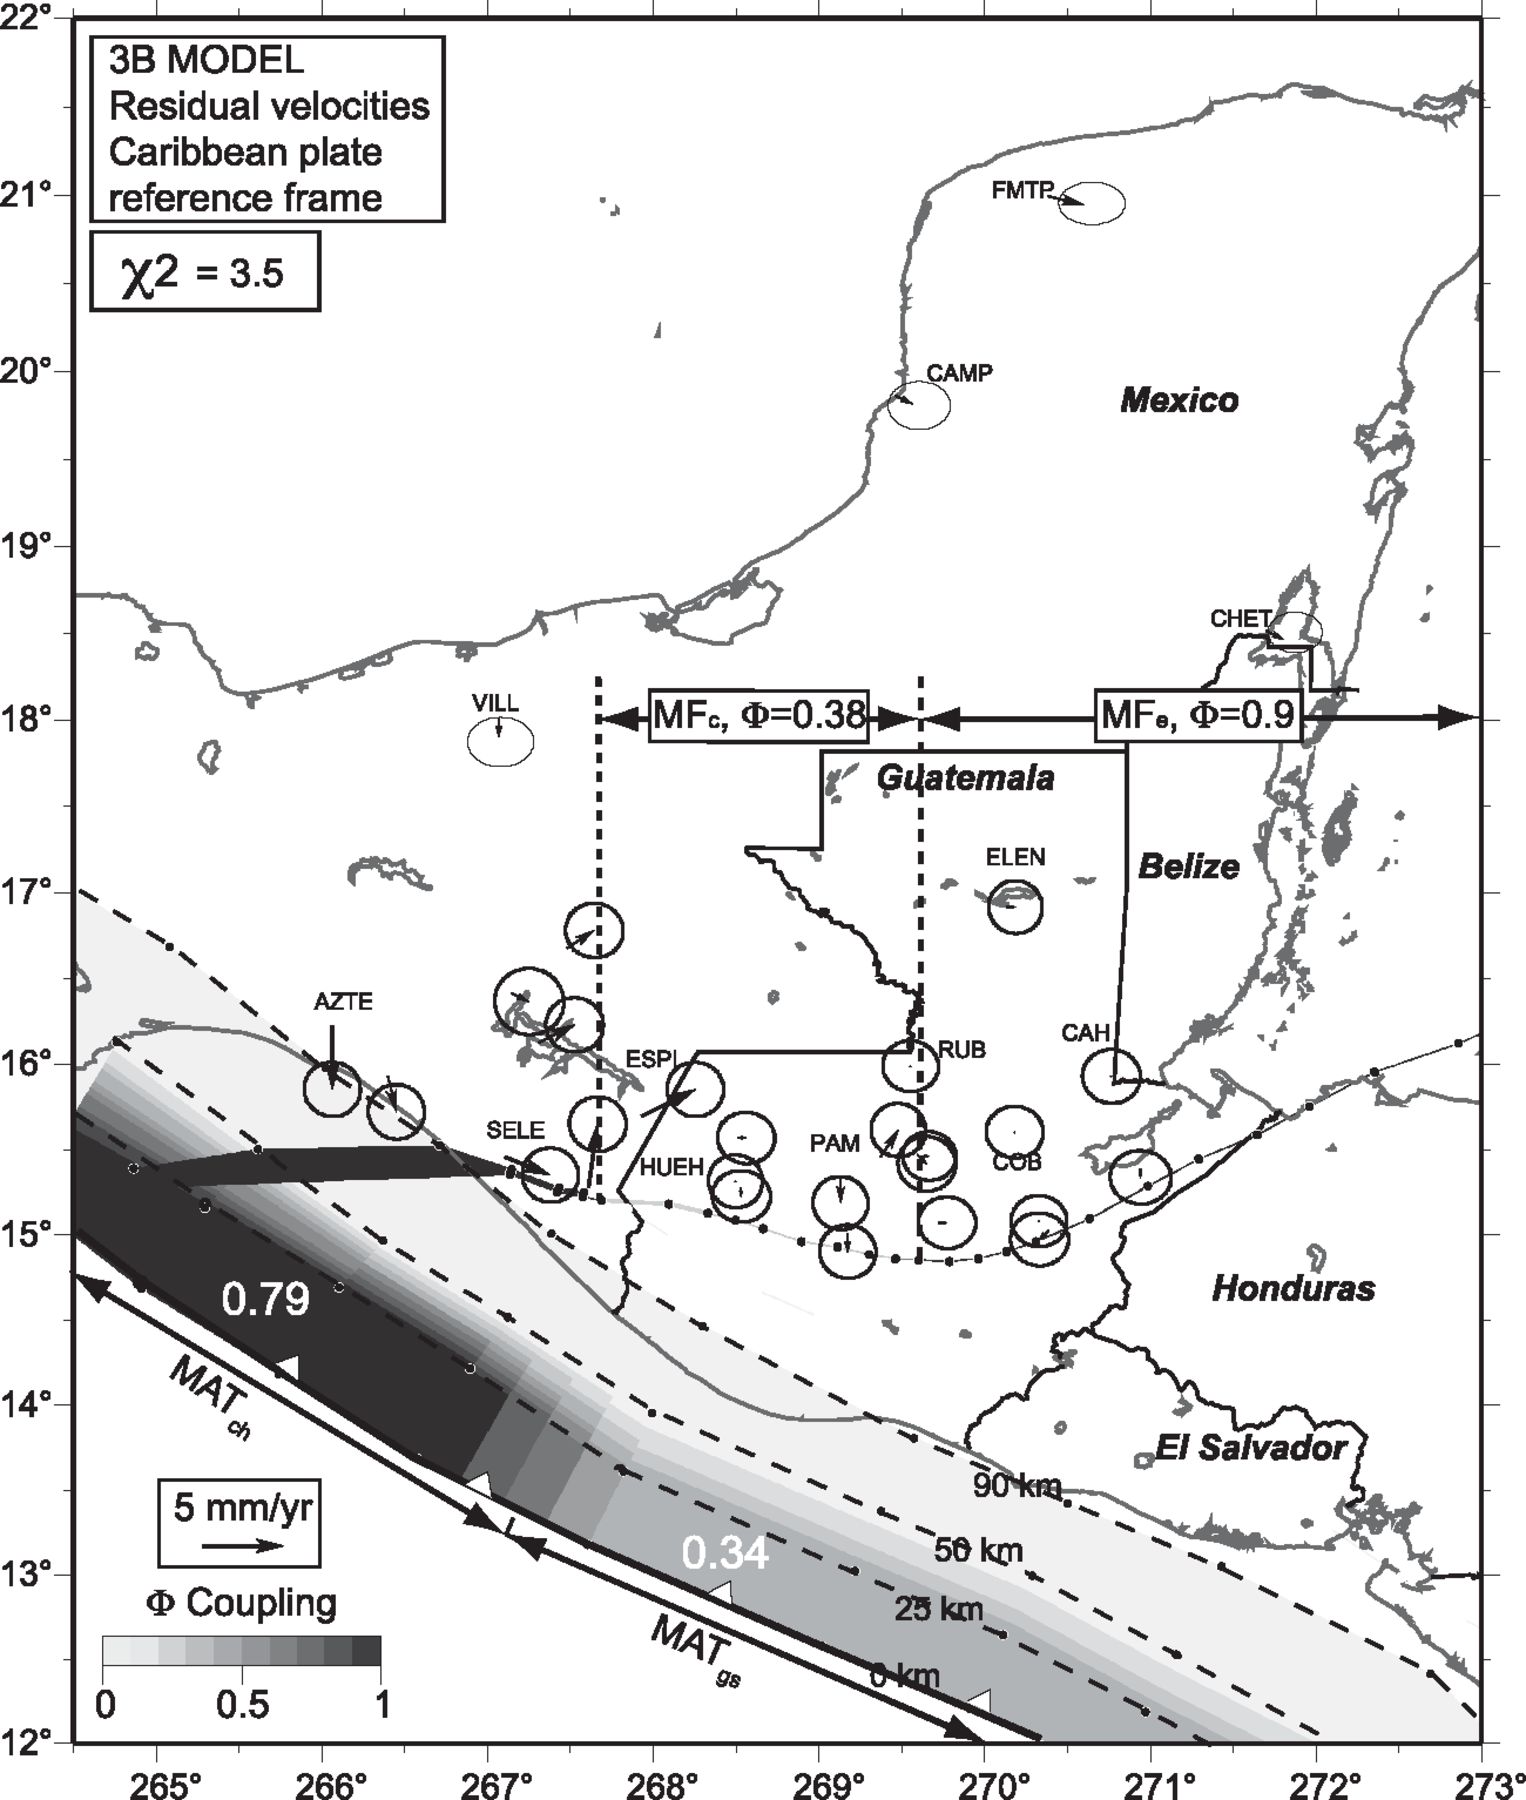
Inverted coupling coefficients along the MFe, MFc, MATch and MATgs, and residual velocities for best-fitting 3B model.
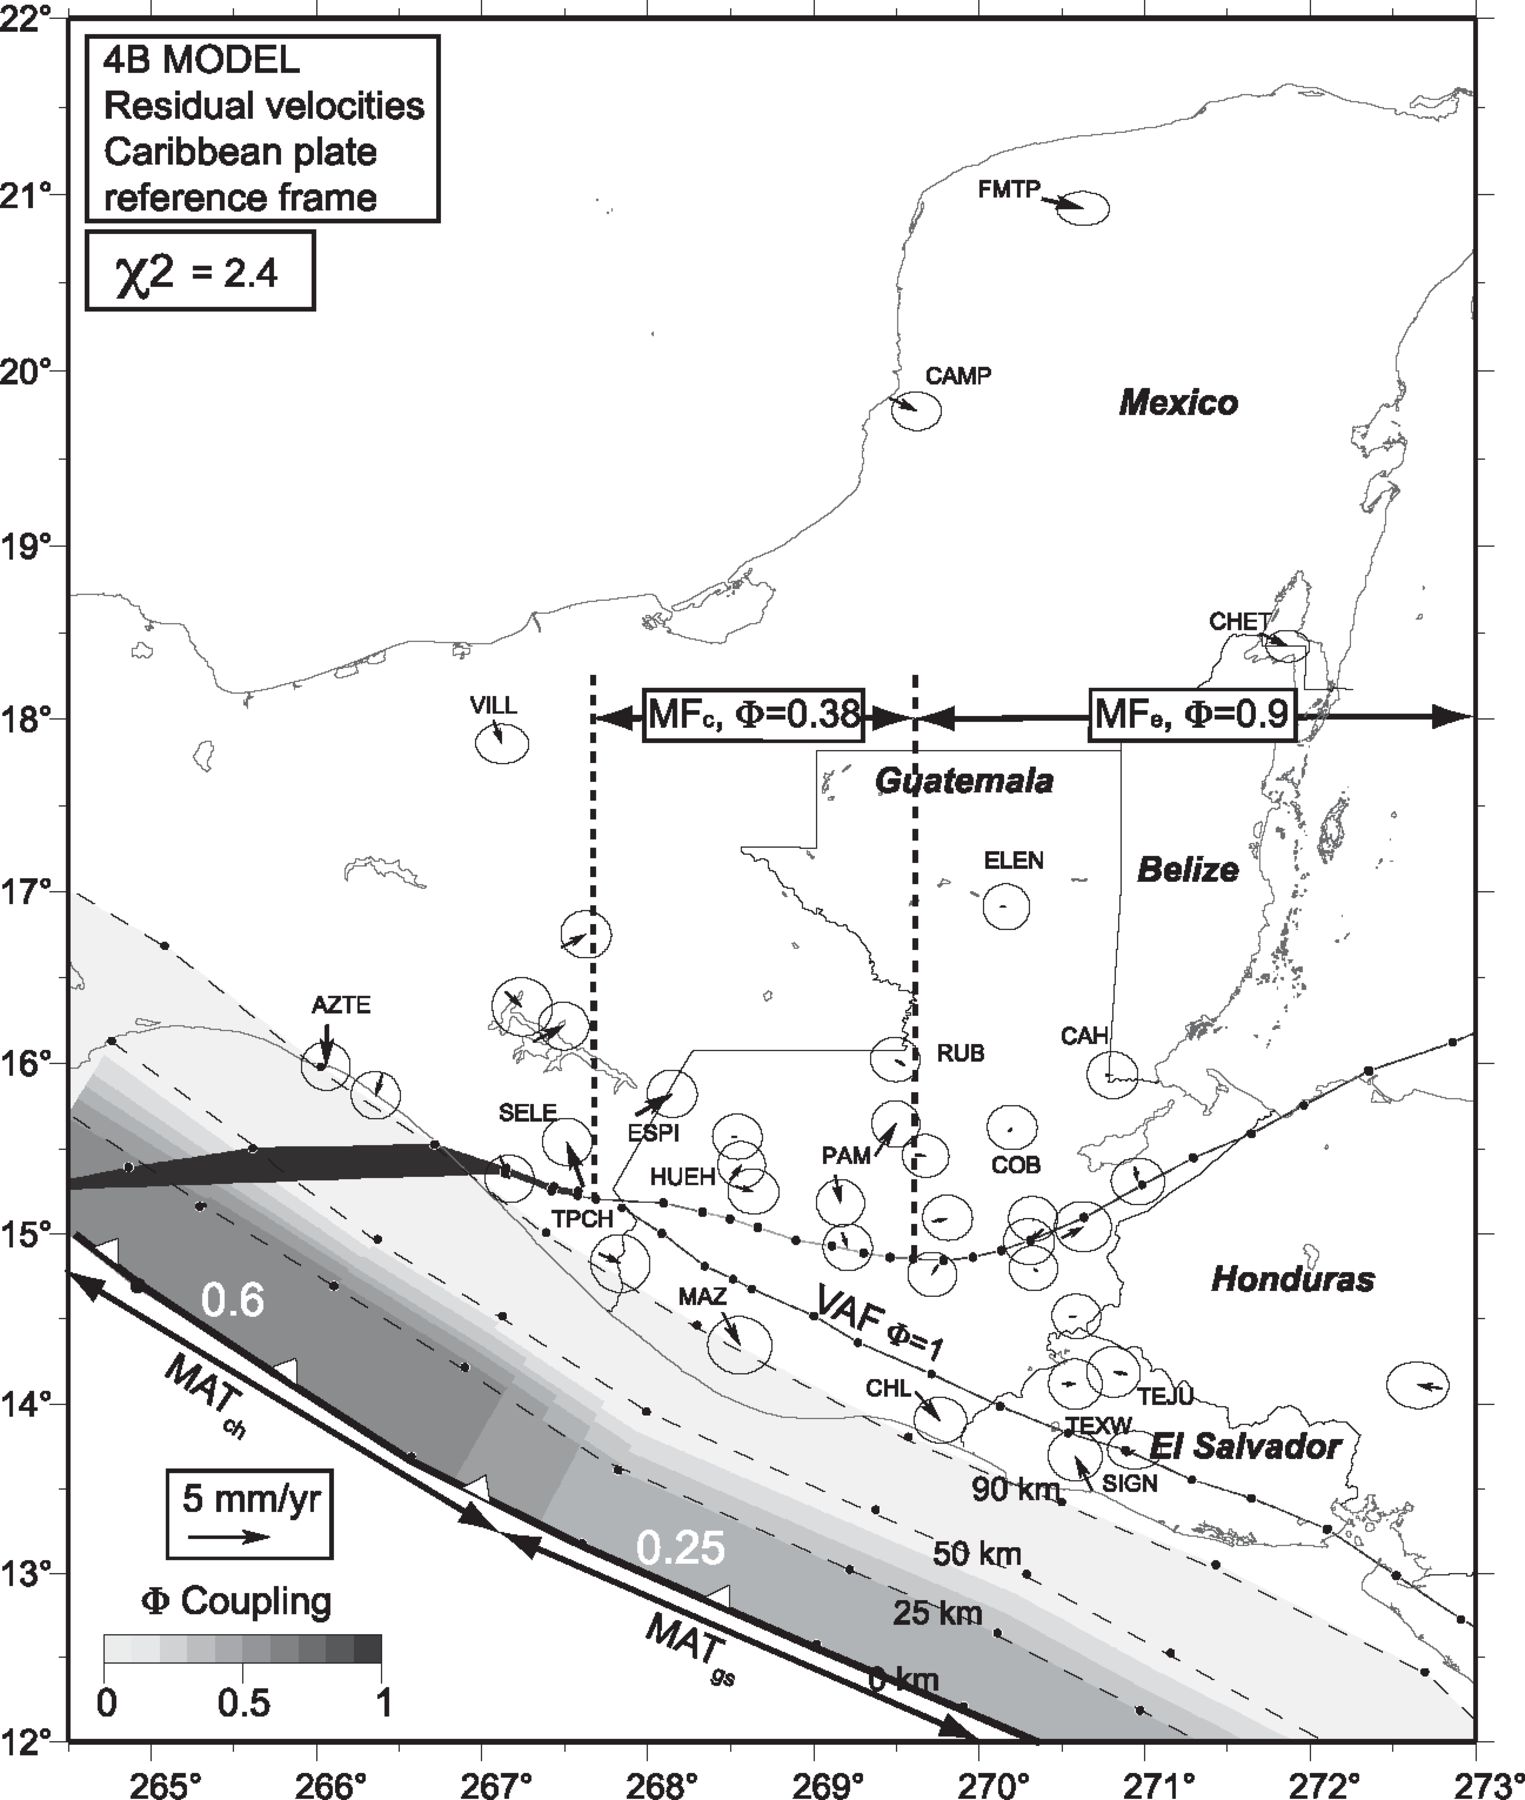
Same as Fig. 7 for best-fitting 4B model, with coupling along VAF fixed to 1.
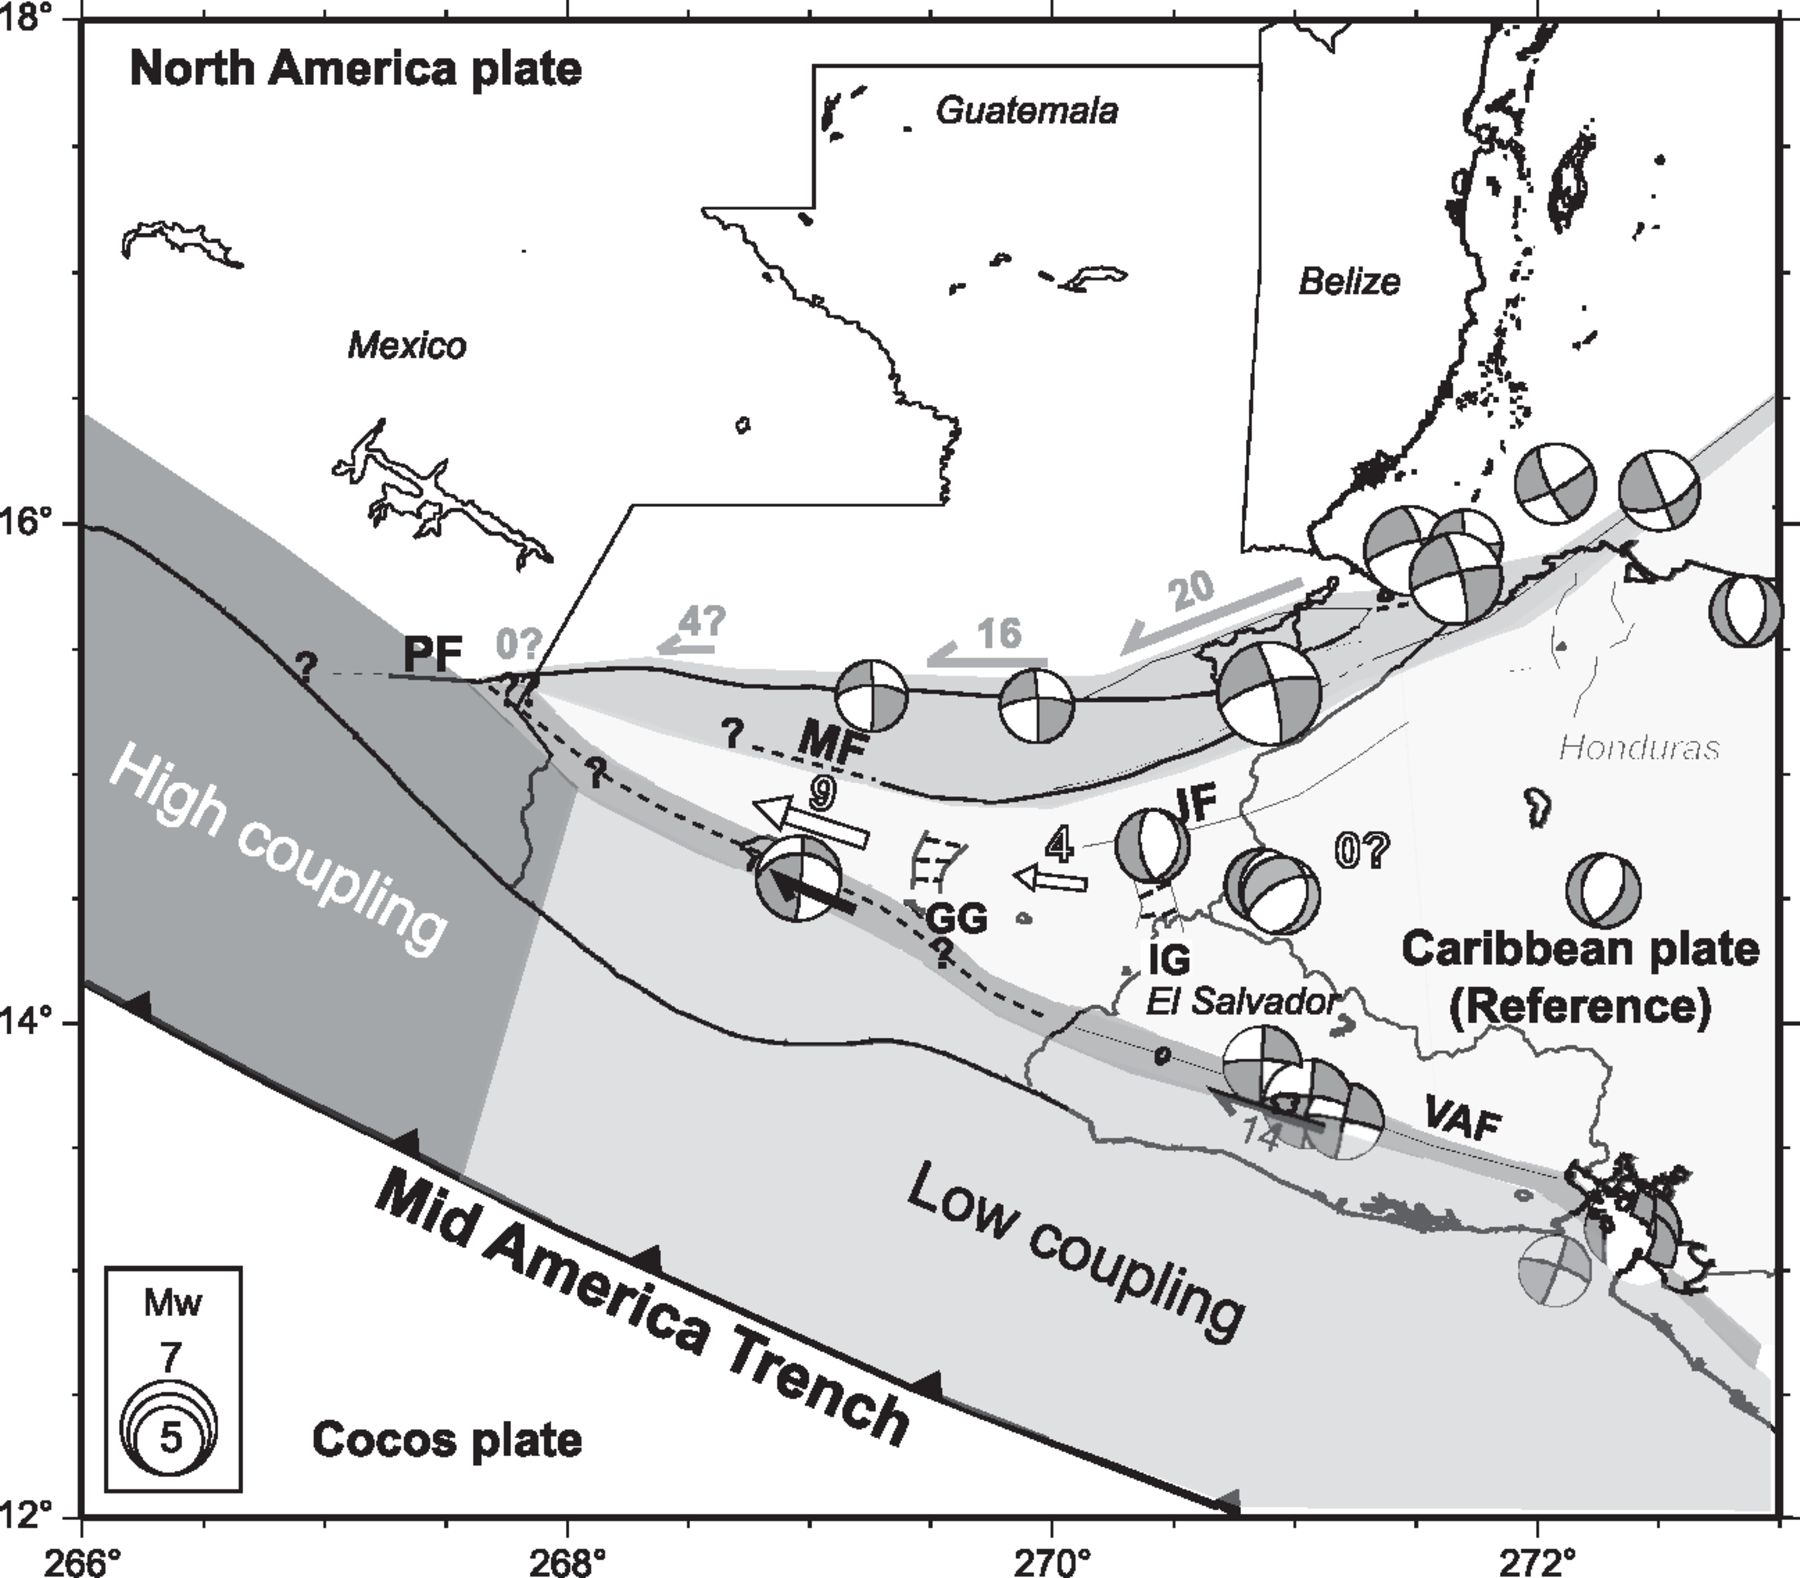
Proposed model of faults kinematics and coupling along the Cocos slab interface, revised from Lyon-Caen et al. (2006). Numbers are velocities relative to CA plate in mmyr−1. Focal mechanisms are for crustal earthquakes (depth ≤30 km) since 1976, from CMT Harvard catalogue.
- 2017.06.22 M 6.8 Guatemala
- 2017.06.14 M 6.9 Guatemala
- 2017.05.12 M 6.2 El Salvador
- 2017.03.29 M 5.7 Gulf of California
- 2016.11.24 M 7.0 El Salvador
- 2016.04.29 M 6.6 East Pacific Rise / MAT
- 2016.01.21 M 6.6 Mexico
- 2015.09.13 M 6.6 Gulf California
- 2015.09.13 M 6.6 Gulf California Update #1
- 2014.10.14 M 7.3 El Salvador
- 2013.10.20 M 6.4 Gulf California
Seismicity: Mexico | Central America
General Overview
Earthquake Reports
References:
- Benz, H.M., Dart, R.L., Villaseñor, Antonio, Hayes, G.P., Tarr, A.C., Furlong, K.P., and Rhea, Susan, 2011 a. Seismicity of the Earth 1900–2010 Mexico and vicinity: U.S. Geological Survey Open-File Report 2010–1083-F, scale 1:8,000,000.
- Benz, H.M., Tarr, A.C., Hayes, G.P., Villaseñor, Antonio, Furlong, K.P., Dart, R.L., and Rhea, Susan, 2011 b. Seismicity of the Earth 1900–2010 Caribbean plate and vicinity: U.S. Geological Survey Open-File Report 2010–1083-A, scale 1:8,000,000.
- Franco, A., C. Lasserre H. Lyon-Caen V. Kostoglodov E. Molina M. Guzman-Speziale D. Monterosso V. Robles C. Figueroa W. Amaya E. Barrier L. Chiquin S. Moran O. Flores J. Romero J. A. Santiago M. Manea V. C. Manea, 2012. Fault kinematics in northern Central America and coupling along the subduction interface of the Cocos Plate, from GPS data in Chiapas (Mexico), Guatemala and El Salvador in Geophysical Journal International., v. 189, no. 3, p. 1223-1236. DOI: https://doi.org/10.1111/j.1365-246X.2012.05390.x
- Franco, S.I., Kostoglodov, V., Larson, K.M., Manea, V.C>, Manea, M., and Santiago, J.A., 2005. Propagation of the 2001–2002 silent earthquake and interplate coupling in the Oaxaca subduction zone, Mexico in Earth Planets Space, v. 57., p. 973-985.
- Garcia-Casco, A., Projenza, J.A., Iturralde-Vinent, M.A., 2011. Subduction Zones of the Caribbean: the sedimentary, magmatic, metamorphic and ore-deposit records UNESCO/iugs igcp Project 546 Subduction Zones of the Caribbean in Geologica Acta, v. 9, no., 3-4, p. 217-224
- Hayes, G. P., D. J. Wald, and R. L. Johnson, 2012. Slab1.0: A three-dimensional model of global subduction zone geometries, J. Geophys. Res., 117, B01302, doi:10.1029/2011JB008524.
- Manea, M., and Manea, V.C., 2014. On the origin of El Chichón volcano and subduction of Tehuantepec Ridge: A geodynamical perspective in JGVR, v. 175, p. 459-471.
- Mann, P., 2007, Overview of the tectonic history of northern Central America, in Mann, P., ed., Geologic and tectonic development of the Caribbean plate boundary in northern Central America: Geological Society of America Special Paper 428, p. 1–19, doi: 10.1130/2007.2428(01). For
- Symithe, S., E. Calais, J. B. de Chabalier, R. Robertson, and M. Higgins, 2015. Current block motions and strain accumulation on active faults in the Caribbean in J. Geophys. Res. Solid Earth, v. 120, p. 3748–3774, doi:10.1002/2014JB011779.