
Yesterday we had an earthquake along the Clipperton fracture zone (CFZ), a transform plate boundary that offsets the northern East Pacific Rise (EPR). I was busy grading so did not get to this until today.
-
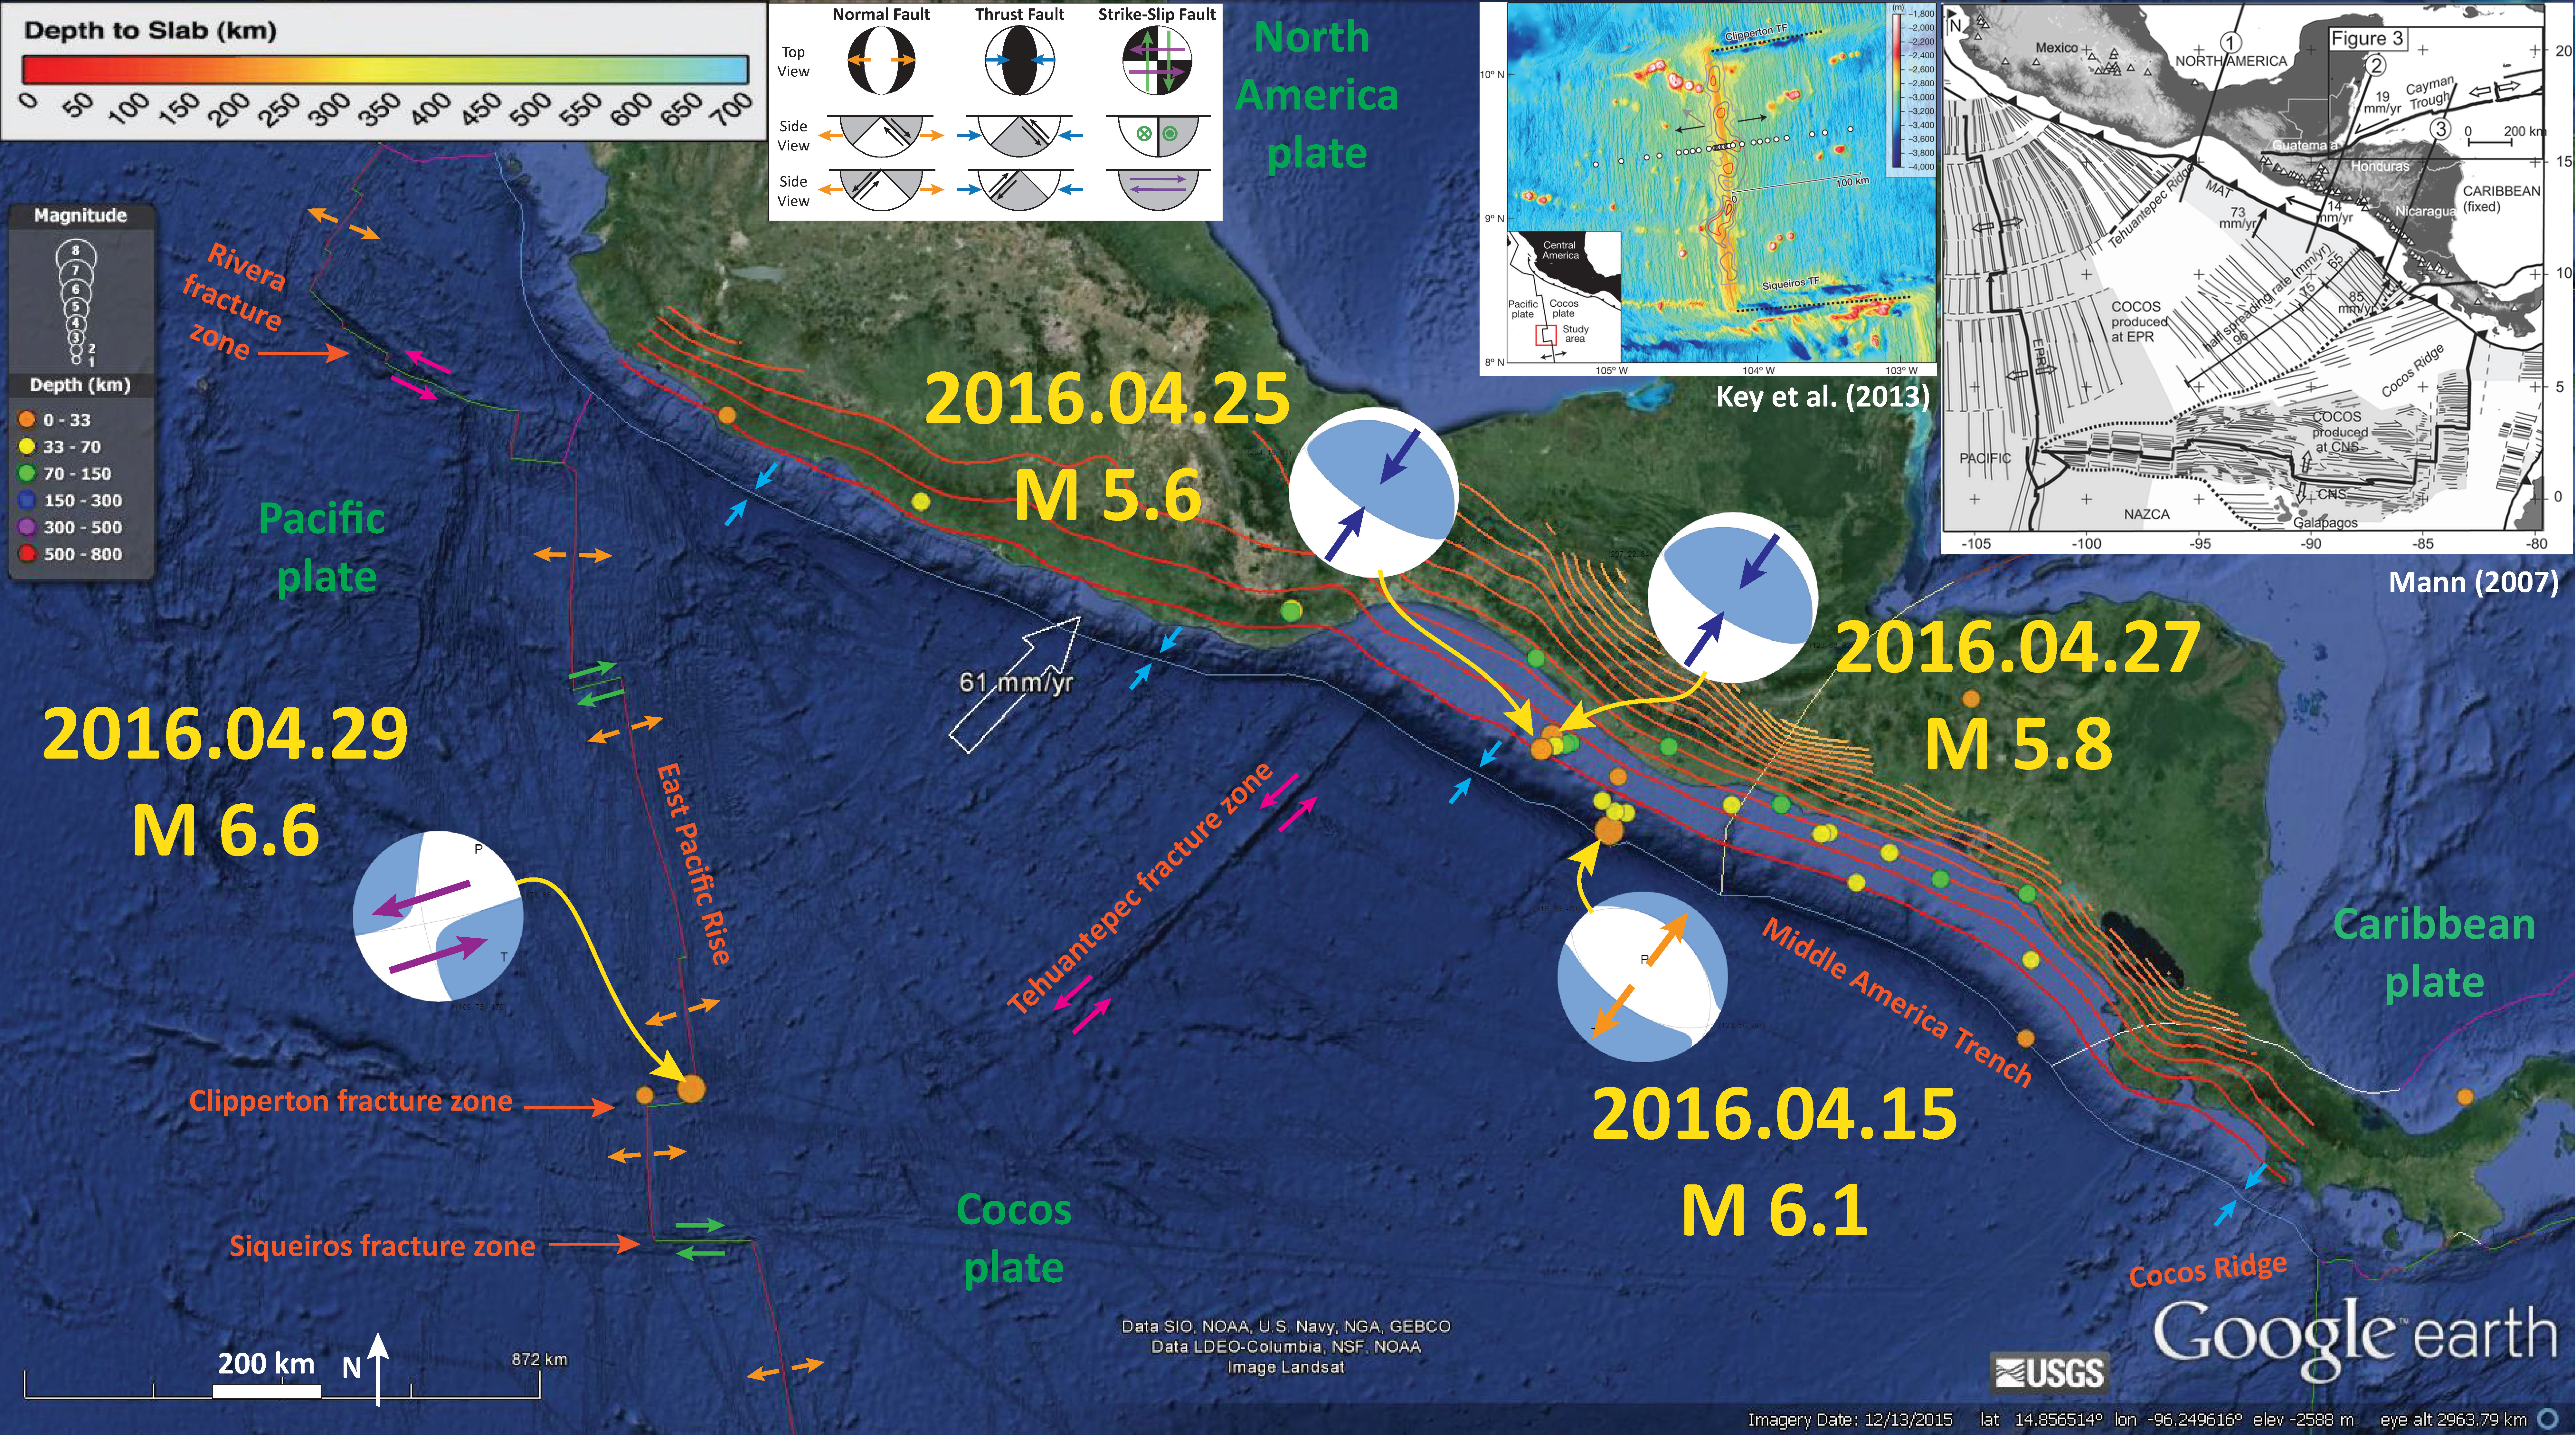
Here are the four large earthquakes shown on the poster below.
- 2016.04.15 M 6.1
- 2016.04.25 M 5.6
- 2016.04.27 M 5.8
- 2016.04.29 M 6.6
Below is my poster for this and the earlier earthquakes.
Siqueiros, Rivera, and Orozco were the “Tres Grandes,” 20th century political activists in Mexico who led the muralist movement. Their murals have inspired, and continue to inspire, political activists globally (as well as the Mexican muralism movement). Check out more about them here. I am fascinated that there are fracture zones named for Siqueiros and Rivera in this region.
-
I include some inset figures.
- Key et al. (2013) shows the fracture zones in this region. See the description below.
- Mann (2007) shows the magnetic anomalies and tectonic plate boundaries in this region. I include this map below with a figure caption.
There is a legend that shows how moment tensors can be interpreted. Moment tensors are graphical solutions of seismic data that show two possible fault plane solutions. One must use local tectonics, along with other data, to be able to interpret which of the two possible solutions is correct. The legend shows how these two solutions are oriented for each example (Normal/Extensional, Thrust/Compressional, and Strike-Slip/Shear). There is more about moment tensors and focal mechanisms at the USGS.
Based upon the location of the Clipperton fracture zone compared with the M 6.6 epicenter, I interpret this earthquake to have left-lateral slip on a strike-slip fault. The cool part about this earthquake suite is that there are examples of all types of earthquakes (extensional, compressional, and shear). The 4/15 M 6.1 appears to possibly have triggered the 4/25 & 4/27 M 5.6 and M 5.8 earthquakes. Then, two days later, we had the M 6.6 earthquake. This earthquake is too far to be affected by changes in coulomb stress, however it sure seems like it is more than a coincidence. I have not run a coulomb stress modeling analysis, but this is just based upon modeling others have done in different regions. While the earthquakes along the Middle America Trench (MAT) would have resulted in the Cocos plate extending slightly to the northeast, and that there is the Tehuantepec fracture zone that appears to bend and link the Clipperton fracture zone to the region near the MAT (so we want to link these earthquakes), there probably is no linkage.
The red-orange-yellow lines are slab contour lines from Hayes et al. (2012). These lines are a best estimate for the depth to the subduction zone fault. These are based largely upon seismicity and there is currently an effort to update these contours to integrate other data types. The hypocentral depth for this earthquake is consistent with being along the subduction zone interface.
For more on the graphical representation of moment tensors and focal mechnisms, check this IRIS video out:
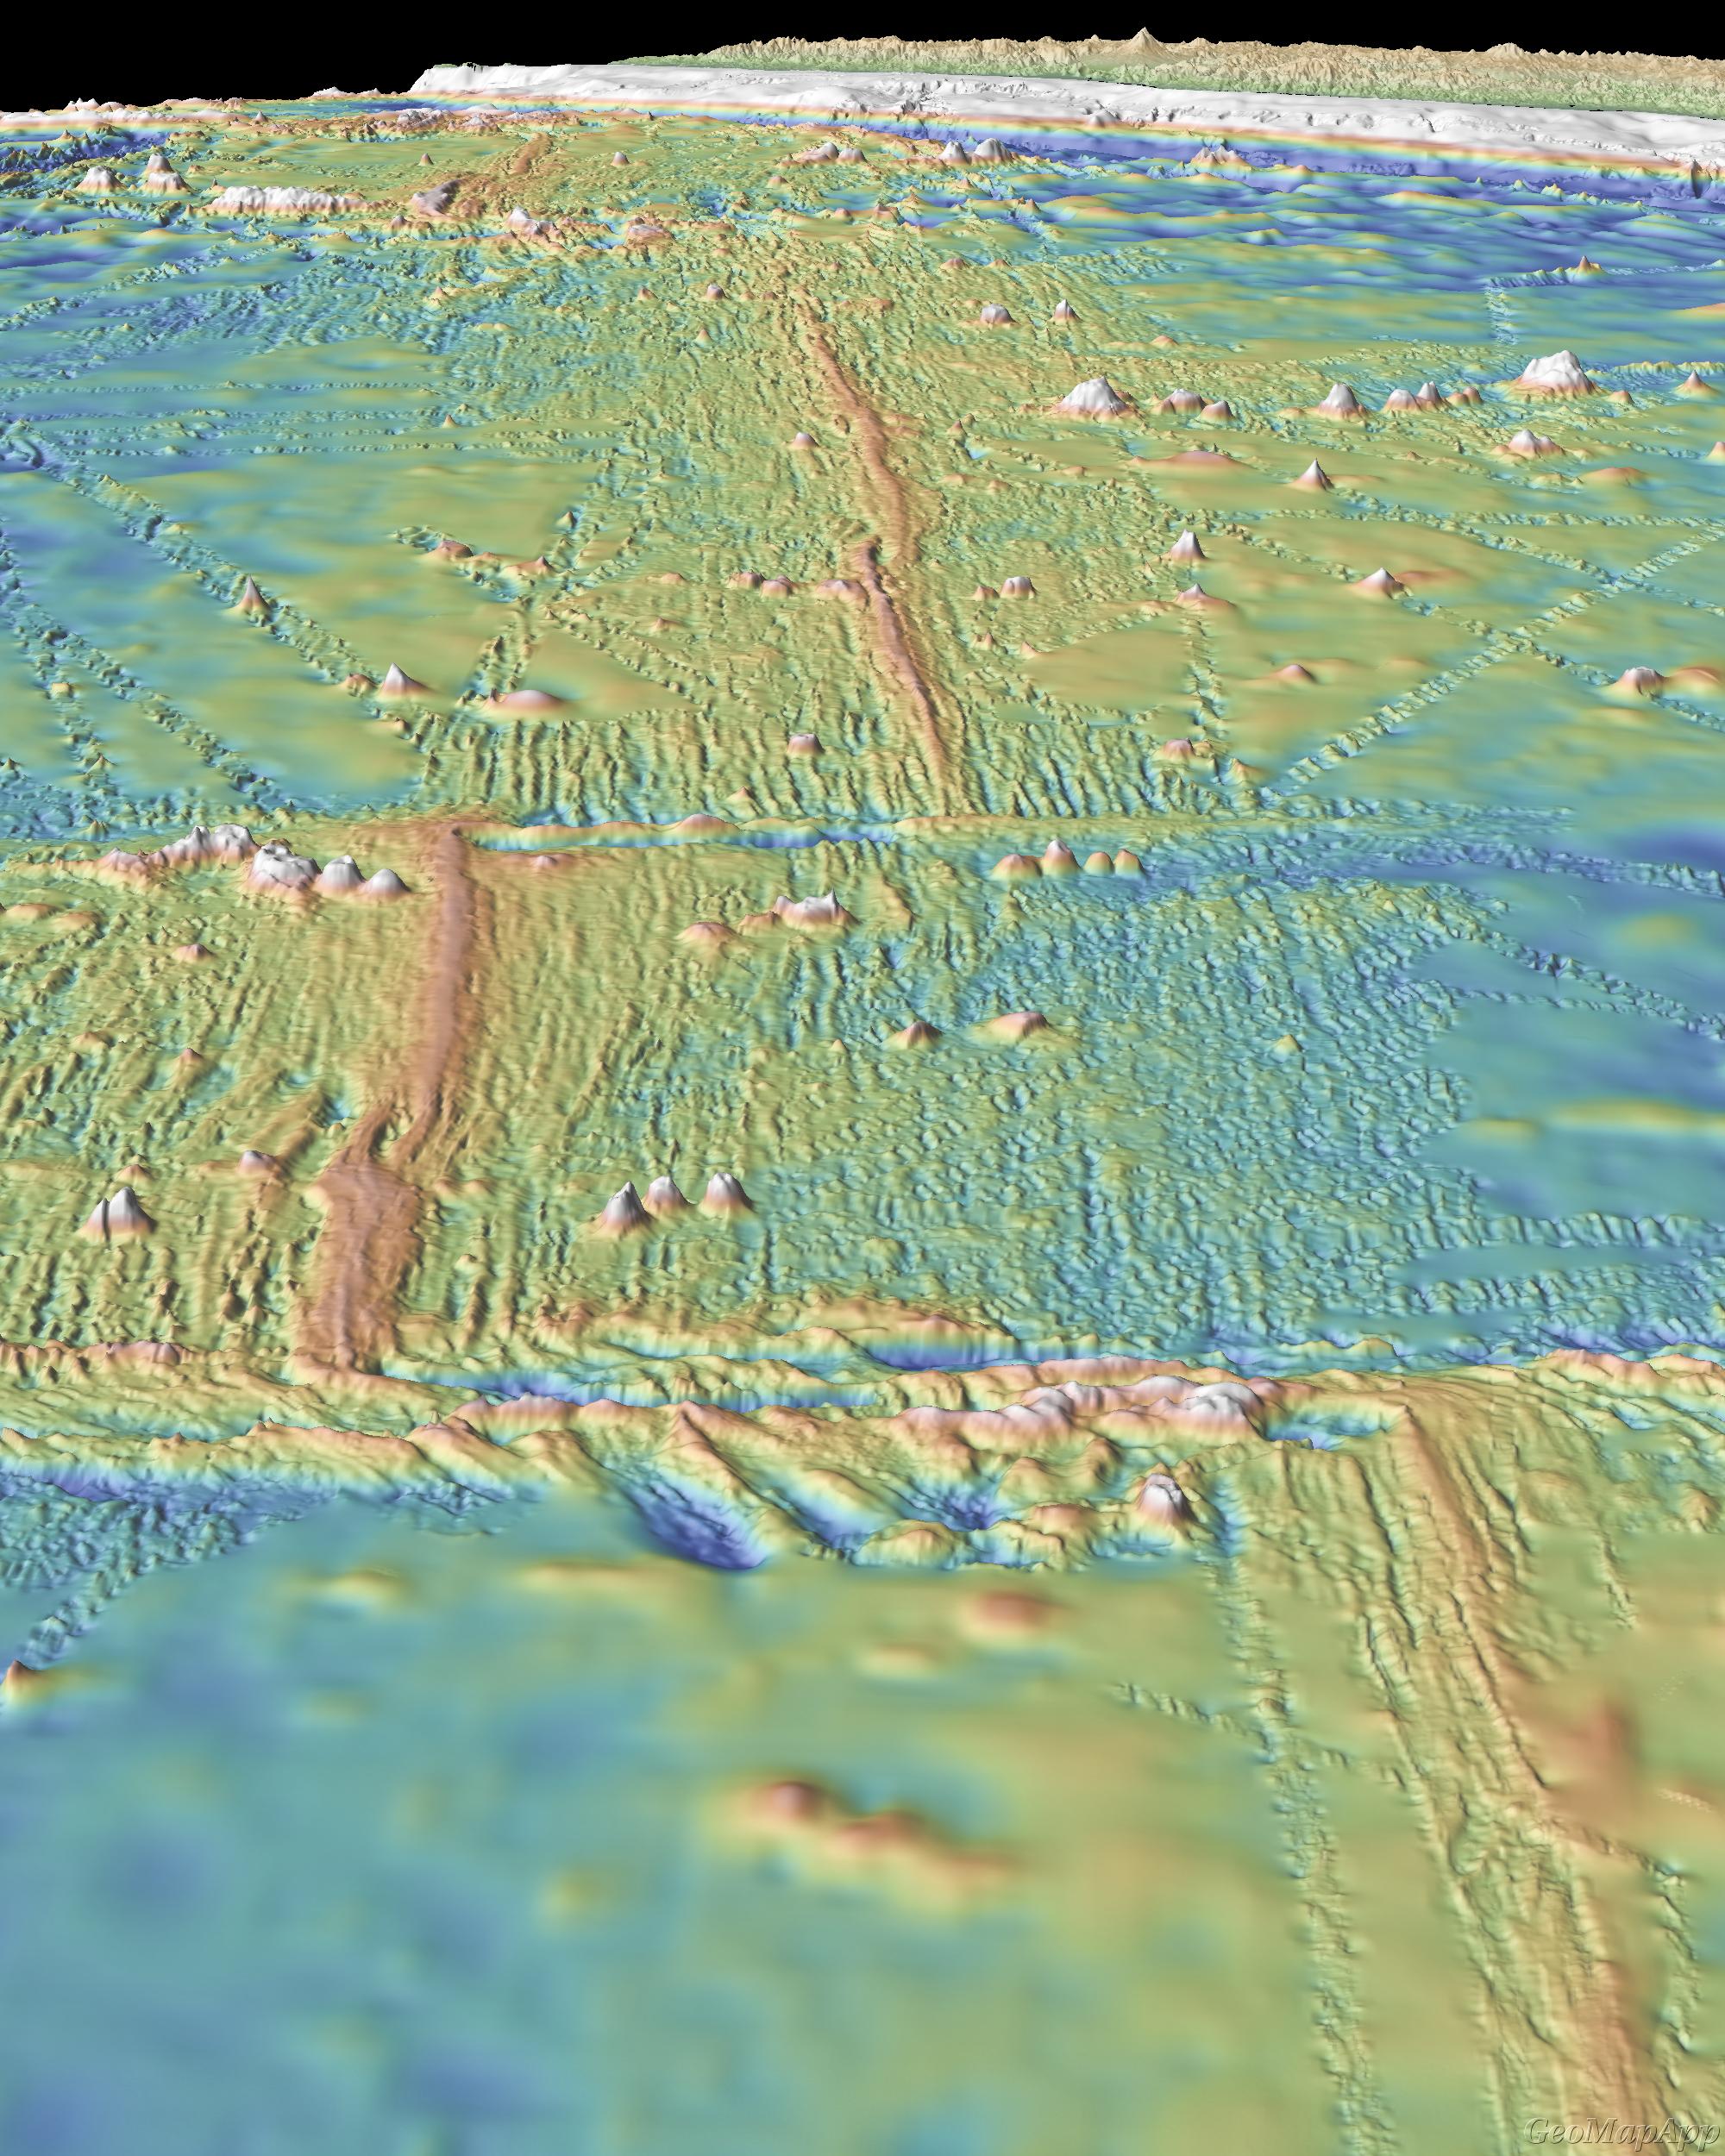
Here is a great low angle oblique image showing the topography of the EPR and the two fracture zones in this region (Ryan et al., 2009).
Here is the Mann (2007) map. I include their figure caption below as a blockquote.
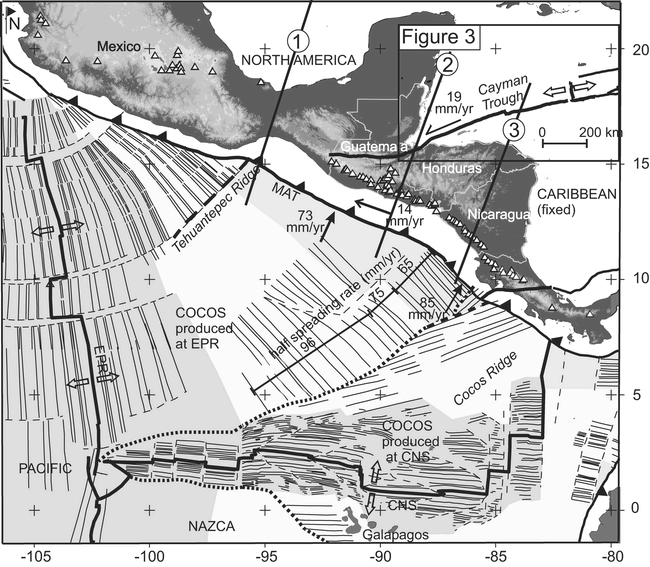
Present setting of Central America showing plates, Cocos crust produced at East Pacific Rise (EPR), and Cocos-Nazca spreading center (CNS), triple-junction trace (heavy dotted line), volcanoes (open triangles), Middle America Trench (MAT), and rates of relative plate motion (DeMets et al., 2000; DeMets, 2001). East Pacific Rise half spreading rates from Wilson (1996) and Barckhausen et al. (2001).
Here is the Lay et al. (2013) map. I include their figure caption below as a blockquote.
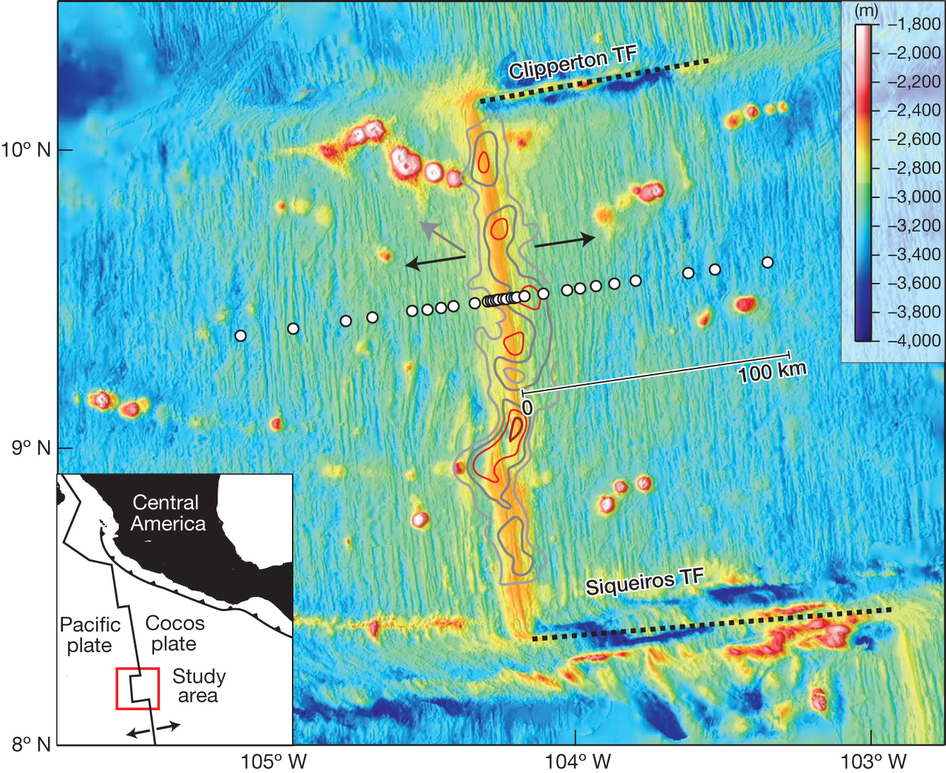
Location of the magnetotelluric survey across the fast spreading East Pacific Rise. Twenty-nine sea-floor magnetotelluric stations (white circles) were deployed across the ridge axis at 9 deg 30′ N, about 1,000 km southwest of Central America (inset; study area boxed in red). The Pacific and Cocos plates diverge symmetrically (black arrows) while the entire ridge system migrates to the northwest relative to a fixed hotspot reference frame 16 (grey arrow). The Clipperton and Siqueiros transform faults (TF) bound this ridge segment to the north and south. Slow seismic P-wave velocity contours (velocities, 7.6 km s-1) found by seismic tomography of the uppermost few kilometres of mantle follow the ridge crest along most of the segment, but deviate to the east near the magnetotelluric profile. The colour scale shows seafloor topography and the 100-km scale bar indicates the half-aperture of the magnetotelluric array.
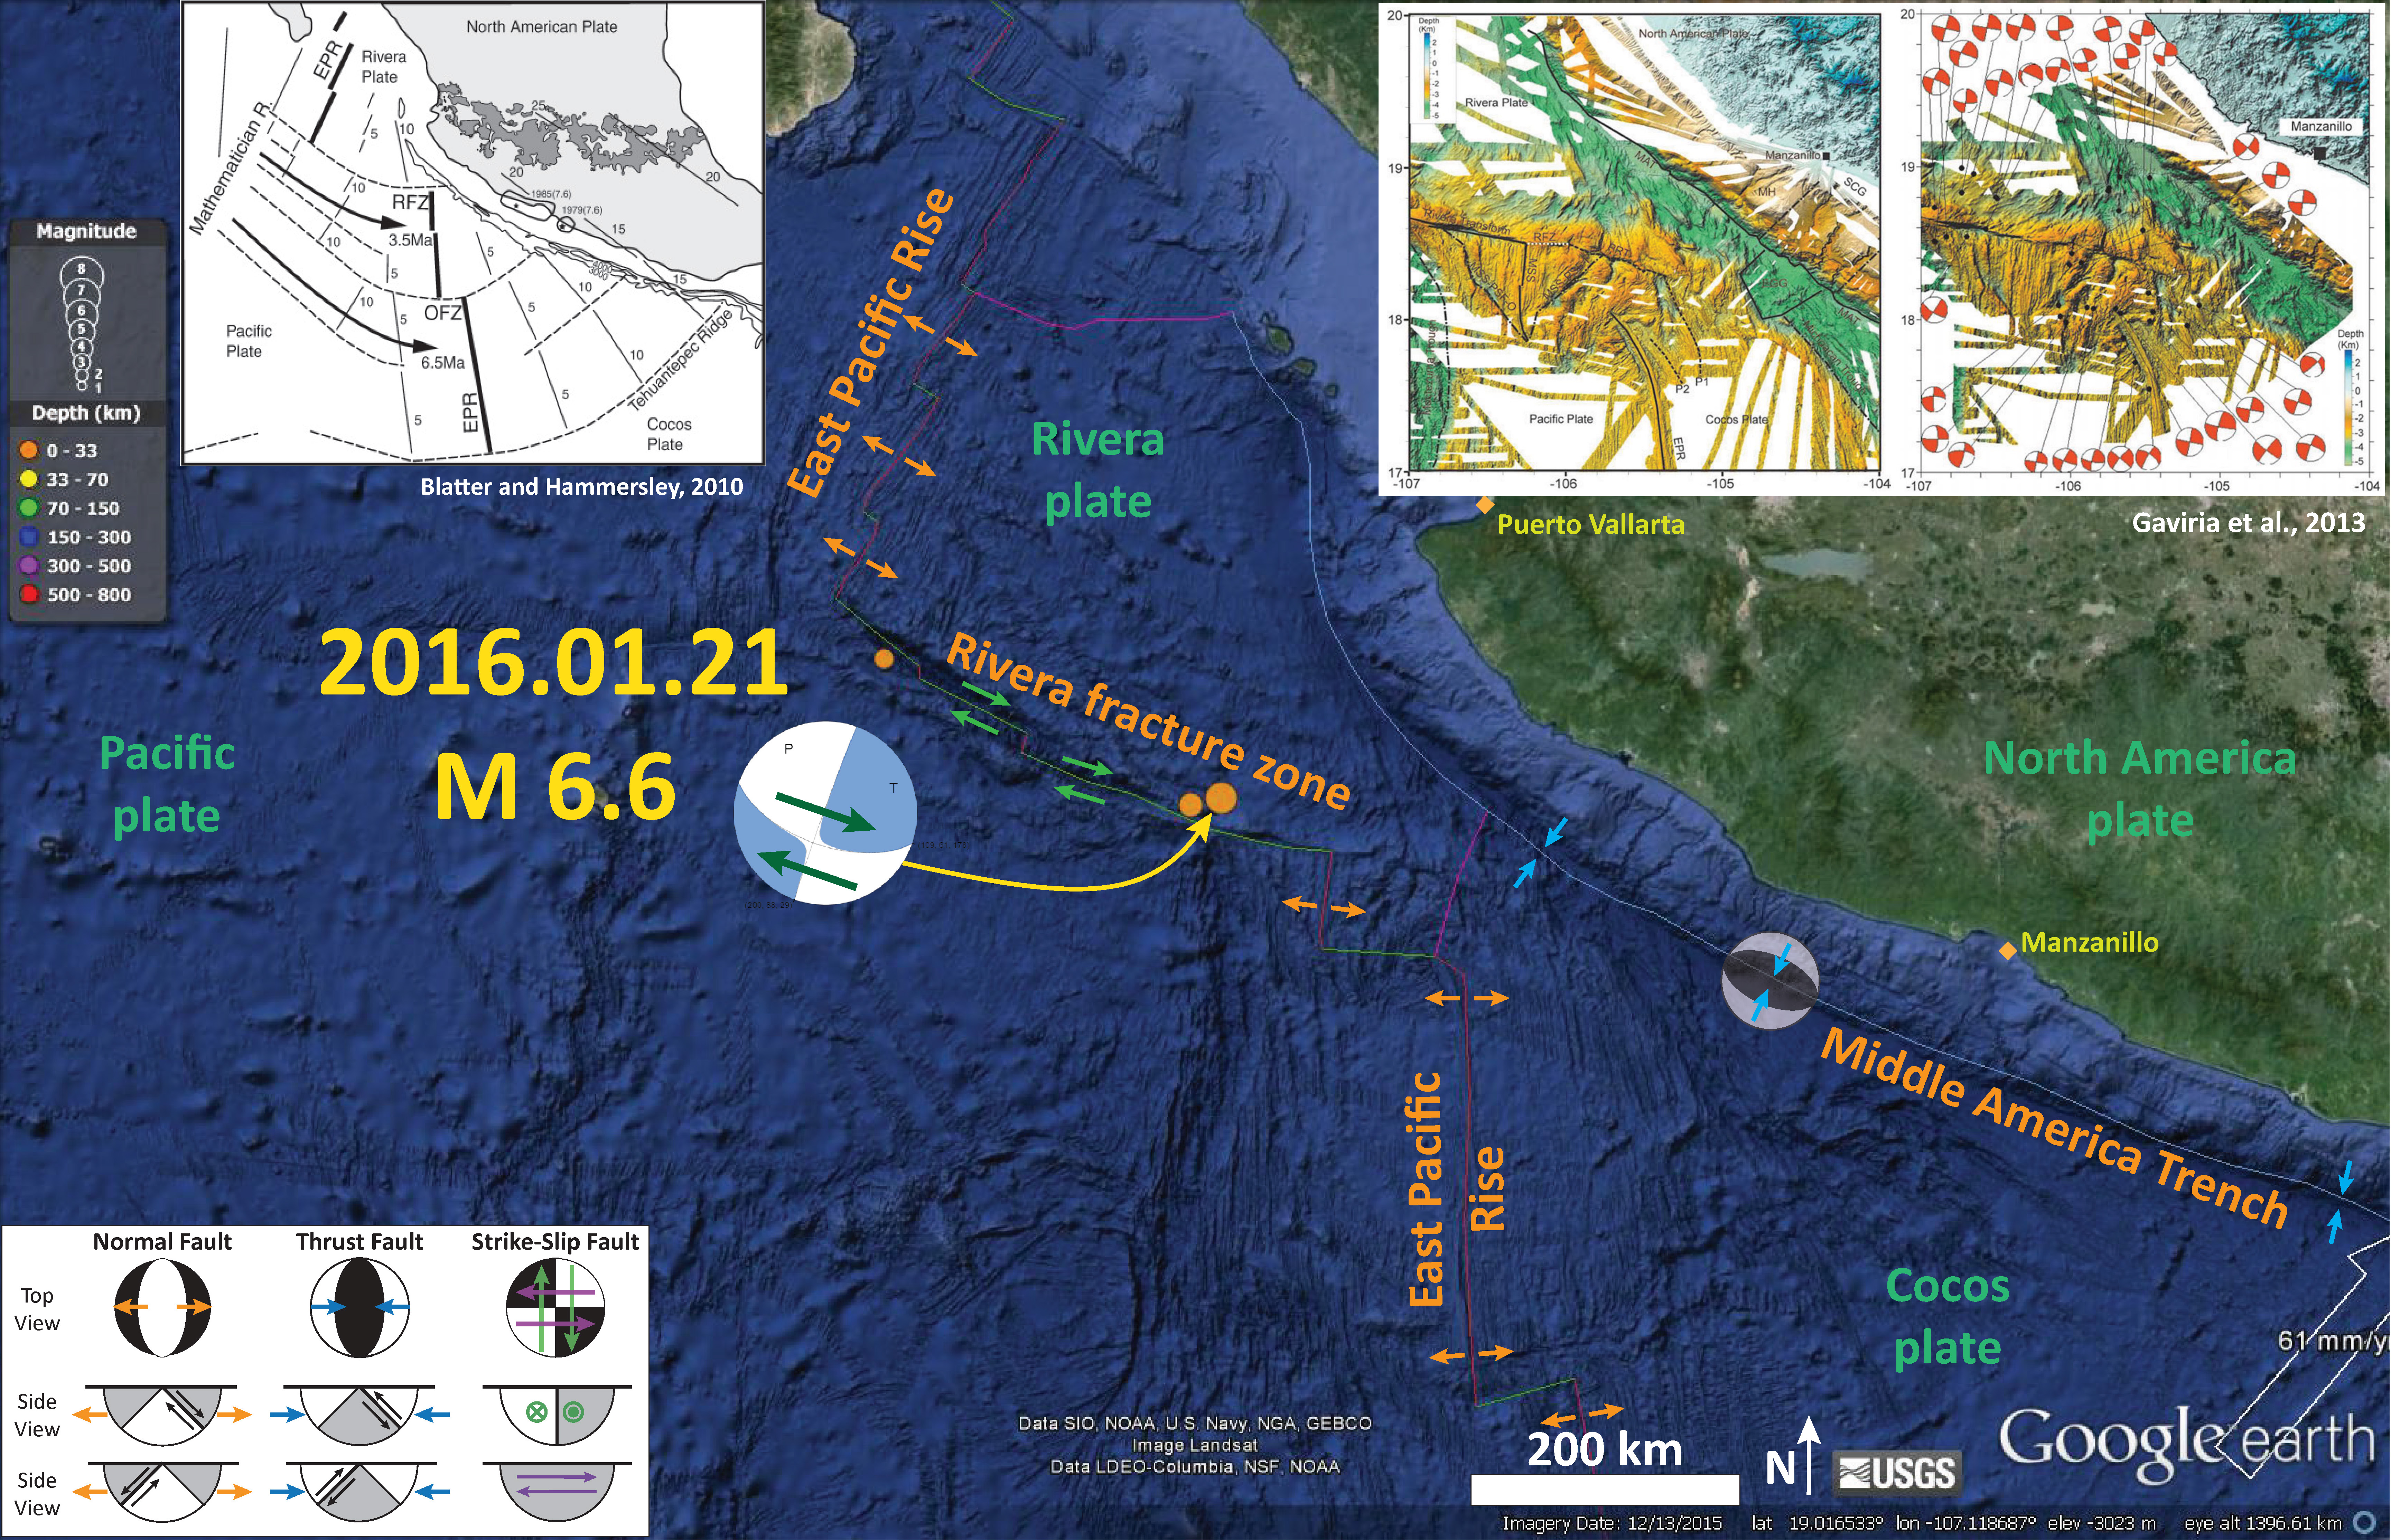
Earlier this year, in January, there was a series of earthquakes along the Rivera fracture zone. Here is my report for that time. Below is my interpretation poster.
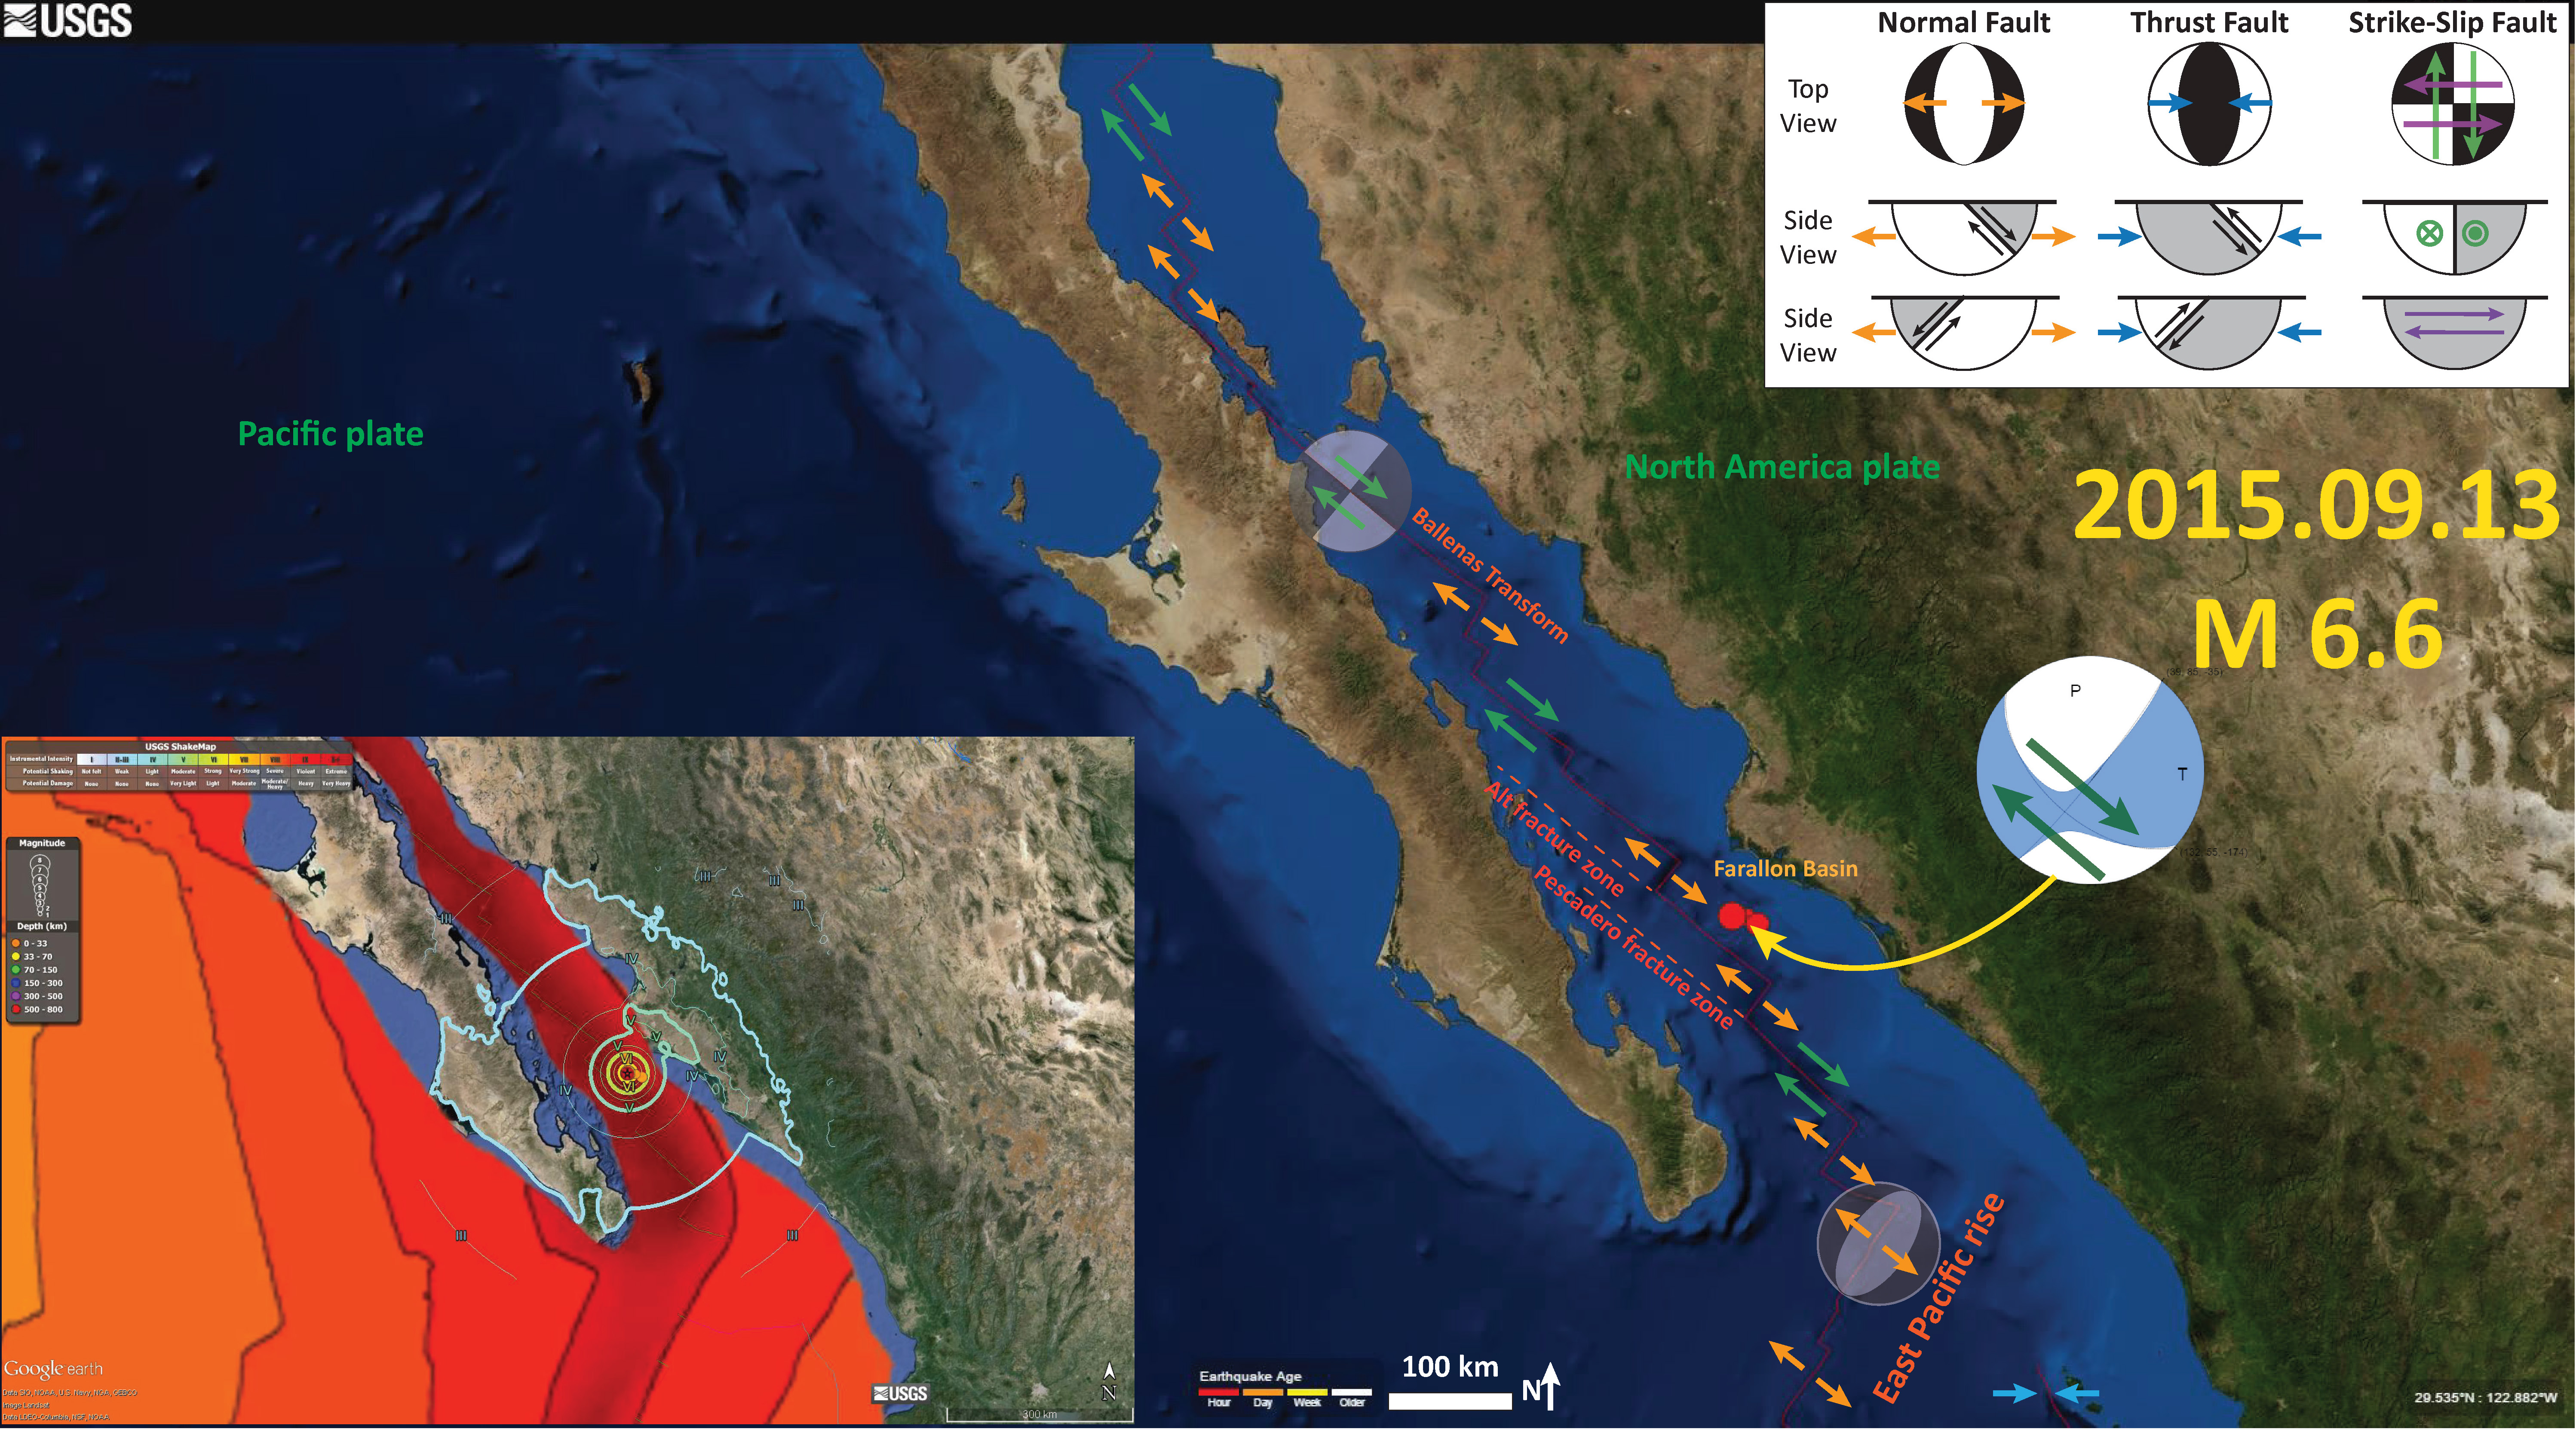
In September 2015, there were some earthquakes yet further to the north. Here is my Earthquake Report from that time.
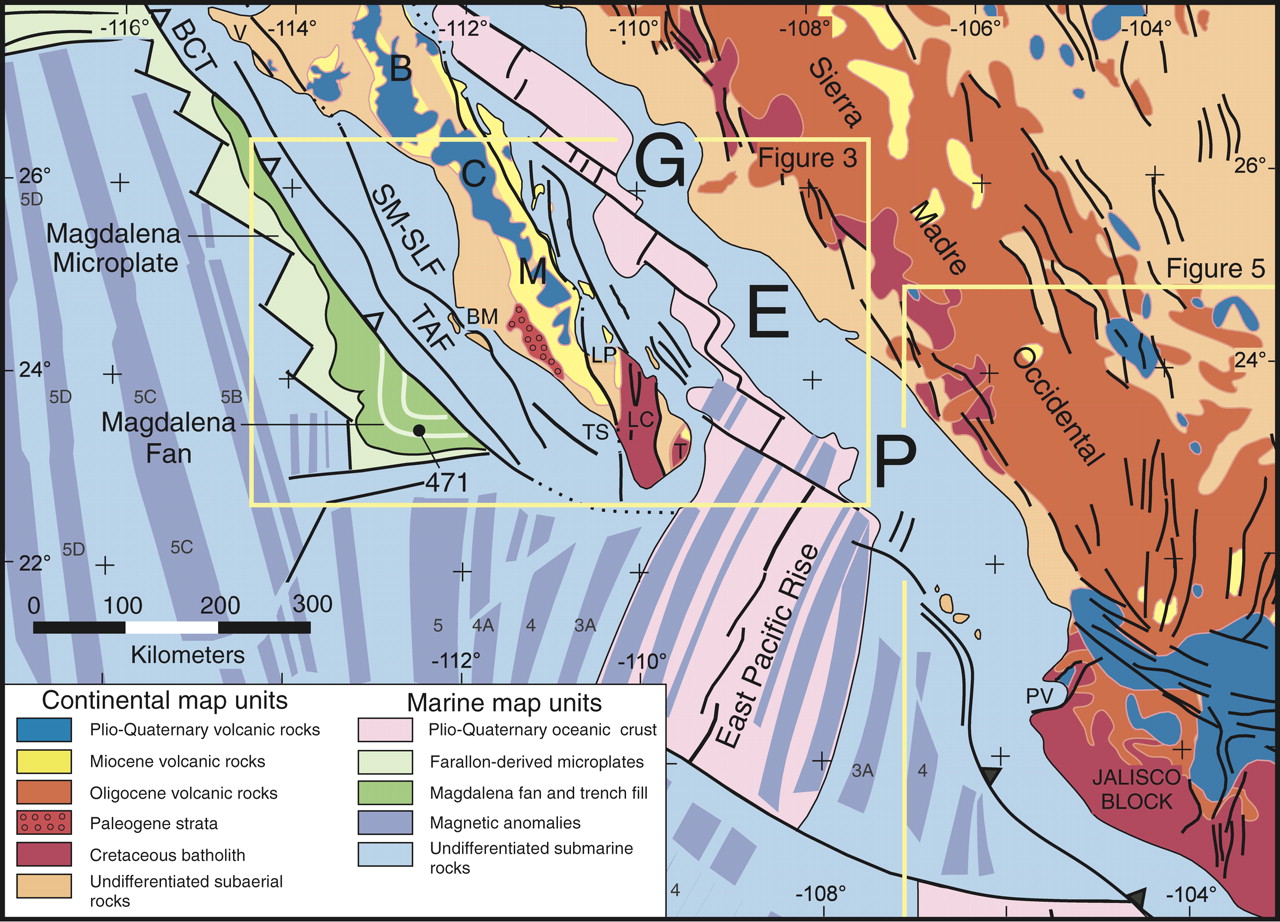
This map shows the magnetic anomalies and the geologic map for the land and the youngest oceanic crust.
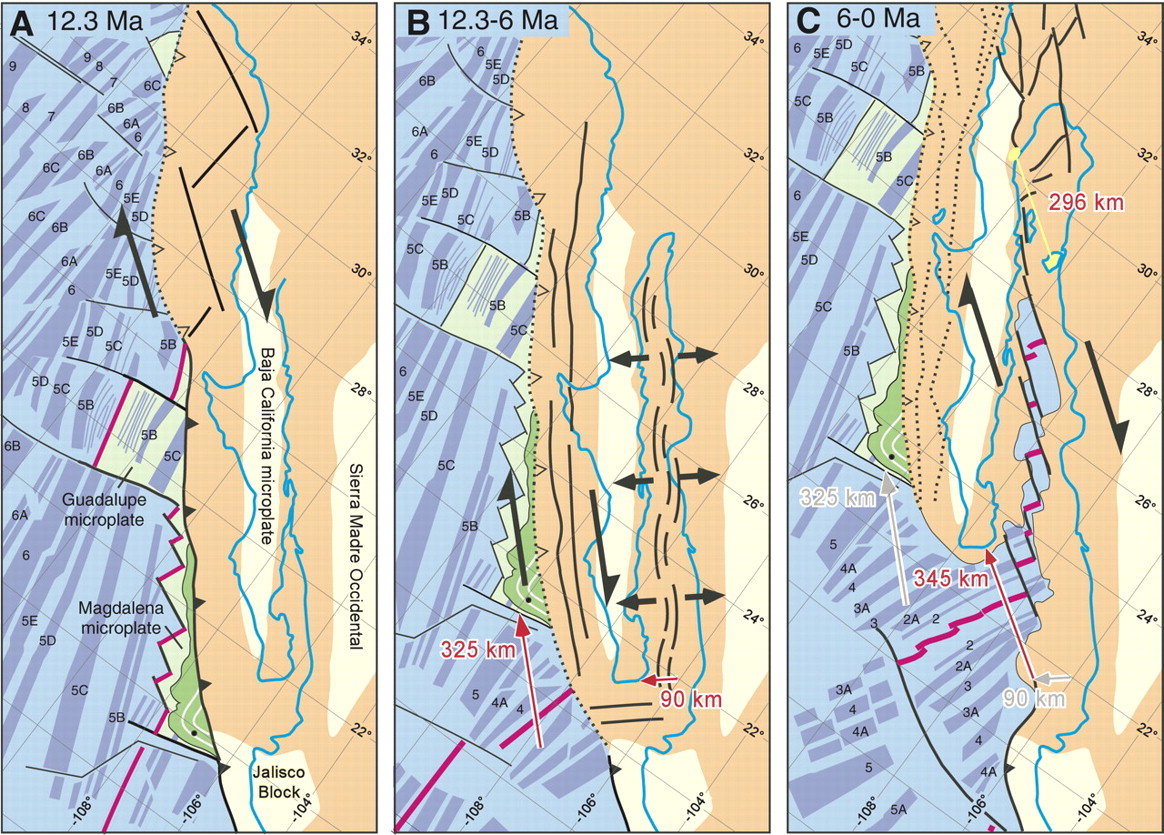
This map shows a more broad view of the magnetic anomalies through time.
This is an animation from Tanya Atwater. Click on this link to take you to yt (if the embedded video below does not work).
Here is an animation from IRIS. This link takes you to yt (if you cannot view the embedded version below). Here is a link to download the 21 MB mp4 vile file.
This is a link to a tectonic summary map from the USGS (Benz et al., 2011). Click on the map below to download the 20 MB pdf file.
-
References:
- Benz, H.M., Dart, R.L., Villaseñor, Antonio, Hayes, G.P., Tarr, A.C., Furlong, K.P., and Rhea, Susan, 2011, Seismicity of the Earth 1900–2010 Mexico and vicinity: U.S. Geological Survey Open-File Report 2010–1083-F, scale 1:8,000,000.
- Key, K., Constable, S., Liu, L., and Pommier, 2013. Electrical image of passive mantle upwelling beneath the northern East Pacific Rise in Nature, v. 495, p. 499-502.
- Hayes, G. P., D. J. Wald, and R. L. Johnson, 2012. Slab1.0: A three-dimensional model of global subduction zone geometries, J. Geophys. Res., 117, B01302, doi:10.1029/2011JB008524.
- Mann, P., 2007. Overview of the tectonic history of northern Central America, in Mann, P., ed., Geologic and tectonic development of the Caribbean plate boundary
in northern Central America: Geological Society of America Special Paper 428, p. 1–19, doi: 10.1130/2007.2428(01) - Ryan, W.B.F., S.M. Carbotte, J.O. Coplan, S. O’Hara, A. Melkonian, R. Arko, R.A. Weissel, V. Ferrini, A. Goodwillie, F. Nitsche, J. Bonczkowski, R. Zemsky, 2009. Global Multi-Resolution Topography synthesis, Geochem. Geophys. Geosyst., 10, Q03014, 10.1029/2008GC002332.
- Toomey, D.R., Jousselin< D., Dunn, R.A., Wilcock, W.S.D., and Detrick, R.S., 2007. Skew of mantle upwelling beneath the East Pacific Rise governs segmentation in Nature, v. 446, p. 409-414.