We just had an earthquake in the Vanuatu region, along the New Hebrides subduction zone. This earthquake is at great depth and will most likely not produce a tsunami. The USGS magnitude is currently set at M = 7.3. UPDATE: revised magnitude M = 7.1.
Here is the USGS website for this earthquake. Here is a USGS poster that presents the historic seismicity of this region.
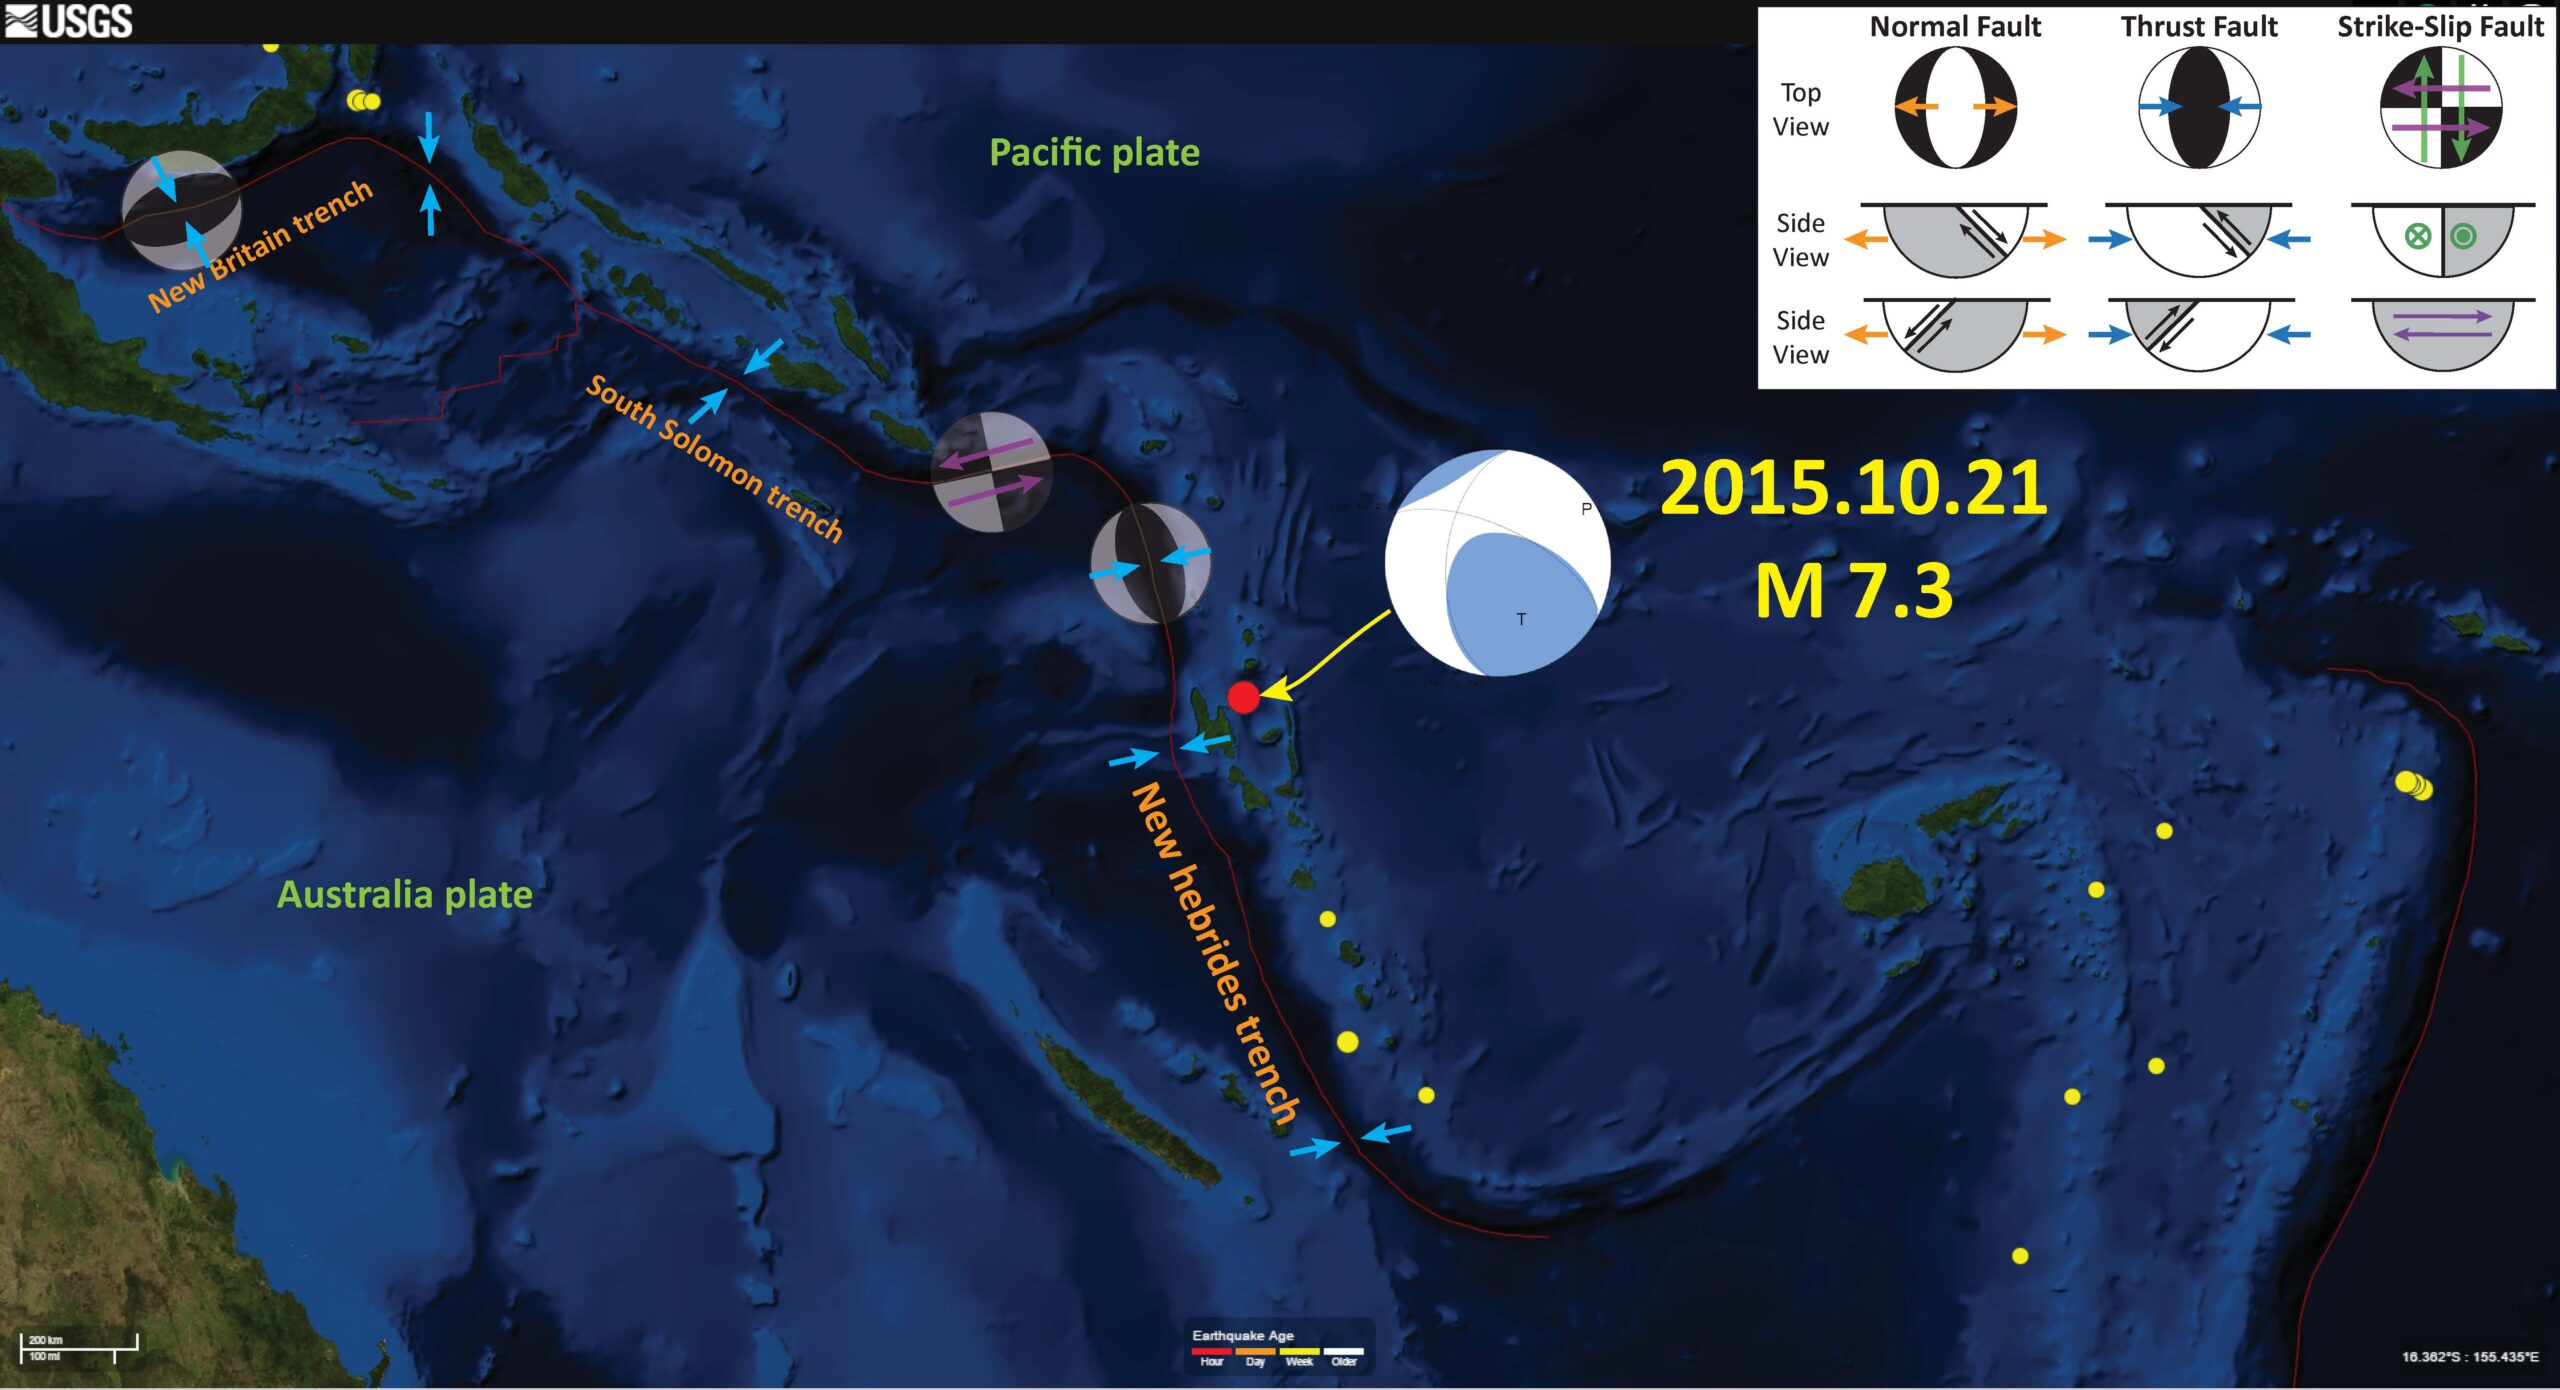
Here is a map that shows the earthquake (depth ~117 km) plotted east of the New Hebrides subduction zone. Since this subduction zone fault dips to the right (east), the location of this earthquake makes sense.
I placed a moment tensor / focal mechanism legend in the upper right corner of the map. There is more material from the USGS web sites about moment tensors and focal mechanisms (the beach ball symbols). Both moment tensors and focal mechanisms are solutions to seismologic data that reveal two possible interpretations for fault orientation and sense of motion. One must use other information, like the regional tectonics, to interpret which of the two possibilities is more likely.
The moment tensor shows an oblique compressional mechanism.

Here is a map from the USGS report linked above. Read more about this map on the USGS website. Earthquakes are plotted with color related to depth and circle diameter related to magnitude. Today’s M 7.1 earthquake occurred midway between these two cross sections F-F’ and G-G’.

This is the legend.
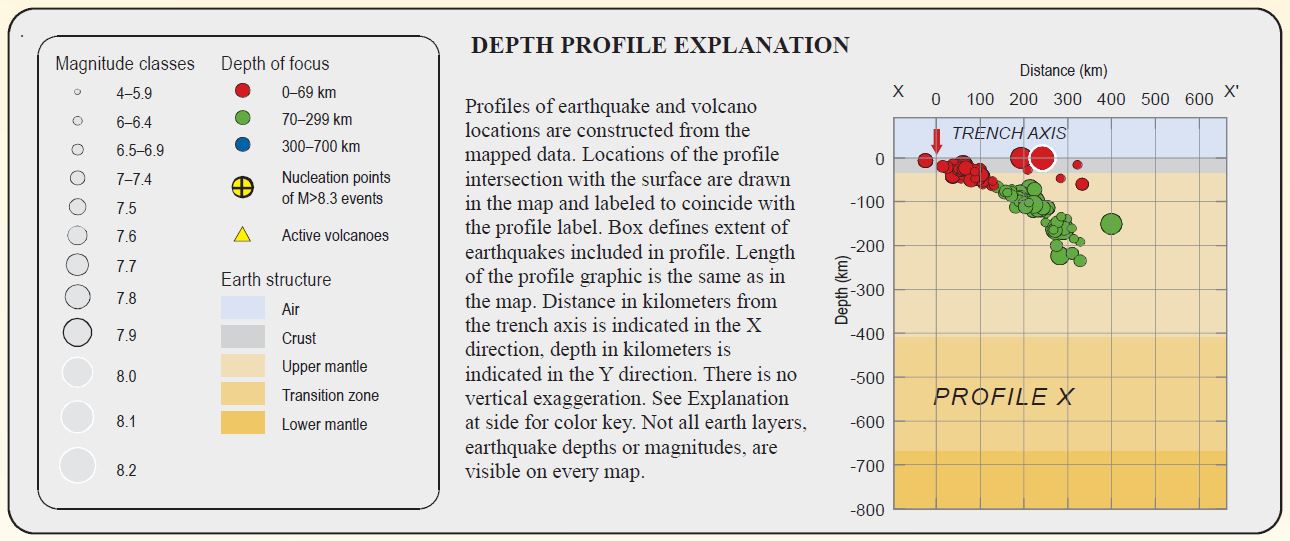
Here are two cross sections showing the seismicity along swatch profiles F-F’ and G-G’.
F-F’

G-G’

This is the shaking intensity map for this earthquake, so it was probably felt across a broad region (all the islands in this map). This map uses the Modified Mercalli Intensity Scale, a shaking intensity scale that is based upon observations made by people, not instruments. More can be found about the MMI scale of shaking intensity here and here.

This is a photo of the Baby Benioff seismograph from Humboldt State University. Photo credit Michelle Robinson.

This region has been very active in the past few years. I will add more posts about this later, but here is a map that I made following a May 2015 earthquake to the north. This shows the regional tectonics.
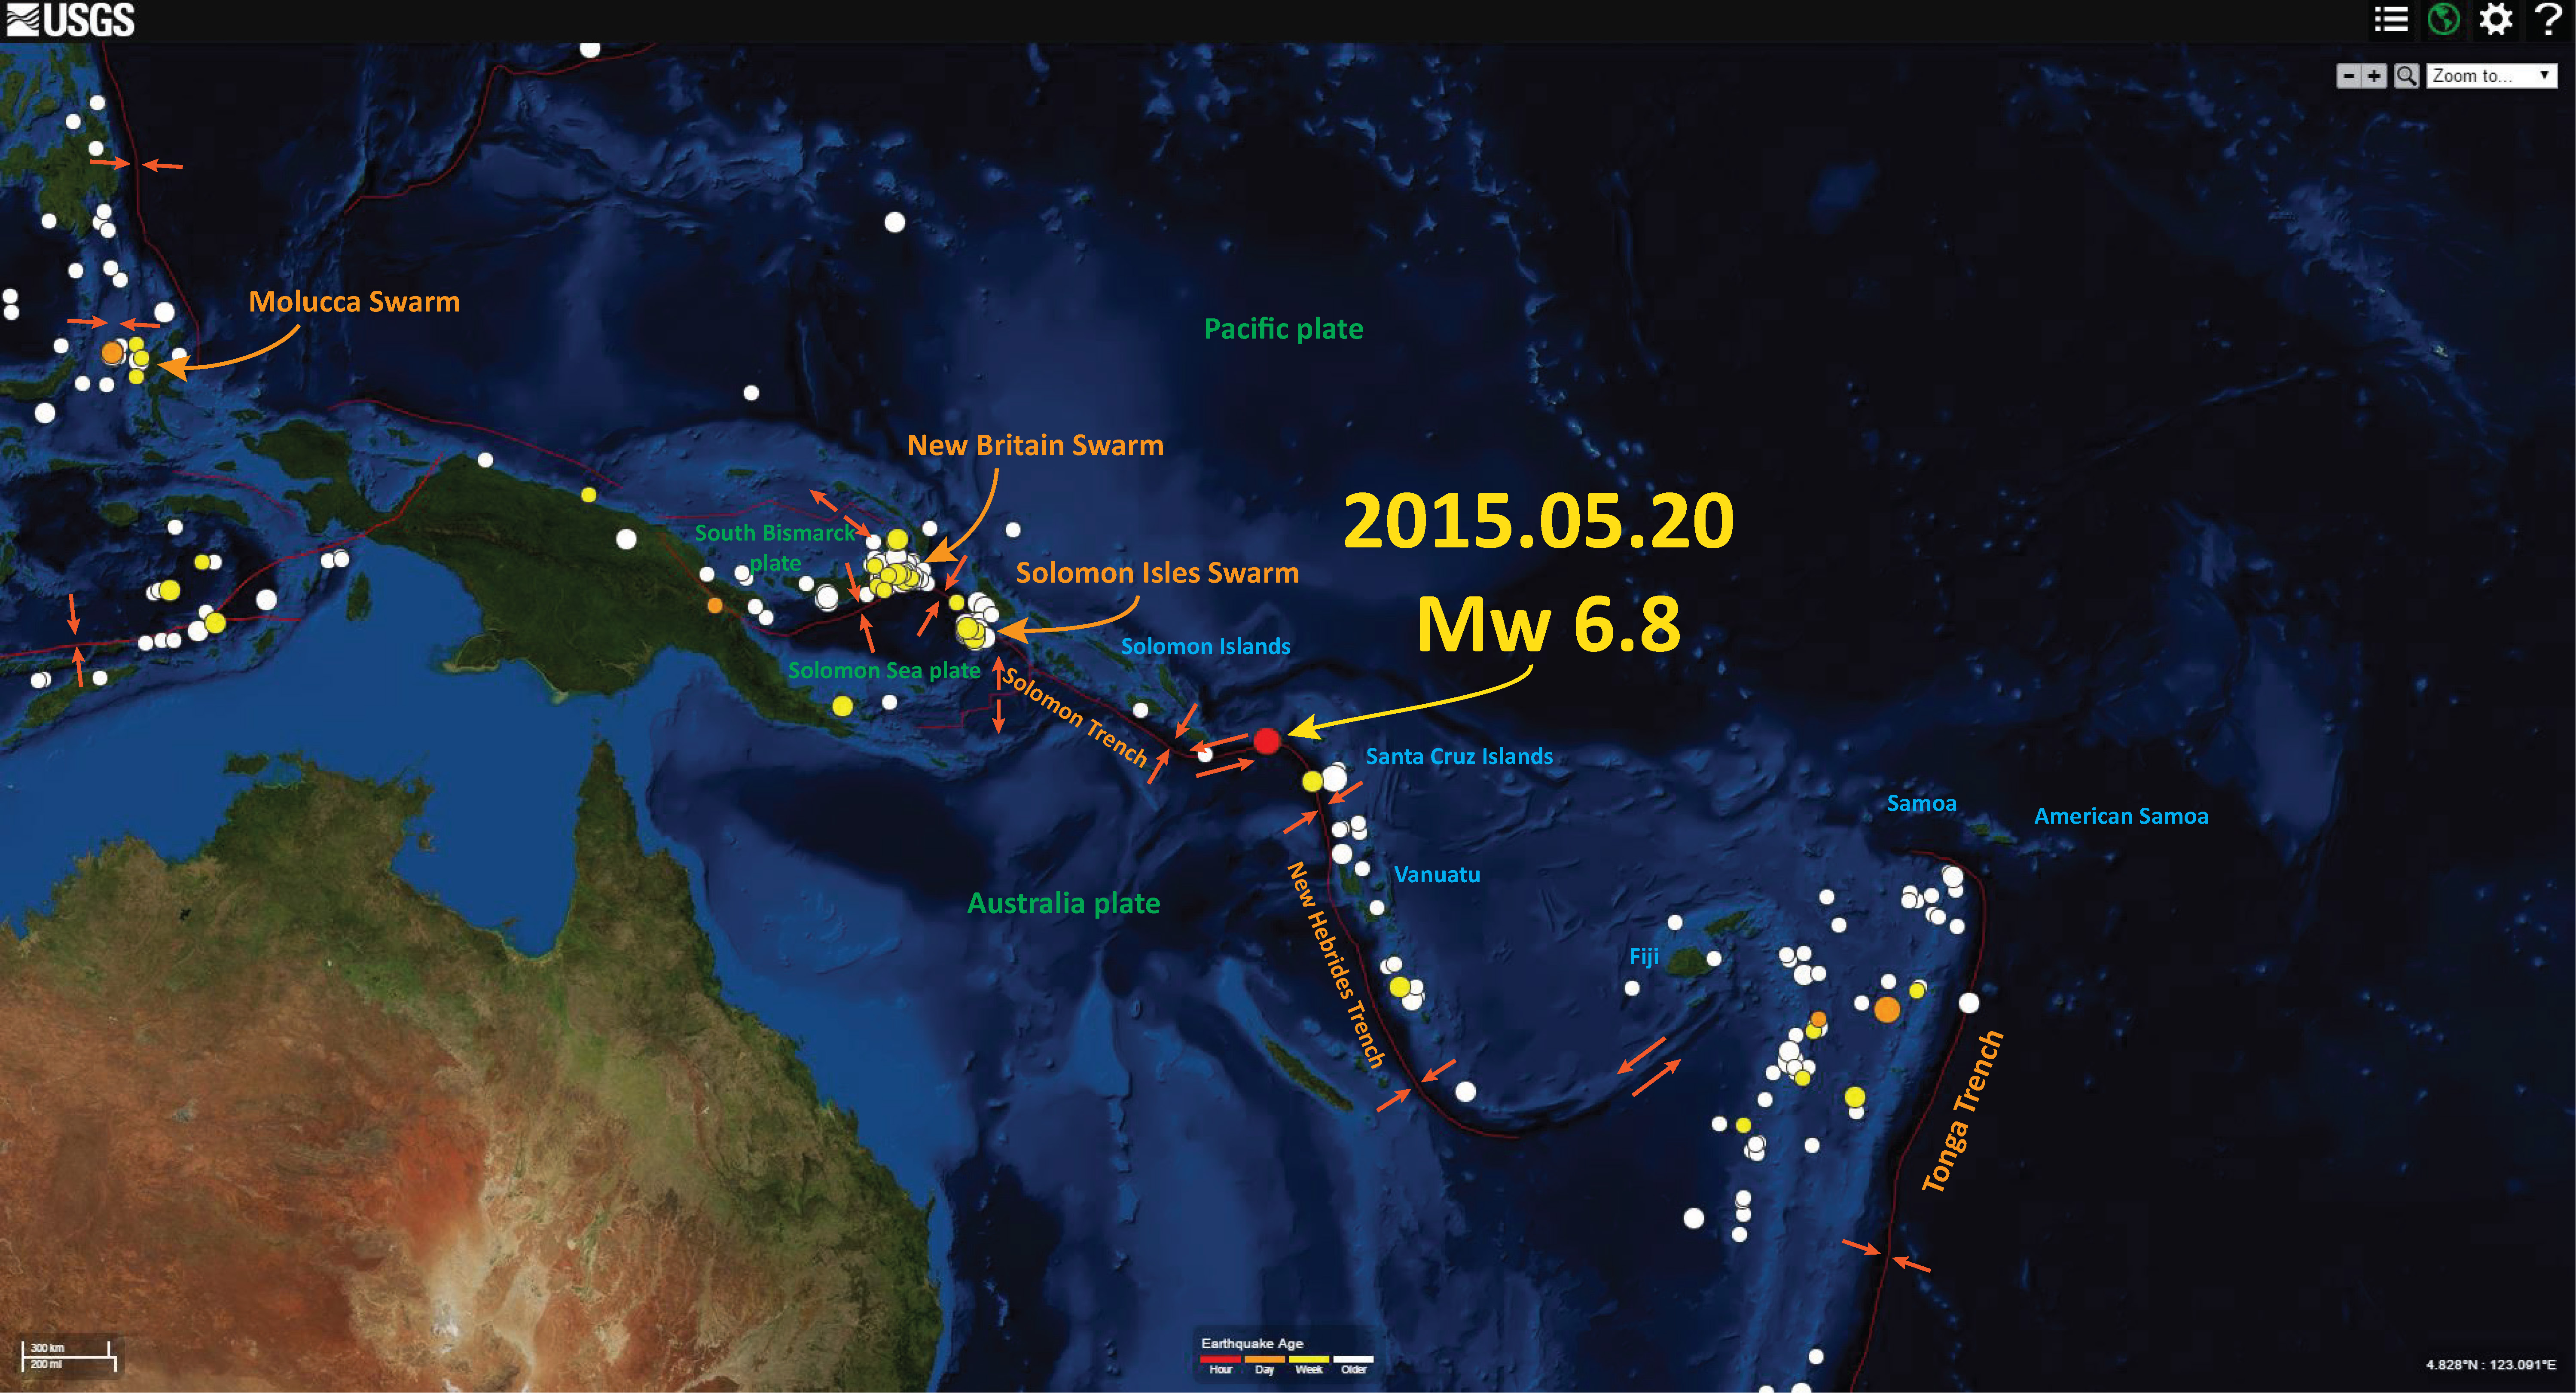
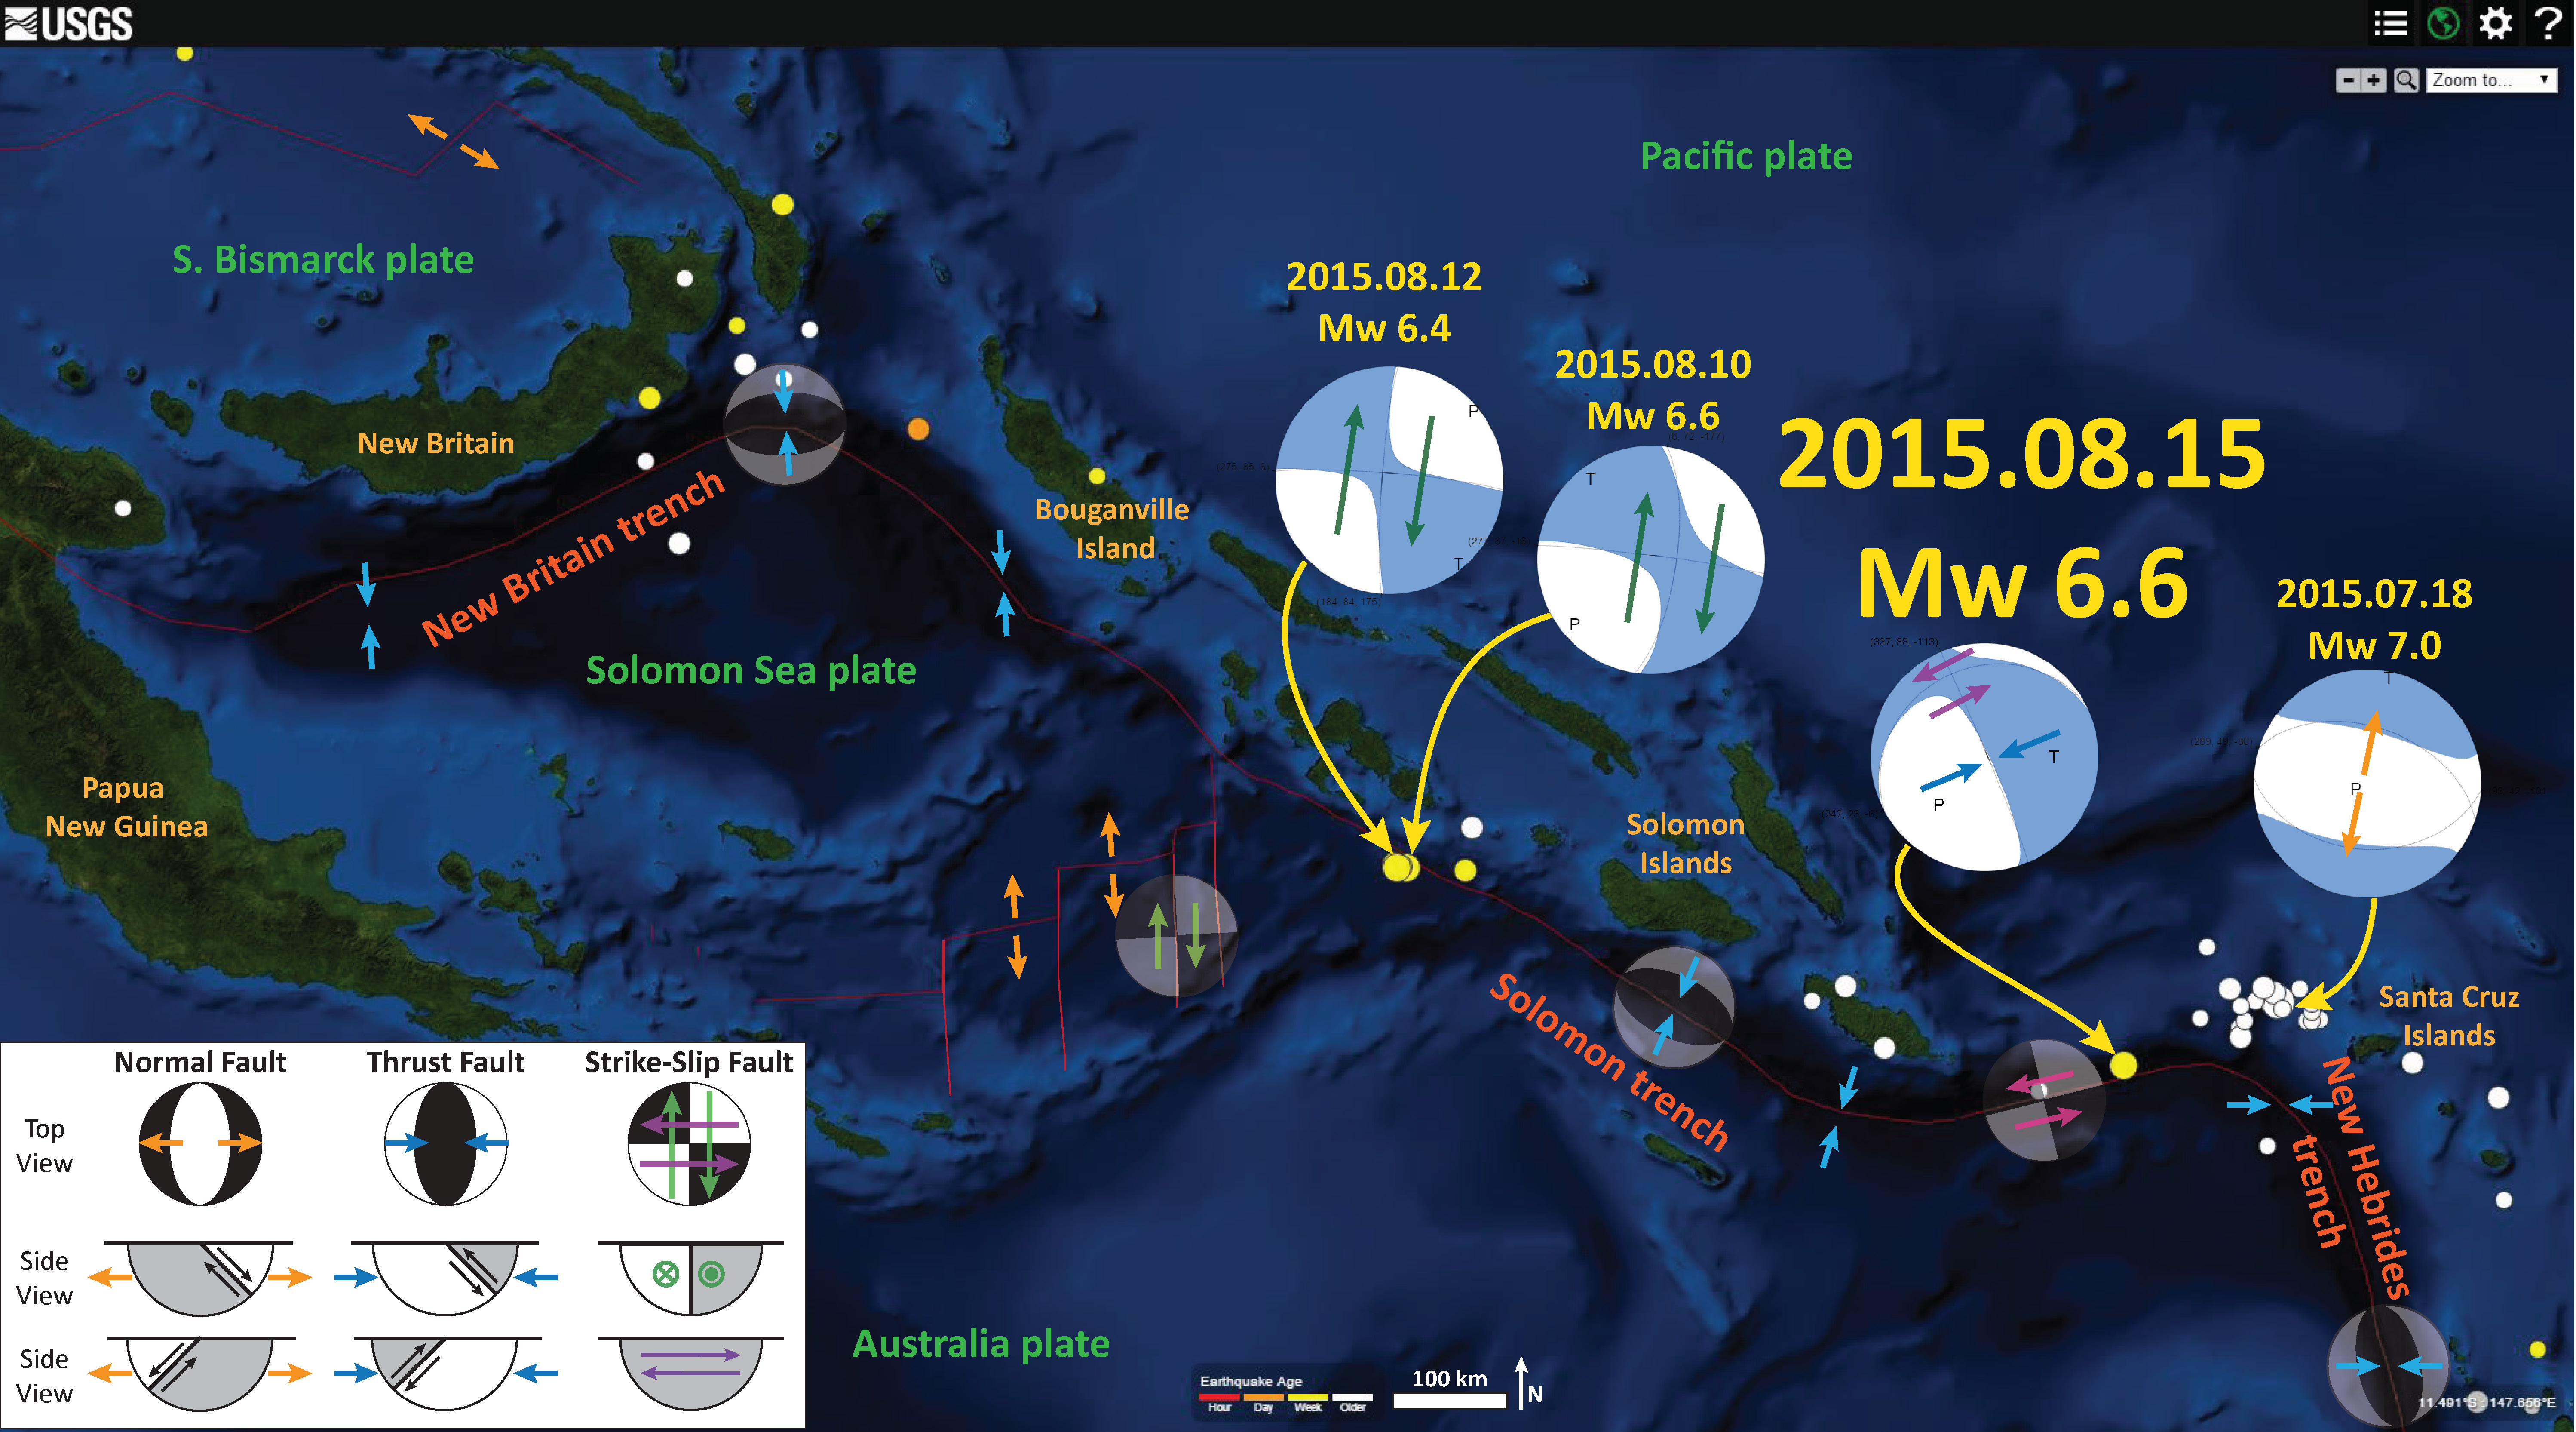
There was an earthquake series that followed the May earthquake, in August 2015.
Here is a map that shows the regional tectonics of this convergent plate boundary from the northern New Hebrides trench northwards.
Here is the “PAGER” report (version 3). This is an estimate of the potential damage to people and their belongings. There is a 30% probability that there are between 1 and 10 casualties.

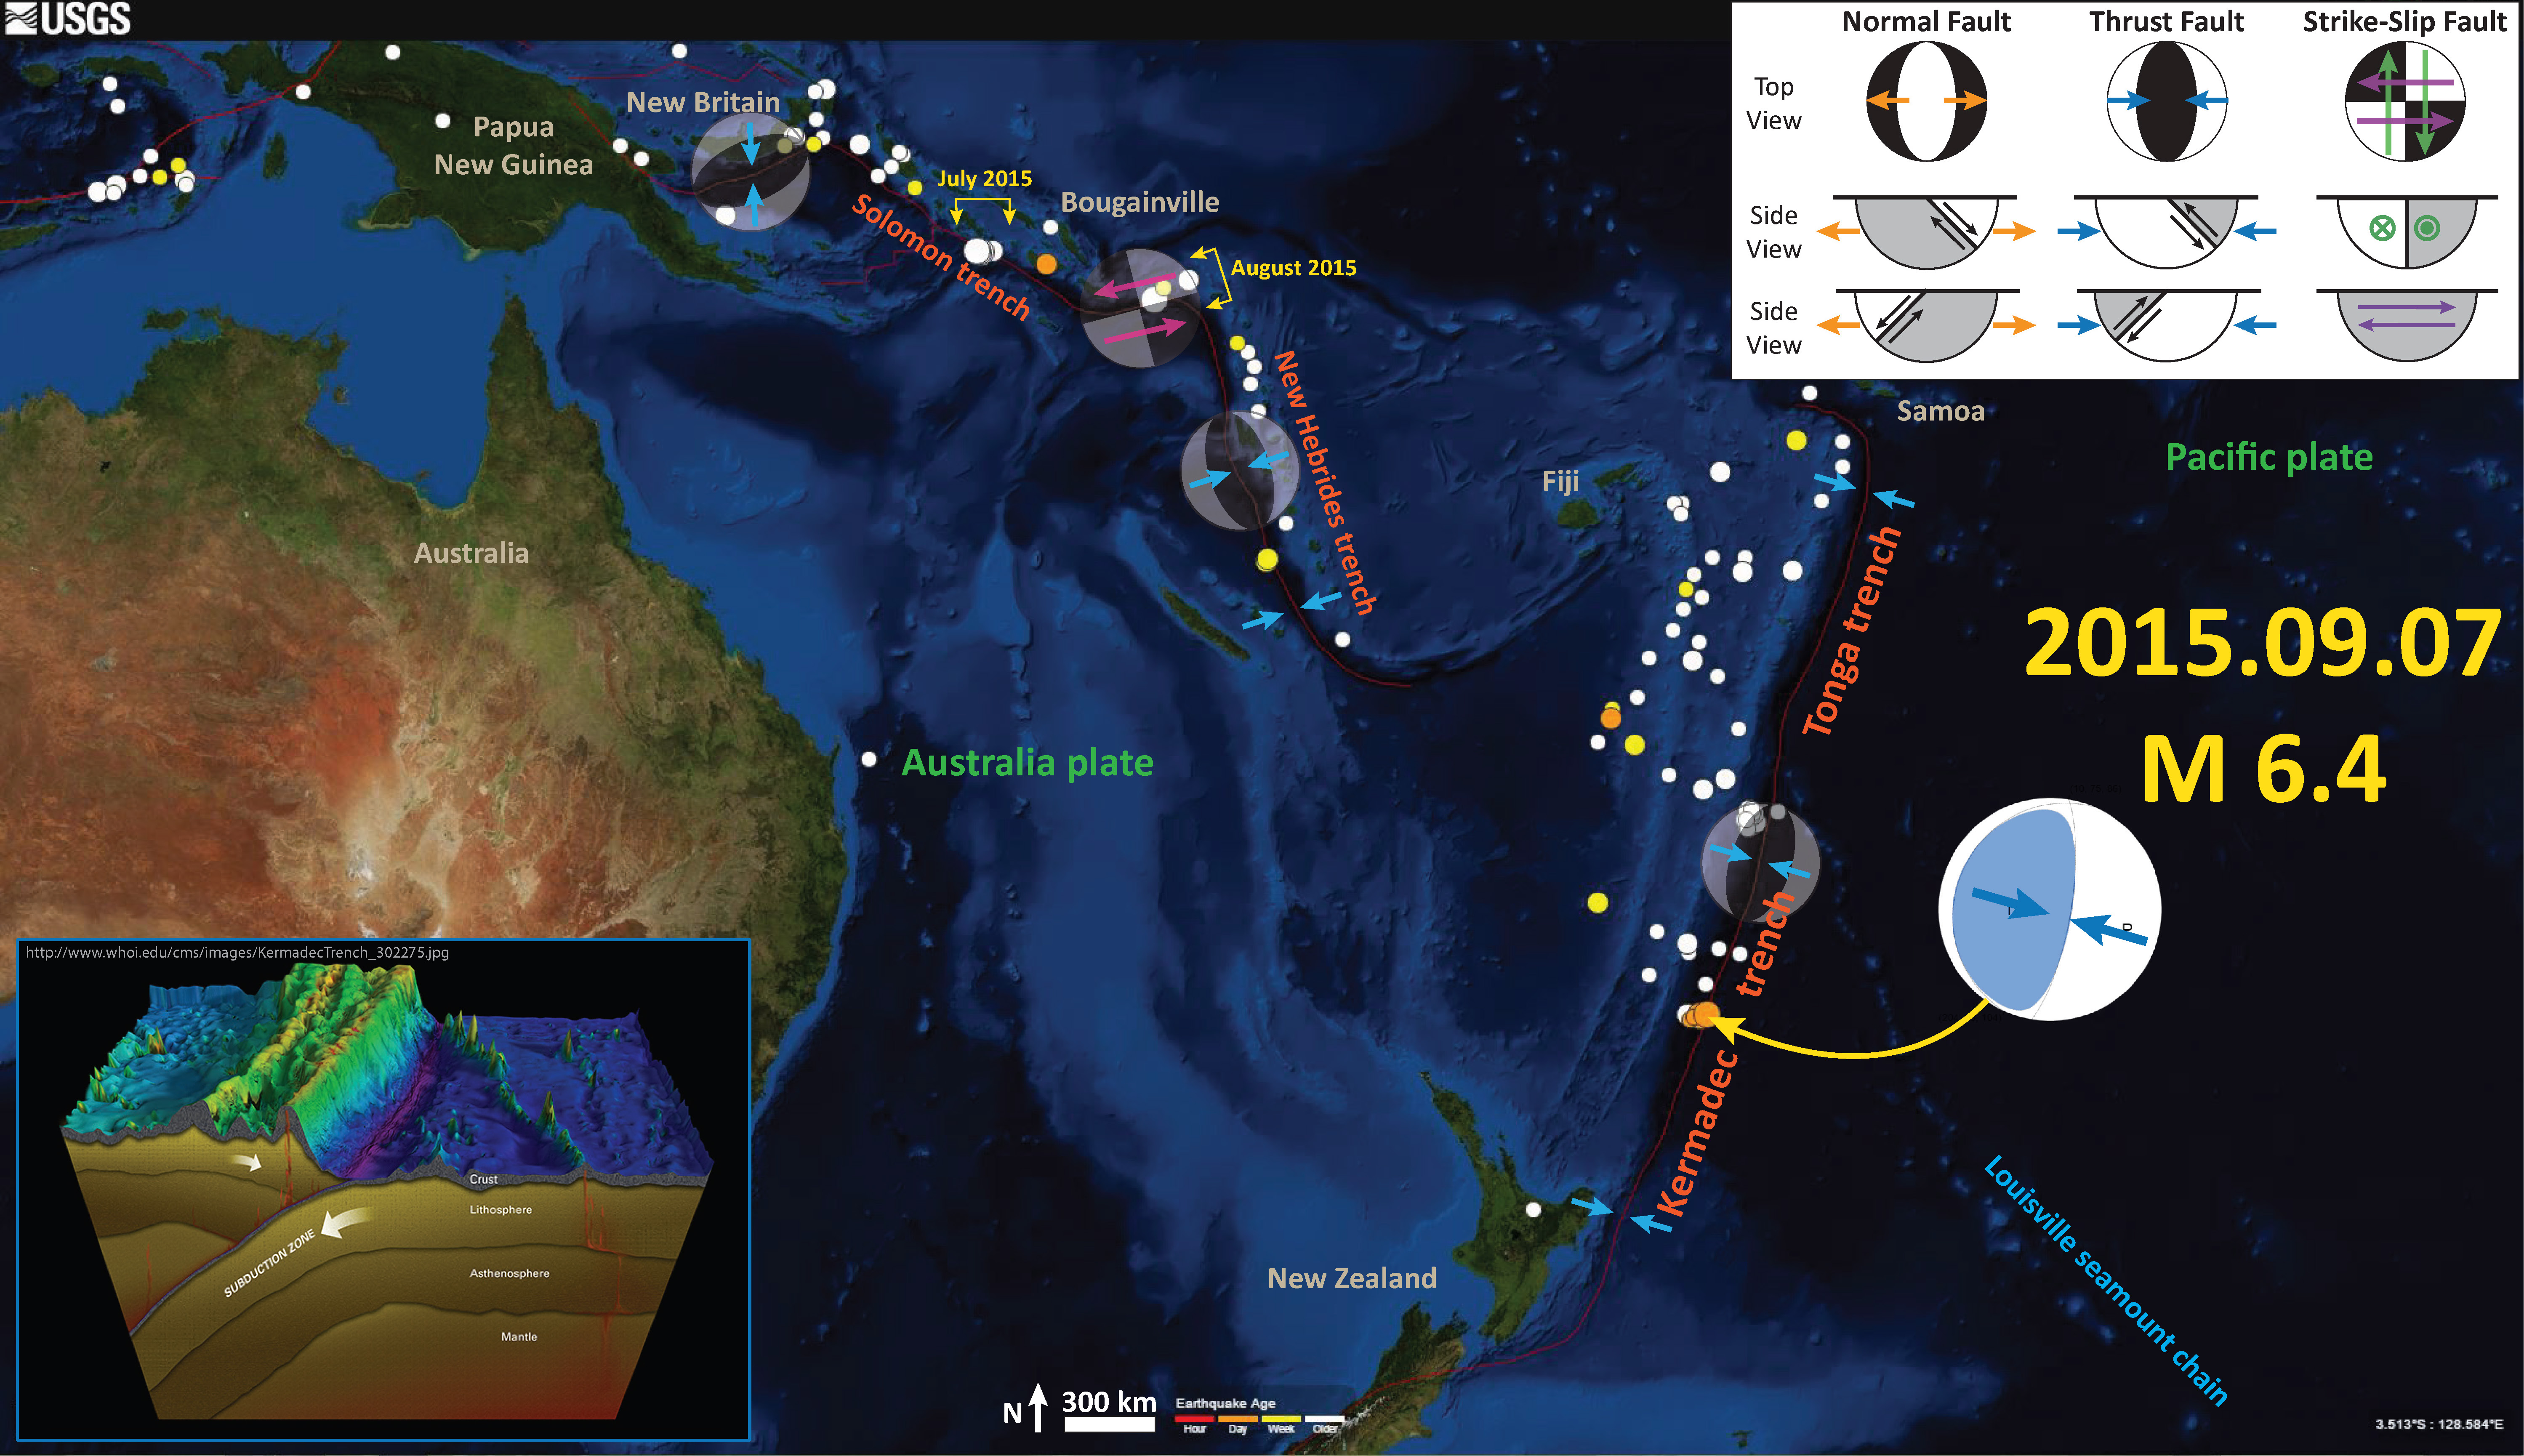
Here is another map showing the regional tectonics. I put this together following an M = 6.4 earthquake along the Kermadec trench in September of 2015.
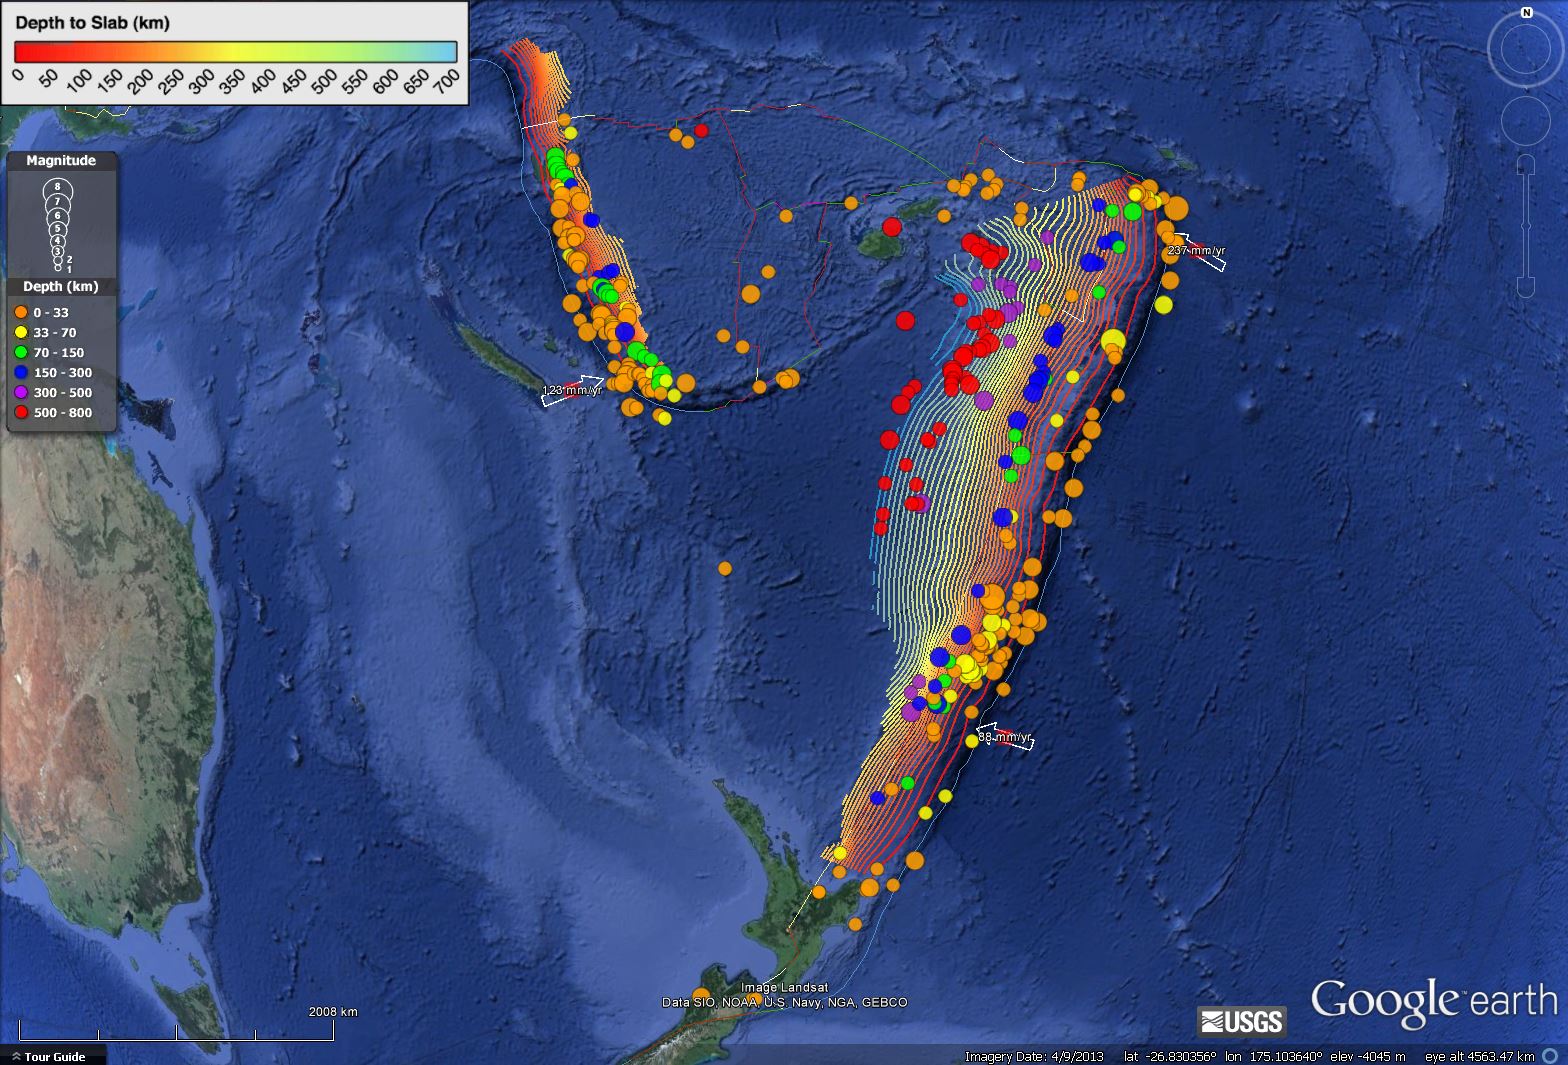
Following the Kermadec trench earthquake, I put together an animation showing historic seismicity for this region leading up to 9/2015. I put together an animation of seismicity from 1965 – 2015 Sept. 7. Here is a map that shows the entire seismicity for this period. I plot the slab contours for the subduction zone here. These were created by the USGS (Hayes et al., 2013).
Here is the animation. Download the mp4 file here. This animation includes earthquakes with magnitudes greater than M 6.5 and this is the kml file that I used to make this animation.
-
References:
- Hayes, G. P., D. J. Wald, and R. L. Johnson (2012), Slab1.0: A three-dimensional model of global subduction zone geometries, J. Geophys. Res., 117, B01302, doi:10.1029/2011JB008524