Those of you in the region of the San Francisco Bay are probably wondering what the likelihood that this recent and ongoing swarm of earthquakes in the San Ramon area may lead to a larger earthquake. I do not know, but I will lay out some things for you to chew on.
-
Two possibilities exist. The prior has a slightly higher likelihood in my opinion. Others may have a stronger opinion and when they chime in, I will add more commentary here.
- These are foreshocks to an earthquake on the Pleasanton fault zone.
- These earthquakes are loading the Calaveras fault and we can expect an earthquake on that fault system.
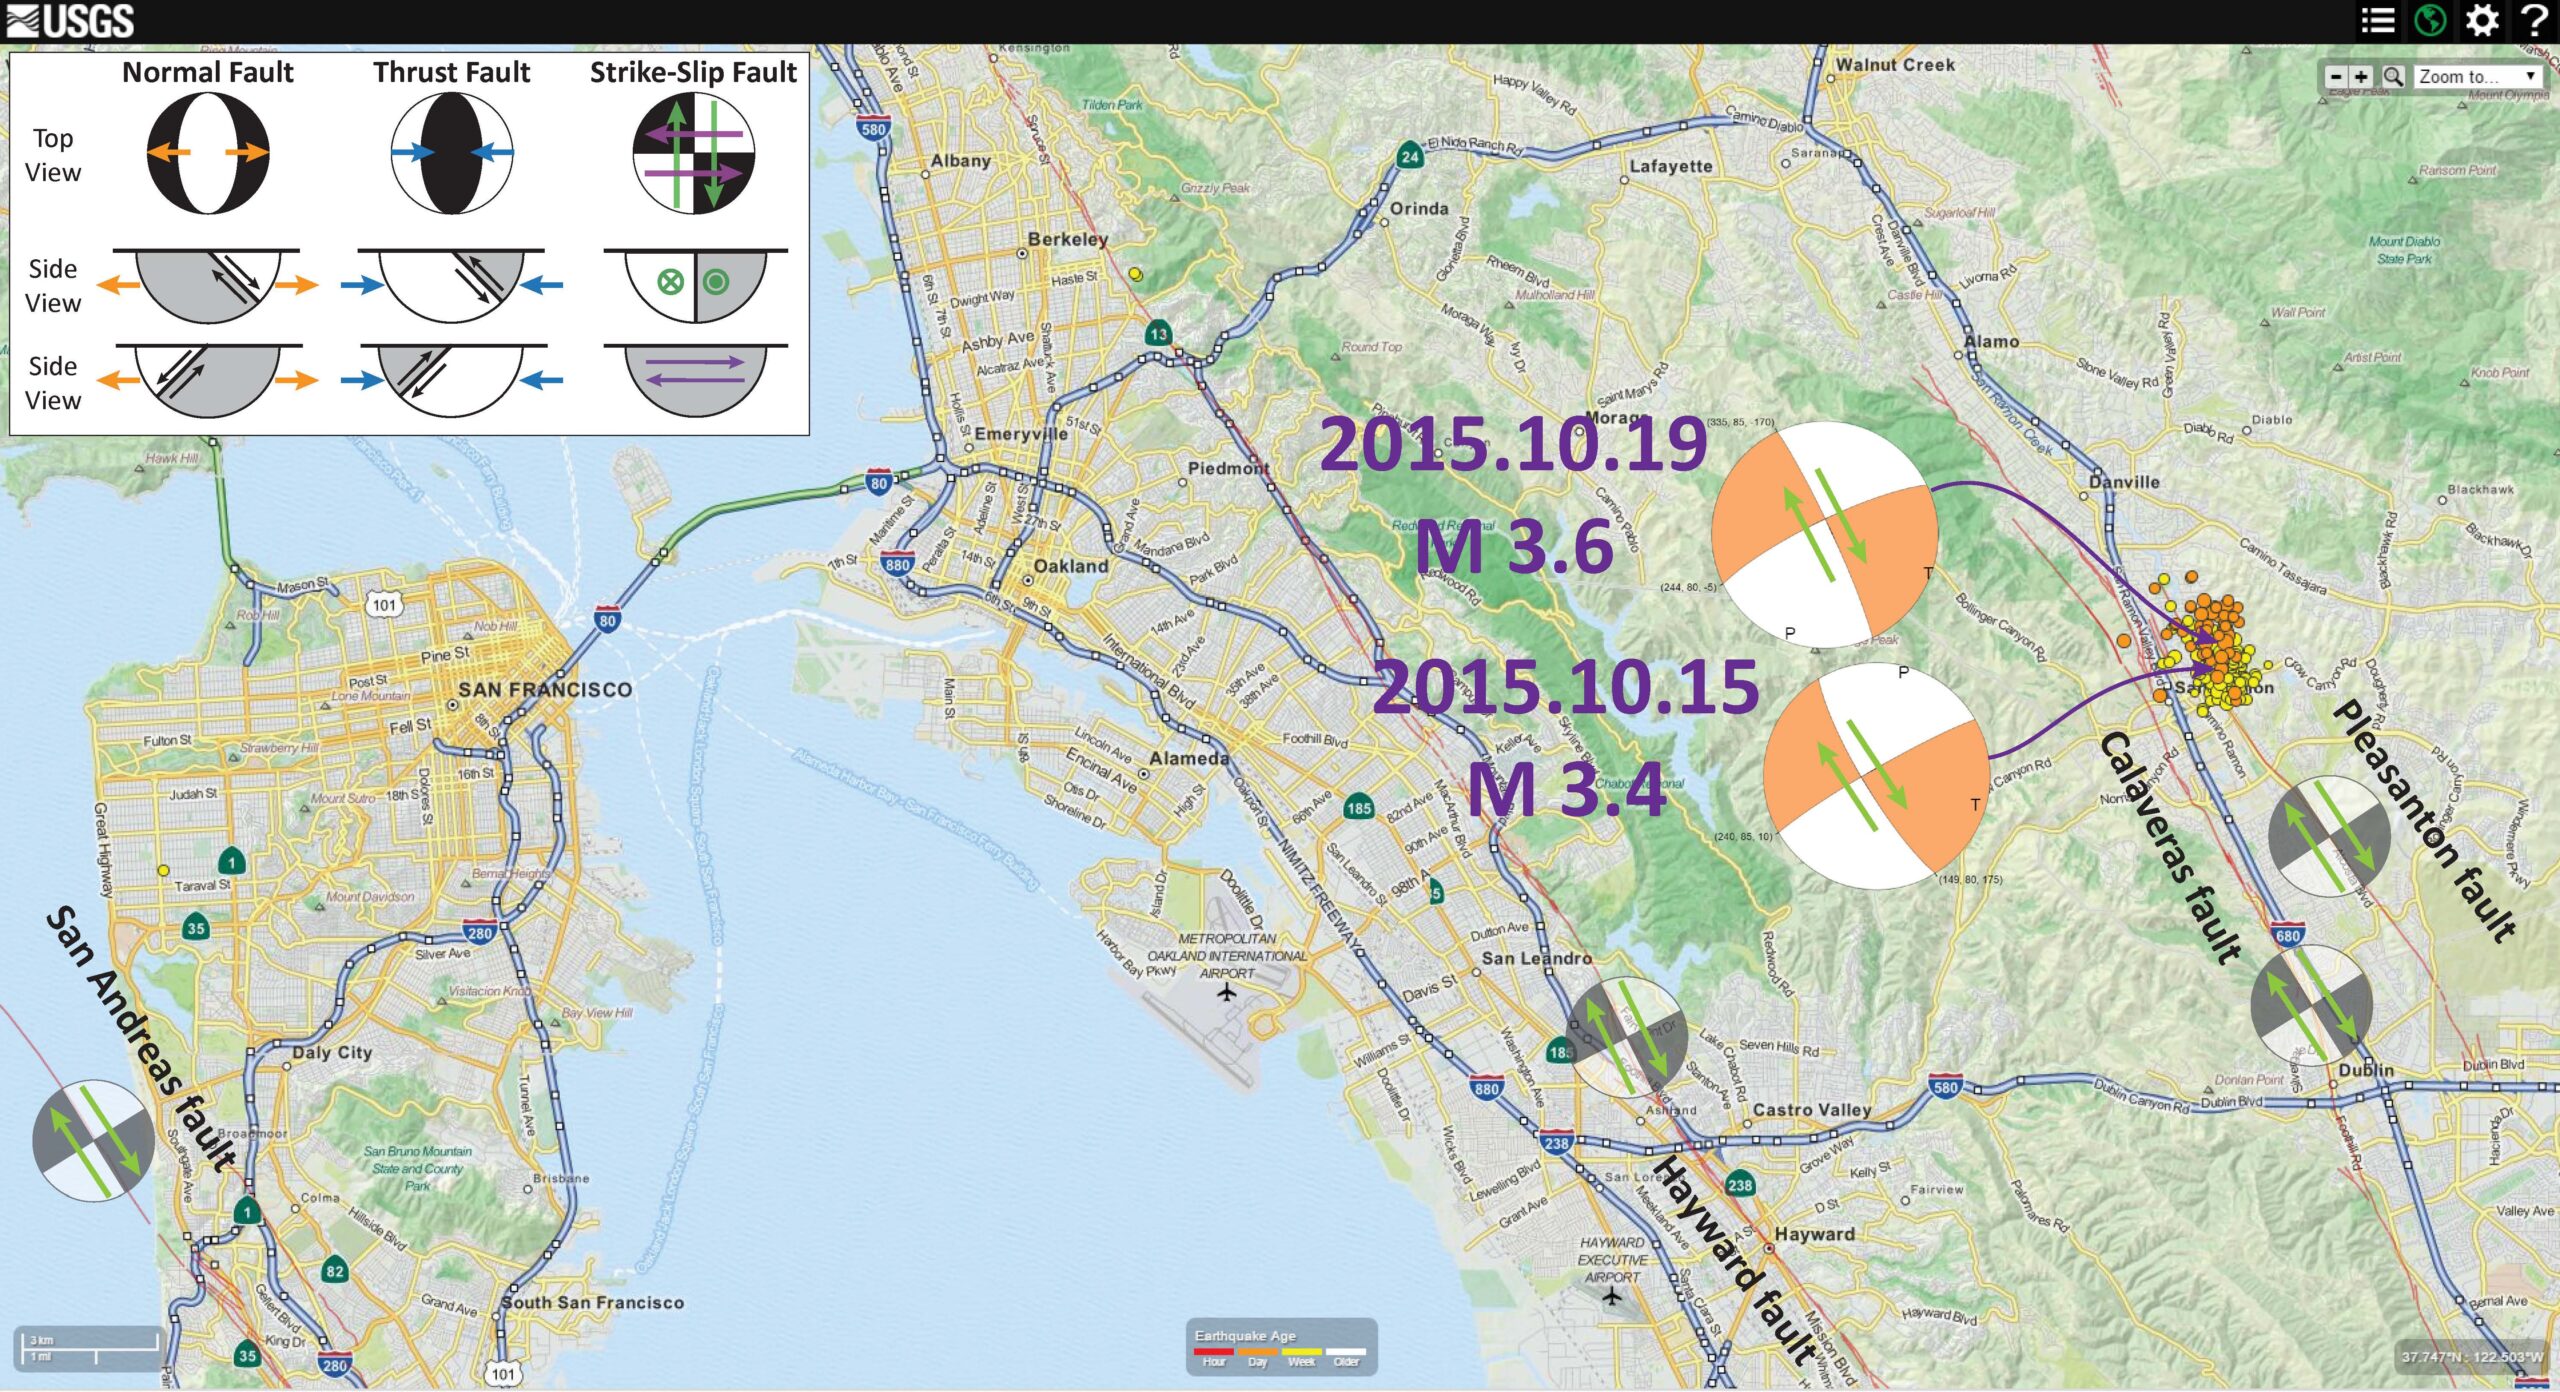
Here is a map that shows the regional fault lines and the focal mechanisms for the two largest (M = 3.4 & 3.4) earthquakes from this swarm. Given the presence of the dominantly right-lateral strike-slip faulting in the region, I interpret these two earthquakes to be right-lateral (dextral) strike-slip earthquakes. It appears that these earthquakes are shallow and are associated with deformation along the Pleasanton fault or nearby faults. It appears that these earthquakes are near the northward termination of this fault zone.
I placed a moment tensor / focal mechanism legend in the upper left corner of the map. There is more material from the USGS web sites about moment tensors and focal mechanisms (the beach ball symbols). Both moment tensors and focal mechanisms are solutions to seismologic data that reveal two possible interpretations for fault orientation and sense of motion. One must use other information, like the regional tectonics, to interpret which of the two possibilities is more likely.

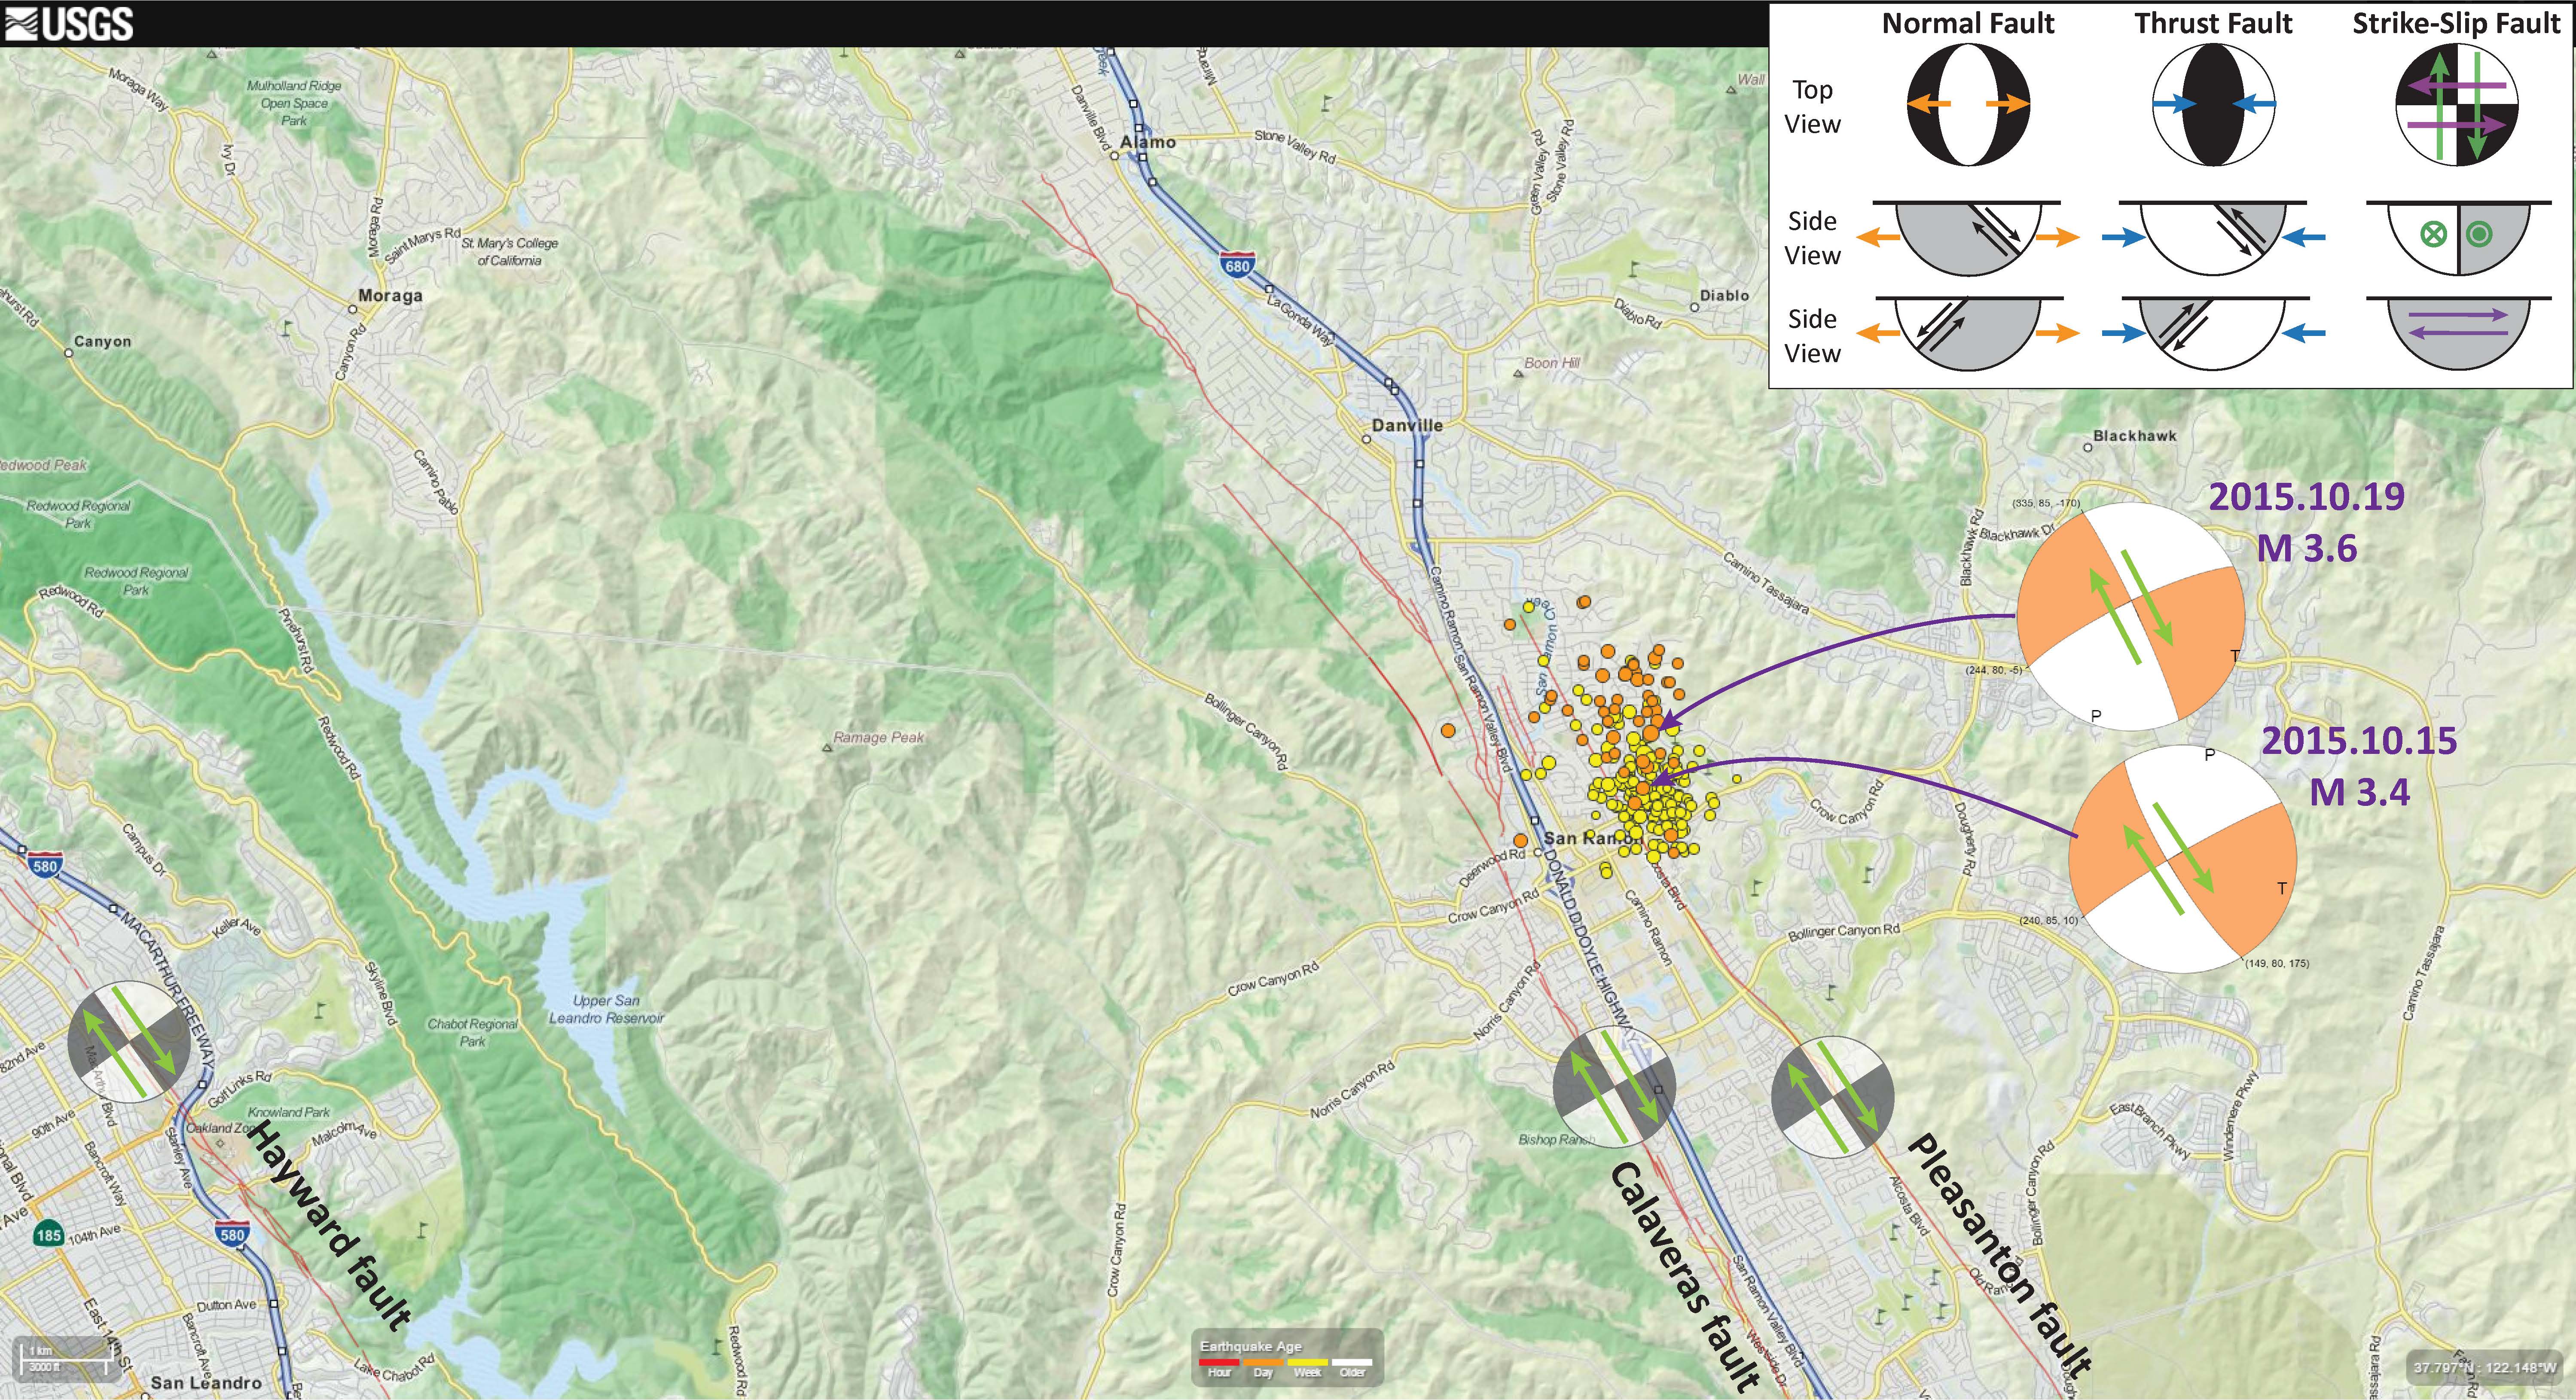
Here is a locally zoomed map showing these earthquakes as they relate to the cities of San Ramon and Danville. Notice how the Pleasanton fault ends in the region of the swarm. This swarm may have loaded the fault segments to the south, along the Pleasanton fault. However, it probably did not load significantly the Calaveras fault system to the west. The faults at depth may be complicated, so this 2-D plan view interpretation of the stresses is probably an oversimplification.
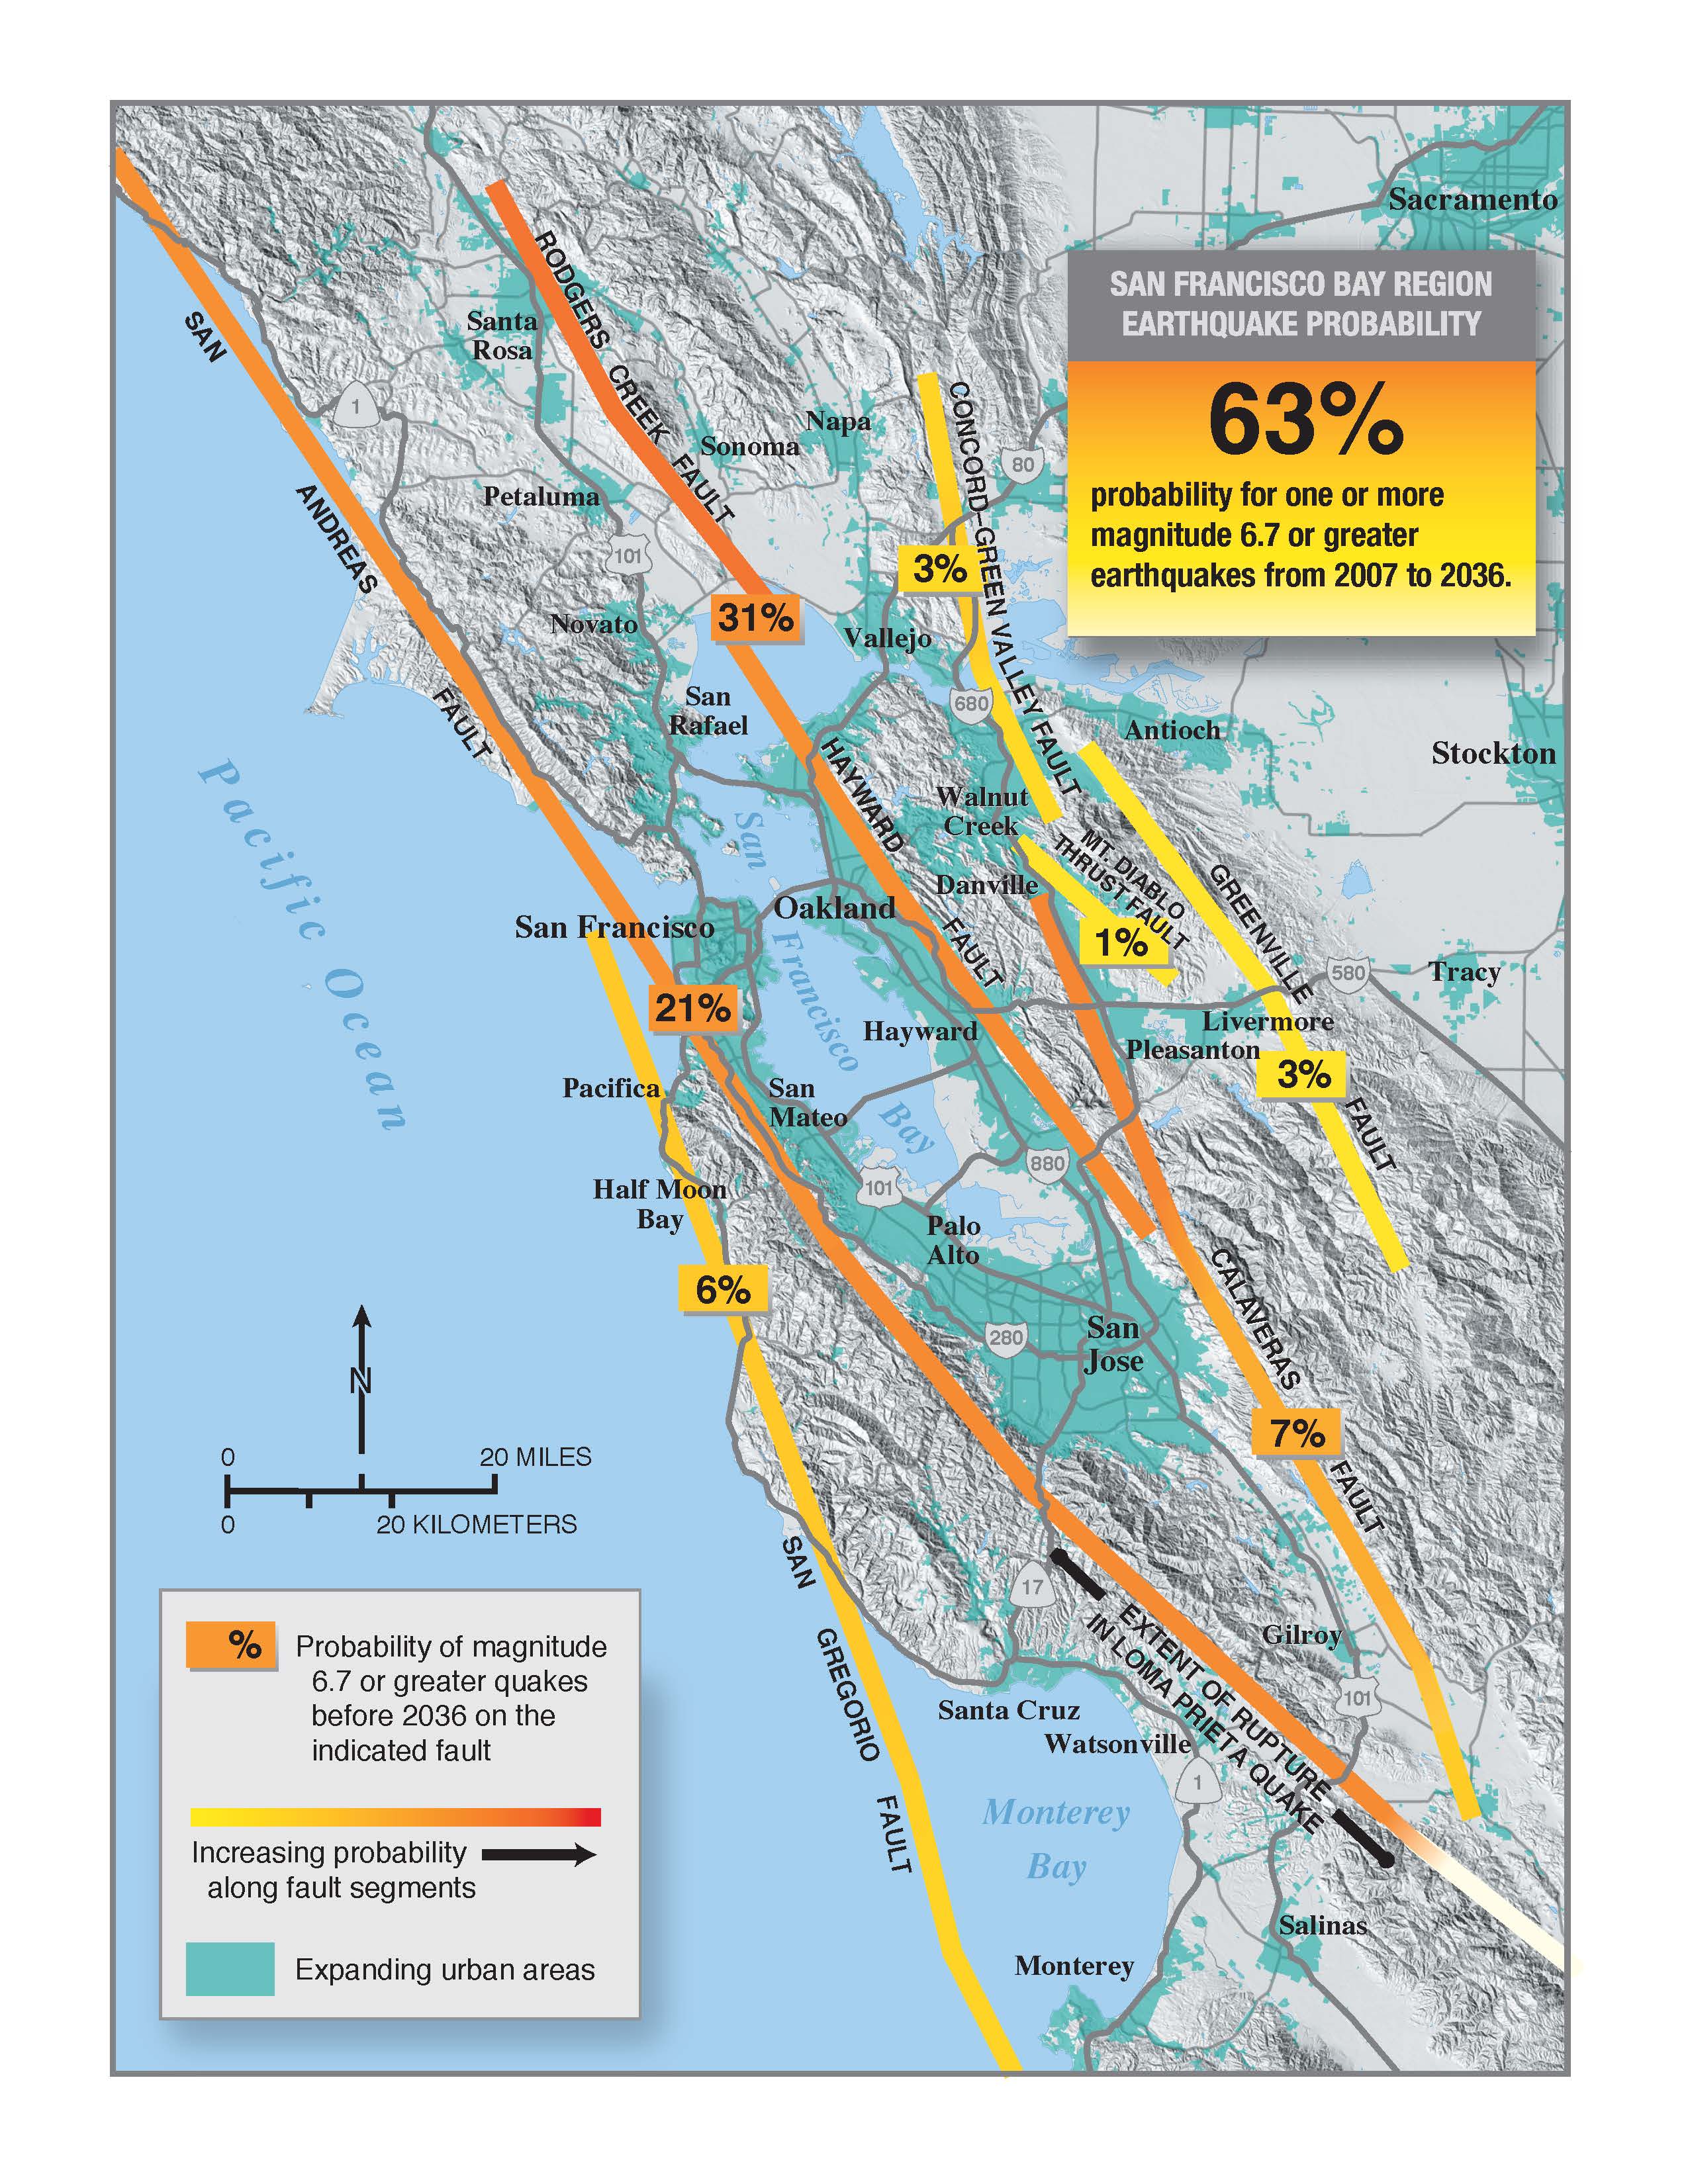
The USGS, have made estimates of the probabilities of earthquake ruptures on the major fault zones in the San Francisco Bay area. Here is a link to their web site. Below is a map showing the probabilities that they have assigned to each of these major fault zones. Note the low probability assigned to the Calaveras fault zone. Click on the map for a higher resolution (10 MB) pdf map.
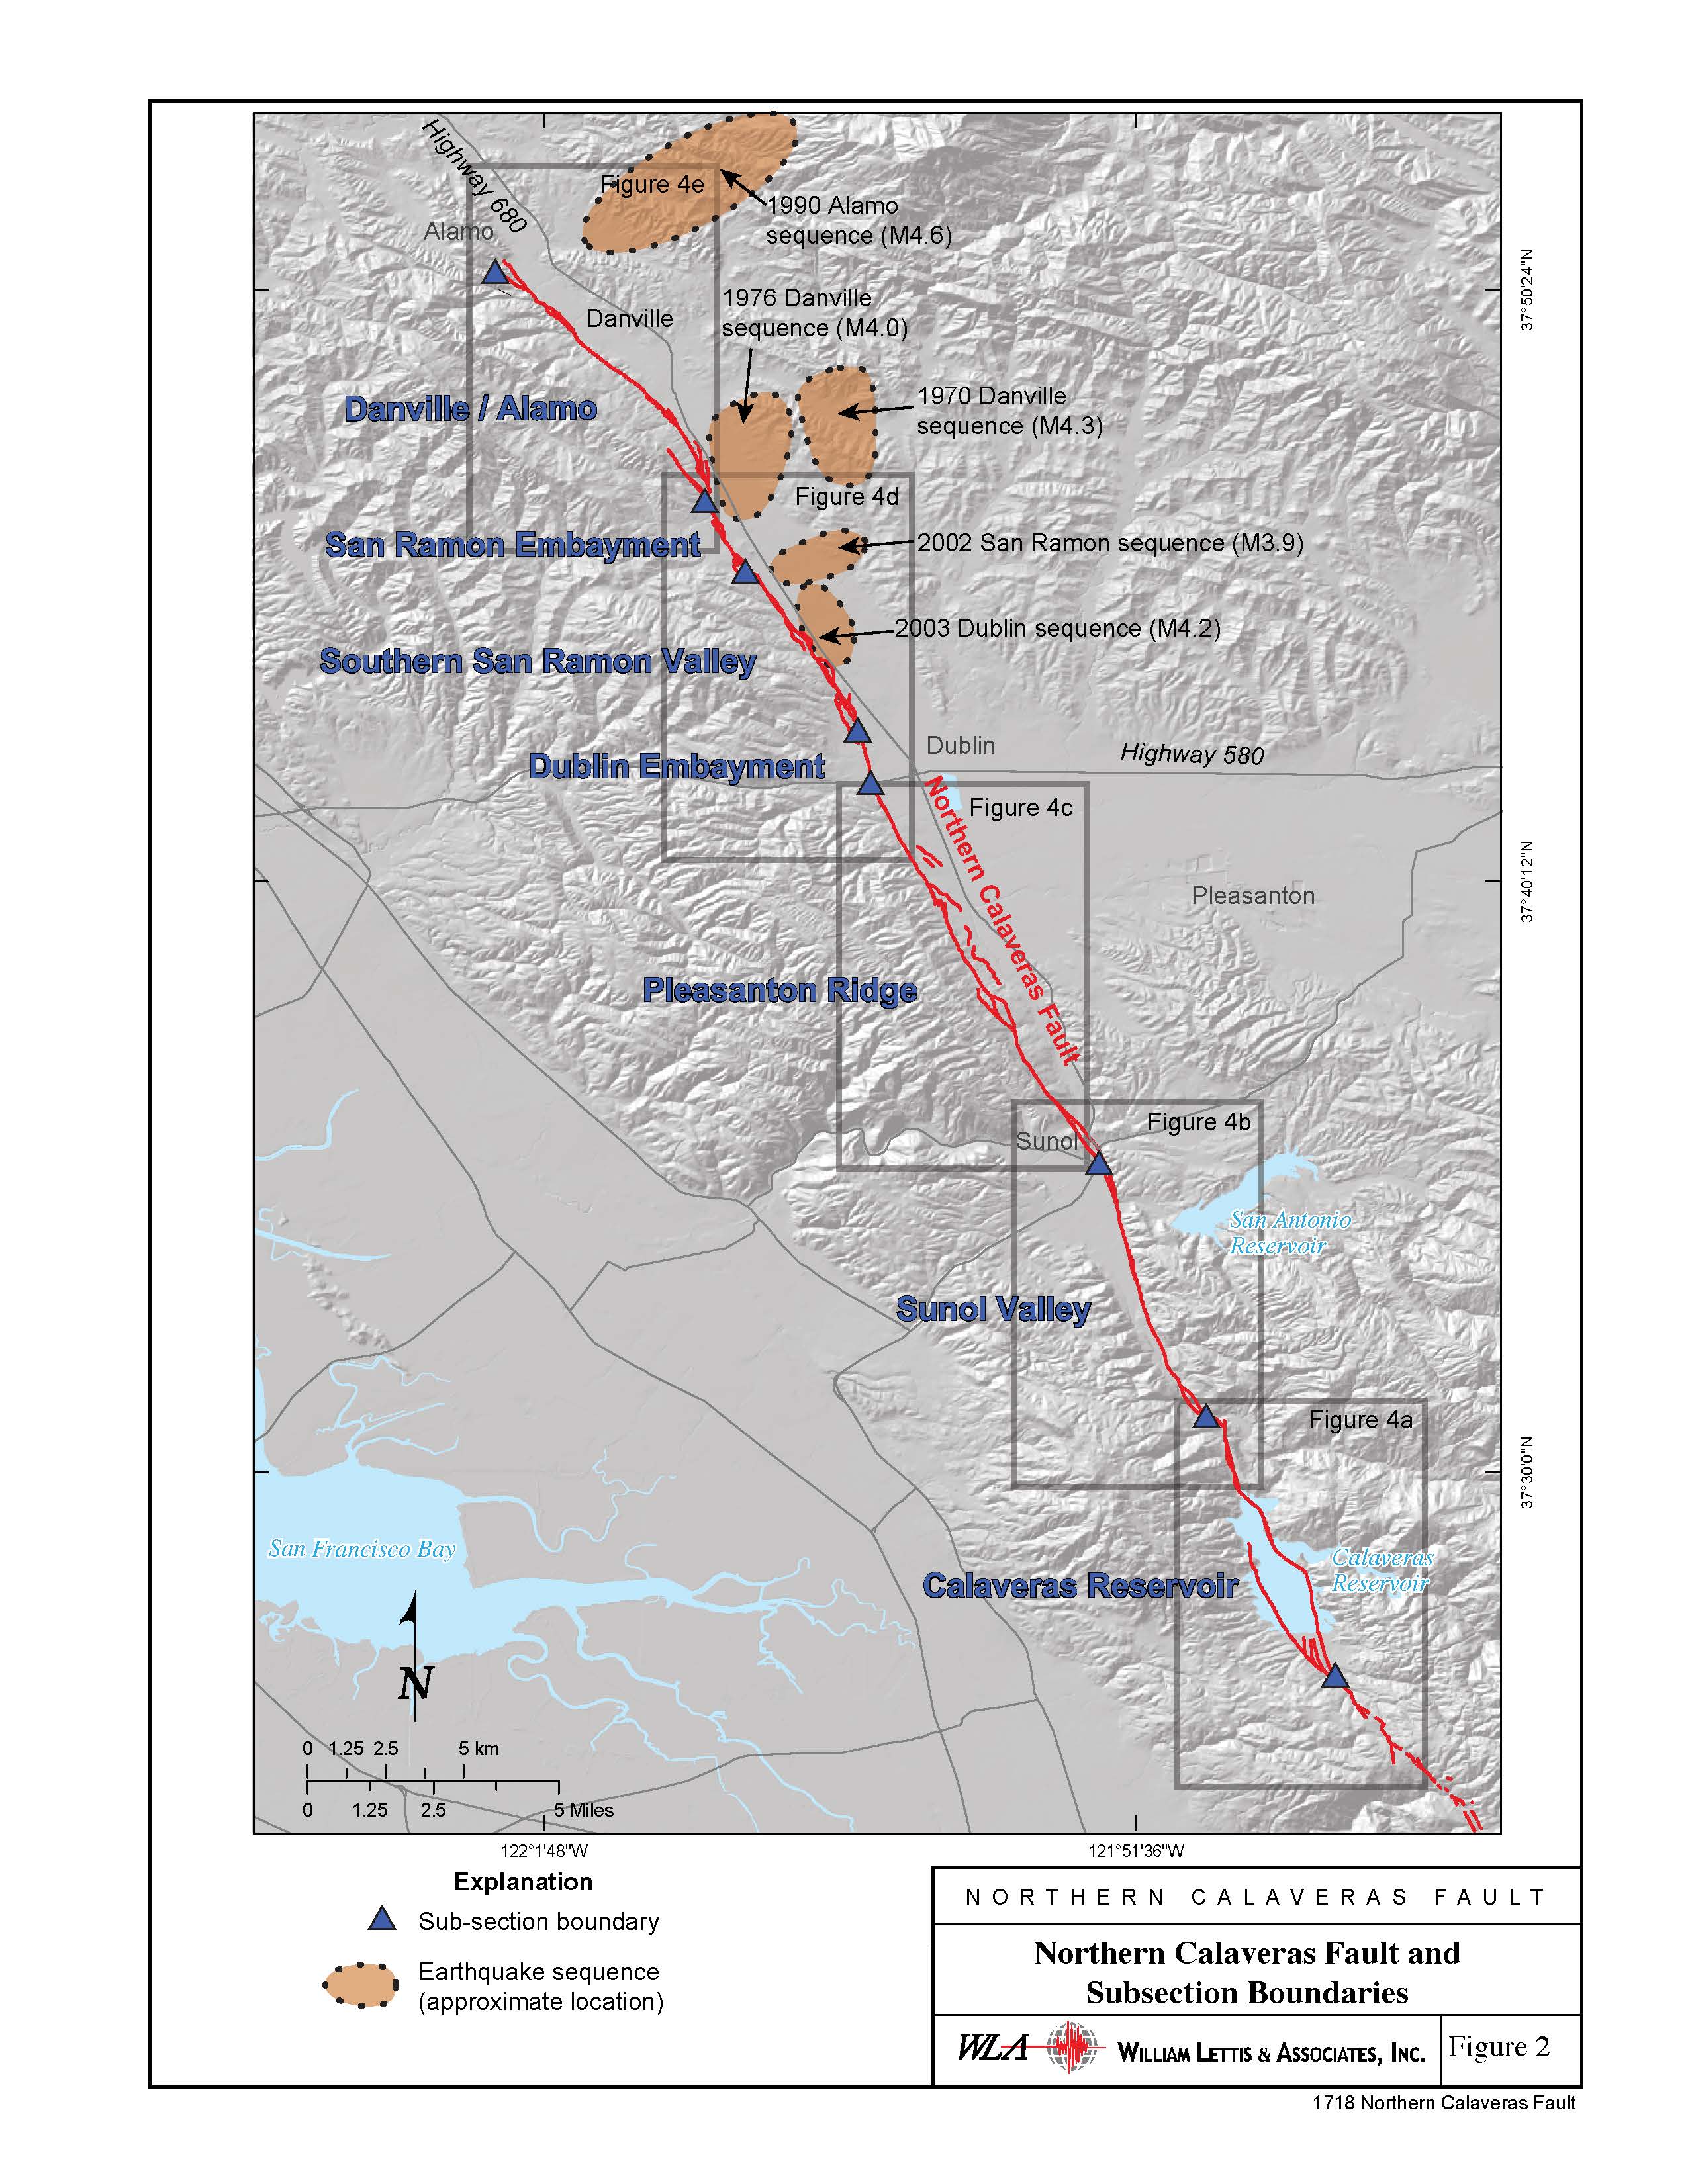
Keith I. Kelson and Sean T. Sundermann published a report based on their USGS National Earthquake Hazards Reduction Program funded study of the Calaveras fault. They report a couple swarms possibly associated with the Pleasanton fault zone. In 1976 there was a swarm with a M 4.0 largest earthquake and in 1970 there was a swarm with a M 4.3 as a largest earthquake. Then in 2002 there was a swarm with a M 3.9 as a largest earthquake.
Based on all these different sources of information, it would appear that this swarm is similar to swarms in 1970, 1976, and 2002. I do not expect either of the two possibilities, that I list at the top of this page, to occur. We cannot predict the future, but can only look for patterns based upon the past. This is sort of inverse uniformitarianism.
Felt em but good in Pleasant Hill. Surprised they were only 3.5ish.
http://earthquake.usgs.gov/regional/nca/simulations/
you are in a sedimentary basin, which tends to amplify ground motions…
there are some cool animations of ground motion simulation from the 1906 earthquake. if you watch the santa rosa one, you can see how, at the same epicentral distance from the earthquake, the ground motions in santa rosa (also a sed basin) are greater than in the adjacent mts).
http://earthquake.usgs.gov/regional/nca/simulations/1906/
in the first link above, you can see how santa rosa is red as is concord/pleasant hill…
My 3D software is on a computer in LA and I have been desperate to plots these little guys up to understand what the heck is going on!!! (Grr!) there have been several swarms since the 70s and thus seems like a continuation of the Dublin swarm. We shall see when I get my computer!
yeah, the usgs page places these on the calaveras… which is on the other side of the basin… does the calaveras dip to the east?
the depths to these eqs are really shallow,,, does not seem like these are on the calaveras (unless they call the pleasanton fault part of the calaveras fault zone)
what 3-D software do you use?