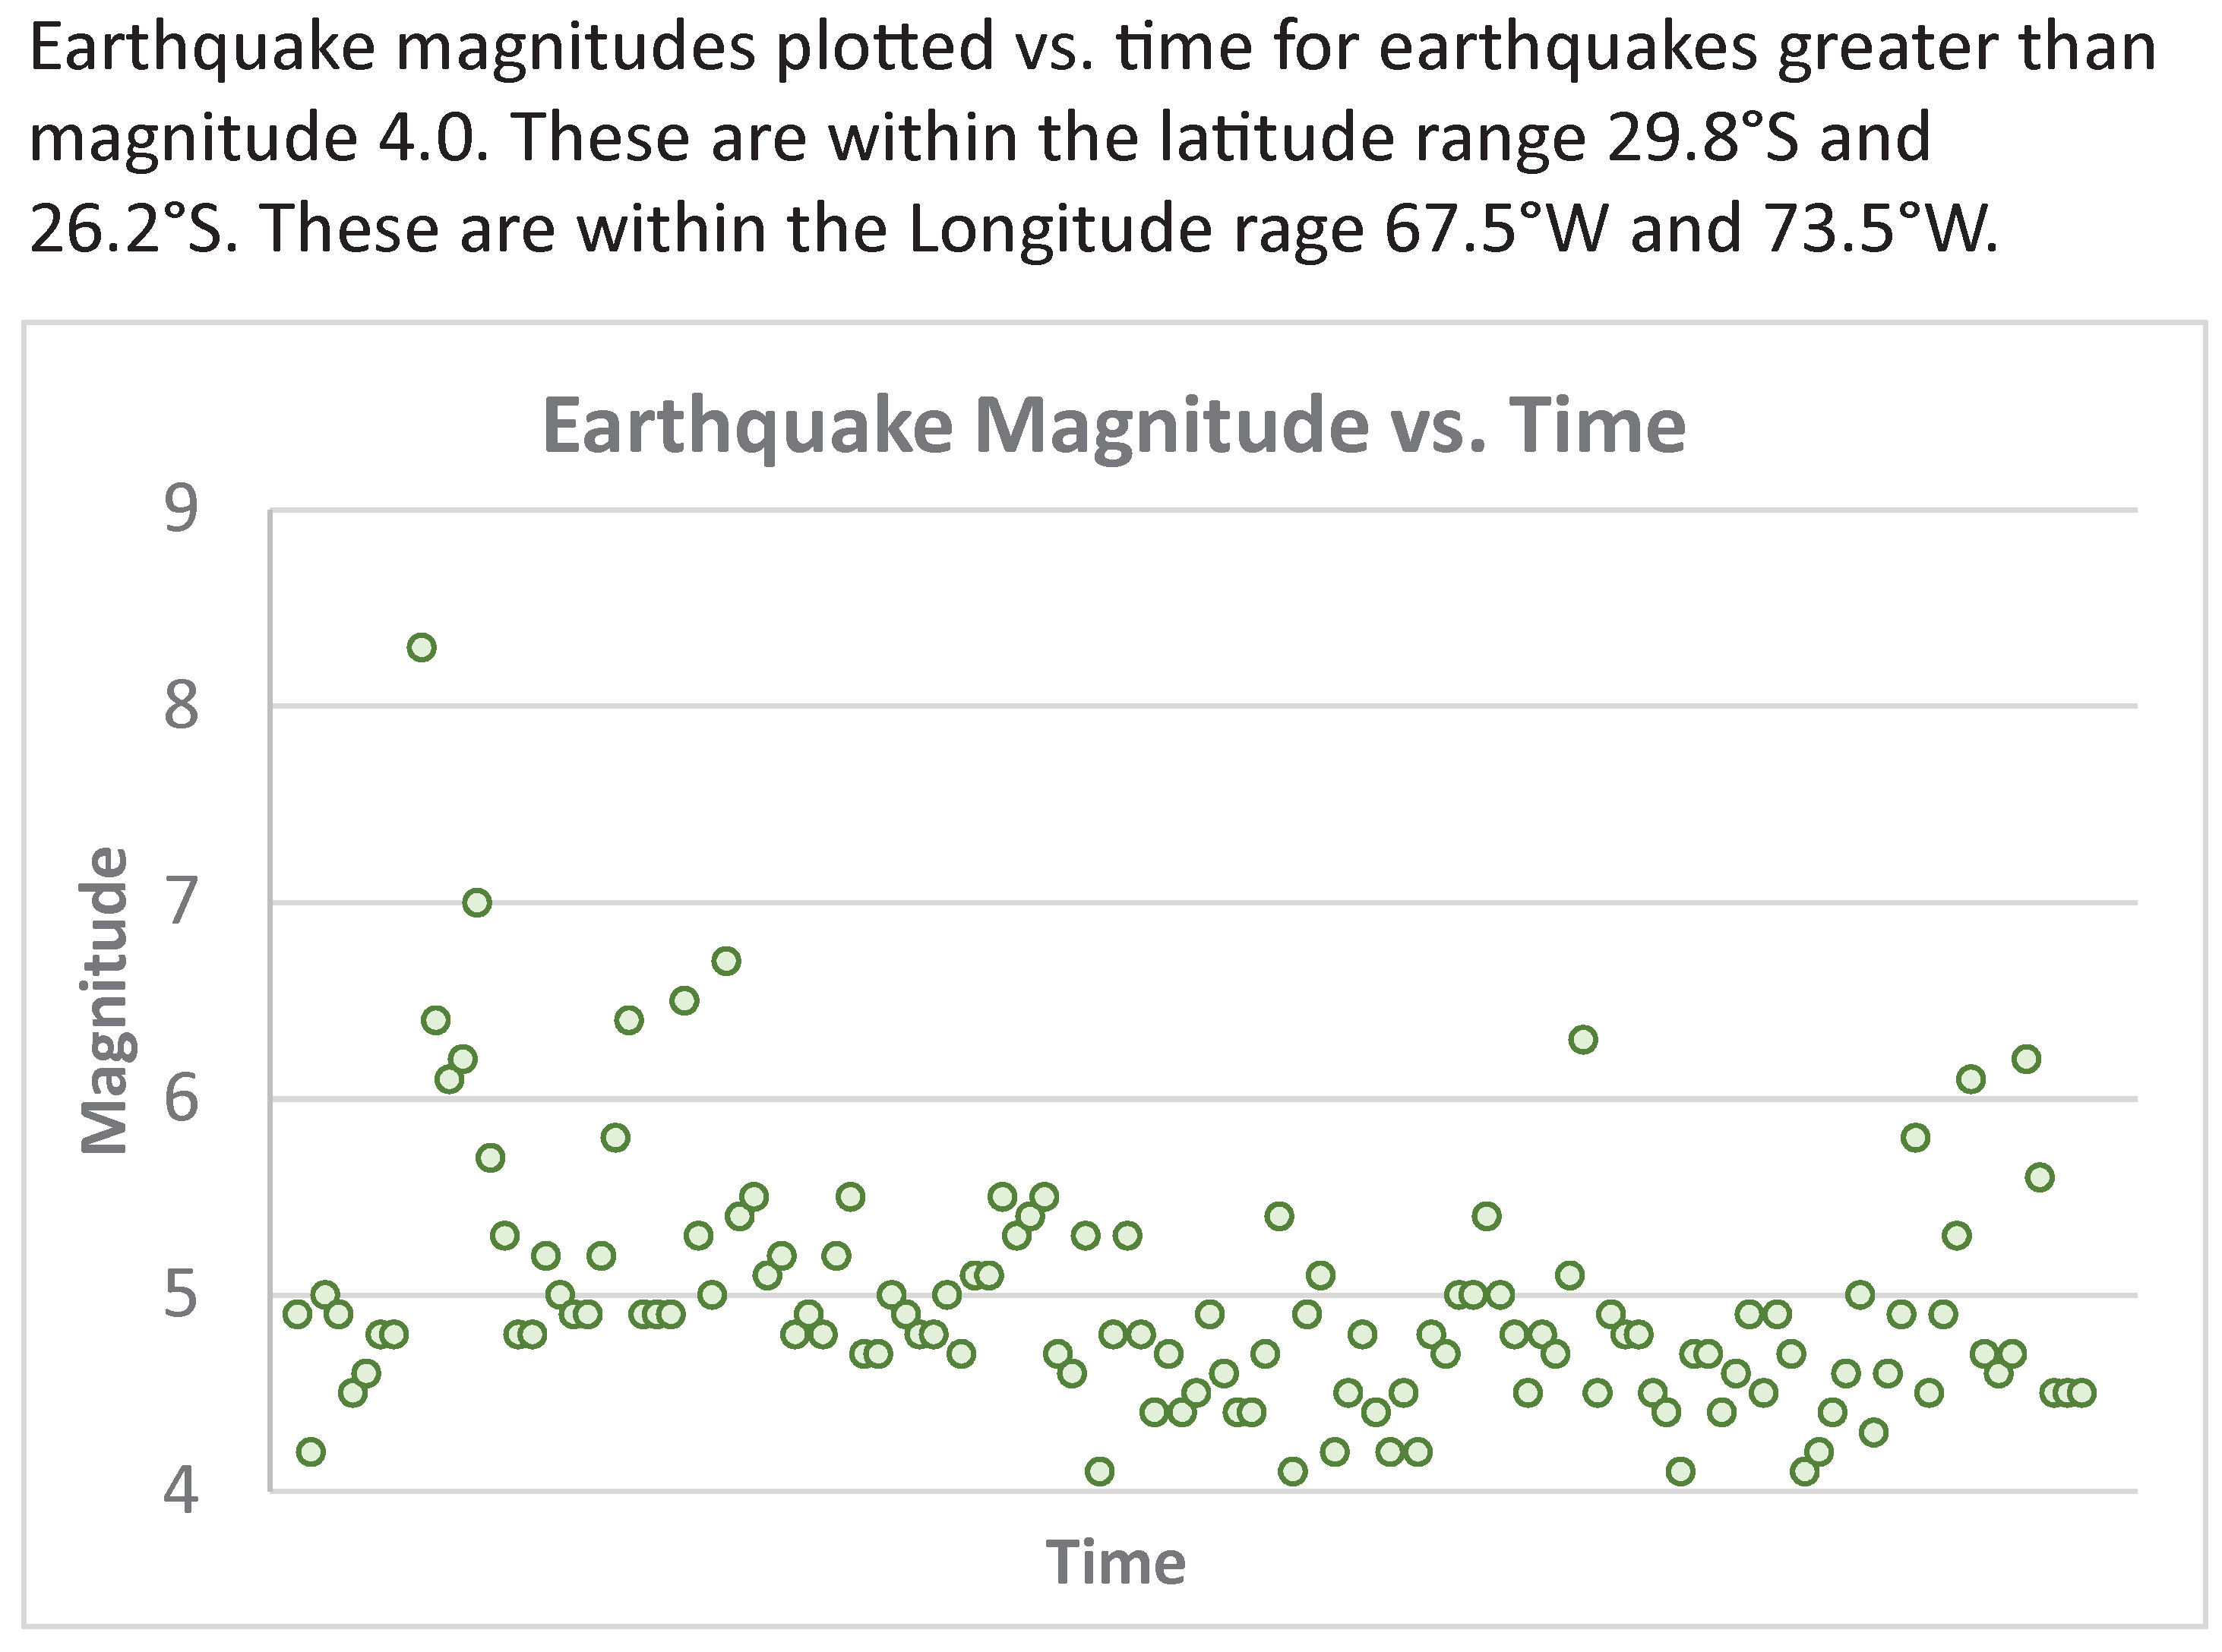
The aftershocks continue and will do so for weeks. Aftershocks from the 2011.03.27 Tohoku-Oki M 9.0 earthquake continue today. The decay rate for seismicity relates to characteristics of the fault called the b-value. The b-value can be determined/modeled in several ways, the rate of decay of earthquake magnitude with time is one way to estimate the b-value without using a model. In the map below, I plot the earthquakes in this region with time on the horizontal axis and magnitude on the horizontal axis.
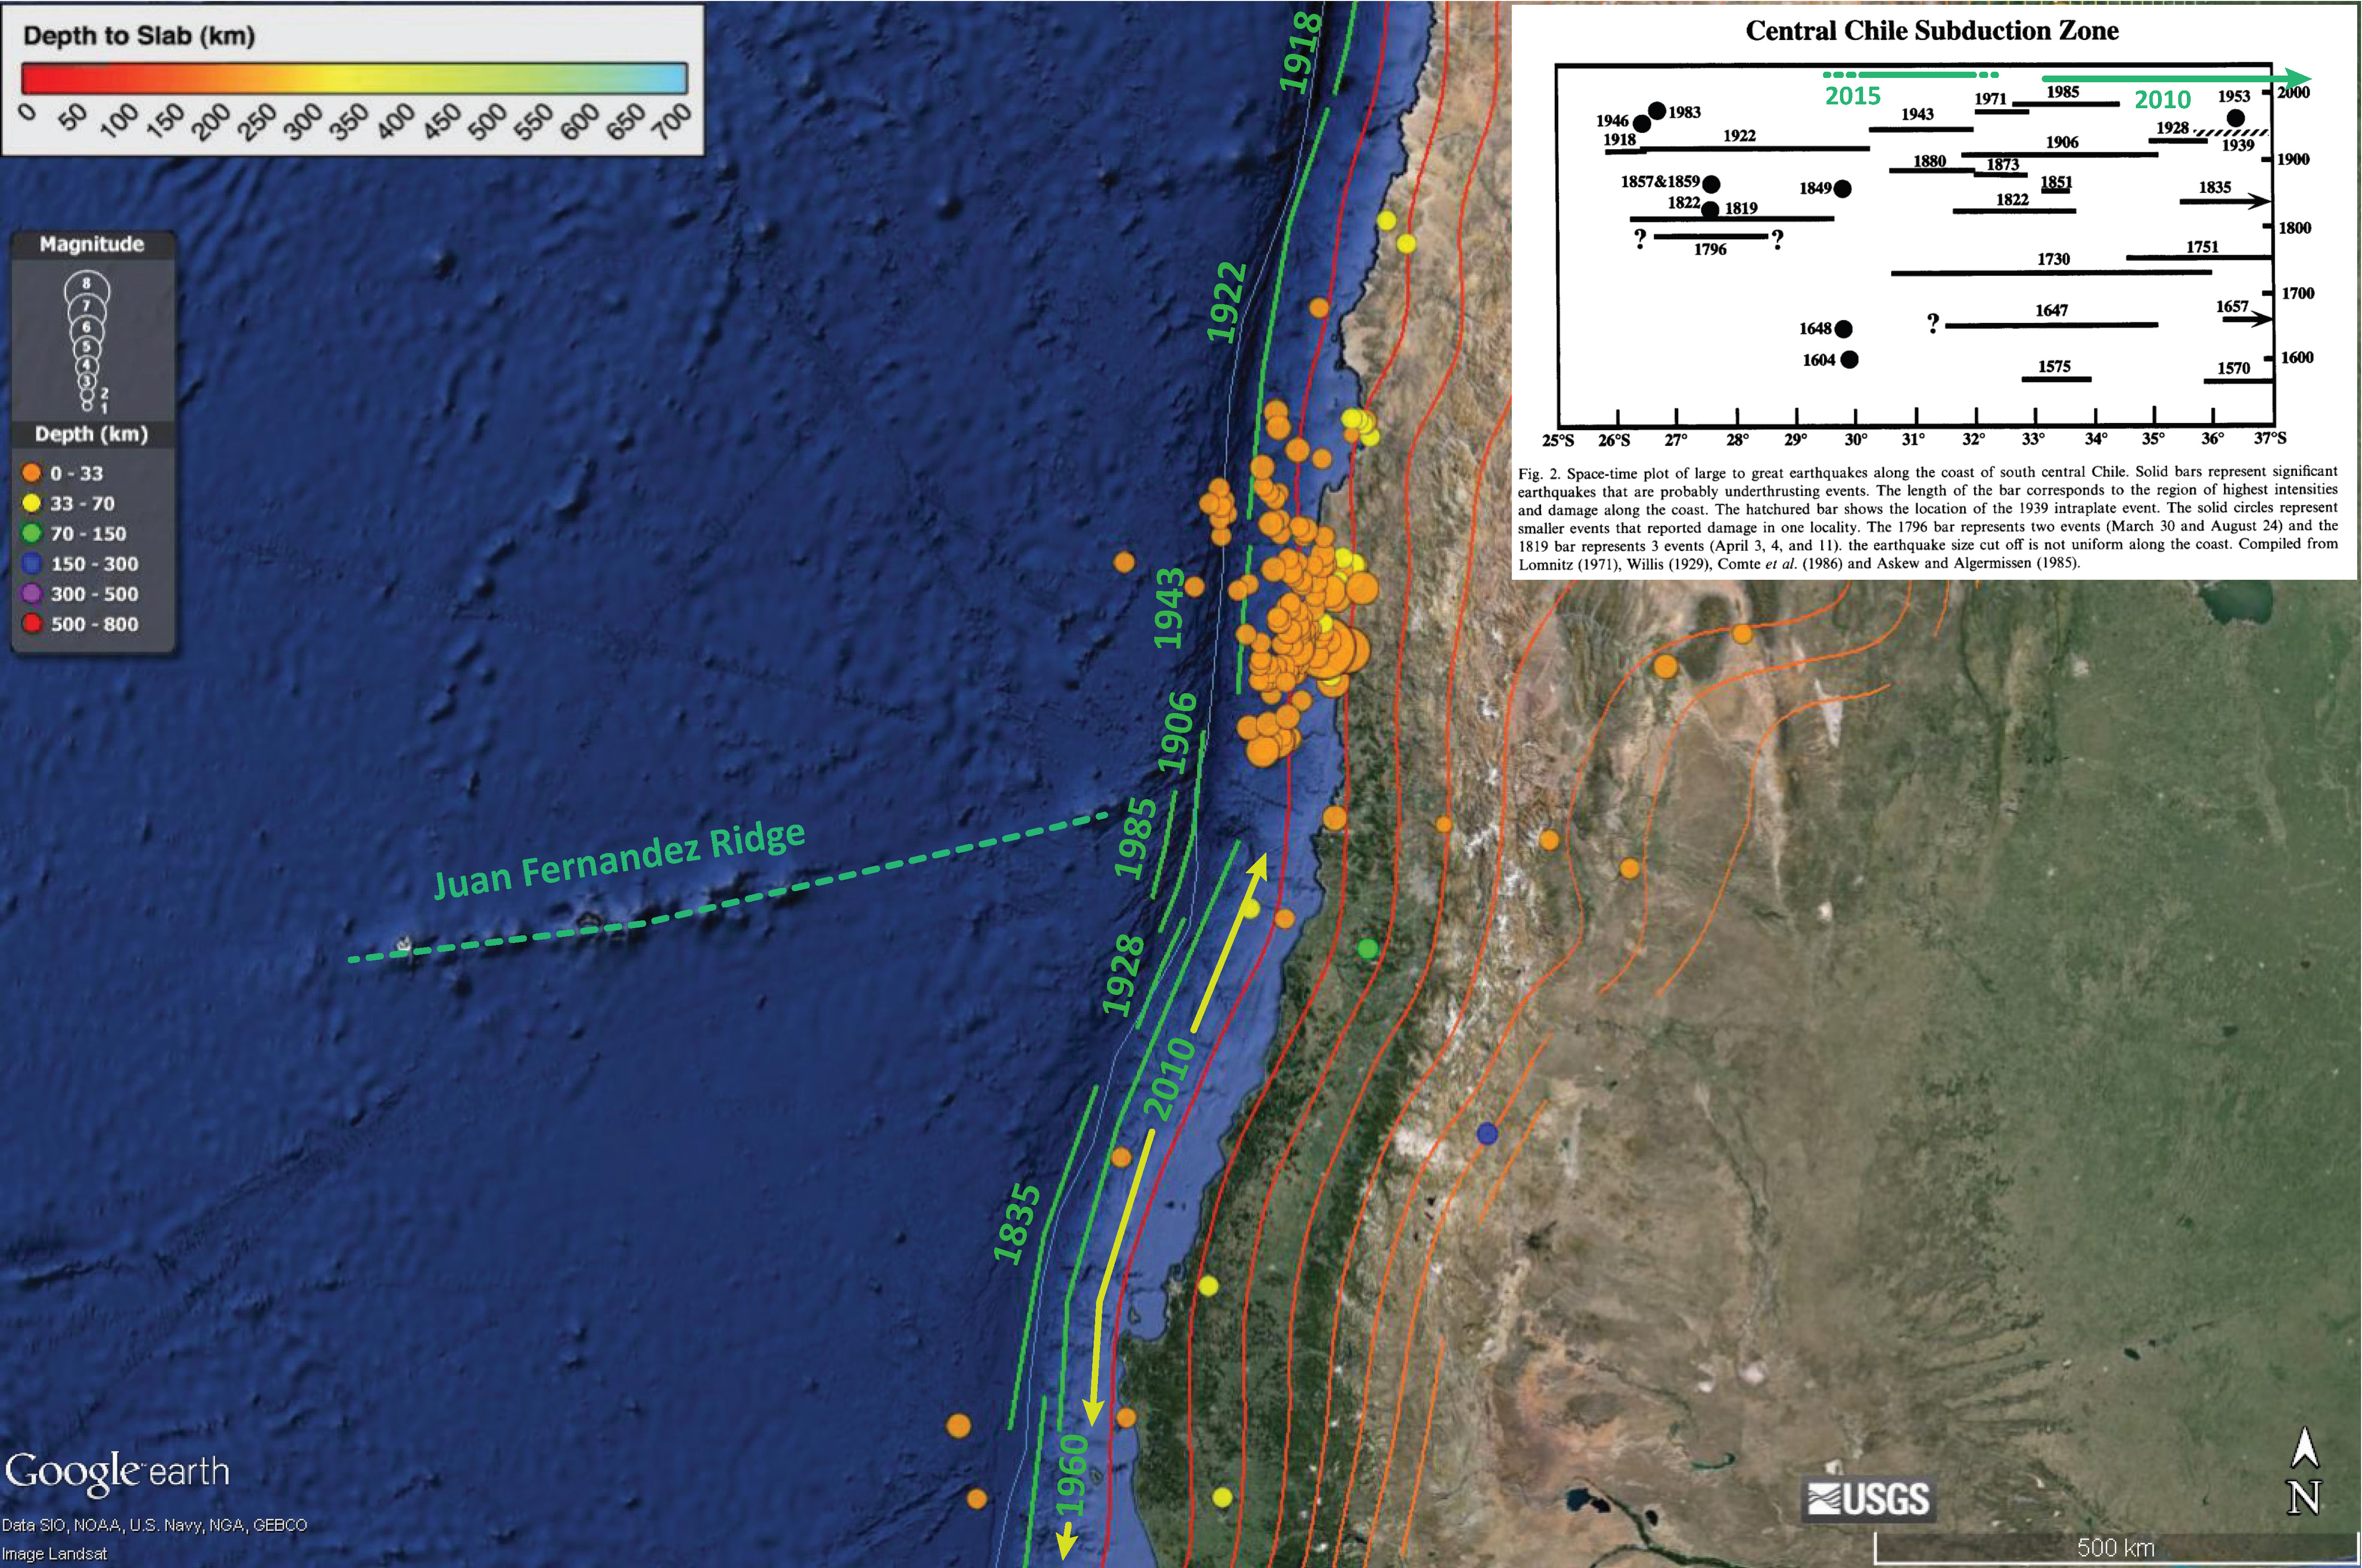
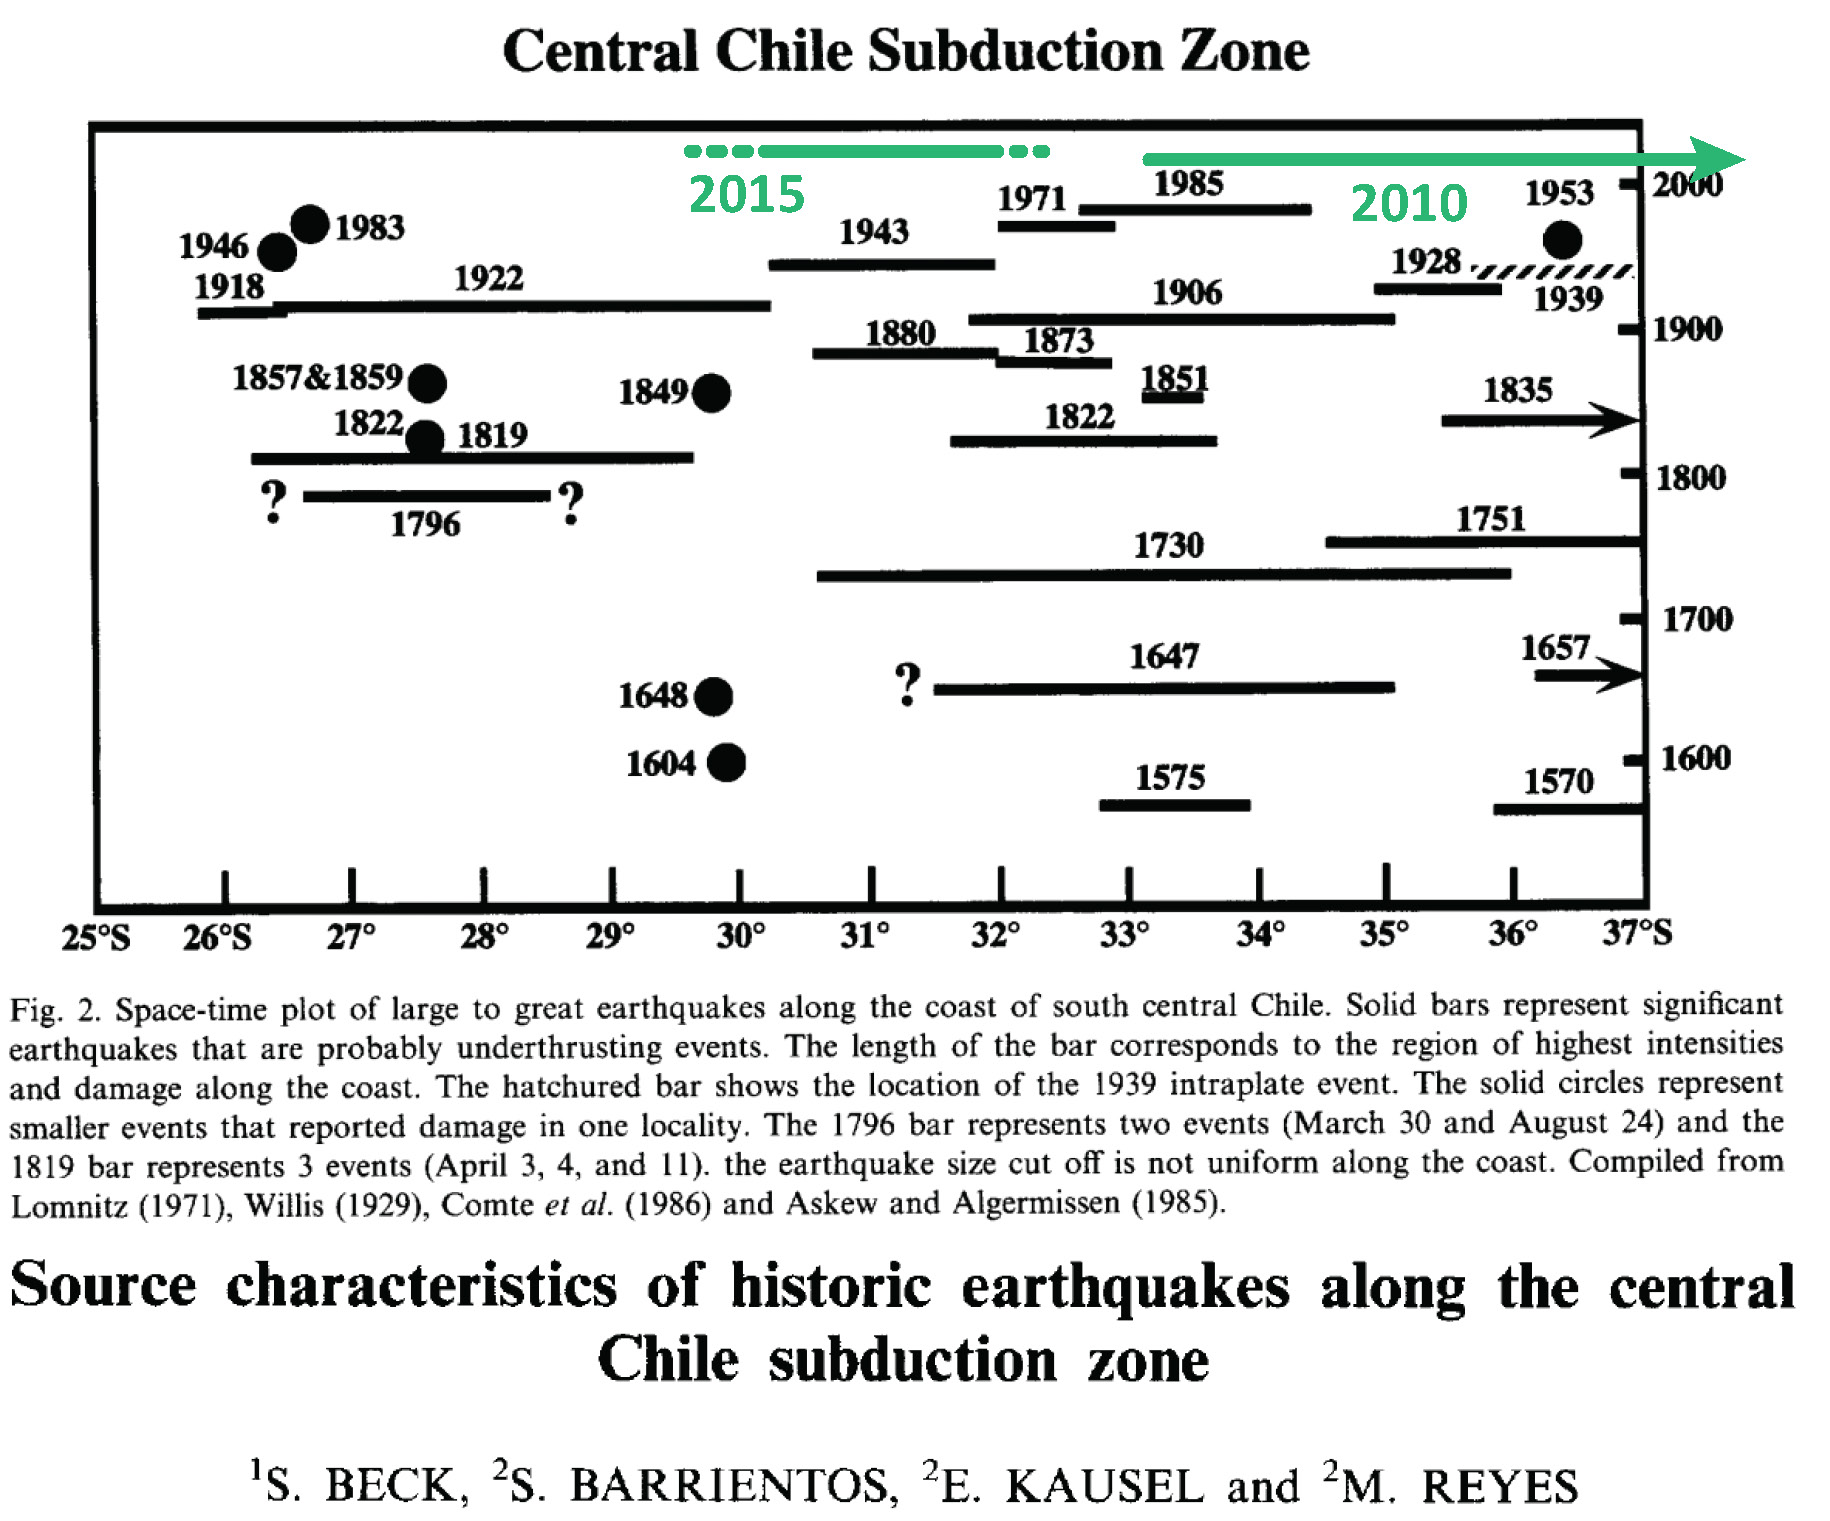
I also present Figure 2 from Beck et al. (1998 ) on the map, the space-time plot of historic and prehistoric earthquakes associated with the Chile subduction zone. I add a green line showing my interpretation for the strike length of this M 8.3 earthquake. Originally it appeared to match the 1943 and 1880 earthquakes, though it appears to extend further along strike. The 1922 and 1880 strike lengths are not well constrained, so this 2015 earthquake may indeed be slipping the same patch of this part of the subduction zone. Indeed, Juan Fernandez Ridge may be a structural boundary that may cause segmentation in this part of the subduction zone. If it does, it does not do so every time, as evidenced by the strike-length of the 1730 AD and 1647 AD earthquakes.
-
Here is more about the Juan Fernandez Ridge:
- von Huene et al. (1997), Tectonic control of the subducting Juan Fernandez Ridge on the Andean margin near Valparaiso, Chile
- and Rodrigo and Lara (2014) Plate tectonics and the origin of the Juan Fernández Ridge: analysis of bathymetry and magnetic patterns.
- These are the posts that I have put together regarding the 2015.09.16 earthquake and tsunami.
- 2015.09.16 First Post
- 2015.09.16 First Update
- 2015.09.17 Tsunami Observations
- 2015.09.17 Second Update
- 2015.09.18 Chile Historic Tsunami Comparisons
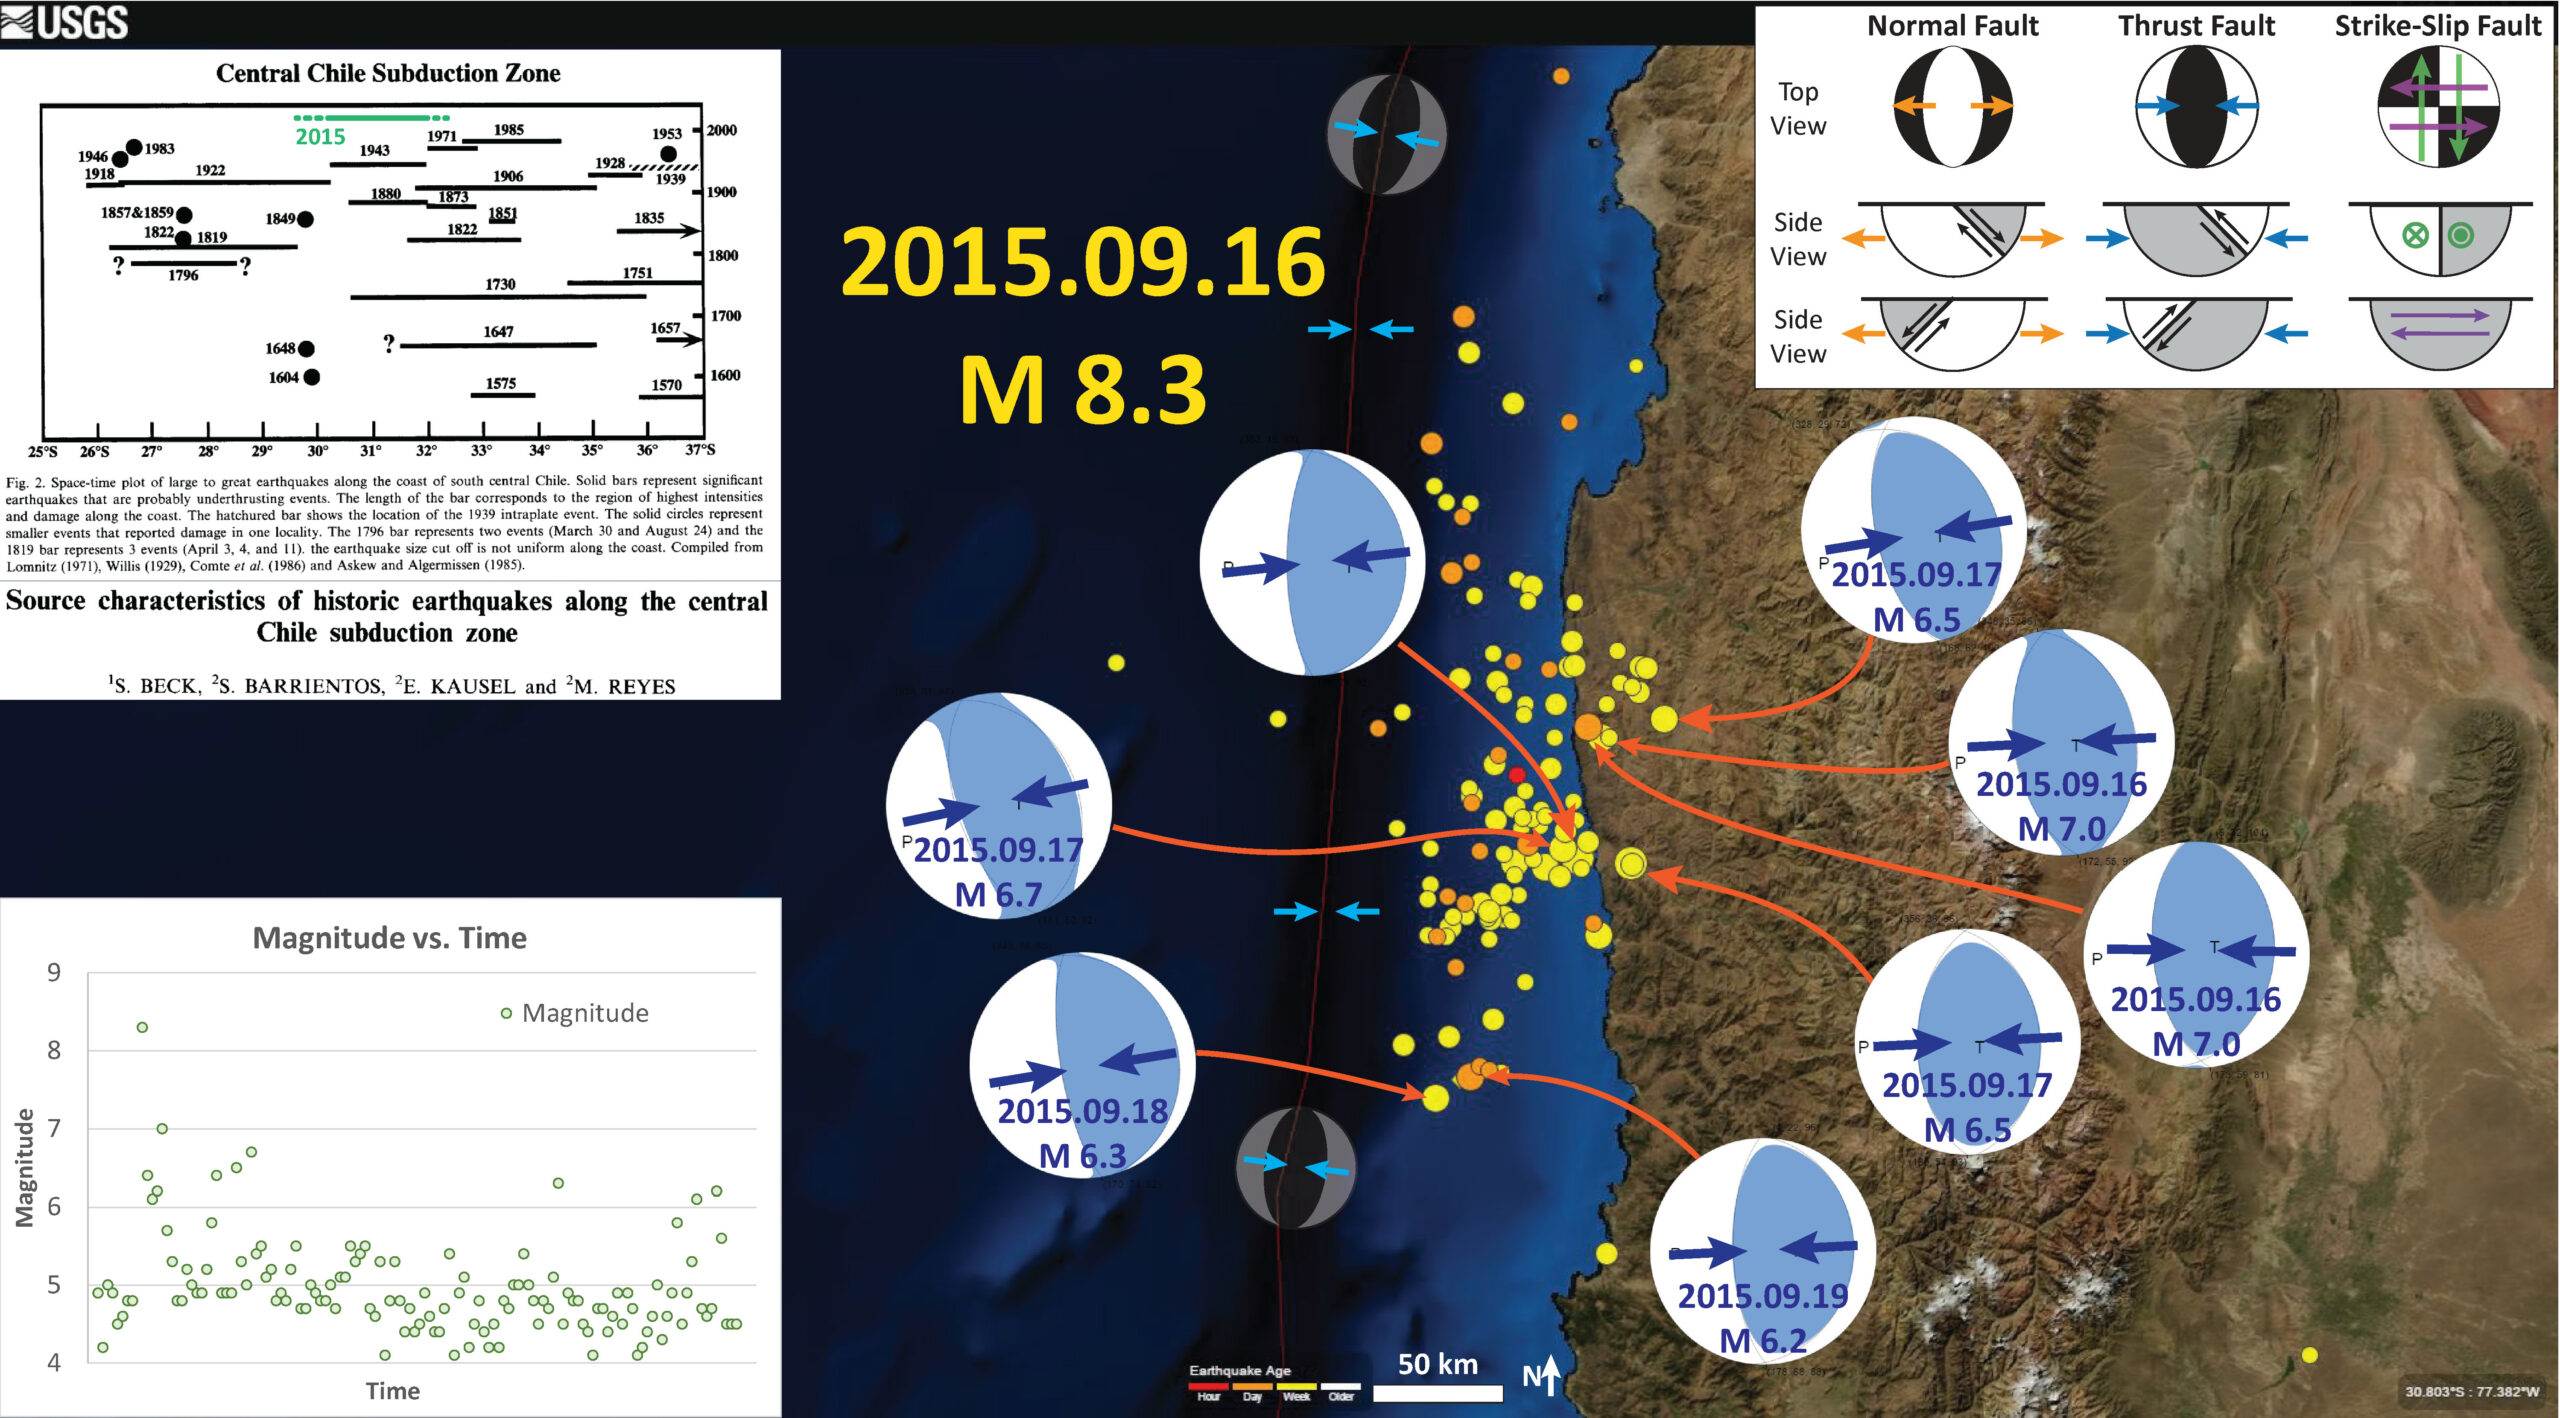
Here is a map with updated epicenters from this morning. I have also included more moment tensors. To date, these are all compressional earthquakes. However, there are a few earthquakes to the west of the the subduction zone fault. I suspect that these might be extensional or strike-slip. In many cases, as the downgoing plate in a subduction zone reaches the trench, it flexes downwards. This causes tension in the upper part of the plate, so extensional (normal) faults form, sometimes reactivating existing faults. These reactivated faults could also rupture as a strike slip fault, depending upon the fault orientation and strain field. So far, these earthquakes to the west of the subduction zone fault are too small for the USGS to generate a moment tensor. Note the location of the Juan Fernandez Ridge.

- Here is a list of the earthquakes for which I have plotted the moment tensors. I provide the link to the USGS website for each earthquake.
- 2015/09/16 M 8.3
- 2015/09/16 M 6.4
- 2015/09/16 M 7.0
- 2015/09/17 M 6.4
- 2015/09/17 M 6.5
- 2015/09/17 M 6.7
- 2015/09/18 M 6.3
- 2015/09/19 M 6.1
- 2015/09/19 M 6.2
This map shows the epicenters from the past week and the strike length of some historic and prehistoric earthquakes. I also include here the space-time diagram from Beck et al. (1998 ). The slab contours are also plotted (the depth, in km, to the subduction zone fault; Hayes et al., 2012).
This is the magnitude-time plot that is embedded in the map above.
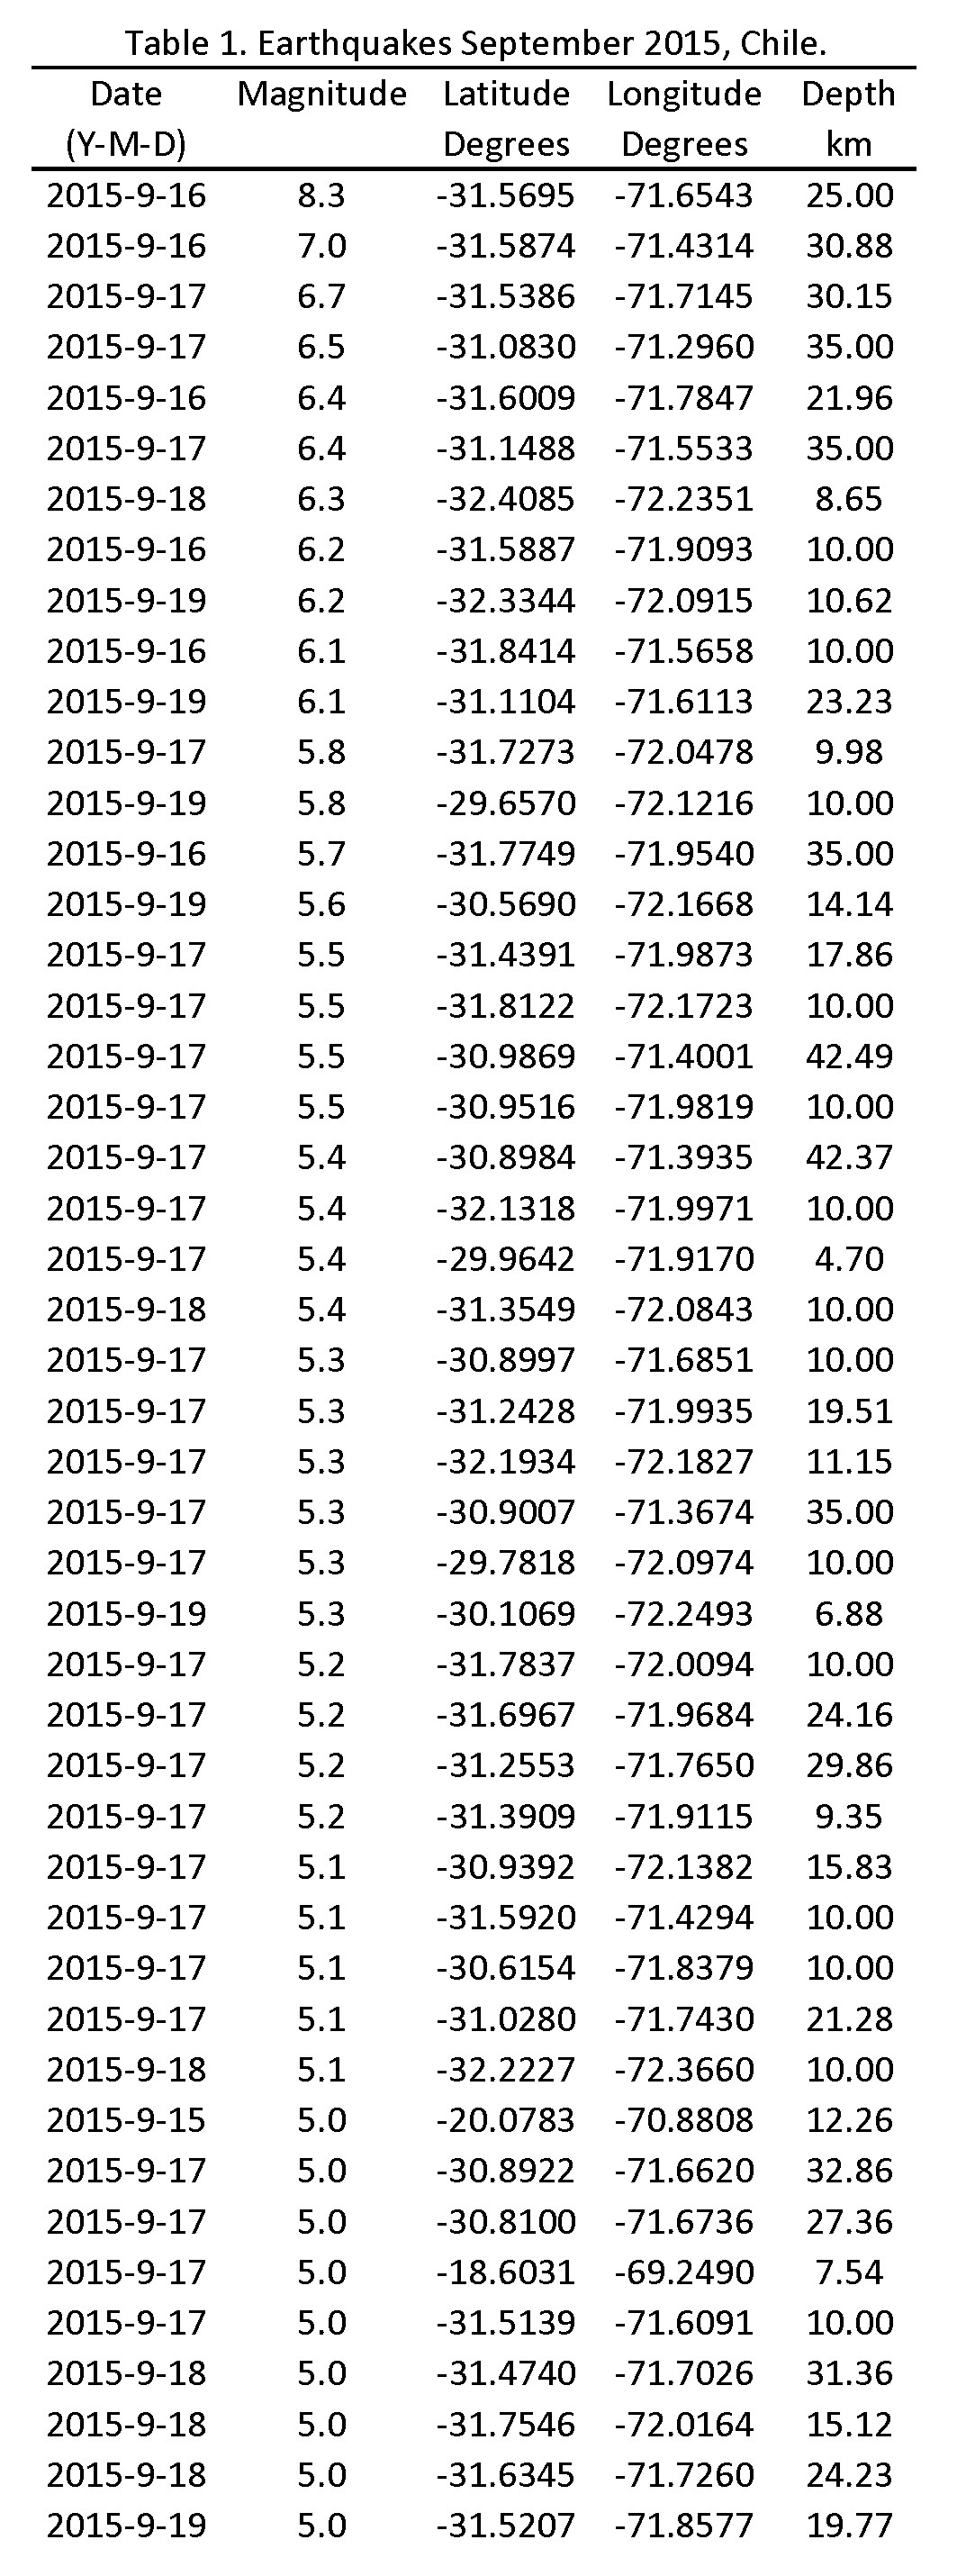
Here is a table of the earthquakes with M > 5 that are in the plot on the map. This spreadsheet includes all of the earthquakes for the past week.
Here is the updated Beck et al. (1998 ) space-time figure.
References:
- Beck, S., Barientos, S., Kausel, E., and Reyes, M., 1998. Source Characteristics of Historic Earthquakes along the Central Chile Subduction Zone in Journal of South American Earth Sciences, v. 11, no. 2., p. 115-129.
- Hayes, G.P., Wald, D.J., and Johnson, R.L., 2012. Slab1.0: A three-dimensional model of global subduction zone geometries in, J. Geophys. Res., 117, B01302, doi:10.1029/2011JB008524
- Rodrigo, C. and Lara, L.E., 2014. Plate tectonics and the origin of the Juan Fernández Ridge: analysis of bathymetry and magnetic patterns in Lat. Am. J. Aquat. Res, v. 42, no. 4, p. 907-917
- von Huene, R. et al., 1997. Tectonic control of the subducting Juan Fernandez Ridge on the Andean margin near Valparaiso, Chile in Tectonics, v. 16, no. 3, p. 474-488.
5 thoughts on “2015.09.16 Chile Update #3”