[Additional information is posted in a supplementary post here.]
Well, I was in the middle of a Quaternary Stratigraphy lab when this hit, so it took a while to get home. My delay pales in comparison to the probably large number of casualties from this earthquake. The mainshock was a M = 8.3 Great Earthquake and here is the USGS web page for this earthquake. “Great” earthquakes are earthquakes of magnitude larger than M = 8. This earthquake is in a seismic gap north of a 2010 earthquake. There was a swarm of earthquakes in this region in March of 2015.
-
Prior to that, there was some activity in 2014 also. I put together some material for the 2014 earthquake in the past:
- Interseismic Fault Coupling: the 2014 March Northern Chile Swarm 3/27/14: There were some earthquakes in this region of the subduction zone, so I started posting information about historic earthquakes there.
- M 8.2 earthquake in northern Chile 4/1/14: Here is the main page. There are a couple excellent animations from IRIS on this page!!!
- Tsunamis in the region of the M 8.2 northern Chile earthquake 4/1/14
- M 8.2 northern Chile tsunamis recorded at tide gages 4/2/14
- large magnitude aftershock in northern Chile 4/2/14: the second patch that slipped
- all right, another M 6.2 aftershock in Chile 4/2/14: another large aftershock in the 2014 swarm
- northern Chile M 8.2 earthquake series animations 4/3/14: I put this together to show how this swarm slipped two distinct patches (sub-faults in modeling parlance, asperities in Aki parlance)
- M 6.7 earthquake swarm in northern Chile! 2014/03/06: This is the swarm that started it all.
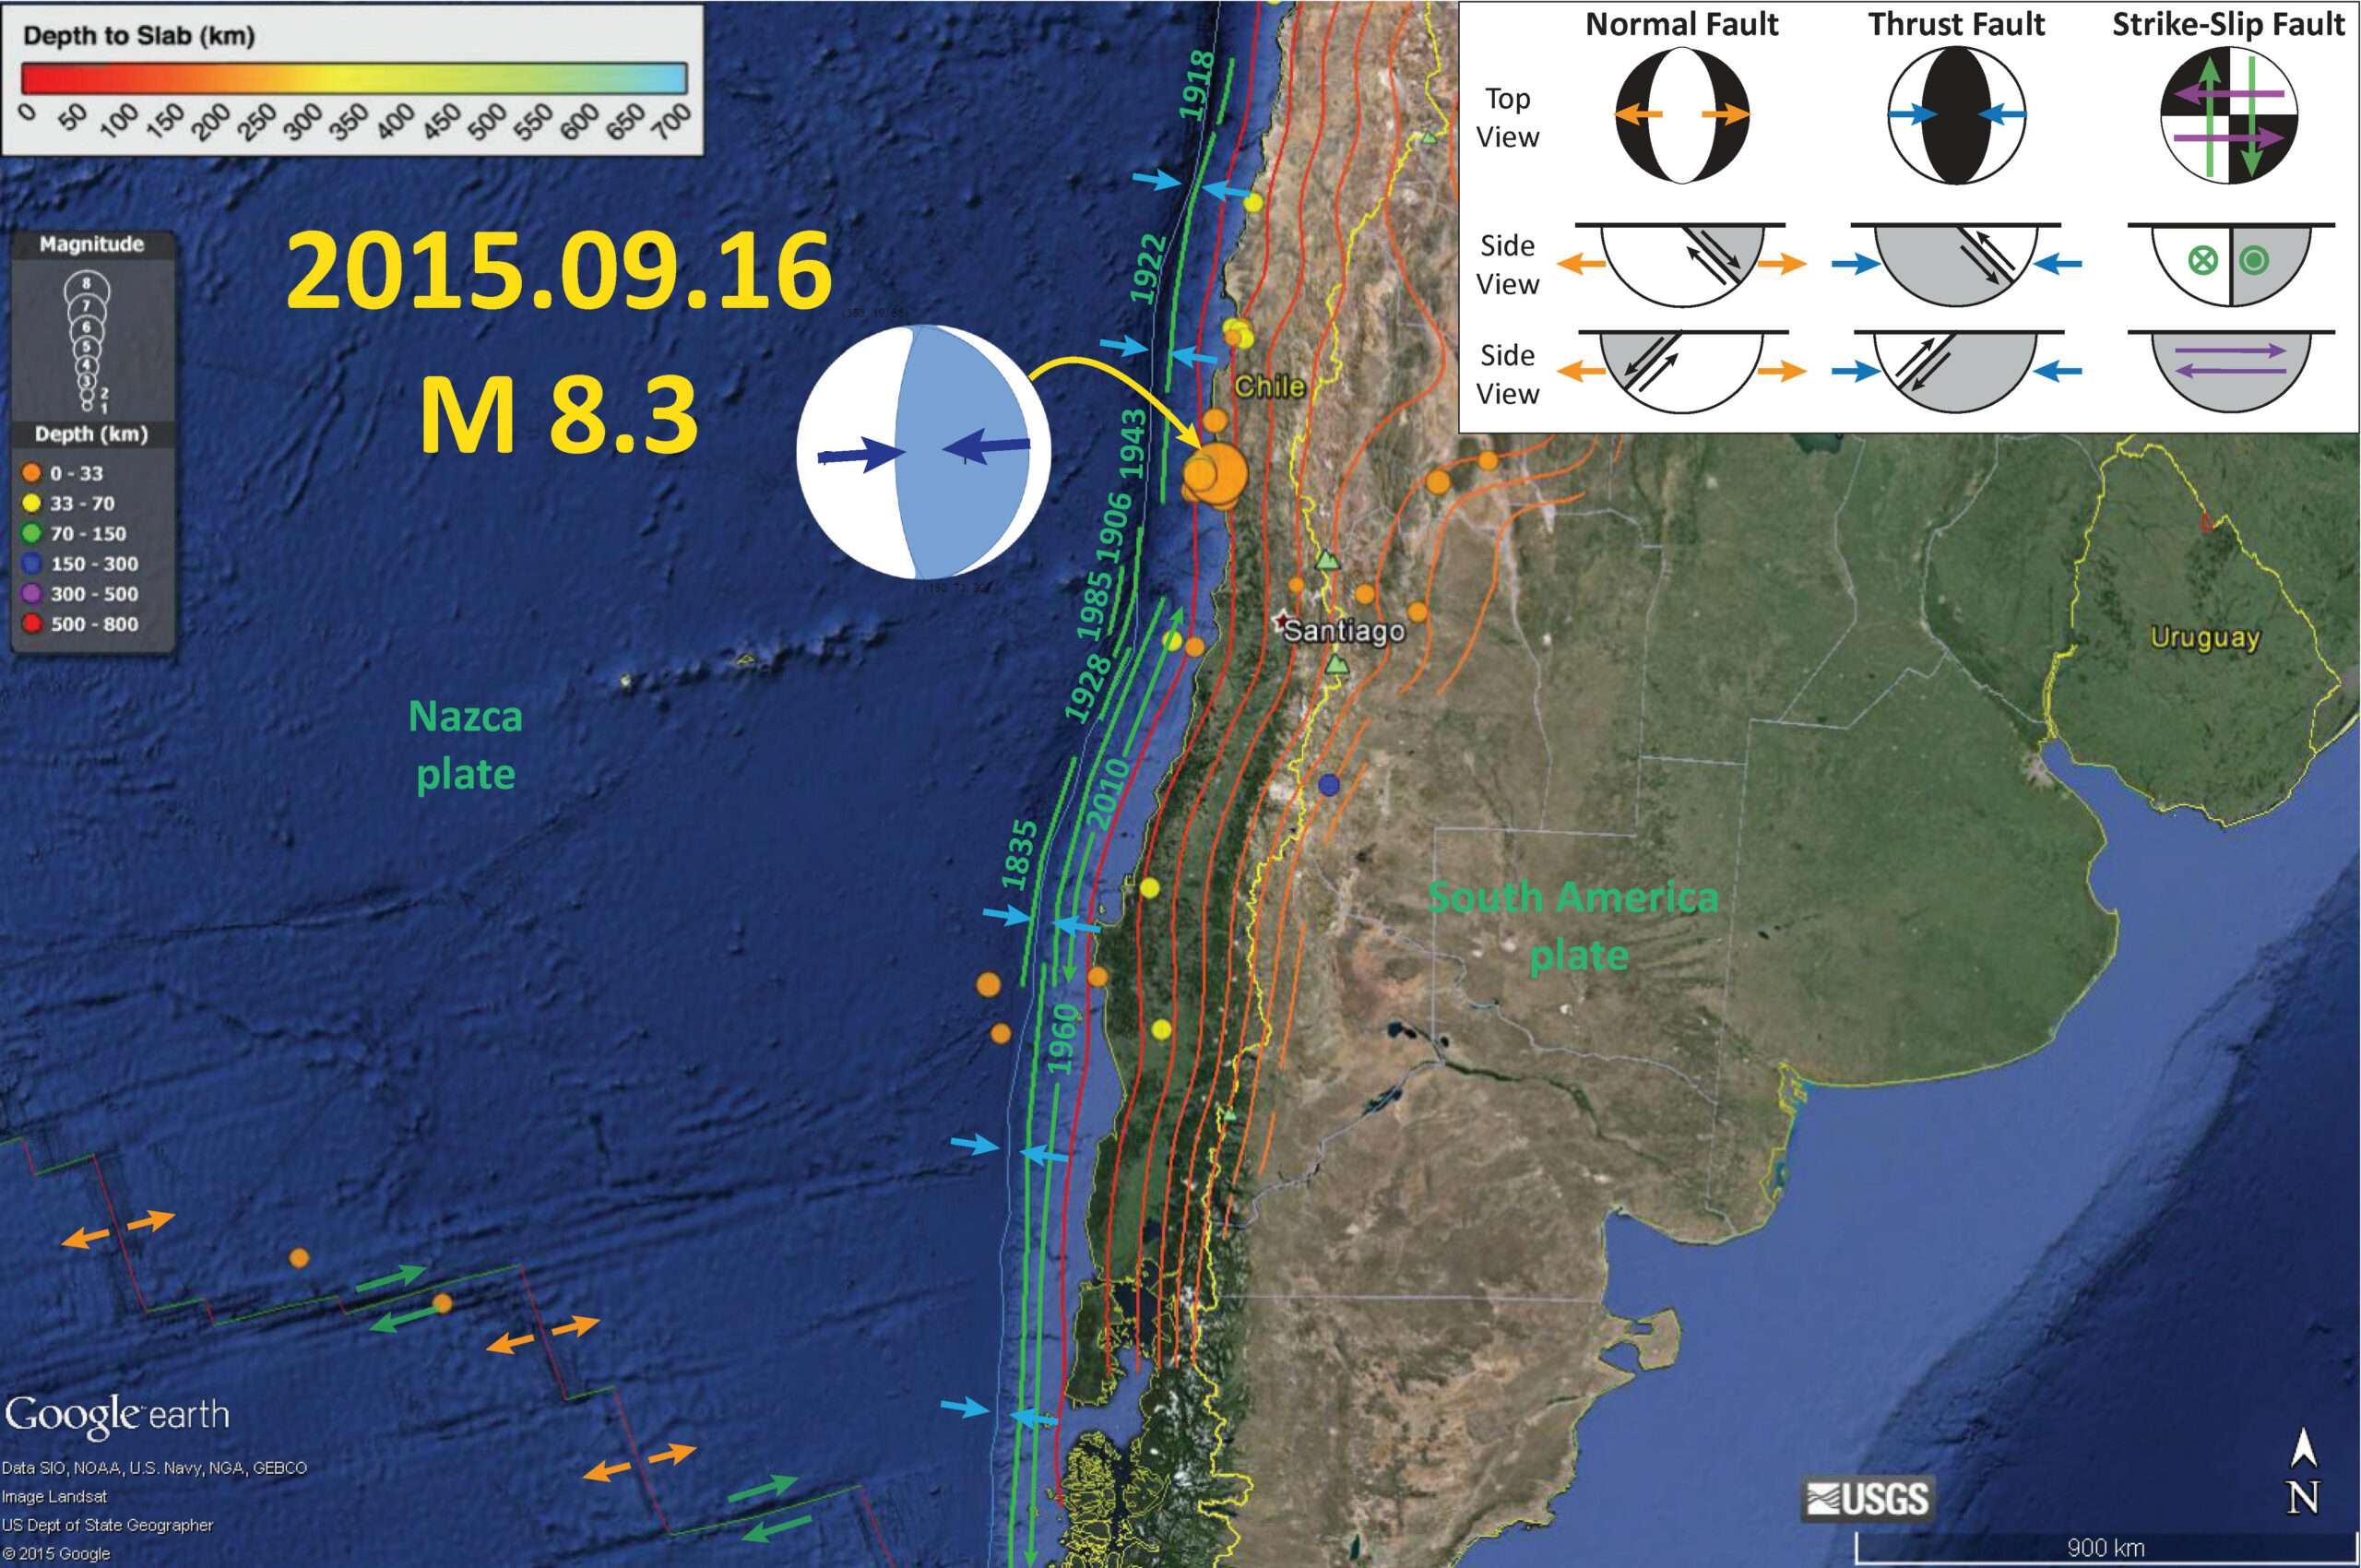
Below is a map that shows the seismicity from the last few hours, along with the slab contours (Hayes et al., 2012). I placed the moment tensor from the M 8.3 Great Earthquake. I placed the general along-strike distance for older historic earthquakes in green (and labeled their years). The largest earthquake ever recorded, the Mw = 9.5 Chile earthquake, had a slip patch that extends from the south of the map to just south of the 2010 earthquake swarm. The 2014 earthquake swarm epicenters are plotted with a green arrow.
I placed a moment tensor / focal mechanism legend in the upper right corner of the map. There is more material from the USGS web sites about moment tensors and focal mechanisms (the beach ball symbols). Both moment tensors and focal mechanisms are solutions to seismologic data that reveal two possible interpretations for fault orientation and sense of motion. One must use other information, like the regional tectonics, to interpret which of the two possibilities is more likely.
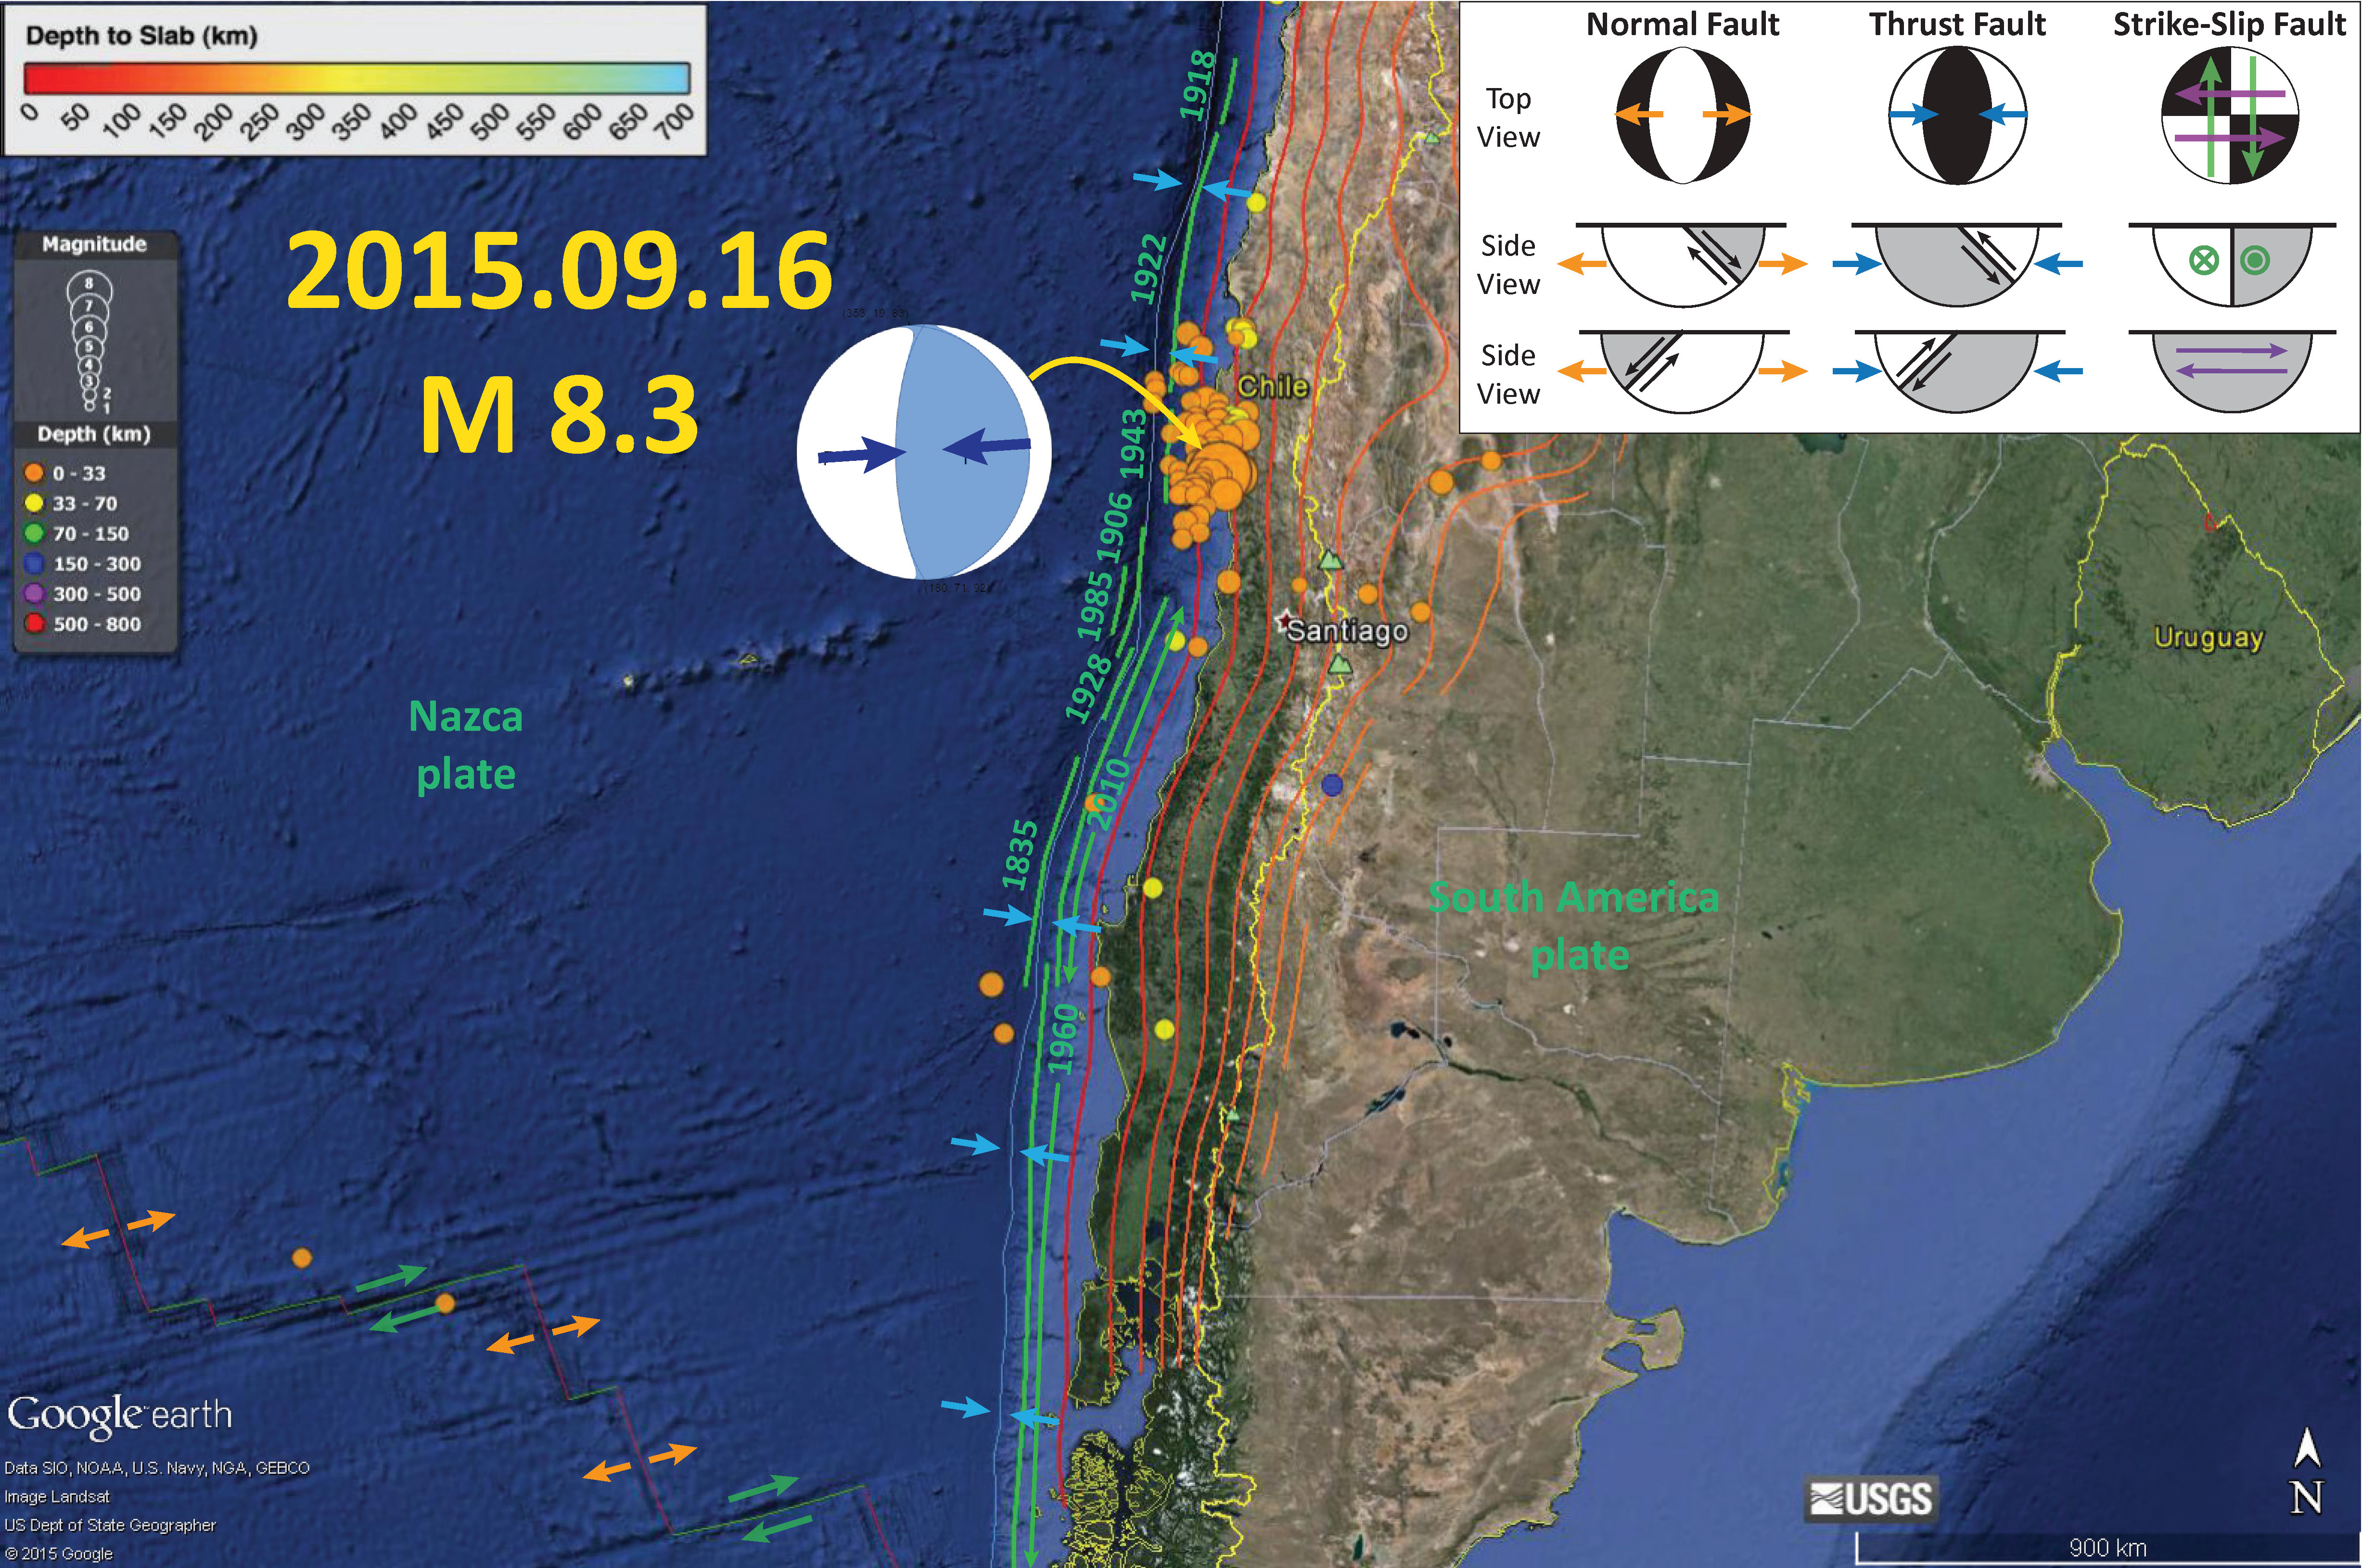
Hundreds of people died as a result of the 1922 earthquake. The USGS has more news reports about the 1922 earthquake here. There were also reports of a tsunami over 9 meters. So we know that this segment of the fault can produce large earthquakes and tsunami. However, it has been about a century since the last Great subduction zone earthquake in this region of the fault.
Here is a map that shows the Modified Mercalli Intensity shaking contours. These contours are based on empirical relations between the attenuation of seismic energy with distance from the hypocenter (also known as Ground Motion Prediction Equation models, GMPE). This is in contrast to the “Did You Feel It?” maps, that use the same intensity scale, but are based on real observations.


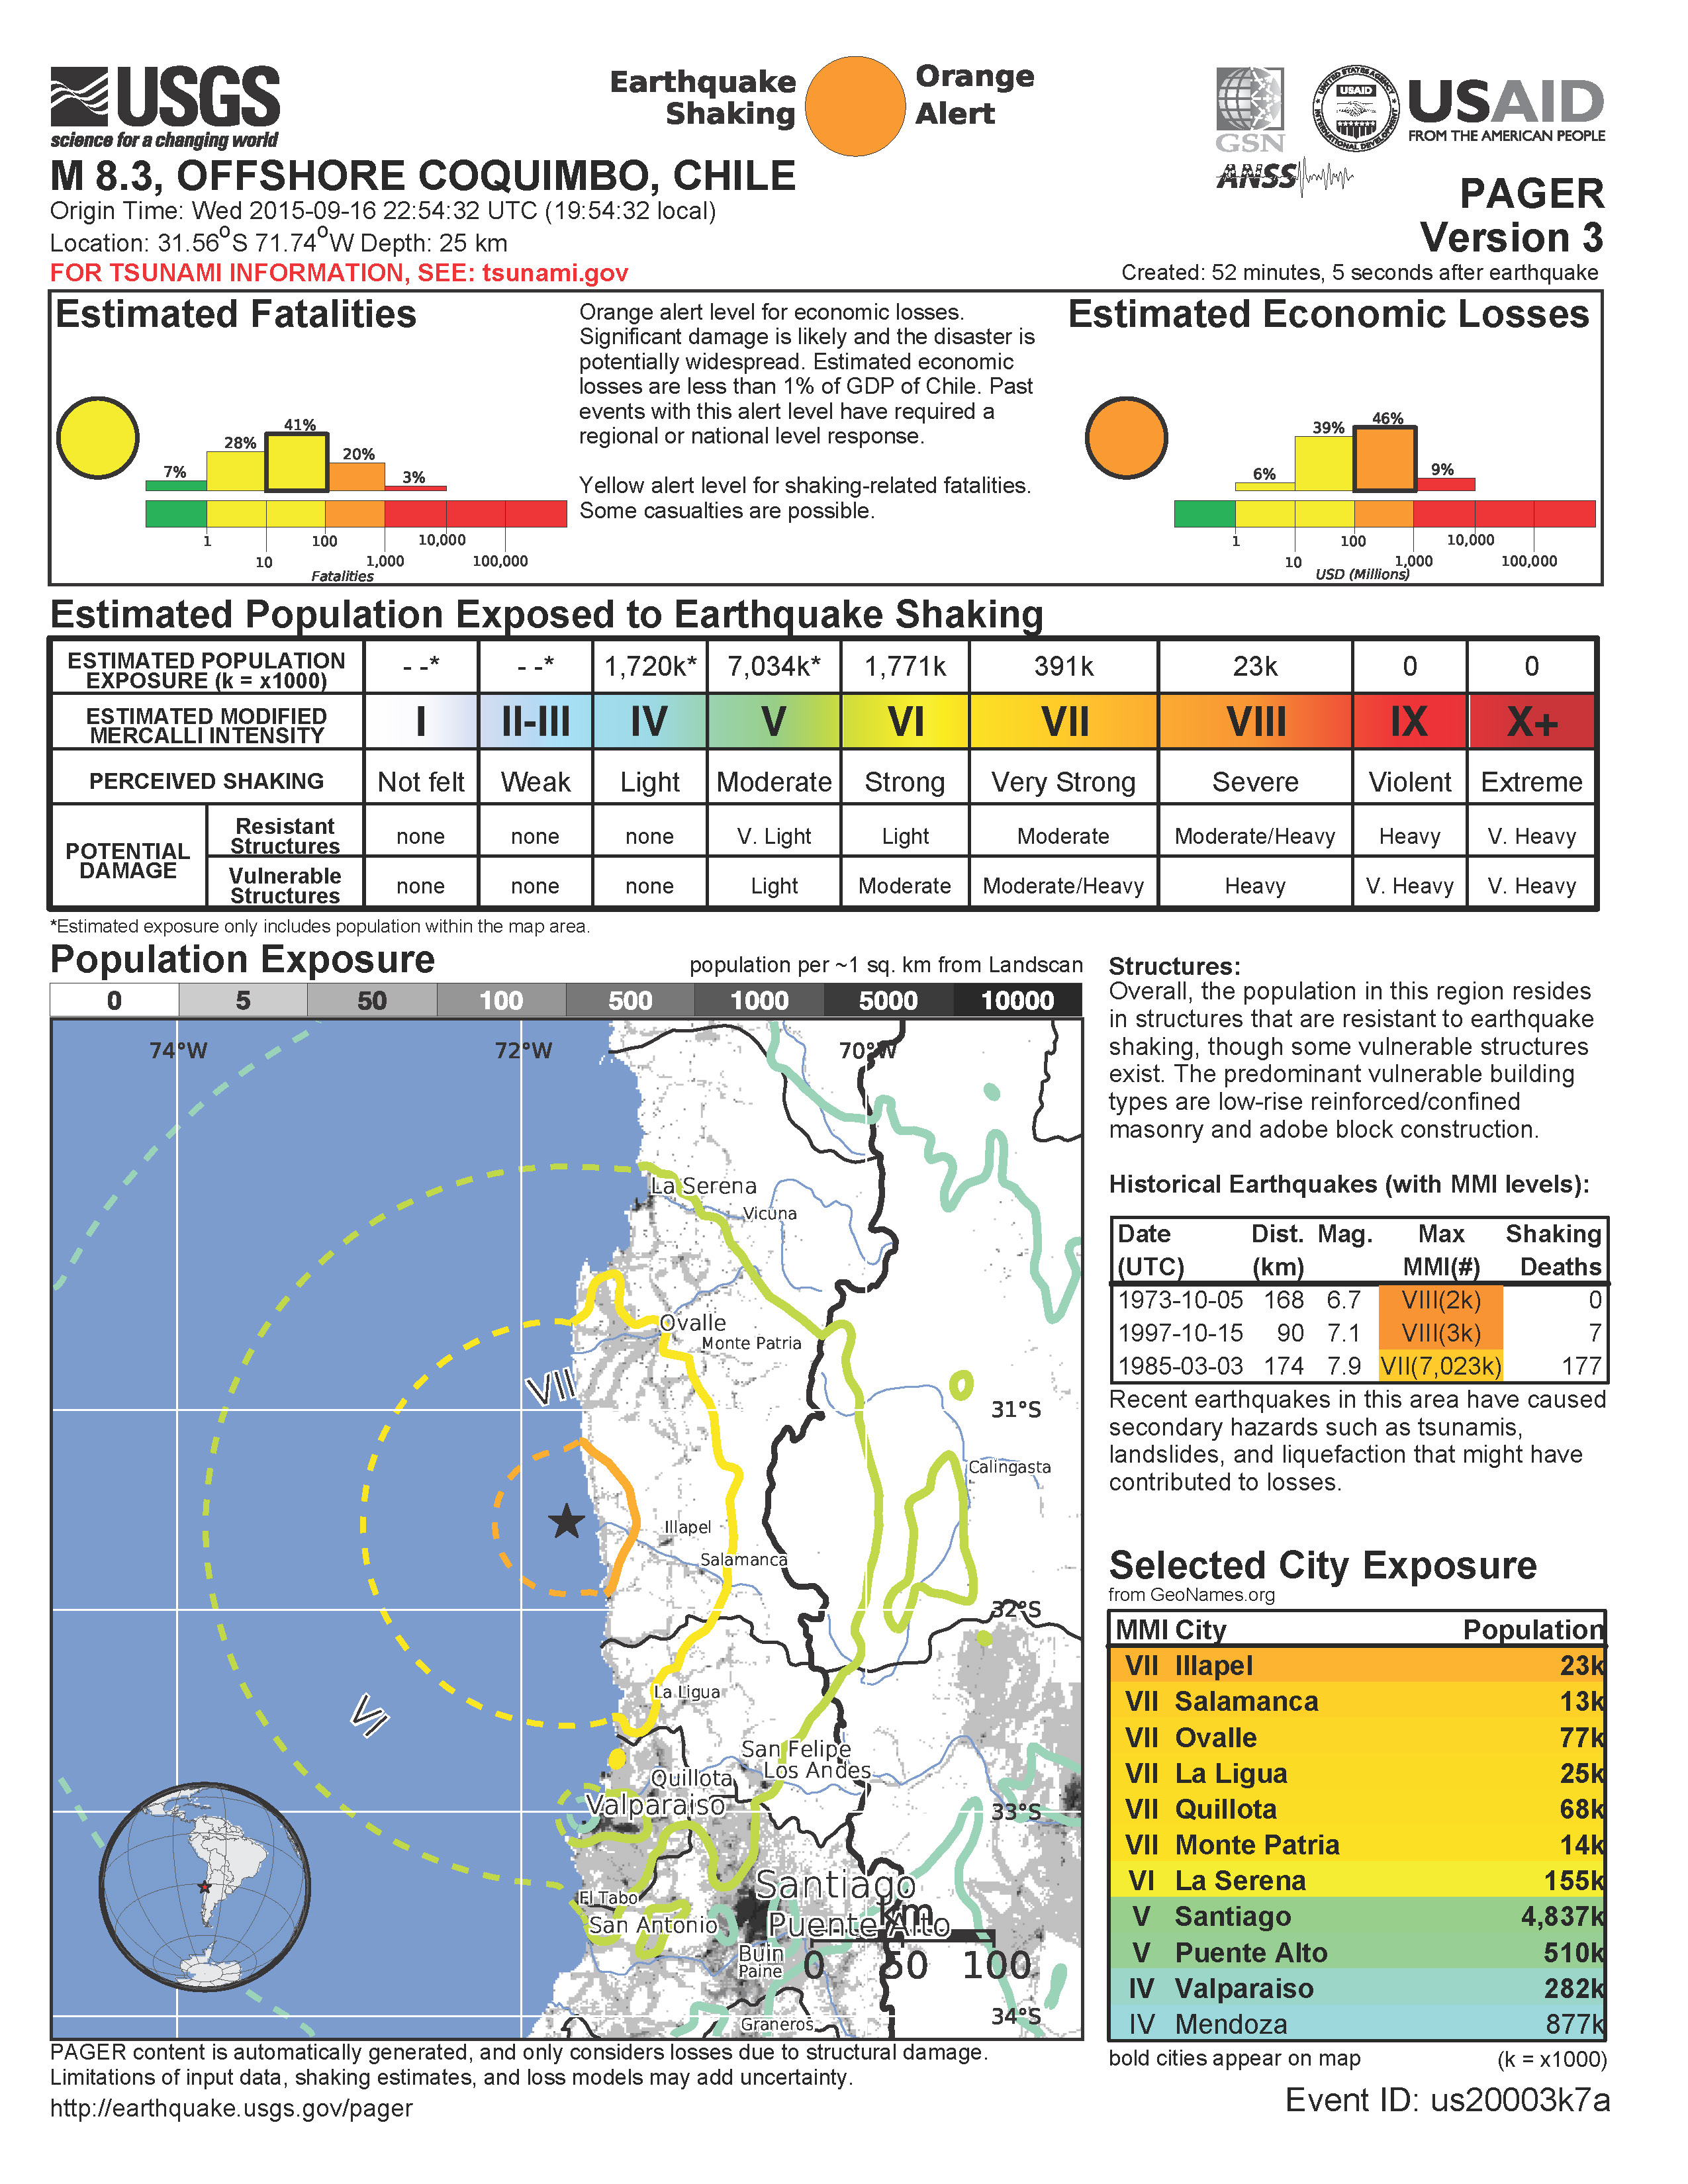
Here is the pager report for this M 8.3 earthquake. This is an estimate of the probability of damage to people and their infrastructure. This is based upon the model that also generated the MMI contours in the above map.
Here is a similarly computer generated estimate of shaking intensity for this M 8.3 earthquake.

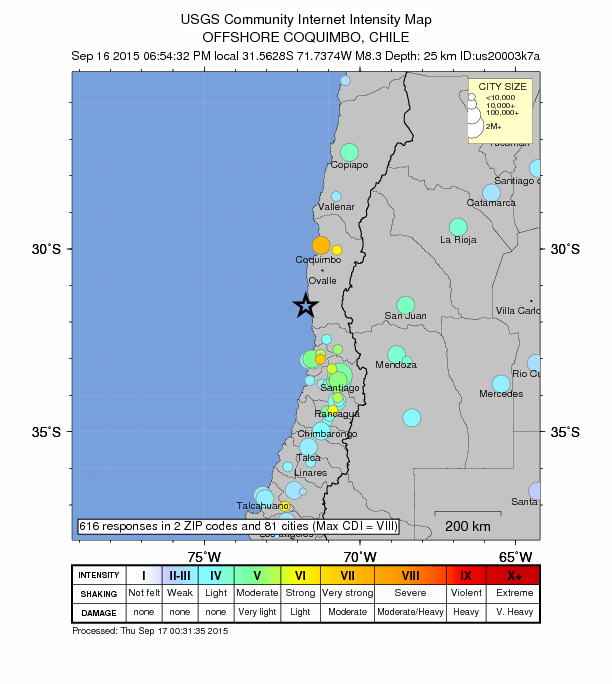
Here is the DYFI map for this earthquake, showing the data points from places where observations were reported from.
This shows how the shaking intensity attenuates (decays) with distance from the earthquake. The dots are the data and the binned data (average), while the orange and green lines are the estimates based upon the GMPE model mentioned above. Note how the empirical relations based upon earthquakes in California (green) fit the observations more well than the empirical relations based upon earthquakes in the eastern and central US. Think about what the implications of this might be. Well, it might mean that the geology in this part of Chile are more like California that it is like central/eastern US.

This is the record of the M 8.3 on “Baby Benioff” in Van Matre Hall (photo credit Dr. Mark Hemphill-Haley, chair of the Humboldt State University, Department of Geology. Here is the HSU Dept. of Geology facebook page.

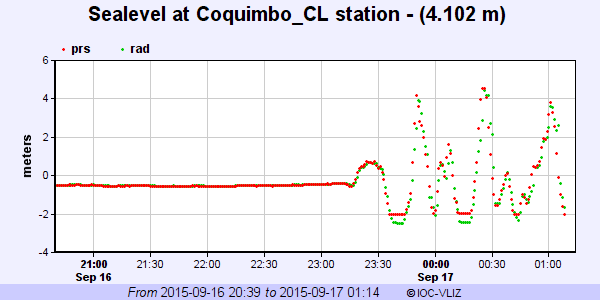
This Great Earthquake also generated a tsunami. Here is the tsunami record from the Coquimbo tide gage.
Here is the tsunami record from the Valparaiso tide gage.
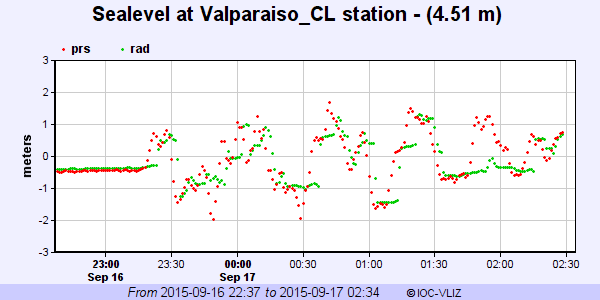
There have been measured tsunamis in Chile. This is from the National Tsunami Warning Center from Palmer, AK.
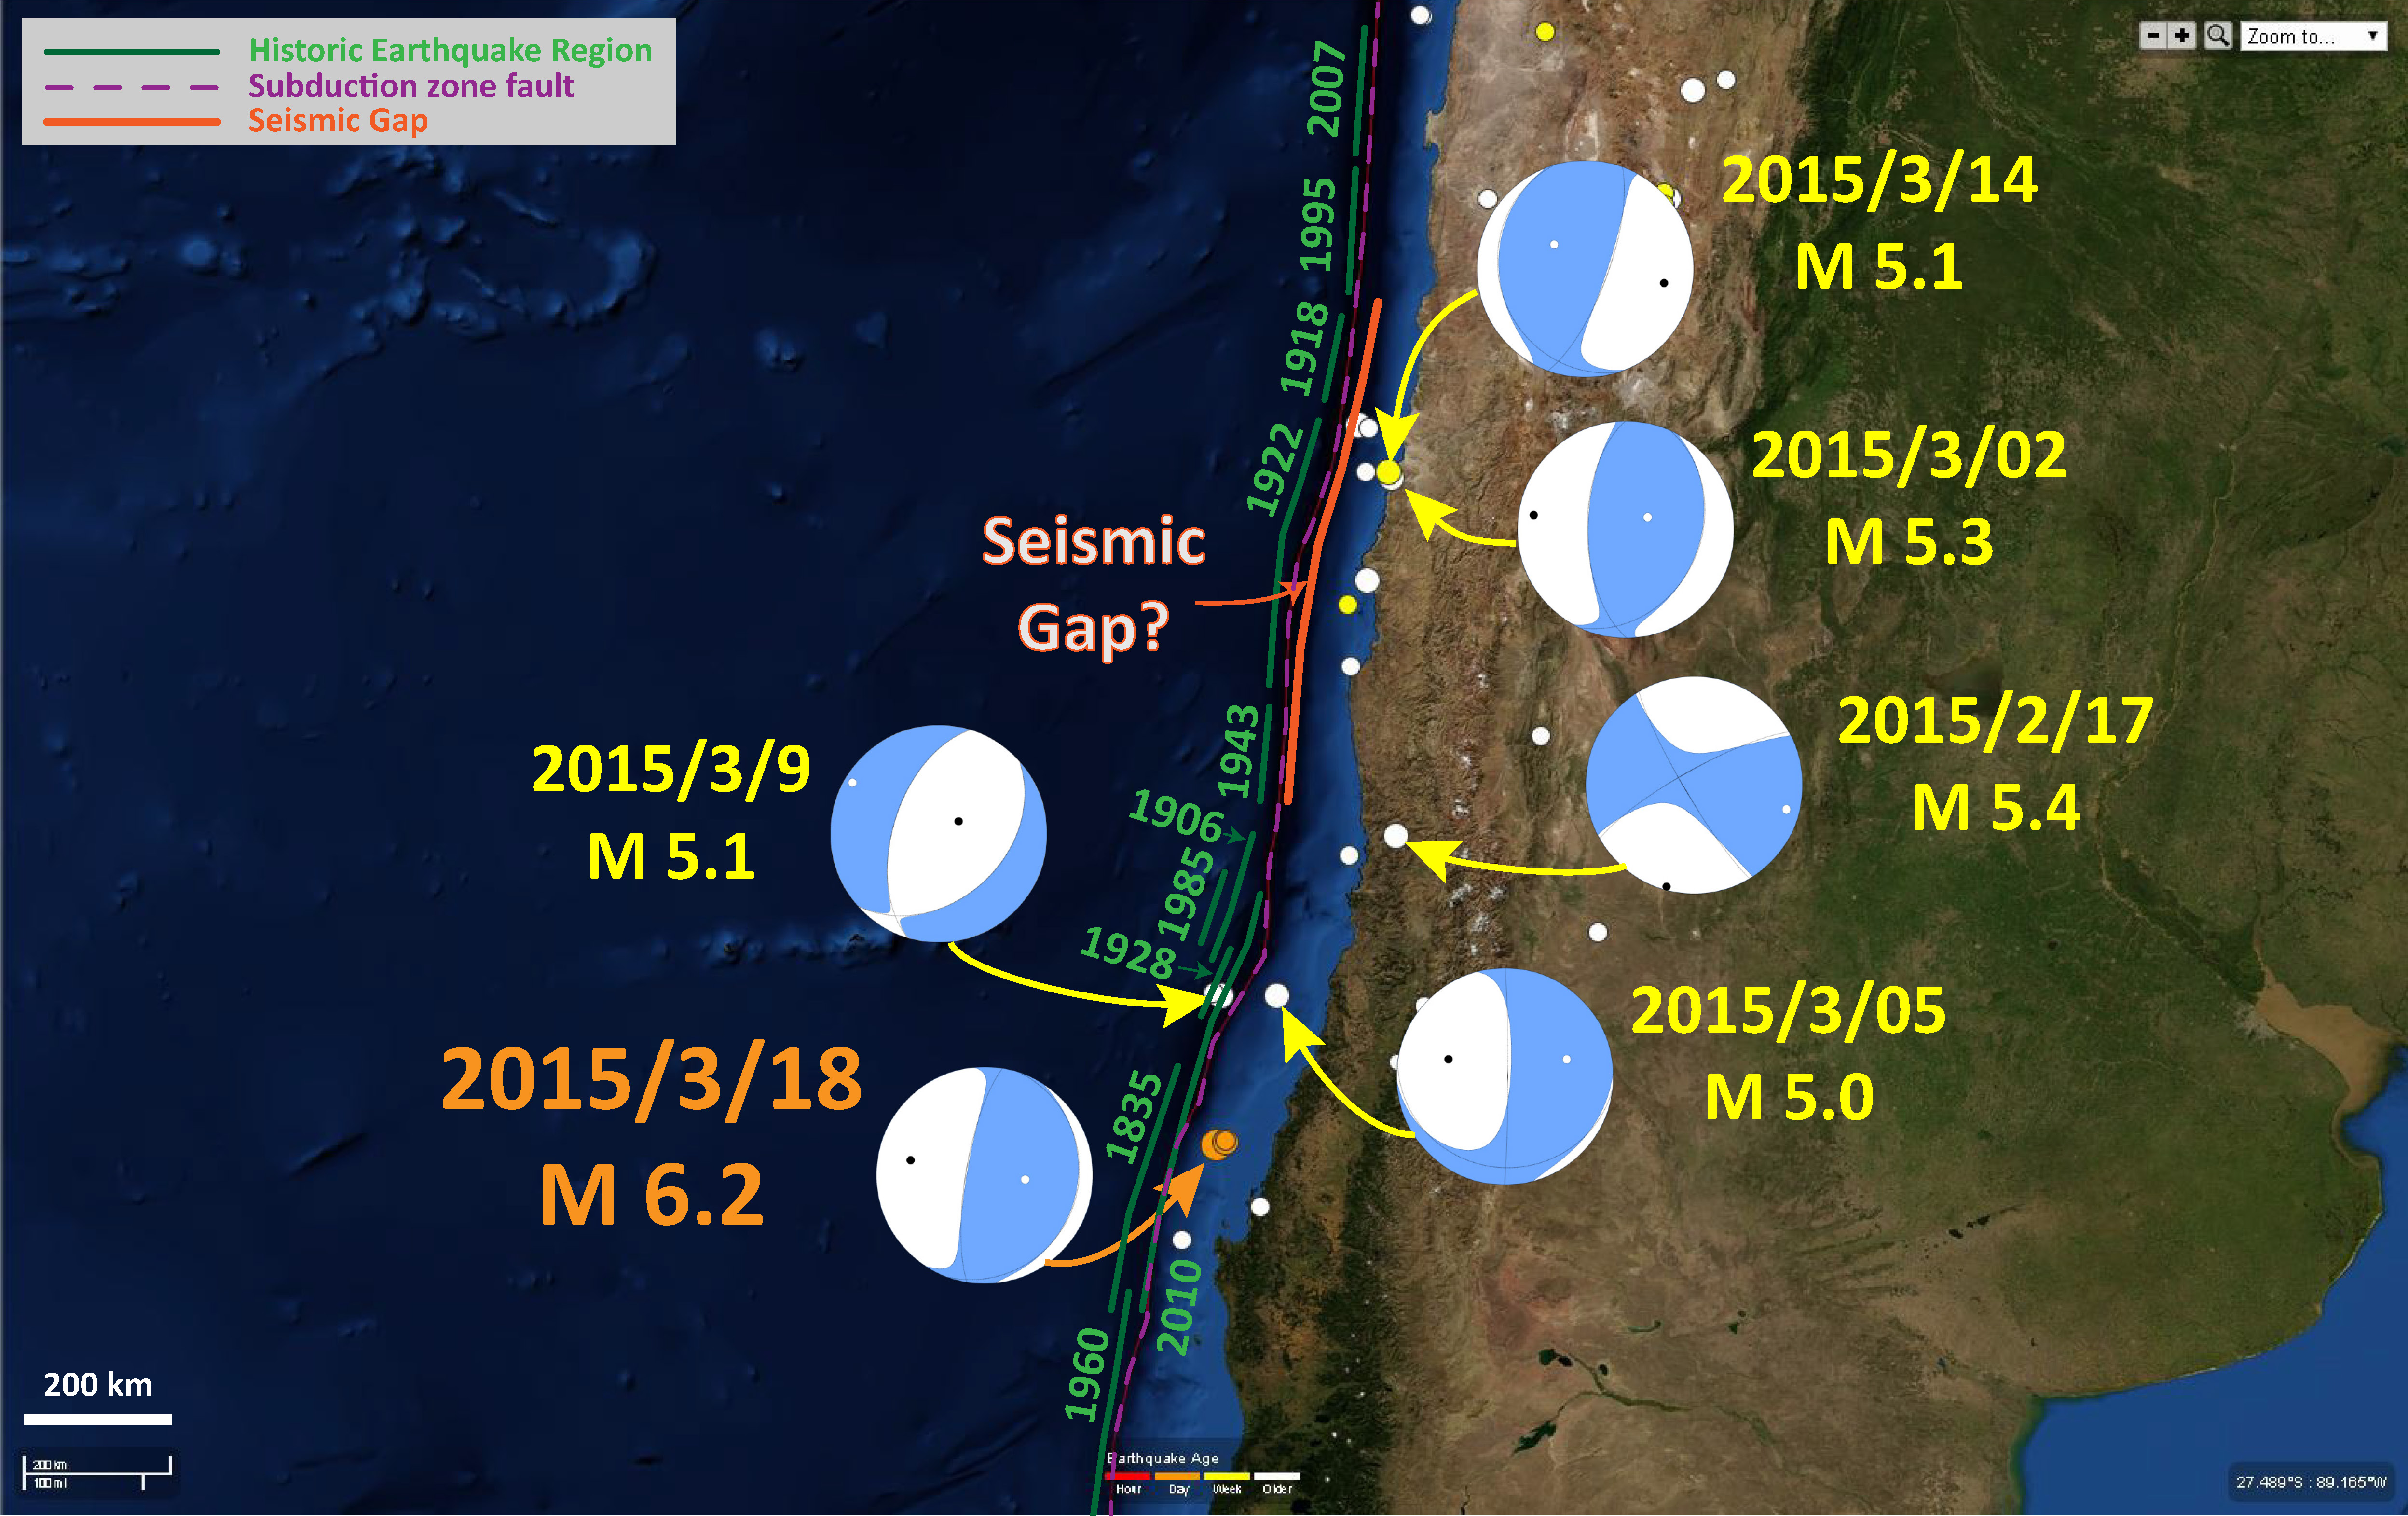
Here is a map showing the seismicity for the March 2015. Below I list the USGS web pages for each of the earthquakes plotted on this map. I placed the location of the surface trace of the subduction zone fault in purple. This is based on the USGS location, which is approximate as it is based on the coarse resolution global topography data set. I have also placed the historic earthquake rupture limits in green. Note how the 3/9 M 5.1 earthquake plots west of the SZ fault, so it must be in the down going plate. This earthquake has an extensional moment tensor, consistent with either bending moment stresses, or slab pull extension stresses. Without more analyses, it would be difficult to distinguish between the two.
-
Here are the USGS web pages for the earthquakes plotted in the above map.
- 2/17/15 M 5.4
- 3/2/15 M 5.3
- 3/5/15 M 5.0
- 3/9/15 M 5.1
- 3/14/15 M 5.1
- 3/18/15 M 6.2
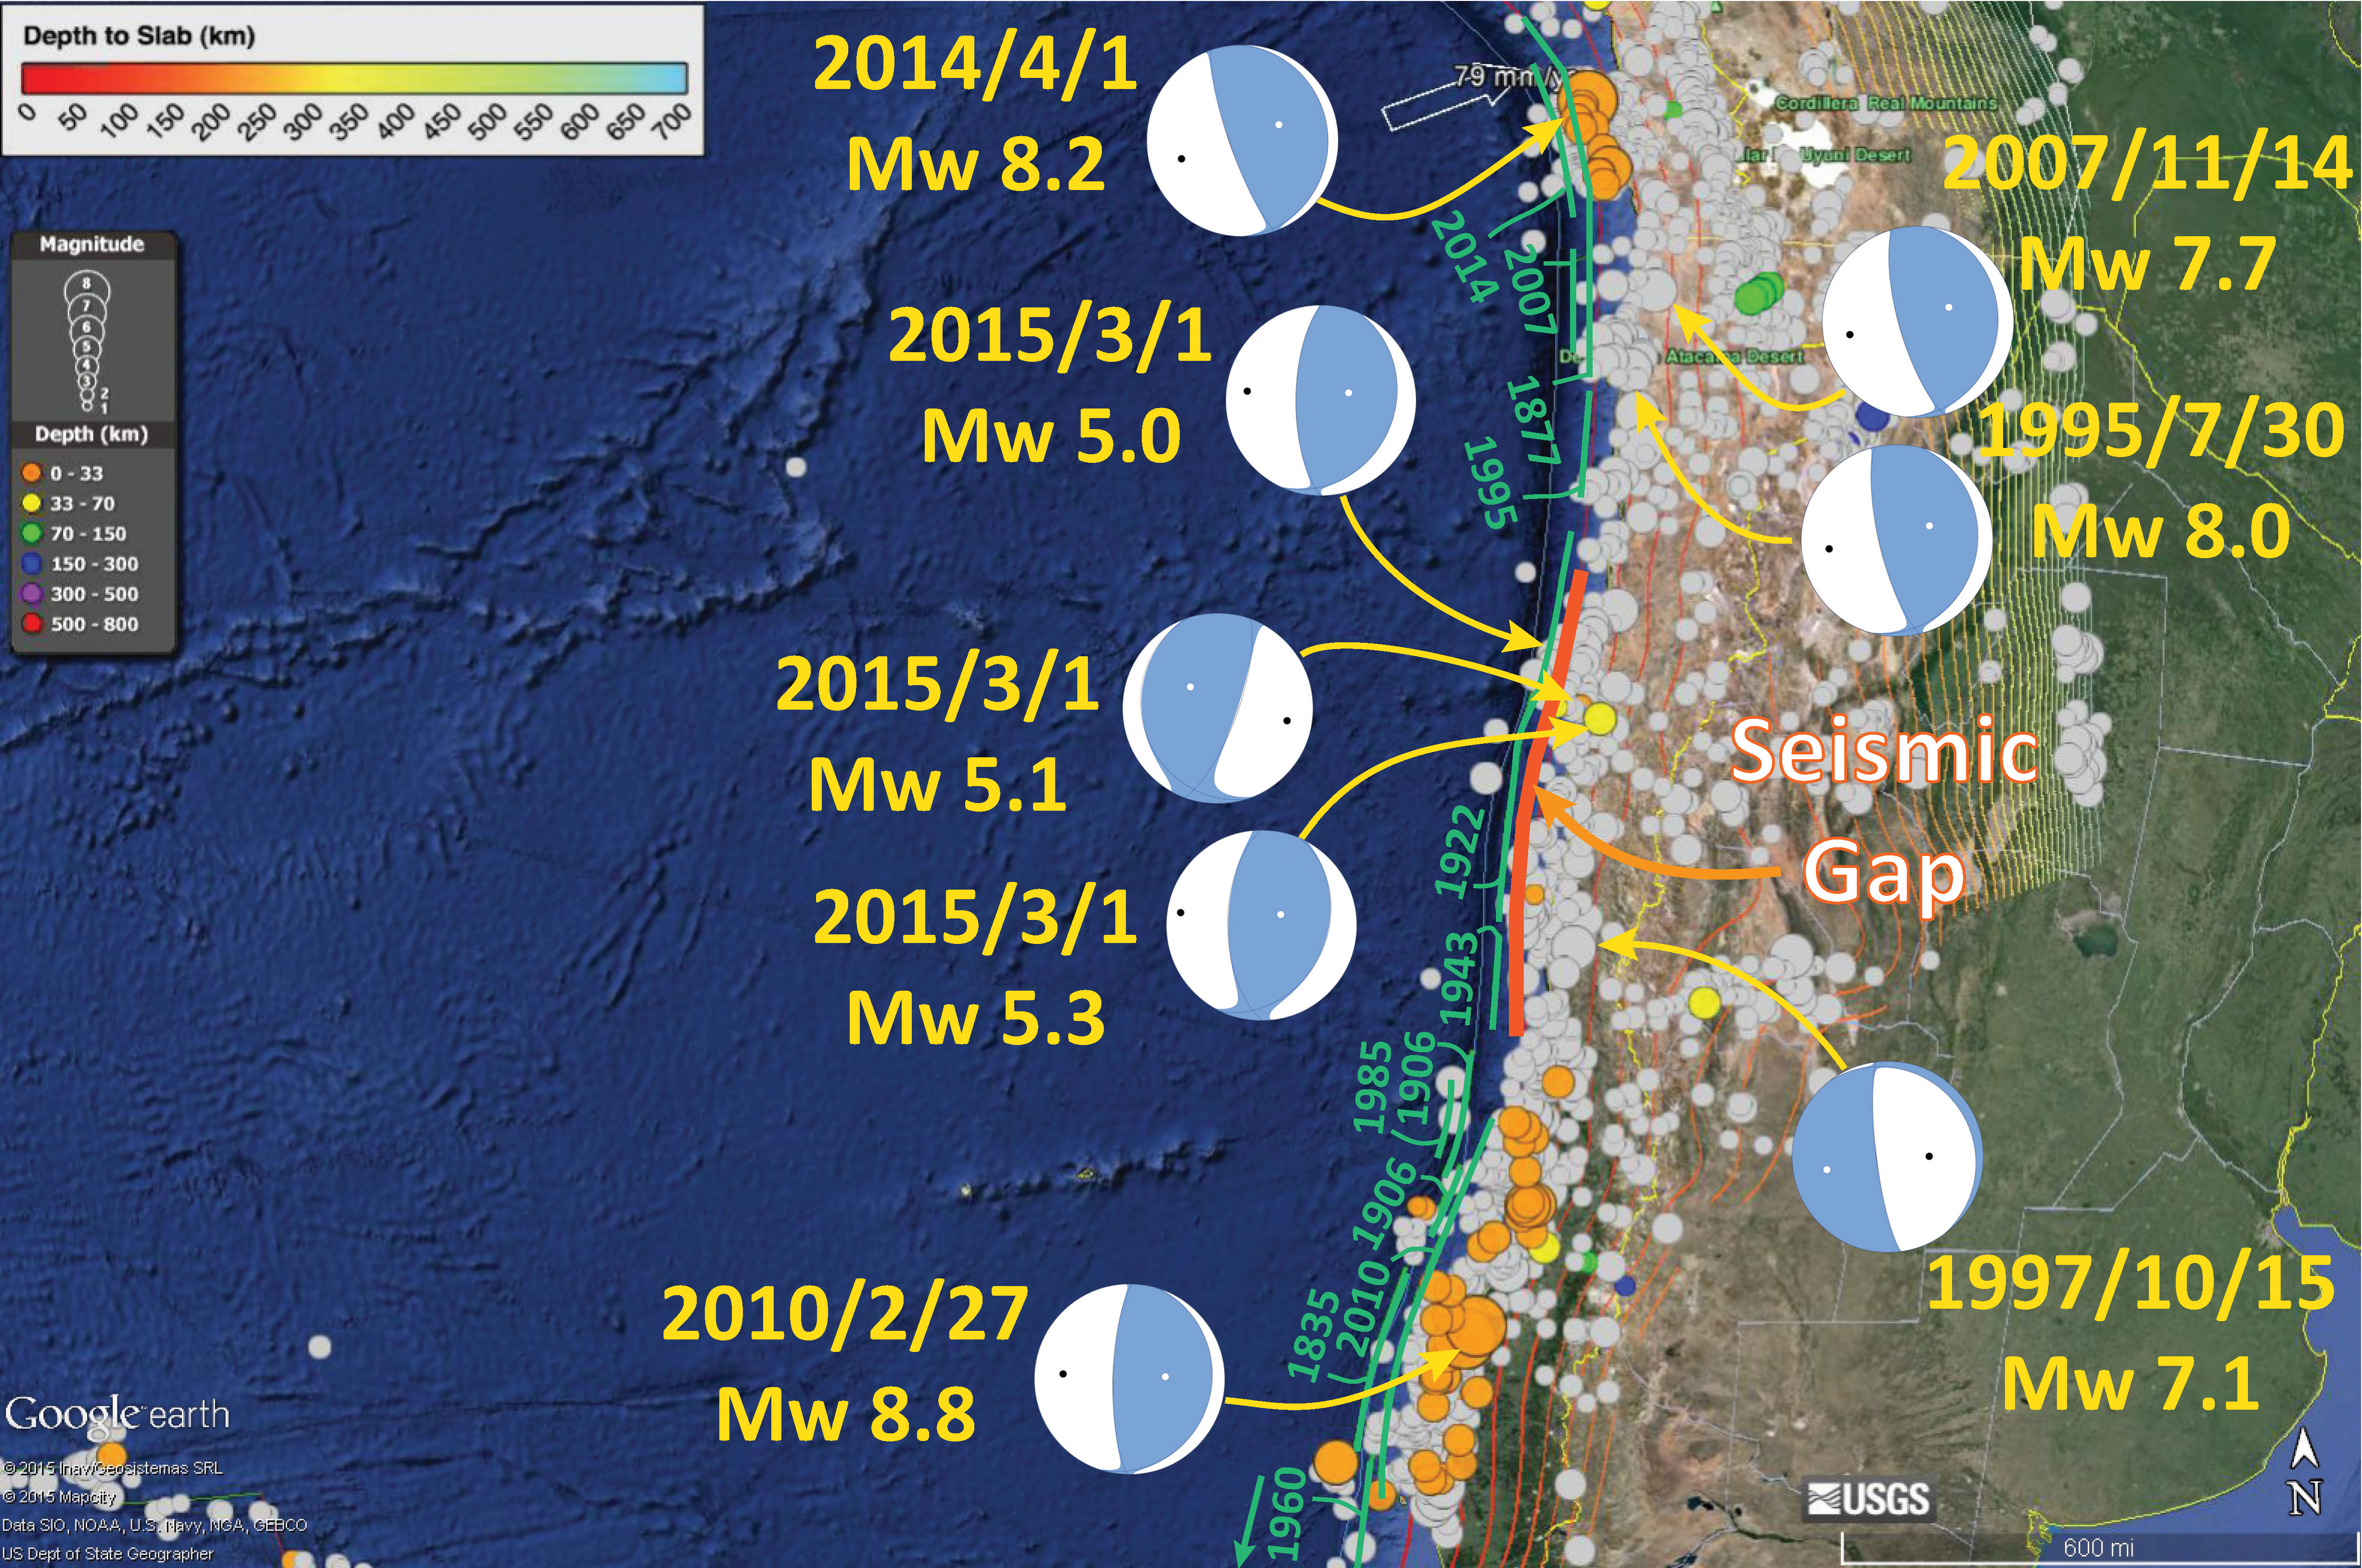
Here is the map that I put together for some earthquakes in the seismic gap that I placed with an orange line in the above map. Here is my previous post about this series of M~5 earthquakes.
Here are some forecasts of tsunami activity on the west coast of North America. This is from the National Tsunami Warning Center from Palmer, AK.
Here are the estimated arrival times for tsunami waves in the Pacific Basin. This is from the National Tsunami Warning Center from Palmer, AK.
Here is the tsunami threat forecaset. This is from the National Tsunami Warning Center from Palmer, AK.
This is what they suggest one does in these threatened areas. This is from the National Tsunami Warning Center from Palmer, AK.
-
References:
- Hayes, G.P., Wald, D.J., and Johnson, R.L., 2012. Slab1.0: A three-dimensional model of global subduction zone geometries in, J. Geophys. Res., 117, B01302, doi:10.1029/2011JB008524
[Additional information is posted in a supplementary post here.]
I was wondering when you would post. Especially since your hometown is under tsunami alert.
I was teaching a class and had to rush home to work on my blood sugar first ;-)
luckily, i have posted about this region before and was ‘academically’ prepared…
h/t to Mark Hemphill-Haley for the image of the ” Baby Benioff” Seismometer in Van Matre Hall.
Yeah, sure. “I couldn’t post to Facebook. I was doing my job.” I’ve heard that excuse before. ;-)
h/t to Melanie Michalak for telling me about this earthquake and letting me know what i was missing… ;-)
You should have your phone generate an alert for anything 7.8 or so and higher. There’s not that many each year. :-)
indeed. tho my blood sugar was the main thing that i was concerned about… i could have posted from my office on campus, but i was getting light headed…
my goals: (1) update alert settings on phone, (2) get some food for office. not necc in that order… ;-)
Yes, blood sugar more important. :-) Hope you’re okay now.
Dude, blood sugar and serendipitous academic preparedness notwithstanding, you’re a freaking machine.
Thanks, Jay!