Here is an update on the M = 7.0 New Guinea earthquake. Here is my first post about this earthquake.
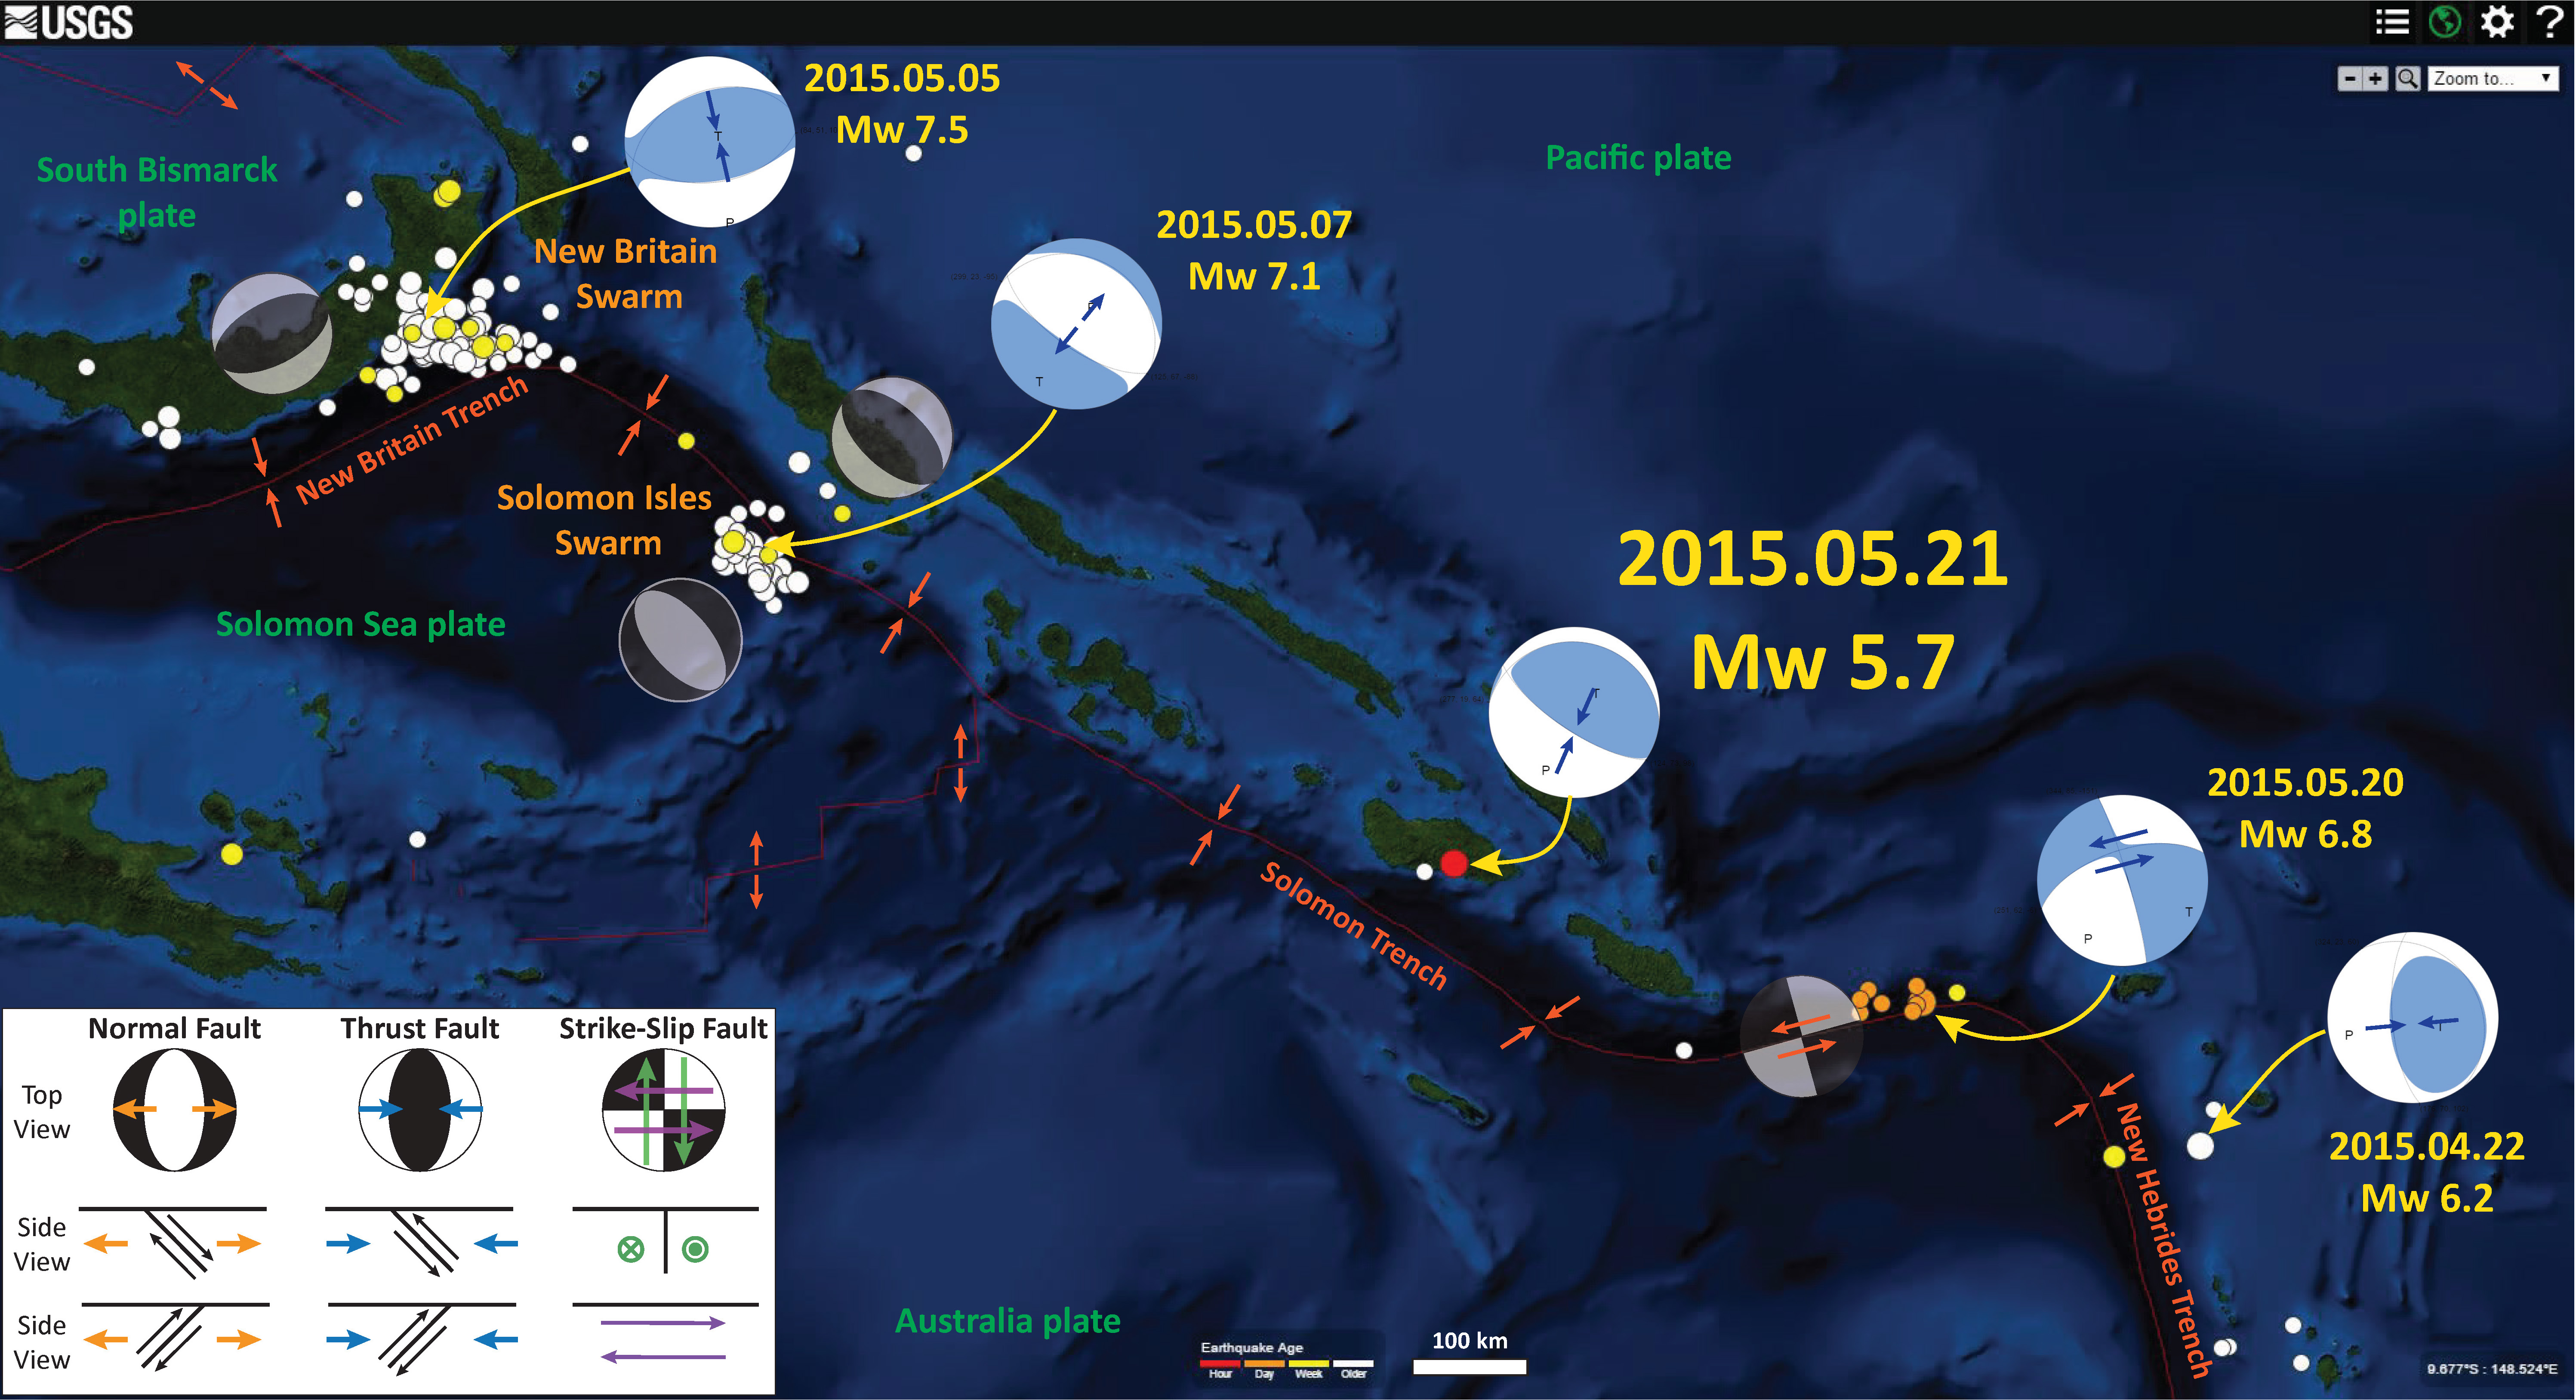
As I mentioned, there has been a flurry of seismic activity along the New Britain and Solomon trenches to the east and earthquakes along the Molucca Strait to the west.
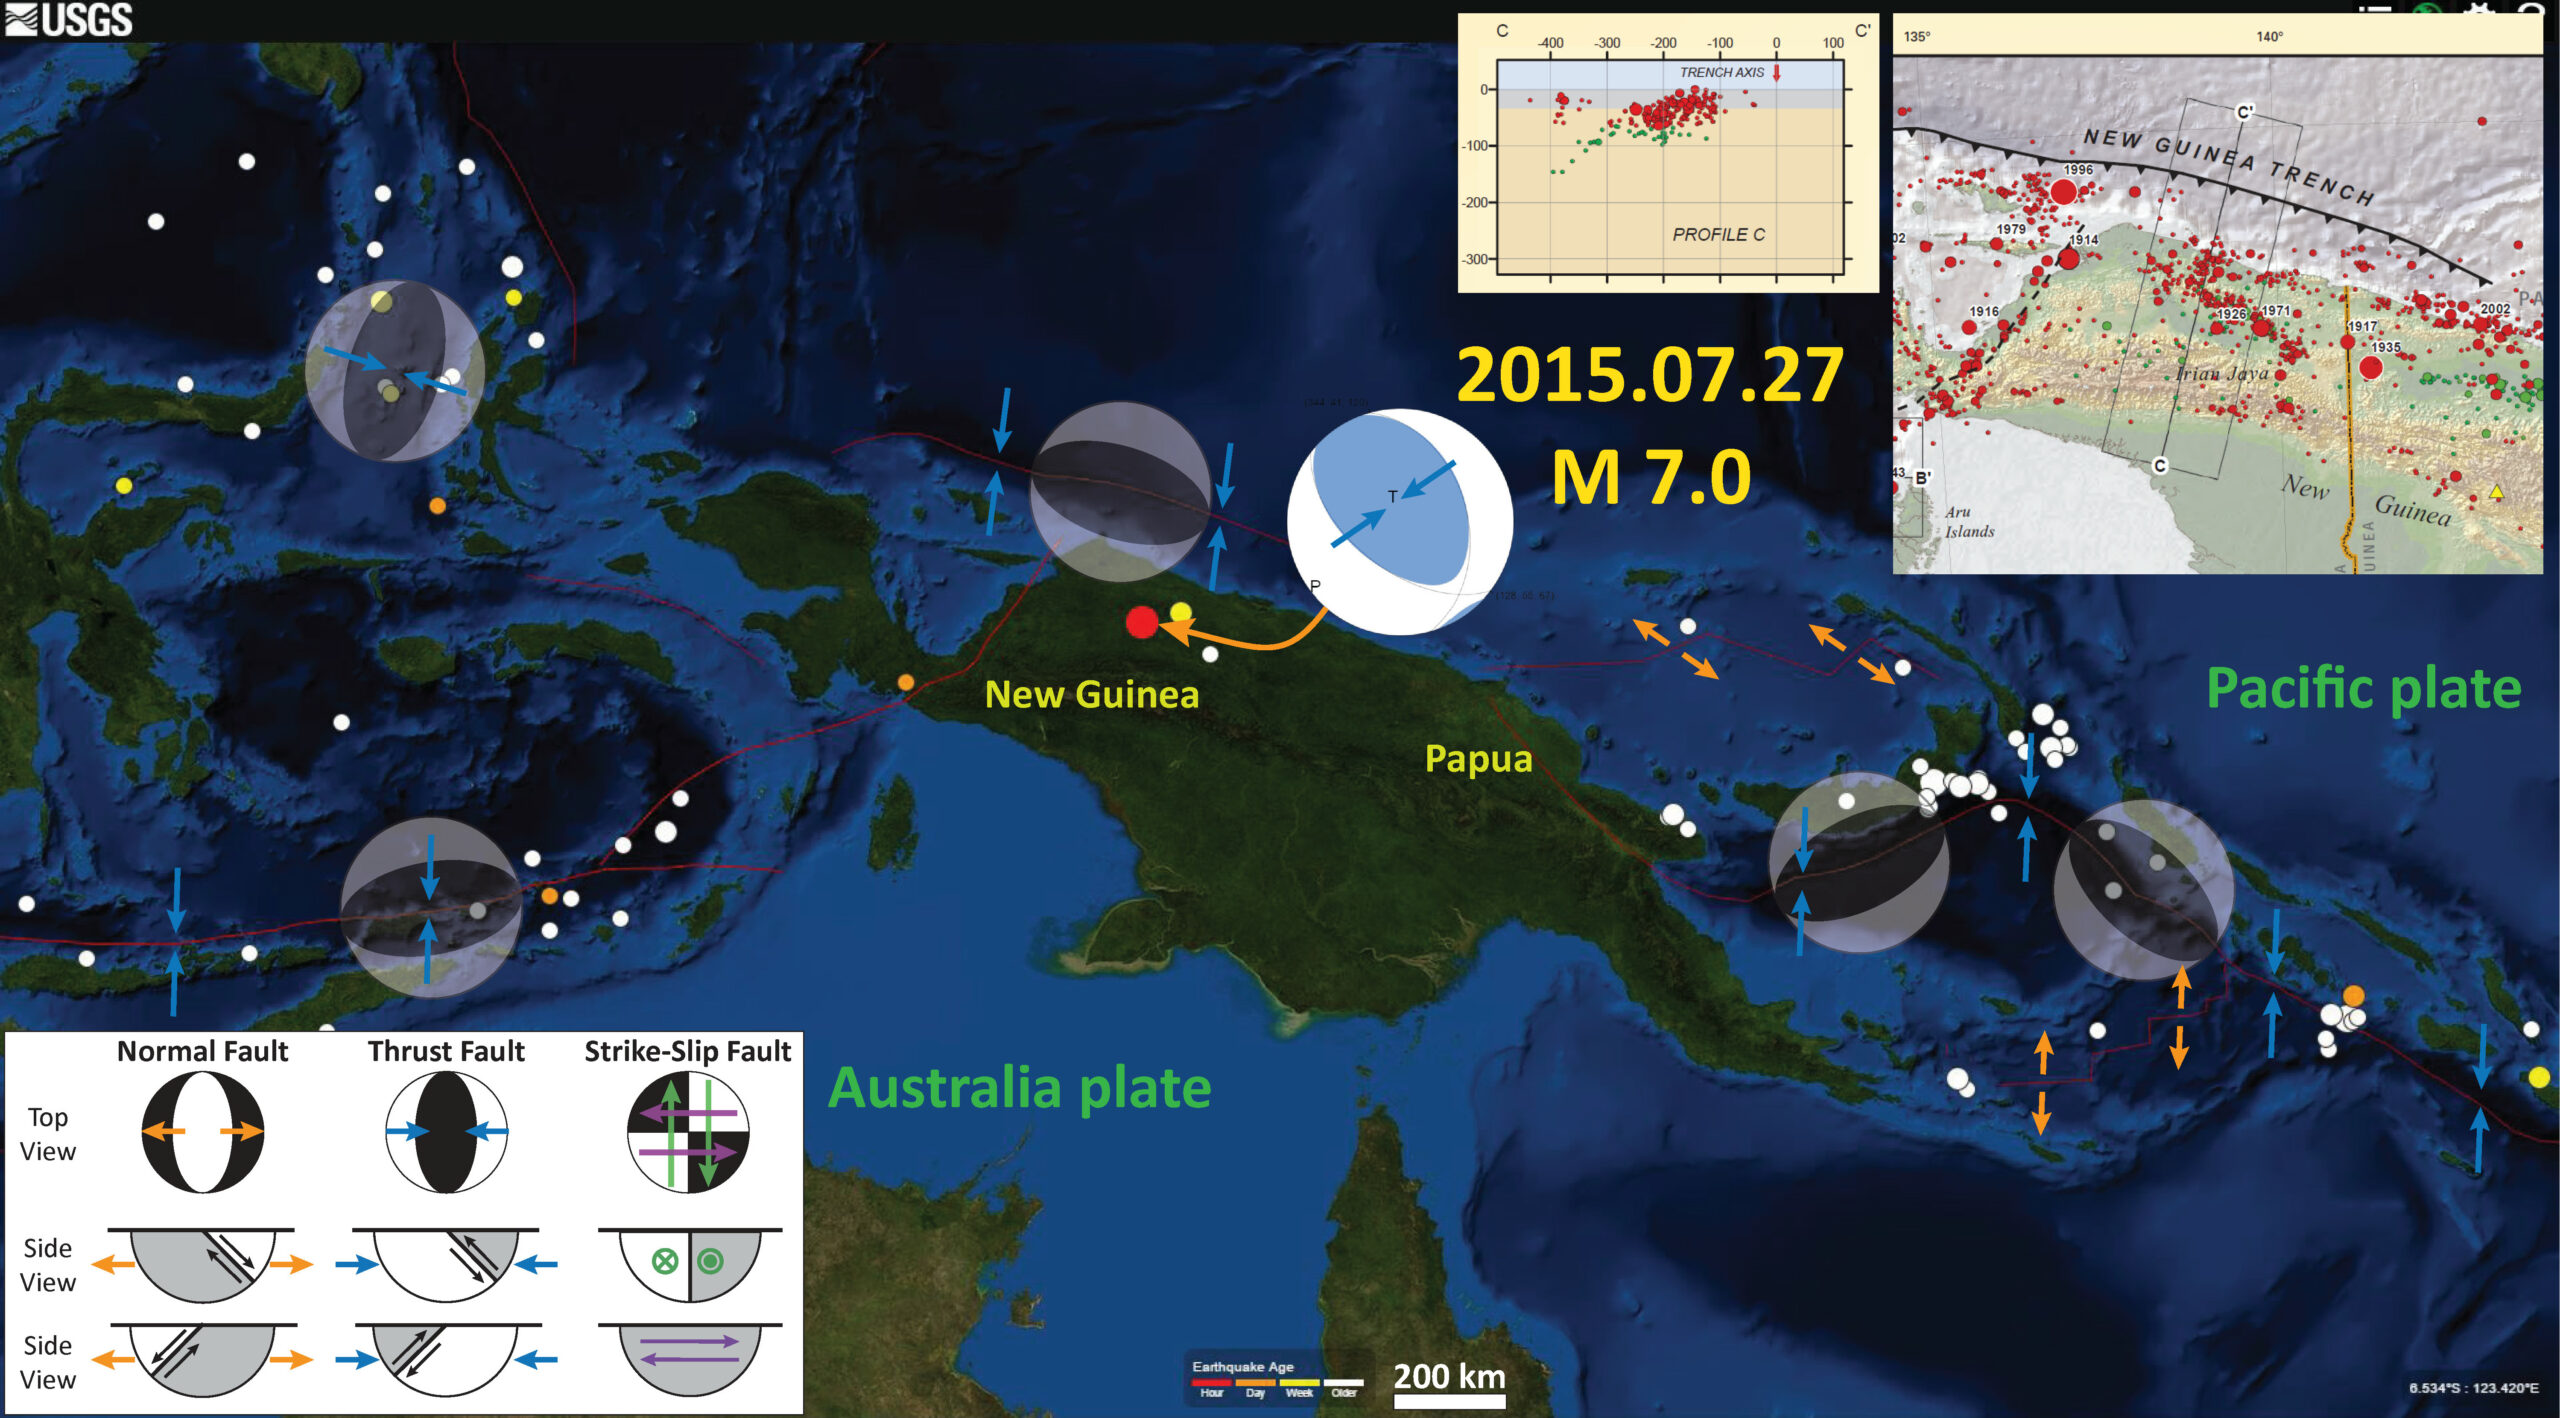
I put together a map that shows the moment tensor for this earthquake, which shows a west-northwest striking thrust/reverse earthquake fault plane solution. There is a subduction zone to the north of this island and several large E-W striking fault systems that cross the island. Some of these fault systems are mapped as fold-and-thrust belts (compression) and some fault systems are strike-slip systems (shear). The moment tensor is not parallel to these mapped fault systems (at the global scale), so the local scale of the faults is probably a little more complicated.

Here is a map that shows these fault systems and plate boundaries of the region. I cannot tell who’s map this is, but here is the link from where I got it.

I posted about the tectonics of this region during some earthquakes from 2014/12/06. For that post, I found a generalized tectonic map of the region from Baldwin et al. (2012).
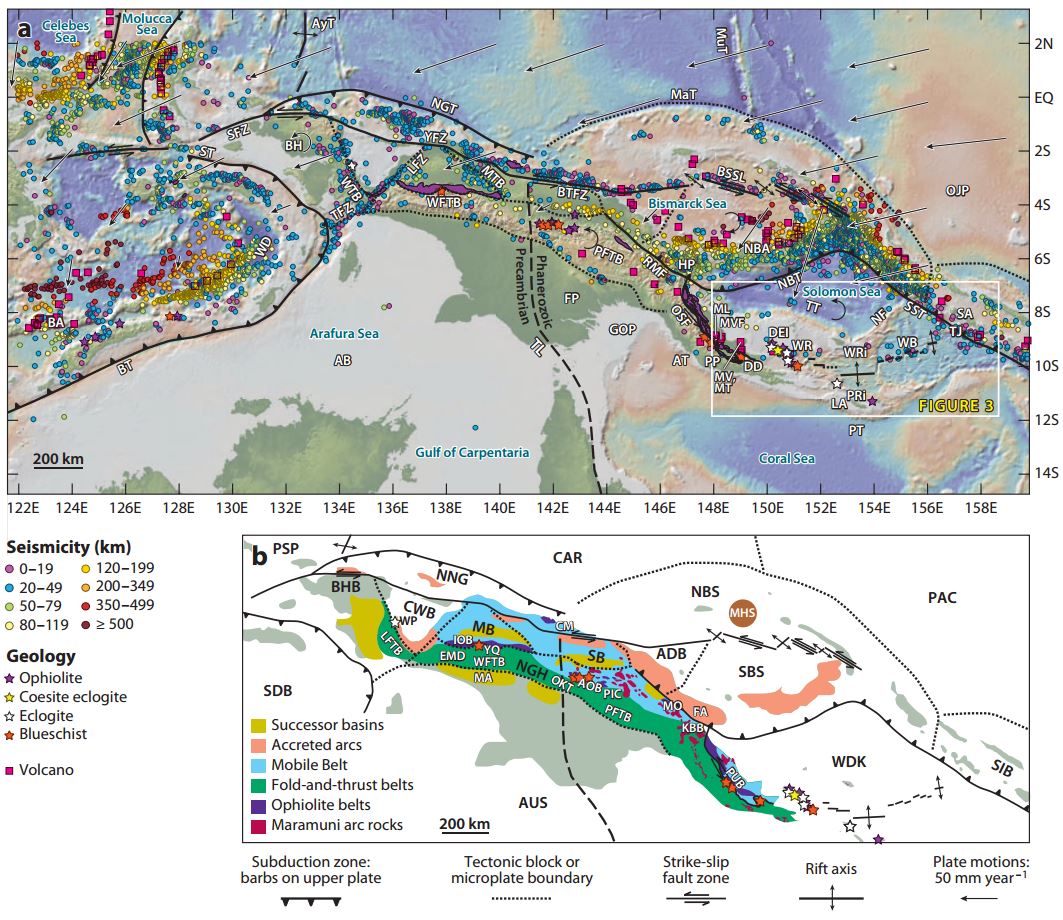
Here is a great series of cross sections through the island, with a map to show where the cross sections are located (North is to the right; Baldwin et al., 2012). Click on the map to see a larger version. Today’s M 7.0 earthquake is located close to cross section E. Along the northern margin of the island is a left-lateral strike slip Sorong fault zone (SFZ). Further to the south are the E-W striking Papuan (east of cross-section E) and Western (west of cross-section E) fold-and-thrust belts (PFTB and WFTB respectively). Today’s M 7.0 earthquake probably occurred on a thrust fault in one of these fold-and-thrust belts.

The USGS has a tectonic summary poster for this region of the world. I included a cross section of the seismicity from this poster on the above map (cross section C-C’ ).
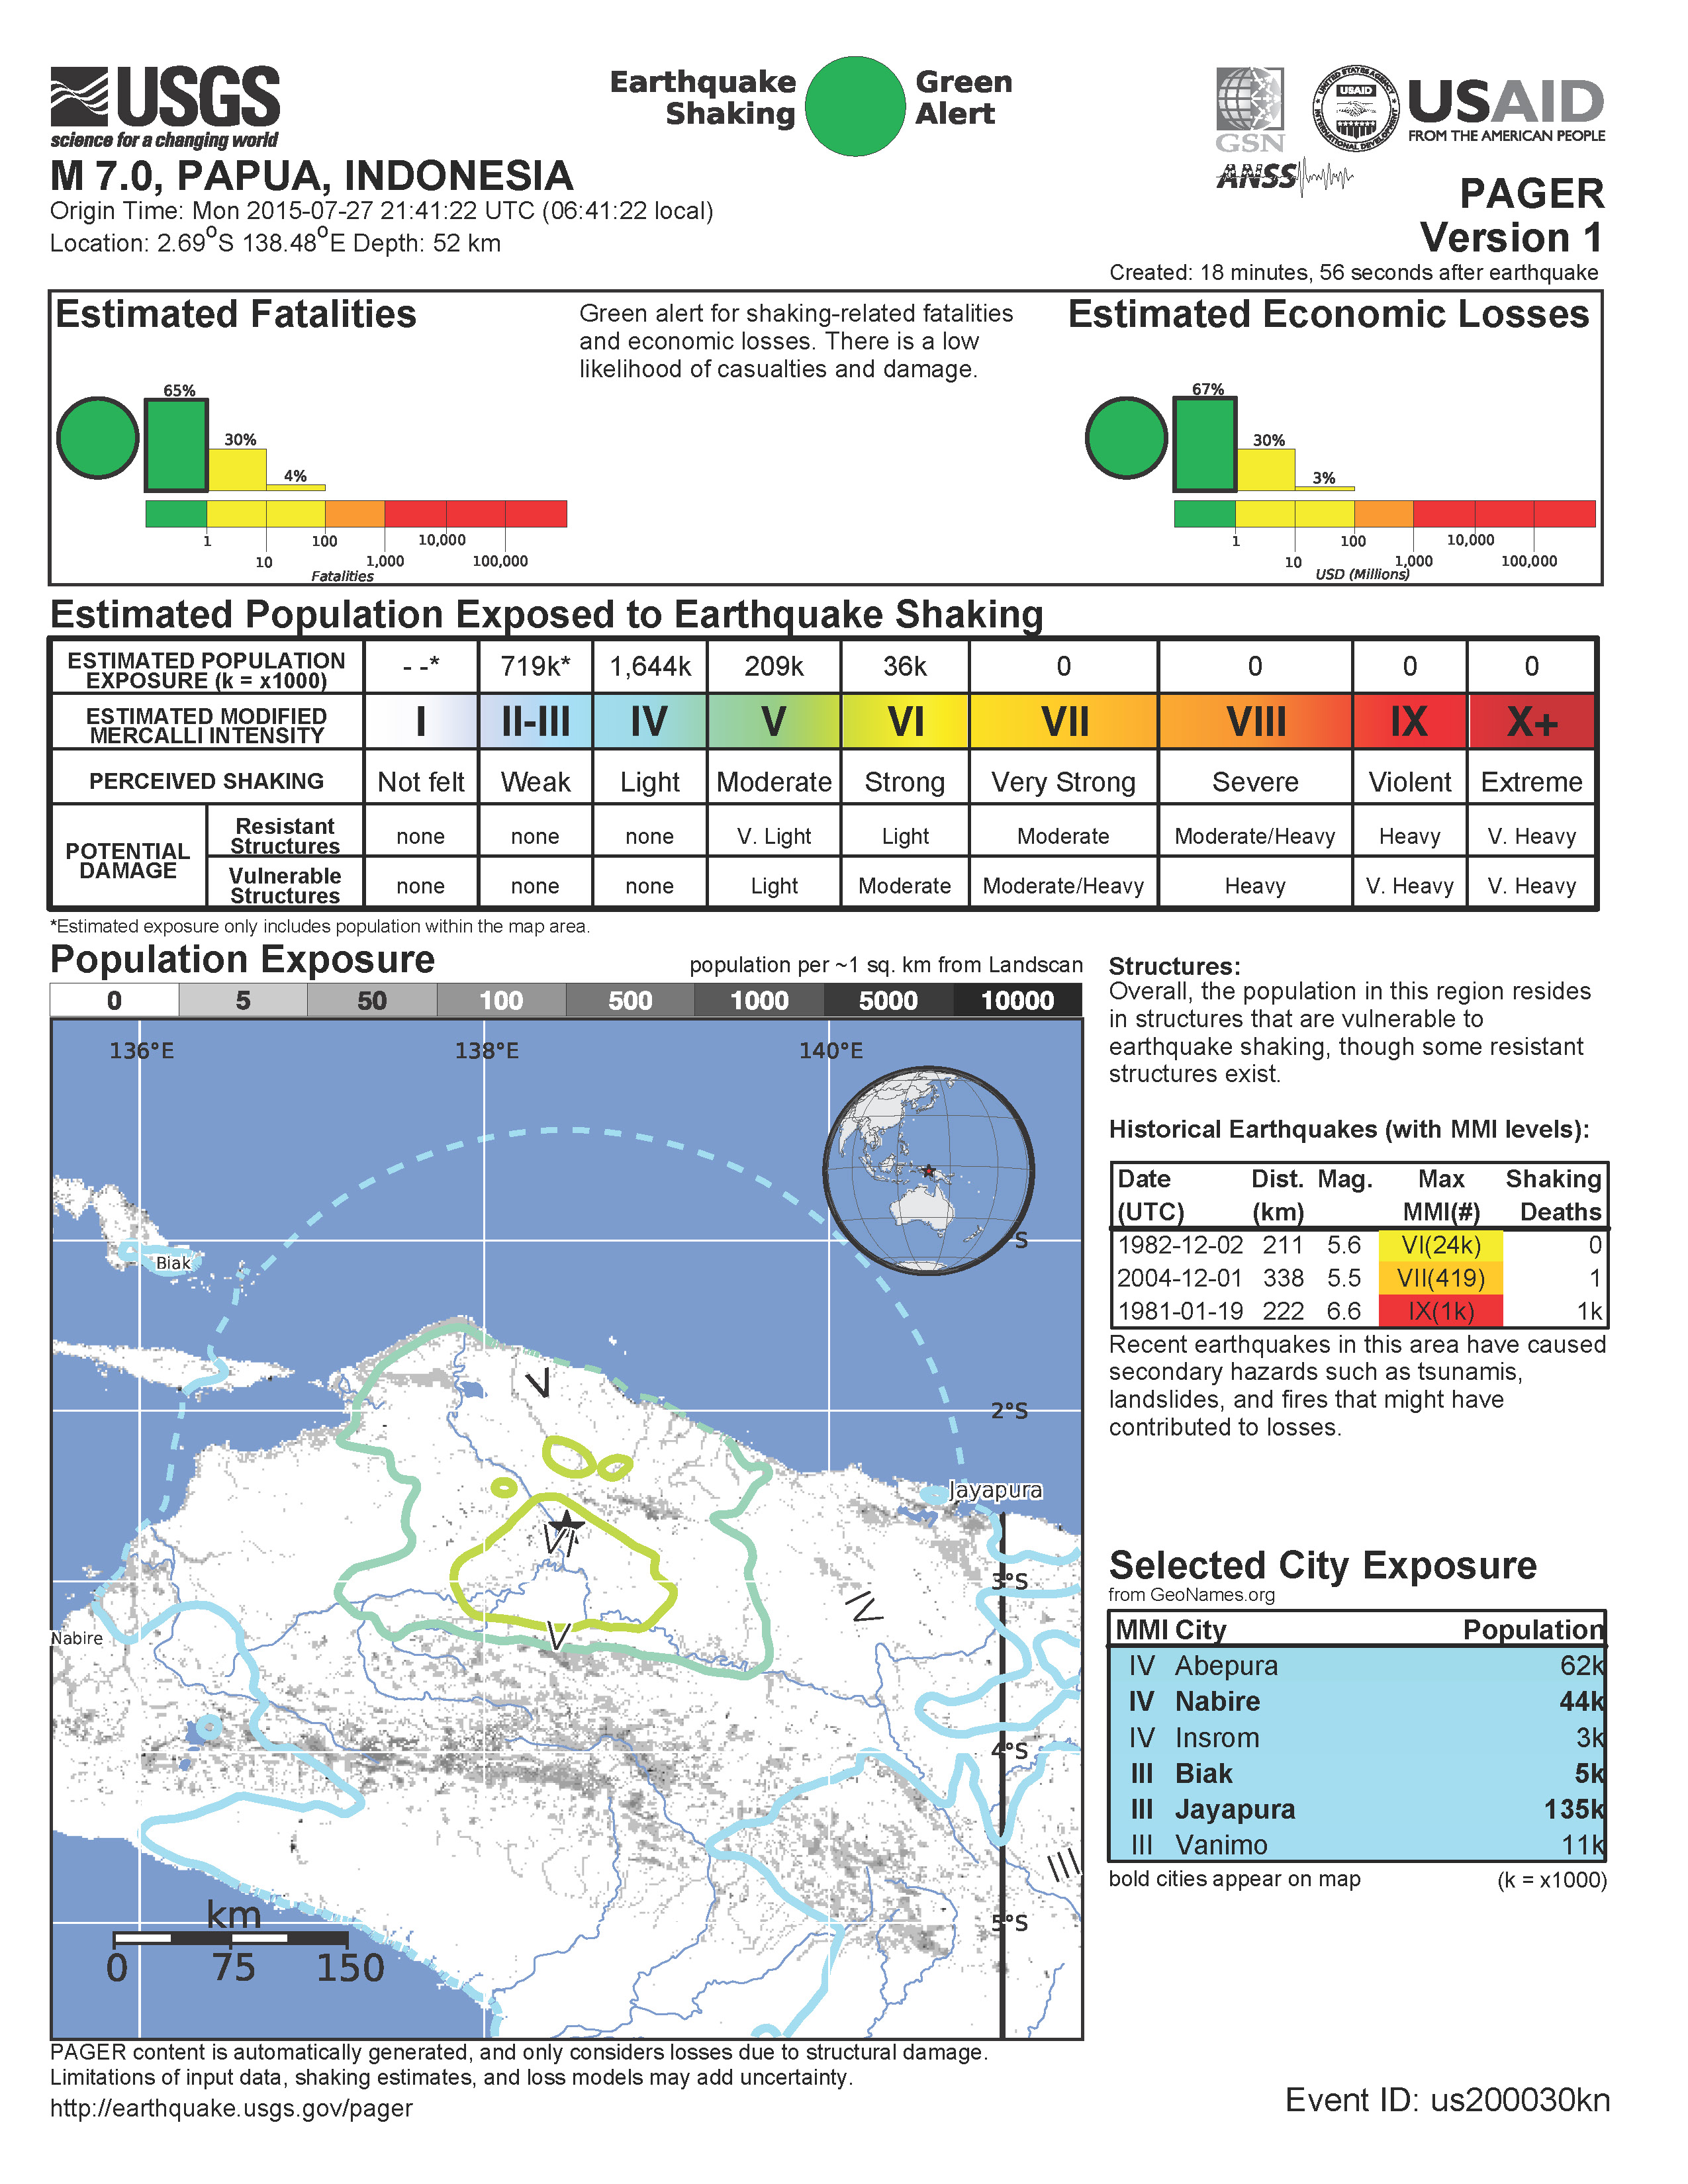
There is a new PAGER alert; the estimated casualties did not change, but the spatial variation in ground shaking estimates changed slightly. Look at the maps to see how the shaking intensity contours are different. This change is common as the first PAGER alert is created automatically from a computer model, while later versions incorporate more data and interpretations and re-calculations from real people.
Here is PAGER version 1:
Here is PAGER version 3:

Seismic Activity Nearby:
-
The plate boundaries to the east have continued to be very active in the past few years.
- 2014.12.06 M 6.8
- 2015.05.15 M 7.5
- 2015.03.29 M 7.5
-
Here are some pages that show some earthquakes in the Molucca Sea to the west.
- 2014/11/15 M 7.1
- 2014/11/21 M 6.5
- 2014/11/26 M 6.8
- 2015/03/17 M 6.2
- 2015/05/20 M 6.8 (also a couple compilation maps)
- 2015/05/21 M 5.7
Here is a compilation of some of the earthquakes to the east of PNG.
Here is an animation of earthquake epicenters, with color representing depth. The animation begins in January, 1975 and extends through today. If you want to download the video file, here is the link.
-
References
- Baldwin, S.L., Fitzgerald, P.G., and Webb, L.E., 2012. Tectonics of the New Guinea Region, Annu. Rev. Earth Planet Sci., vol. 40, p. 495-520.
3 thoughts on “New Guinea Earthquake Update #1”