Well, there was quite a buzz on social media following this small magnitude earthquake today. Here is the USGS web page for this Mw 3.3 earthquake. The earthquake appears to be related to the Newport-Inglewood fault system and the epicenter shows it to have happened in the Baldwin Hills region (I thought that this earthquake might have some obliquity, or some compressional motion on it).
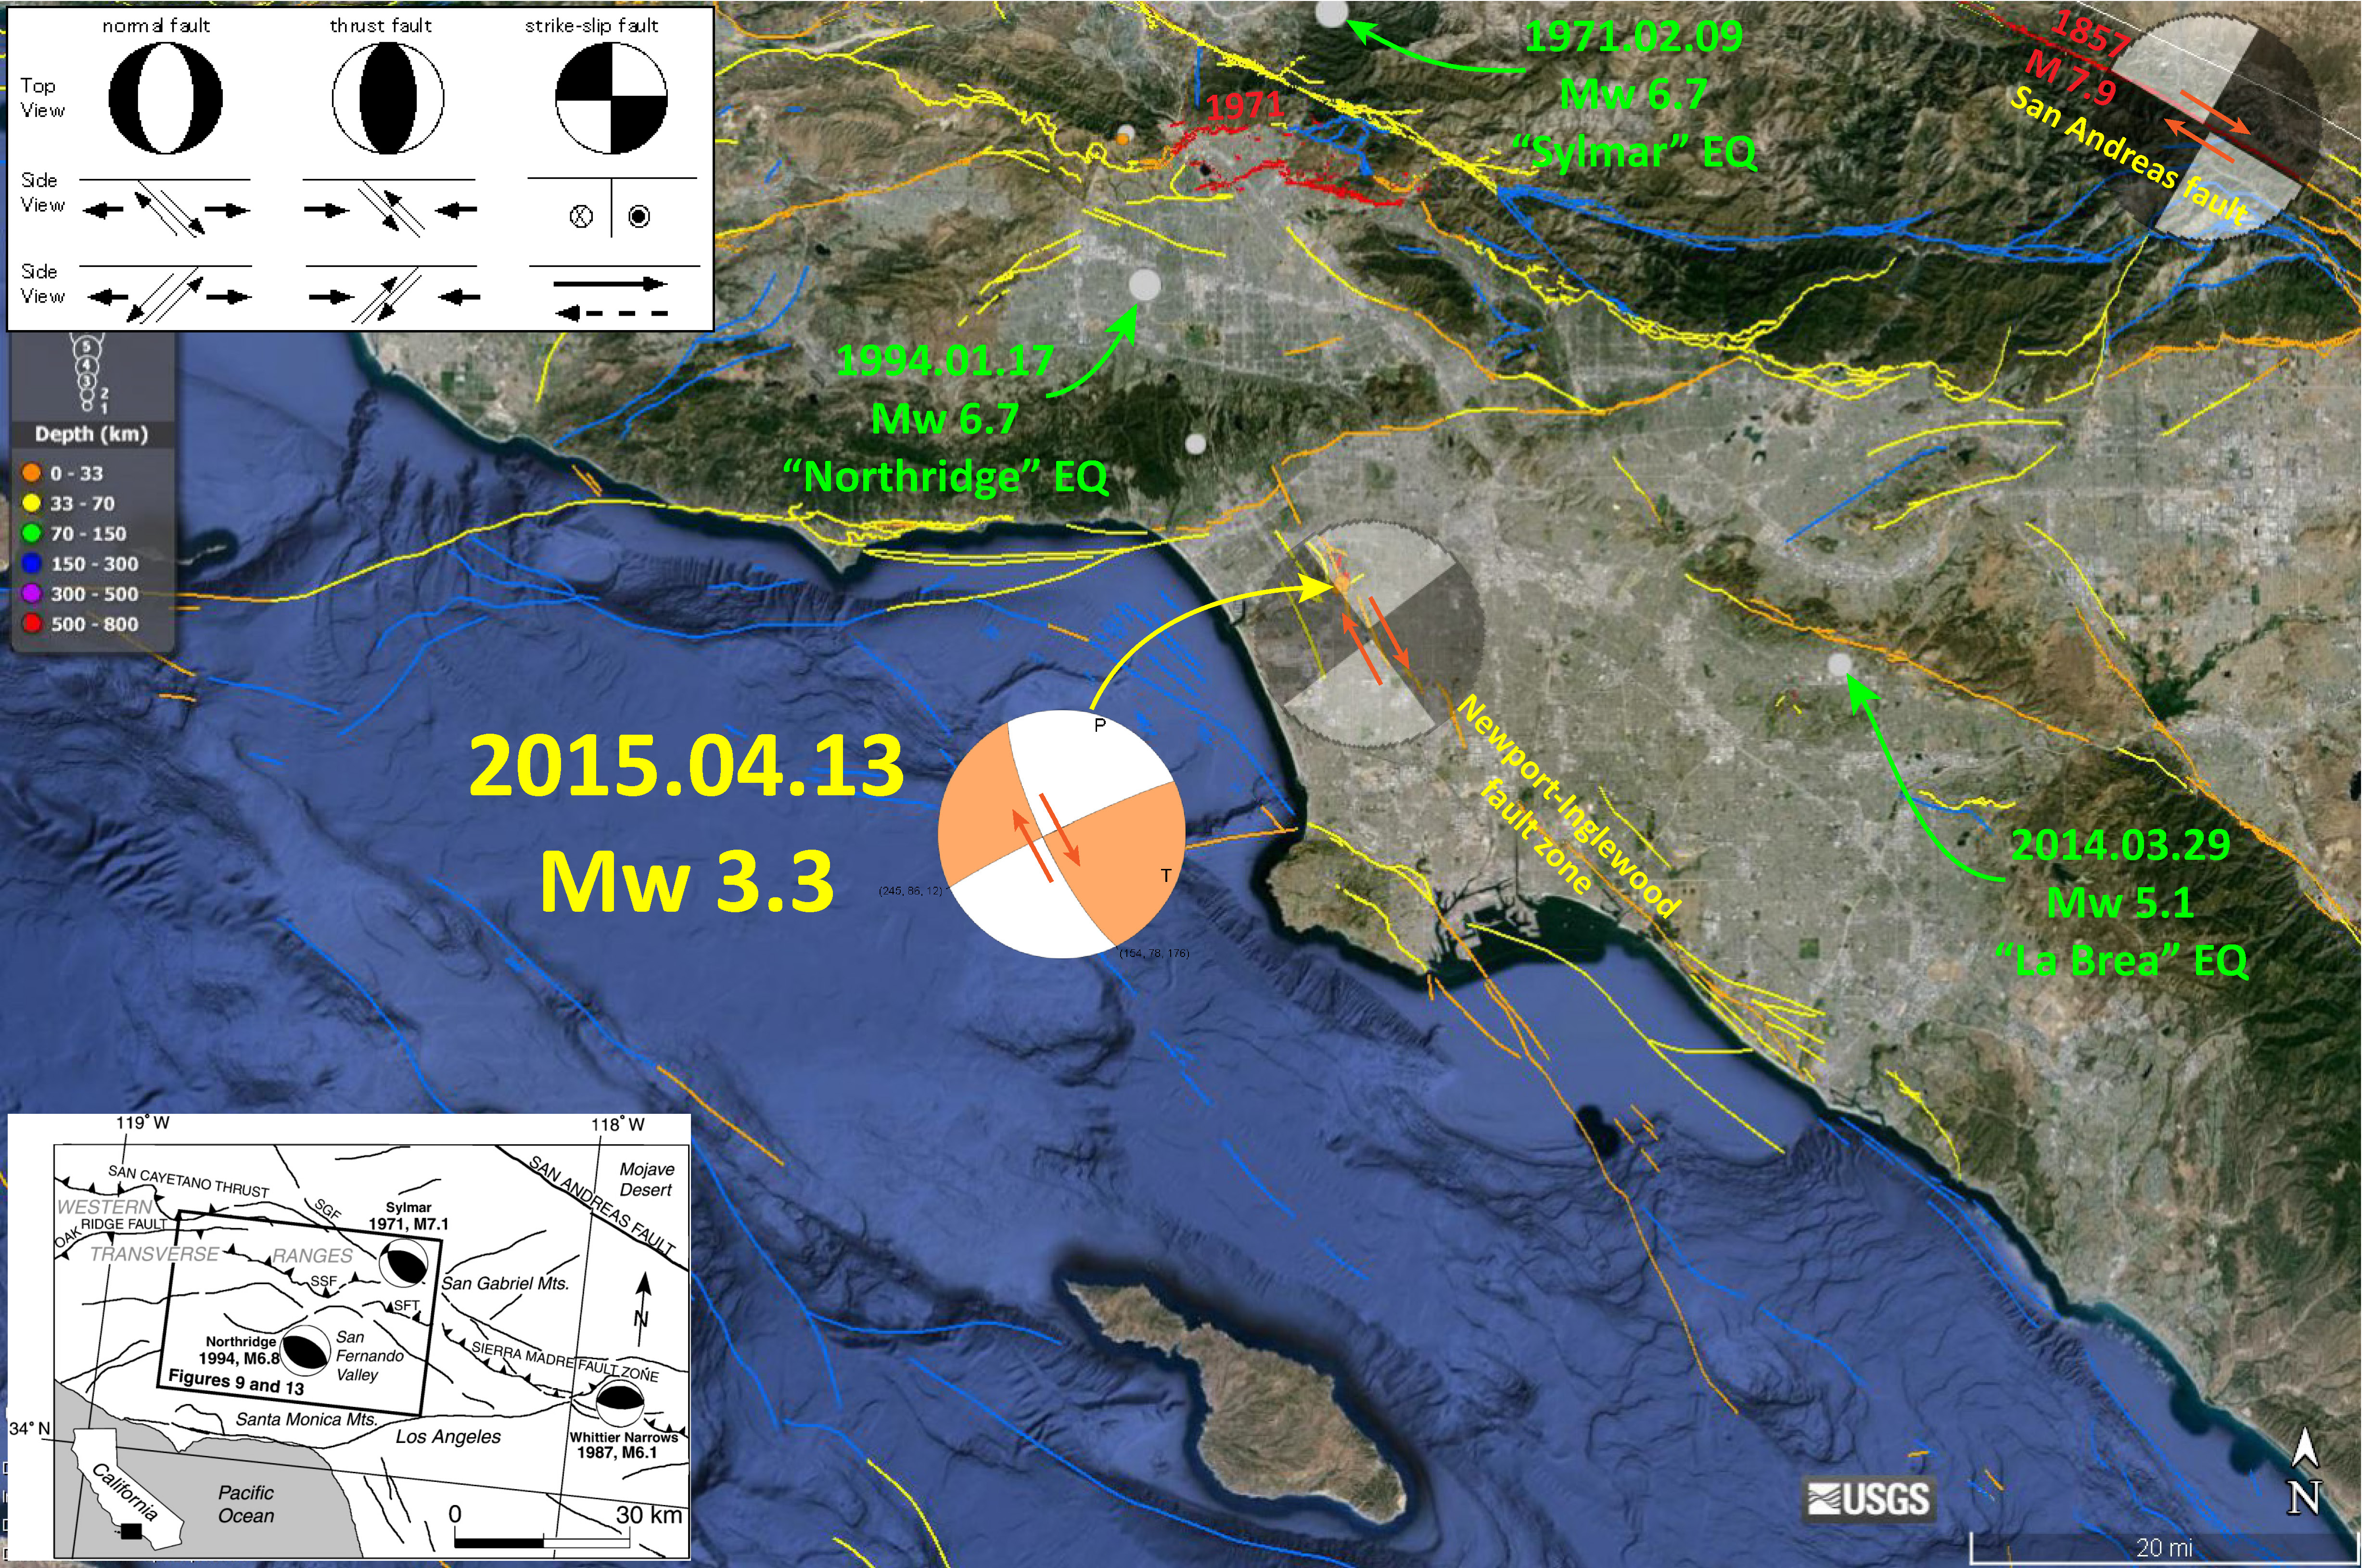
Below is a map that I put together for this earthquake. I have highlighted several other significant earthquakes in the region as well (1971, 1994, 2014). The focal mechanism for the Mw 3.3 is plotted in orange and white. There is an explanatory legend for interpreting focal mechanism and moment tensor plots (in the upper left corner). These graphical solutions provide two potential fault orientations and it takes someone to interpret which fault is the correct solution (with data or simply a fault map of the region). I place a semi-transparent generic b&w focal mechanism to show the sense of motion on the Newport-Inglewood fault zone in the region of this earthquake. The NI fault system is a right-lateral strike-slip fault system that runs sub-parallel to the similarly right-lateral strike-slip San Andreas transform plate boundary fault system.
I also placed a semi-transparent focal mechanism plot over the San Andreas fault in the upper right corner of the map. The faults are from the USGS fault and fold database (this and other google ™ kml files are freely online here). The red faults are faults that have ruptured historically. The red portion of the San Andreas fault shows the southern limit of the 1857 M 7.9 earthquake. The other red fault in this region is from the surface rupture of the 1971 Sylmar earthquake. Here is the USGS web page for the Sylmar earthquake. This earthquake ruptured through a hospital and led to several deaths. Due to this catastrophe, the Alquist-Priolo law was passed so that people won’t build hospitals (and other buildings) across earthquake faults. There is lots more on the A-P law, but I will leave that for another post.

I also plot the epicenter of the 1994 Northridge earthquake. Here is the USGS web page for this earthquake. This earthquake ruptured a blind thrust fault in the San Ferndando Valley Basin. Since there was no surface rupture, there is no red fault line. This fault was not known of prior to the earthquake (mostly because it was blind, it did not reach the ground surface). This earthquake led to a new search for fault hazards that had previously been under appreciated.
Finally, I plot the La Brea Mw 5.1 earthquake epicenter. Here is the USGS web page for this earthquake. This earthquake was particularly well responded to in the southland and on social media. My family lives within blocks of the epicenter and the children of the house were very jittery for each aftershock. I have posted about this earthquake before here, here, here, and here. The Southern Earthquake Research Center produced some educational material about this earthquake and I posted their animations here and here.
In the lower left corner is a map from Carena and Suppe (2002), which shows the focal mechanisms for the 1994 and 1971 earthquakes. There also is a plot of the map view for their 3-D fault mapping investigation (what their 2002 paper is about). If you want to learn about how that fault was located, read that paper!
This is a map showing the response from people who felt the earthquake. Even though it was a small earthquake, it was felt over a broad area. This map uses the Modified Mercalli Intensity scale. This is an assessment of the shaking intensity (different from earthquake magnitude, which relates to the amount of energy released during the earthquake).

In comparison, here is the “Did you Feel It” map for the 1971 and 1994 earthquakes, respectively.
1971

1994

This plot shows how the energy attenuates with distance from the epicenter of the Mw 3.3 earthquake.

Also, for comparison, here are the attenuation plots for these two other earthquakes.
1971

1994

-
References:
- Carena, S. and Suppe, J., 2002. Three-dimensional imaging of active structures using earthquake aftershocks: the Northridge thrust, California: Journal of Structural Geology, v. 24, p. 887-904.
4 thoughts on “Earthquake in the Baldwin Hills (Los Angeles)”