Early this morning, there was a M 3.5 earthquake that was widely felt across southern California. It is a good reminder for people to prepare for the potential of larger earthquakes in this region. The last earthquake of significant magnitude was the 2014.03.28 M = 5.1 La Habra earthquake. Here is my first earthquake report for that earthquake and here is an update with more interpretations. This earthquake happened a day after the 50th anniversary of the 1964 Good Friday Earthquake. Here is the USGS web page for today’s M = 3.5 earthquake.
Today’s earthquake did not rupture a previously mapped fault, but is close to the right-lateral strike-slip fault system to the north, the San Gabriel fault. This SGF has a slip rate of about 1-5 mm/yr. The USGS has a web page summarizing information about the SGF here. Today’s earthquake occurred near the 1971 Sylmar earthquake, which was a compressional earthquake that caused significant damage. The Sylmar quake led to the passage of the Alquist-Priolo Law, which until recently was not funded.
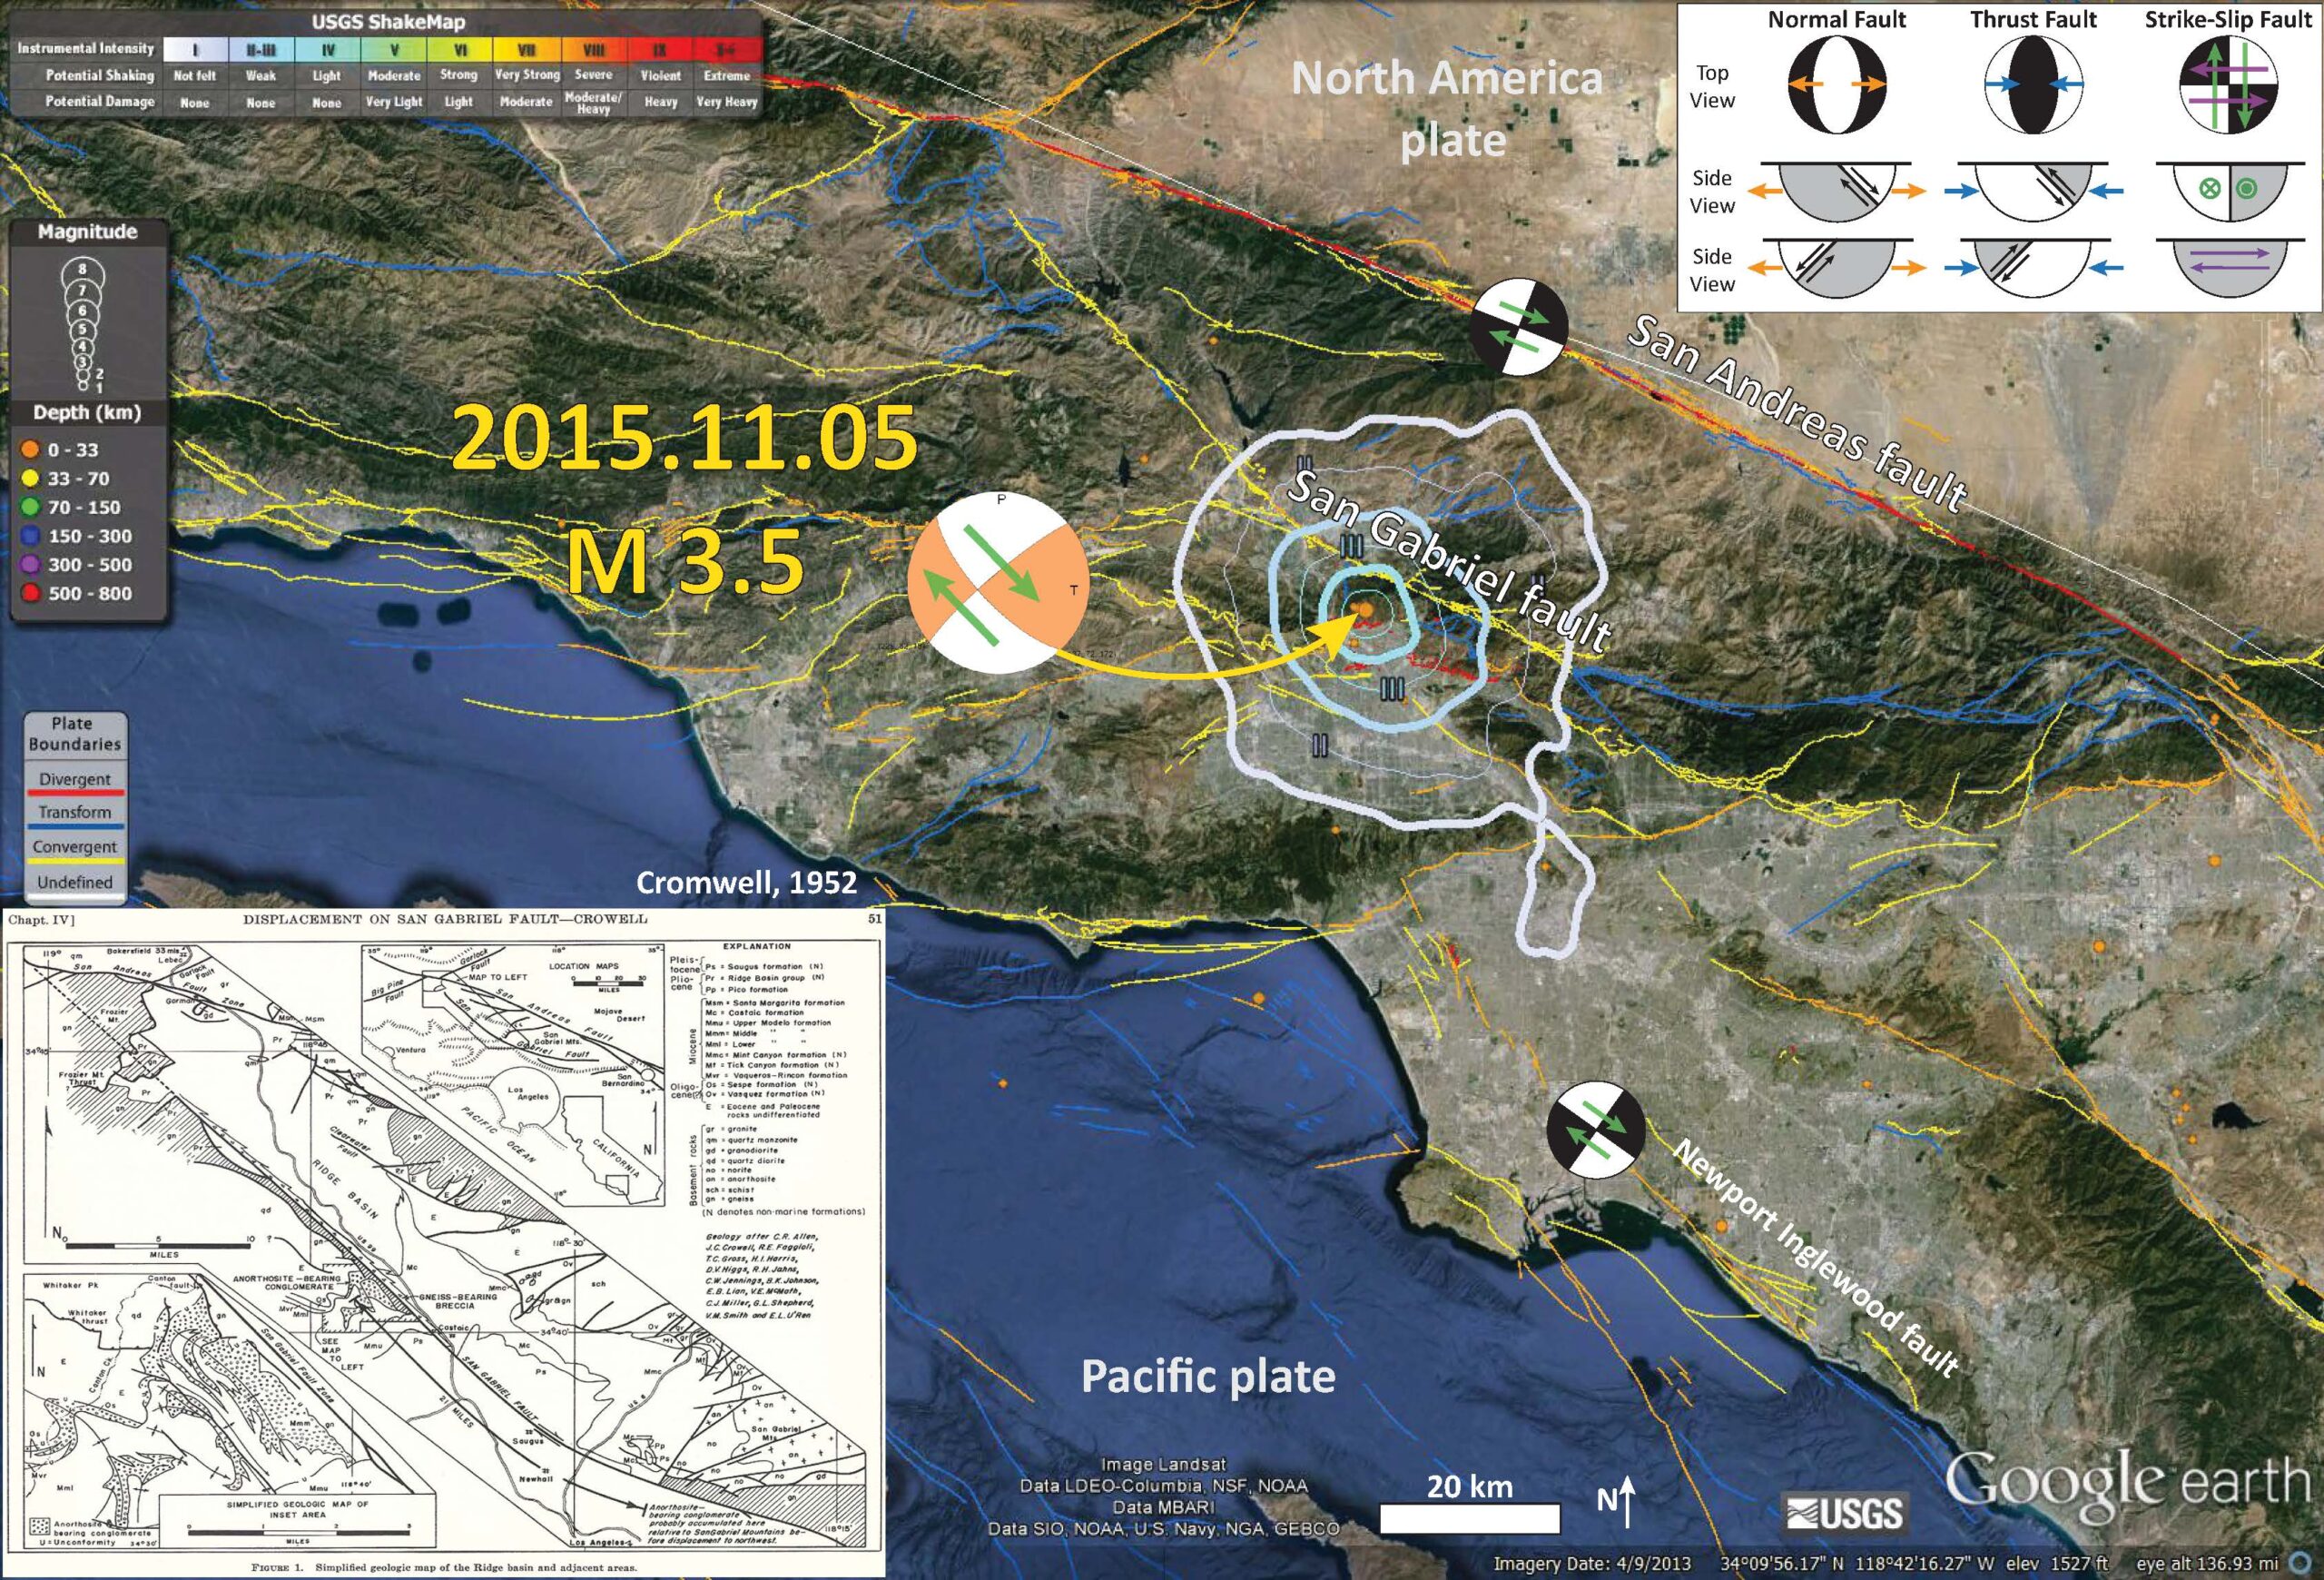
Here is a map that shows the epicenter as an orange dot (representing depth, which is really shallow). I plot the shaking intensity contours, using the Modified Mercalli Intensity Scale (MMI), with a legend in the upper left corner. The MMI is based upon people’s observations of ground shaking and damage. It is a qualitative scale, but is really useful because it is based on real observations that often have a much more dense coverage than that provided by seismometers. I also place the USGS focal mechanism for this earthquake on the map. Based upon the nearby mapped faults, I interpret this earthquake as a right-lateral strike-slip earthquake. There is a map of the regional faulting associated with the San Gabriel fault system (Cromwell, 1952). More on the SGF can be found here and here (Beyer et al., 2009).
I placed a moment tensor / focal mechanism legend in the upper right corner of the map. There is more material from the USGS web sites about moment tensors and focal mechanisms (the beach ball symbols). Both moment tensors and focal mechanisms are solutions to seismologic data that reveal two possible interpretations for fault orientation and sense of motion. One must use other information, like the regional tectonics, to interpret which of the two possibilities is more likely.

Here is that Cromwell (1952) map alone.

This map shows how widely felt this M 3.5 earthquake was. These results are based upon the USGS “Did You Feel It?” website. The colors match the MMI contours in my map above.

Here is the USGS shakemap for comparison. This map is based upon modeling of ground motions using Ground Motion Prediction Equations (GMPEs, or attenuation relations). GMPEs are empirical relations between earthquake magnitude, distance to the fault, type of earthquake, type of crust, type of earth that the seismic waves are propagating through, etc.

Here is a comparison between the modeled ground motions and the observed ground motions (the above two maps). The orange line represents the GMPE model output and the blue dots are the data from real person’s observations as reported to USGS. There is a moderate fit to the modeled data, albeit imperfect. This earthquake magnitude is small, so there are more earthquakes that provide the empirical relations for this size of an earthquake. The misfit for some of the blue data points may be attributed to site conditions (where the obervers were located). Perhaps the people who made those reports live in a sedimentary basin or on a ridge top, both of which can amplify the ground motions.

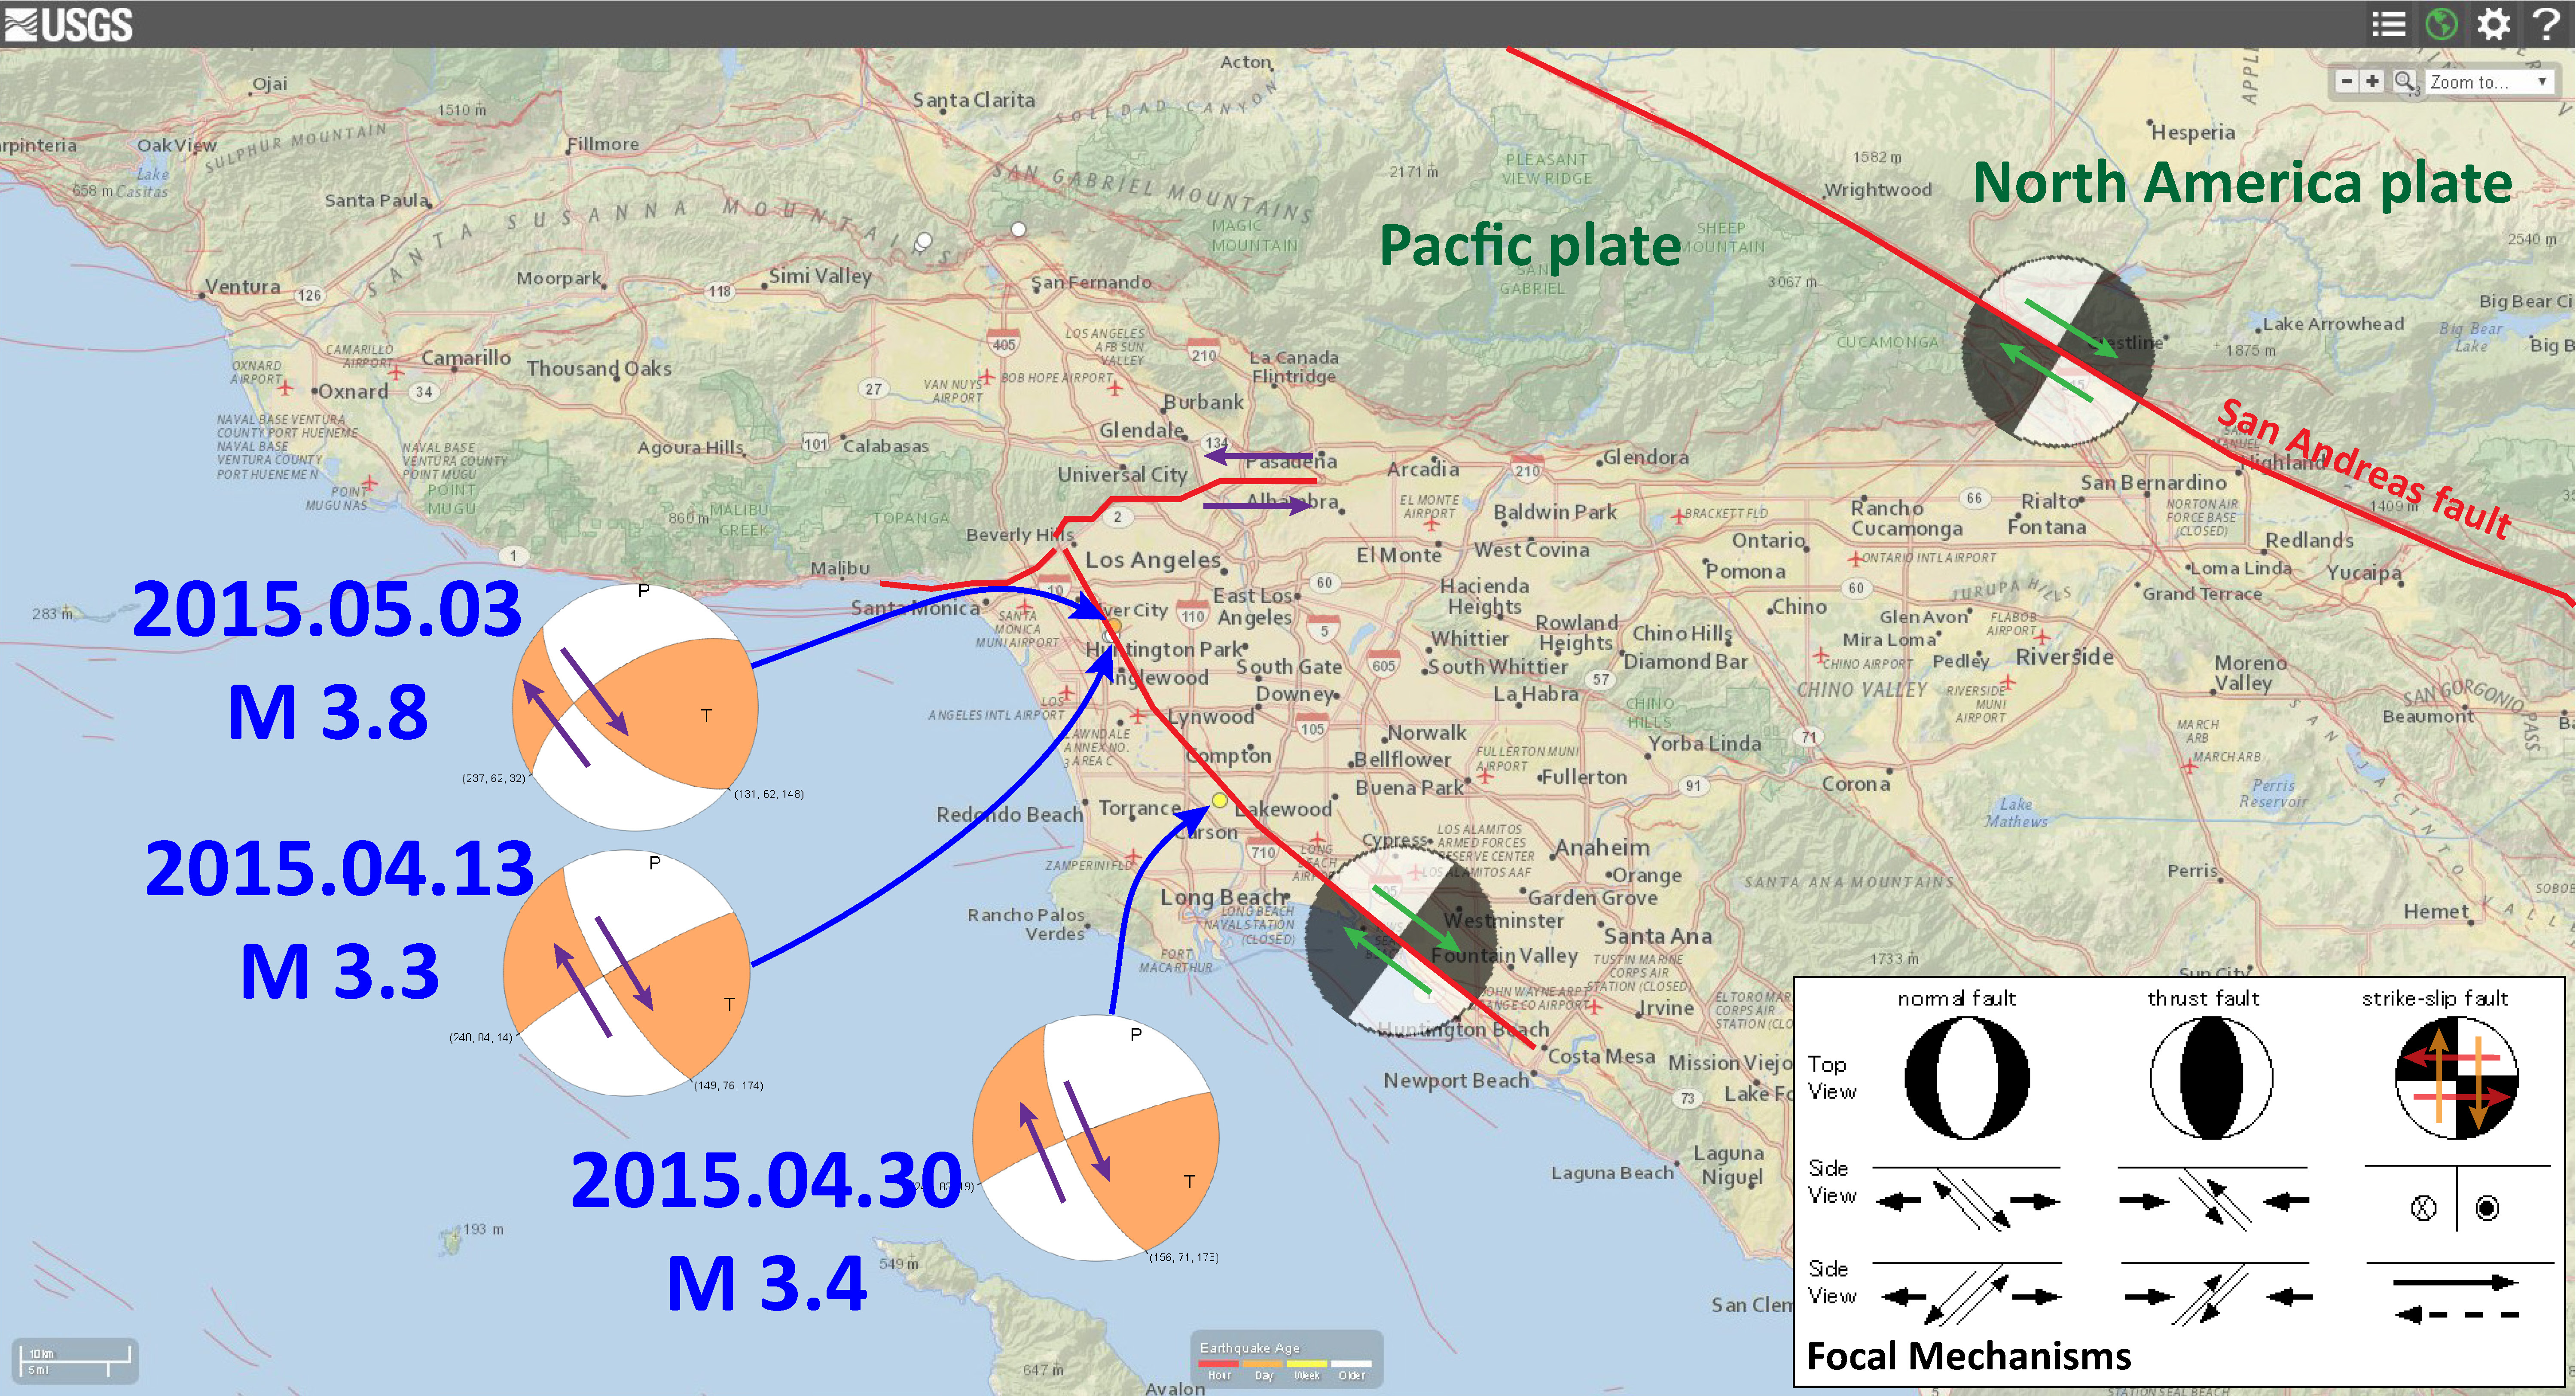
In April 2015, there was some activity along the Newport Inglewood fault, another right lateral strike slip fault system in the Los Angeles Basin. Here is an earthquake report for that series of earthquakes. Below is a map from that earthquake series.
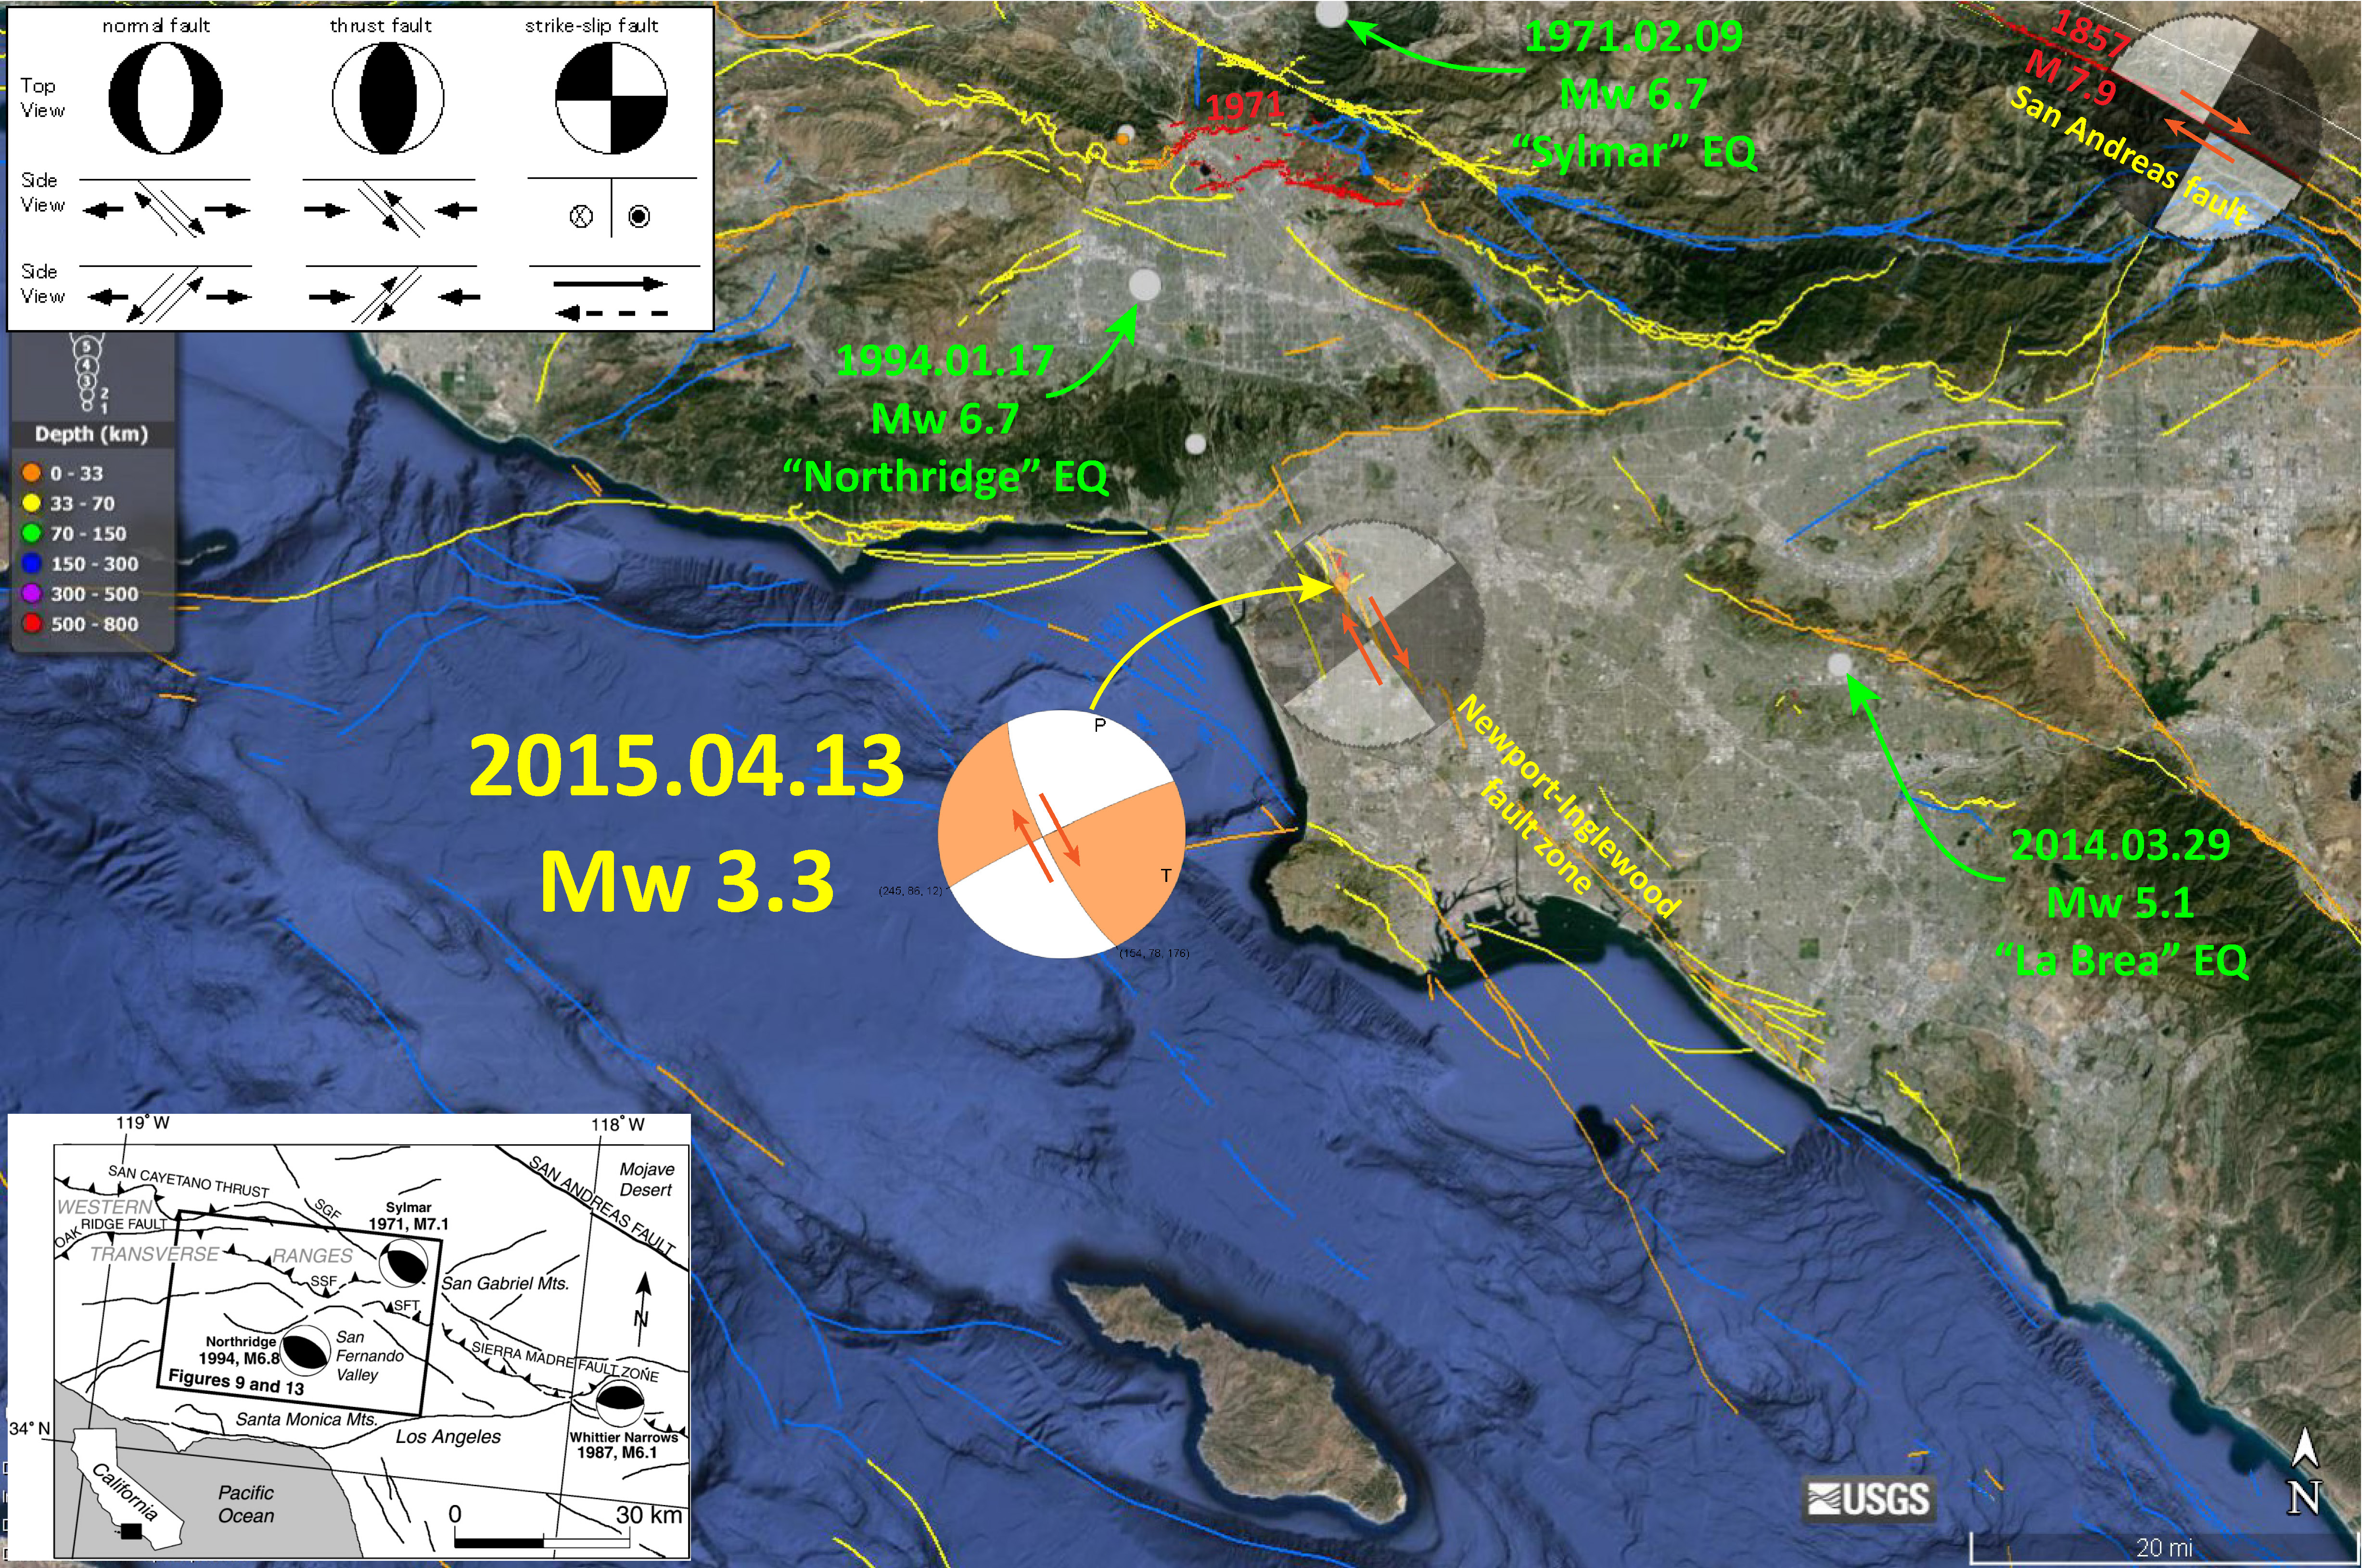
Here is a map that shows several of the significant earthquakes that I have mentioned above. I originally posted this on this earthquake report from April 2015.
-
References:
- Beyer, L.A., McCulloh, T.H., Denison, R.E., Morin, R.W., Enrico, R.J., Barron, J.A., and Fleck, R.J., 2009, Post-Miocene right separation on the San Gabriel and Vasquez Creek Faults, with supporting chronostratigraphy, western San Gabriel Mountains, California: U.S. Geological Survey Professional Paper 1759, 44 p.
- Crowell, J.C., 1952, Probable large lateral displacement on San Gabriel fault, southern California: Am. Assoc. Petroleum Geologists Bull., vol. 35, pp. 2026-2035.