This morning (my time) there was a possibly shallow earthquake in western Iran with a magnitude of M = 6.3. This earthquake occurred in the aftershock zone of the 2017.11.12 M 7.3 earthquake. Here is my report for the M 7.3 earthquake. Here are the USGS webpages for the M 6.3 and M 7.3 earthquakes.
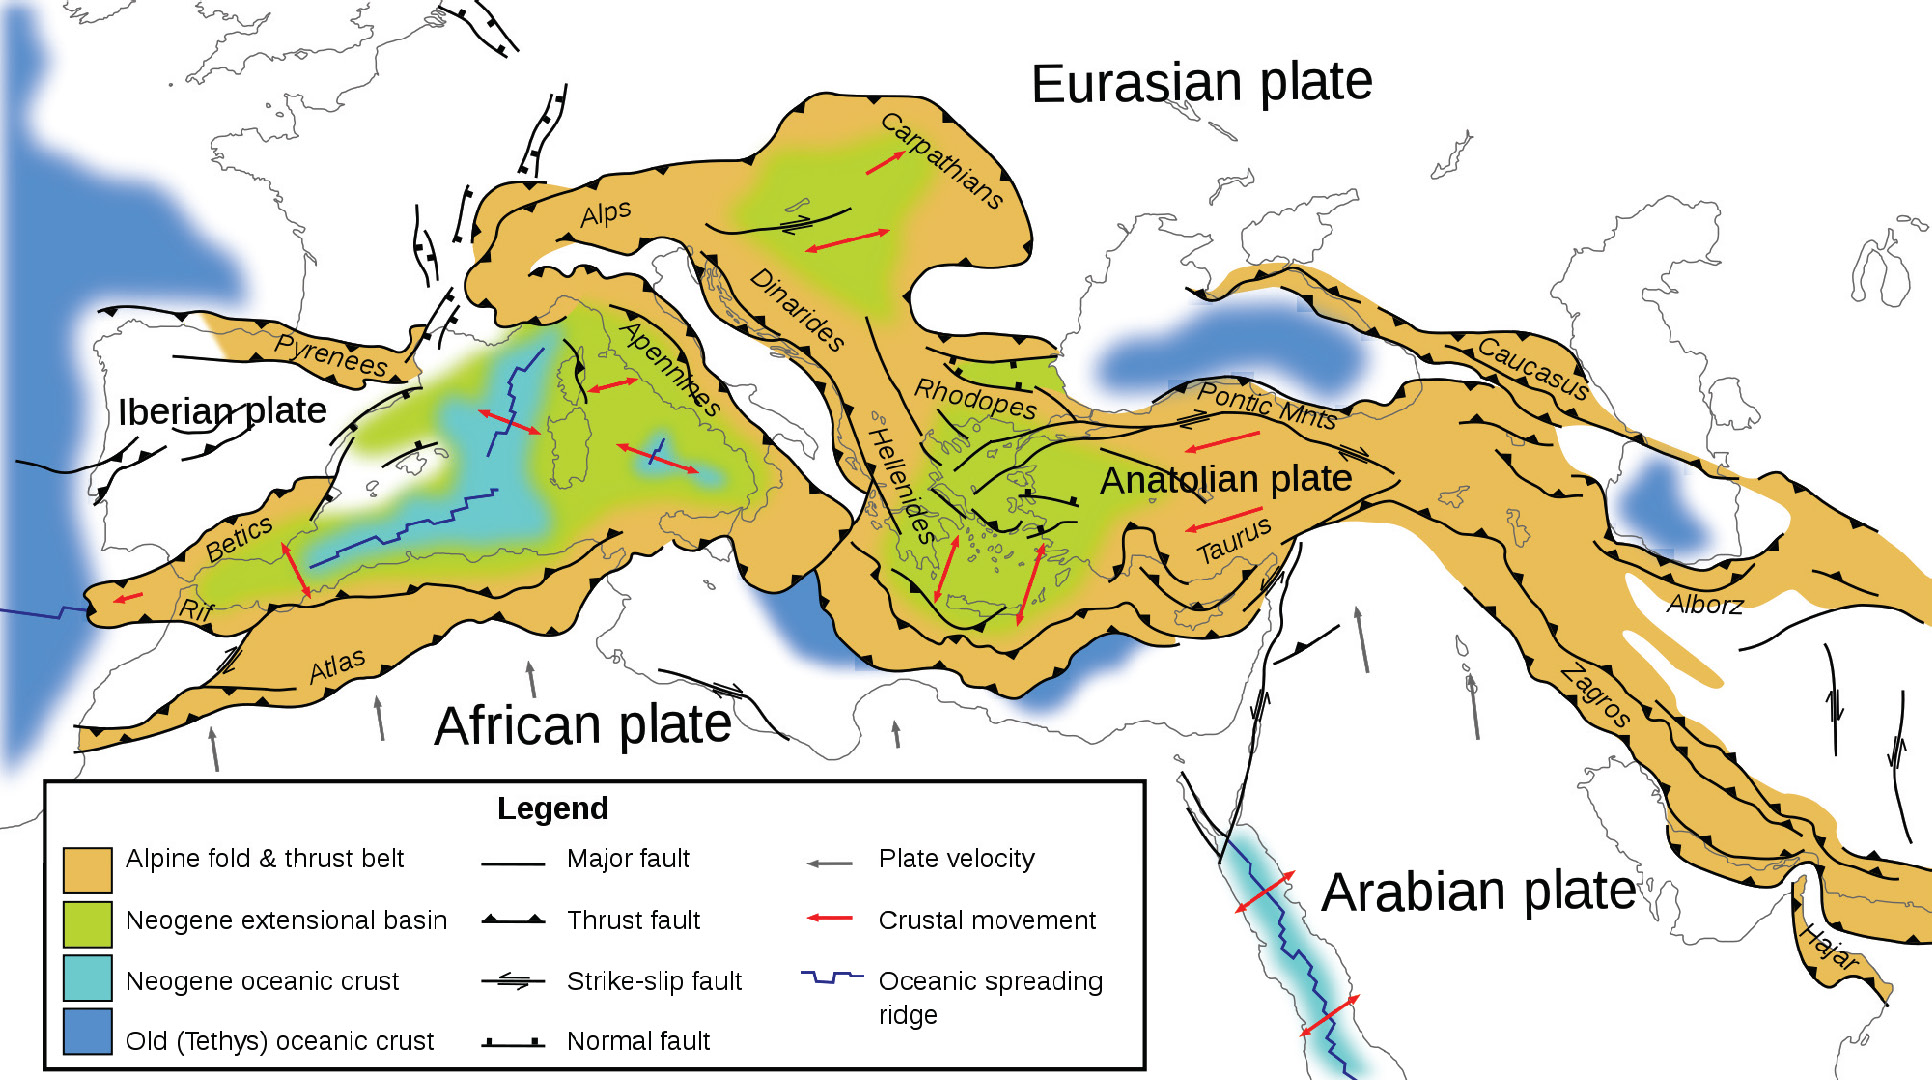
The M 7.3 earthquake was a reverse/thrust earthquake associated with tectonics of the Zagros fold and thrust belt. This plate boundary fault system is a section of the Alpide belt, a convergent plate boundary that extends from the west of the Straits of Gibraltar, through Europe (causing uplift of the Alps and subduction offshore of Greece), the Middle East, India (causing the uplift forming the Himalayas), then to end in eastern Indonesia (forming the continental collision zone between Australia and Indonesia).
Some of the earthquakes (including this one) are strike-slip earthquakes (see explanation of different earthquake types below in the geologic fundamentals section). So, one might ask why there are strike-slip earthquakes associated with a compressional earthquake?
As pointed out by Baptiste Gombert, these strike-slip earthquakes are are evidence of strain partitioning. Basically, when relative plate motion (the direction that plates are moving relative to each other) is not perpendicular or parallel to a tectonic fault, this oblique motion is partitioned into these perpendicular and parallel directions.
A great example of this type of strain partitioning is the plate boundary offshore of Sumatra where the India-Australia plate subducts beneath the Sunda plate (part of Eurasia). The plate boundary is roughly N45W (oriented to the northwest with an azimuth of 325°) and the relative plate motion direction is oriented closer to a north-south orientation. The relative plate motion perpendicular to the plate boundary is accommodated by earthquakes on the subduction. These earthquakes are oriented showing compression in a northeast direction. Along the axis of Sumatra is a huge strike-slip fault called the Great Sumatra fault. This fault is parallel to the plate boundary and accommodates relative plate motion parallel to the plate boundary. The Great Sumatra fault is a fault called a forearc sliver fault.
There are other examples of this elsewhere, like here in western Iran/eastern Iraq. Relative plate motion between the Arabia and Eurasia plates is oriented north-south, but the plate boundary is oriented northwest-southeast (just like the Sumatra example). So this oblique relative plate motion is partitioned into fault normal compression (the M 7.3 earthquake) and fault parallel shear (today’s M 6.3 earthquake).
There is also a strike-slip fault in the region of today’s M 6.3, the Khanaqin fault. So, given what we know about the tectonics and historic seismicity, I interpret today’s M 6.3 earthquake to have been a strike-slip earthquake associated with the Khanaqin fault, triggered by changes in stress by the M 7.3 earthquake. I could be incorrect and this earthquake could be unrelated to the > 7.3 earthquake.
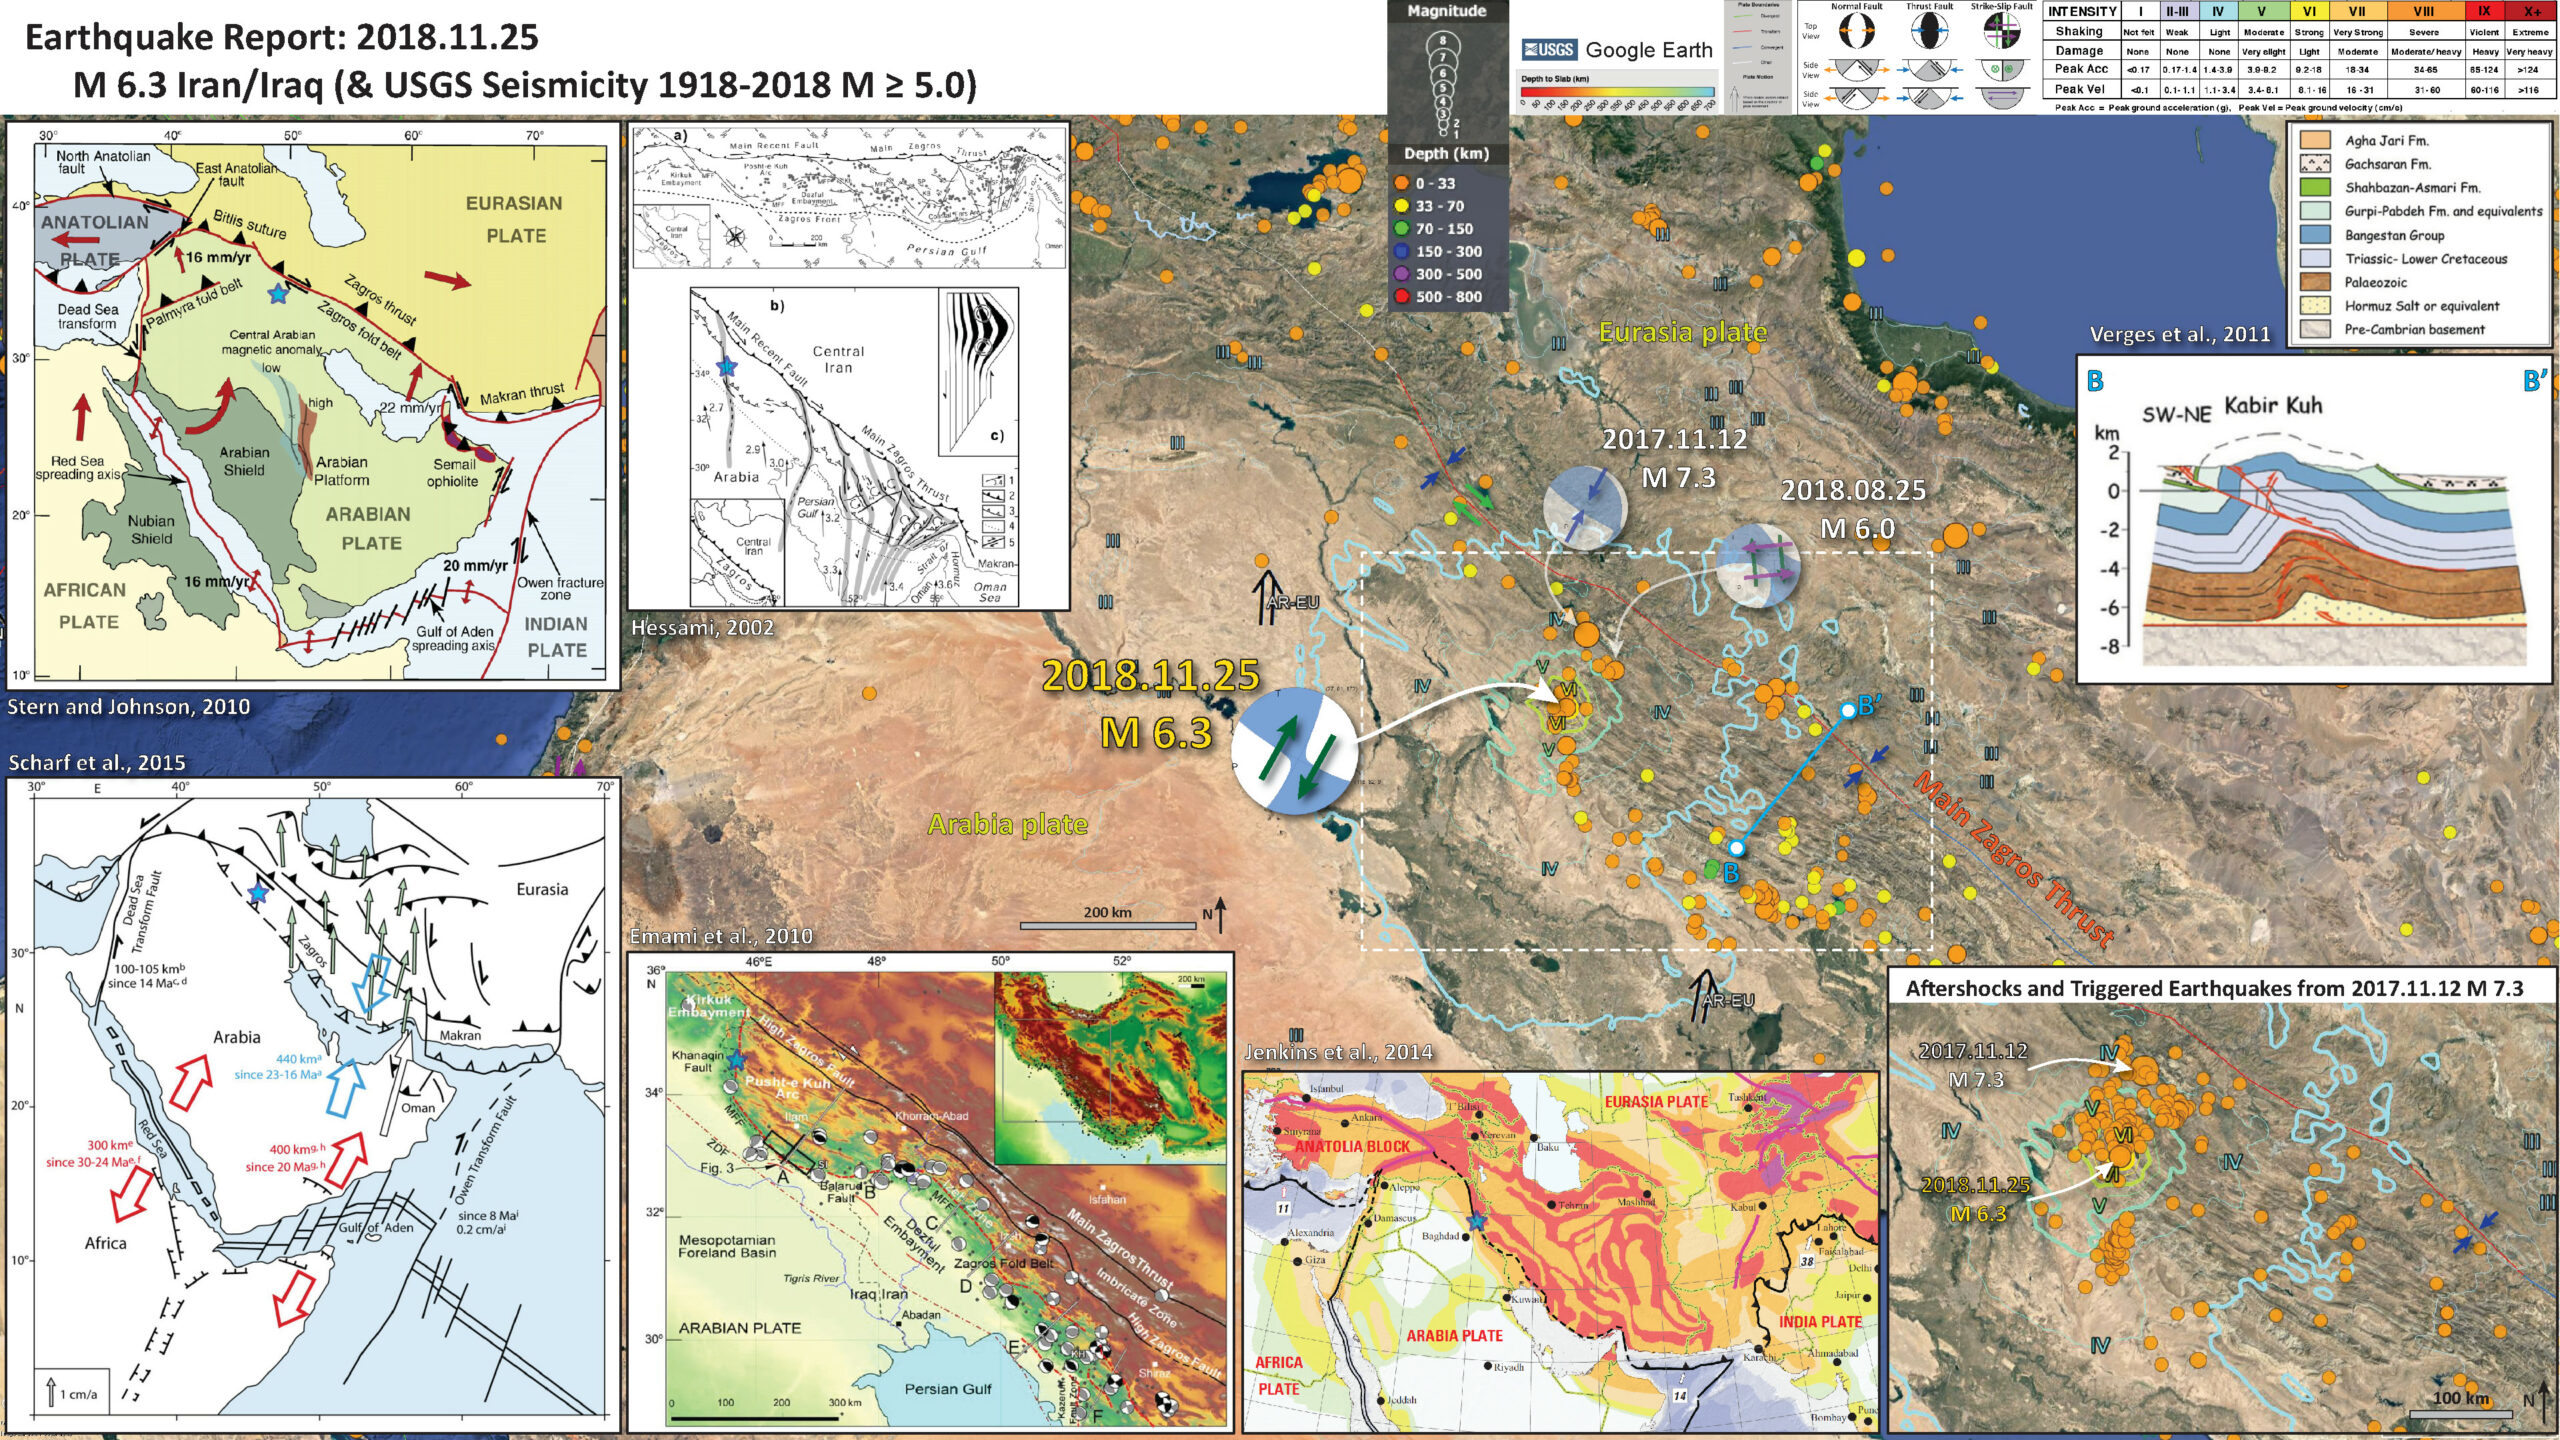
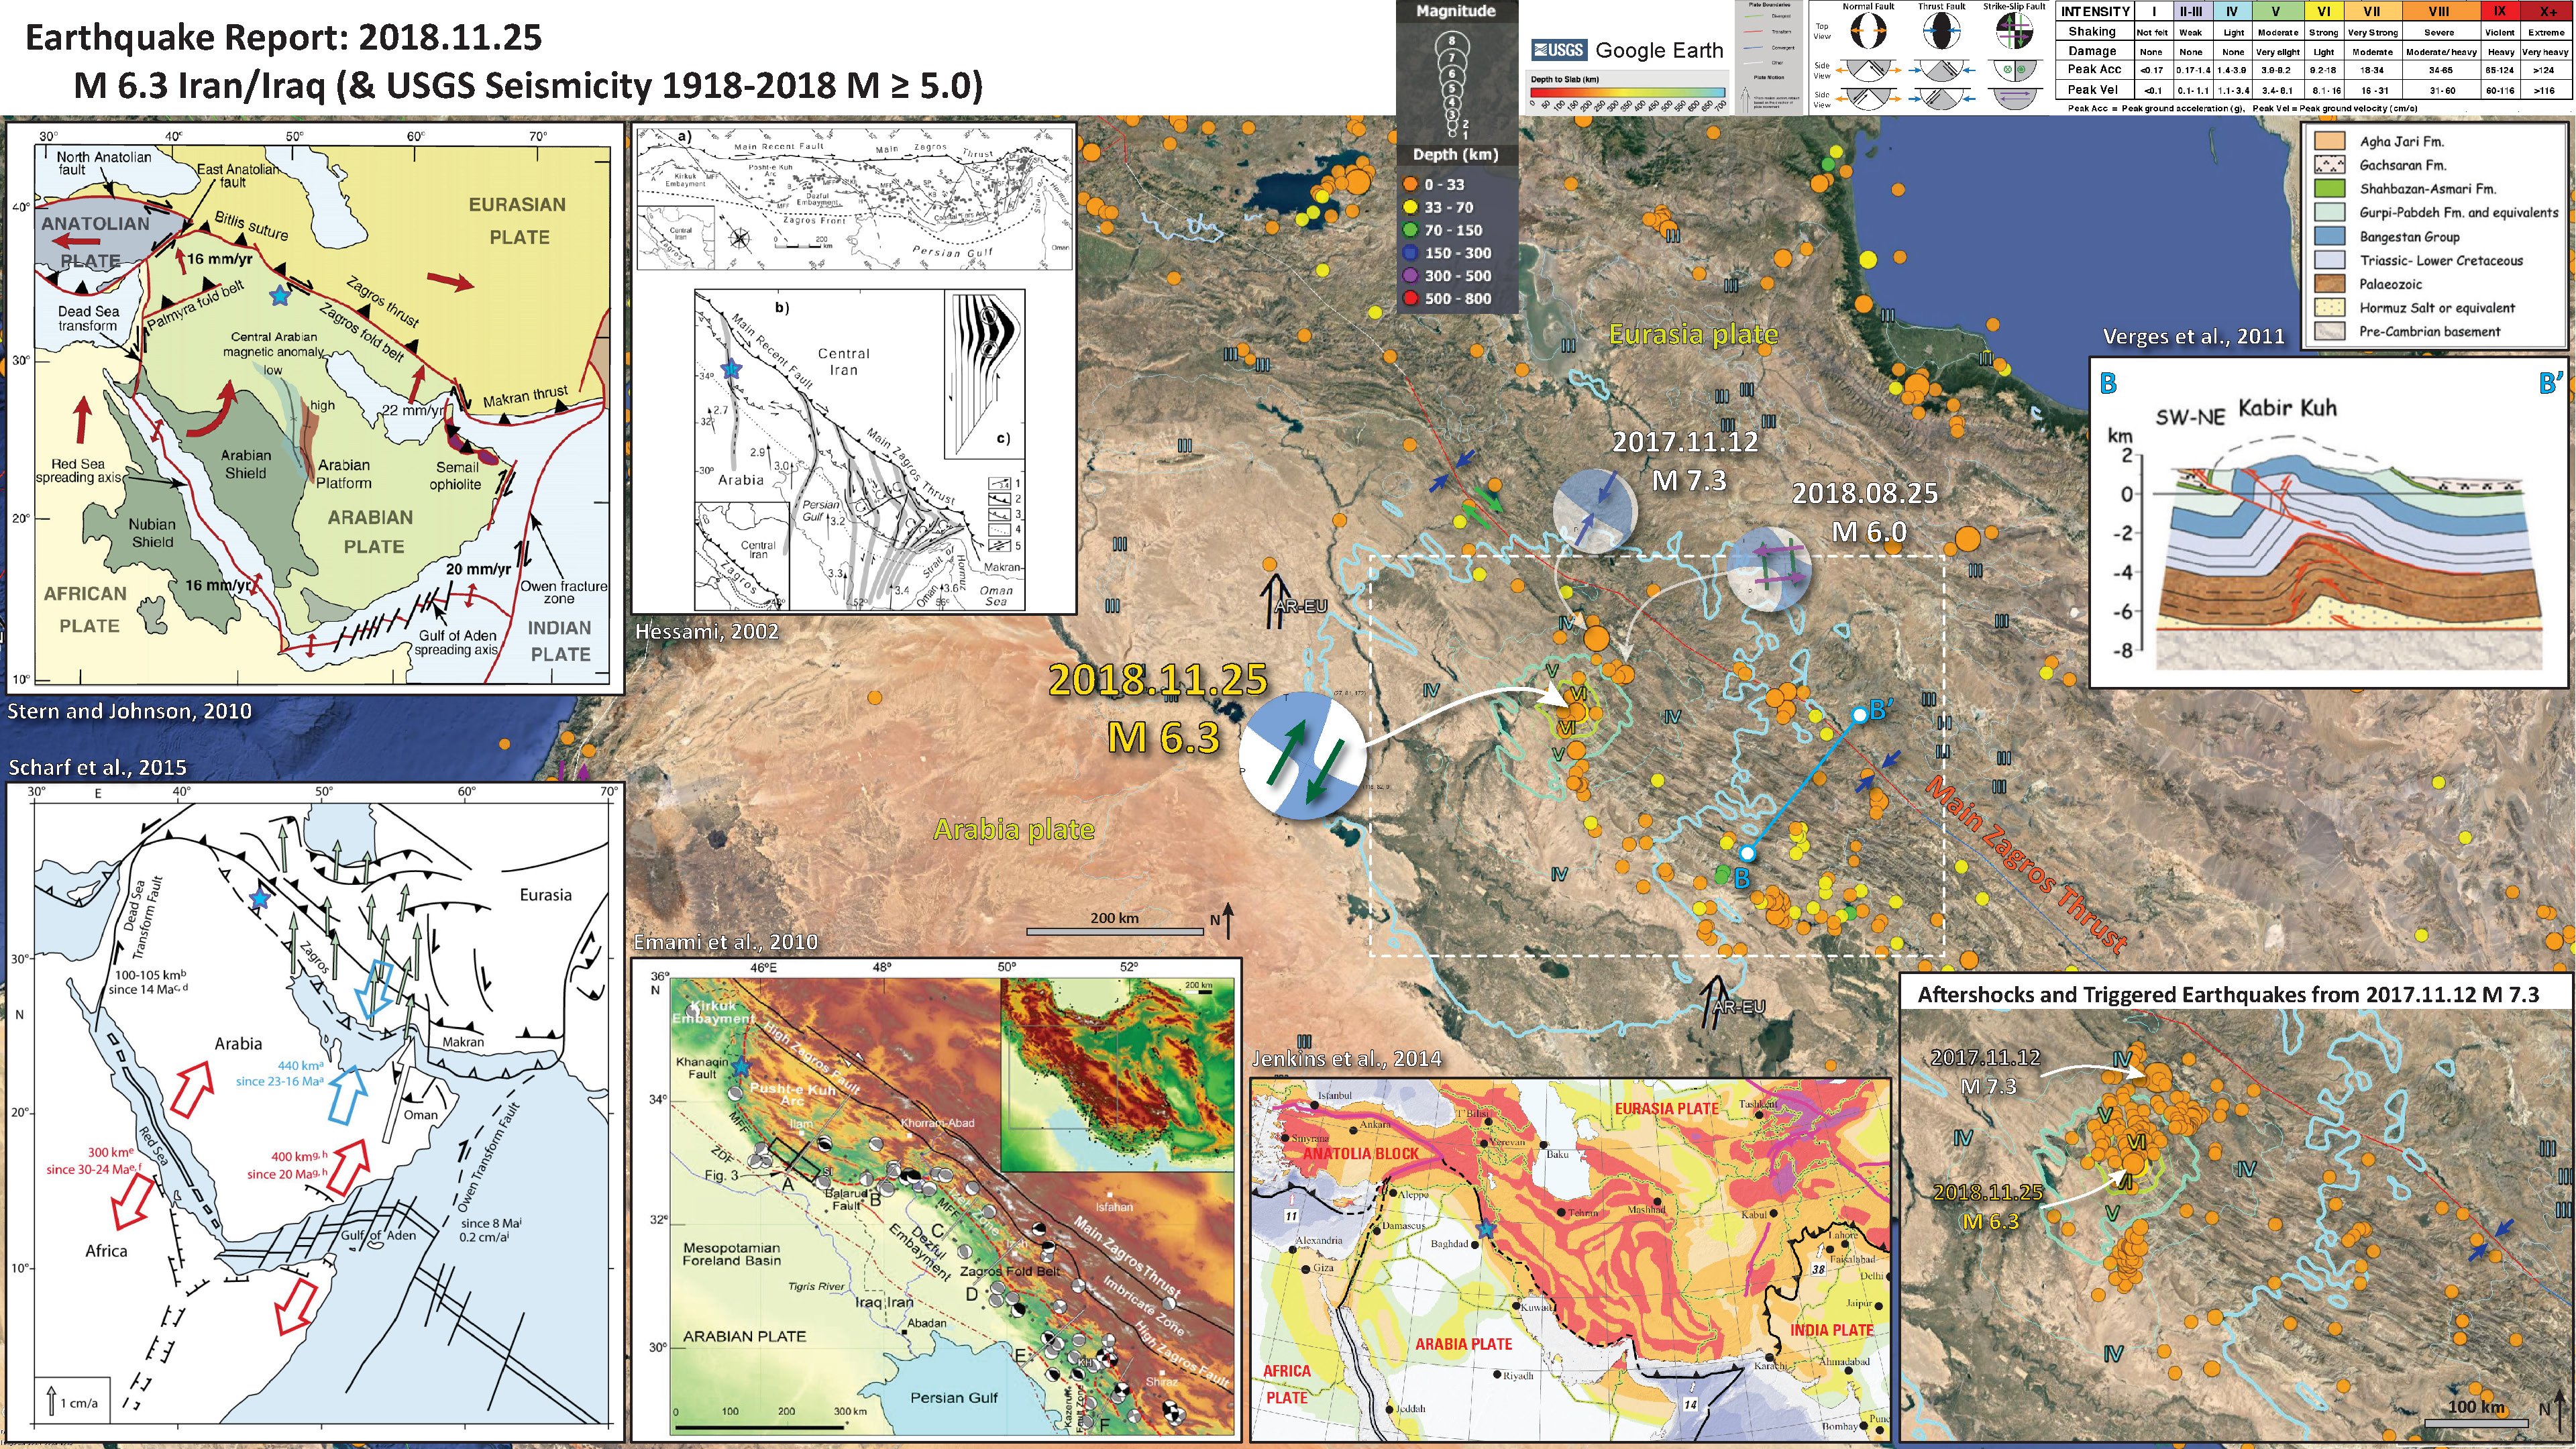
Below is my interpretive poster for this earthquake
I plot the seismicity from the past month, with color representing depth and diameter representing magnitude (see legend). I include earthquake epicenters from 1918-2018 with magnitudes M ≥ 5.0 in one version.
I include an inset map showing seismicity from 2016.11.22 through 2018.11.28 showing the aftershocks from the M 7.3 earthquake. Note the cluster of earthquakes to the south of the aftershock zone. This is a swarm with earthquakes in the lower to mid M 5 range. The earthquakes with mechanisms are compressional, oriented the same as the M 7.3.
I plot the USGS fault plane solutions (moment tensors in blue and focal mechanisms in orange), possibly in addition to some relevant historic earthquakes.
- I placed a moment tensor / focal mechanism legend on the poster. There is more material from the USGS web sites about moment tensors and focal mechanisms (the beach ball symbols). Both moment tensors and focal mechanisms are solutions to seismologic data that reveal two possible interpretations for fault orientation and sense of motion. One must use other information, like the regional tectonics, to interpret which of the two possibilities is more likely.
- I also include the shaking intensity contours on the map. These use the Modified Mercalli Intensity Scale (MMI; see the legend on the map). This is based upon a computer model estimate of ground motions, different from the “Did You Feel It?” estimate of ground motions that is actually based on real observations. The MMI is a qualitative measure of shaking intensity. More on the MMI scale can be found here and here. This is based upon a computer model estimate of ground motions, different from the “Did You Feel It?” estimate of ground motions that is actually based on real observations.
- In the upper left corner is a map showing the regional plate boundary faults and some information about relative plate motions (Stern and Johnson, 2010). As for other inset figures, I plate a transparent cyan star in the general location of today’s M 6.3 earthquake.
- In the lower left corner is a similarly scaled tectonic map from Scharf et al. (2015) showing more information about the amount of plate motion in the Tertiary (post 66 Ma). Note the contrast of the extension (in red) associated with the rifting in east Africa and the convergence (in blue) associated with the Alpide belt in this area.
- In the upper right corner is a structural cross section showing the folding of the crust and rocks associated with the convergence at this plate boundary (Verges et al., 2011). I show the general location for this cross section on the map as a cyan line with balls on the ends.
- In the lower left center is a map from Emami et al. (2010). This map shows how this convergent plate boundary creates topography (uplift and mountains) with color. Lower elevations are shown as yellow and green and higher elevations are shown as red and brown. Note the location of the Khanaqin fault, a left-lateral strike slip fault..
- In the upper left center is a map showing a kinematic interpretation of the faulting in this area (Hessami, 2002). While the focus of this PhD dissertation is for the faulting in the southern Zagros system, they show relative plate motions and how the Khanaqin fault may accommodate this plate motion (oblique to Zagros).
- In the lower right corner is a map showing USGS seismicity from 2016.11.22 through 2018.11.25 for earthquakes M ≥ 3.0. The spatial extent of this area is shown in a dashed white rectangle on the main map.
- In the lower right center is the USGS seismic hazard map for the region (Jenkins et al., 2014).
I include some inset figures. Some of the same figures are located in different places on the larger scale map below.
- Here is the map with a month’s seismicity plotted.

- Here is the map with a century’s seismicity plotted for earthquakes M ≥ 5.0.
Other Report Pages
Some Relevant Discussion and Figures
- The Alpide Belt, shown in this map, is a convergent plate boundary that extends from Australia to Portugal. This map shows the westernmost extent of this system. The convergence here drives uplift of the Himalayas and the European Alps. Subduction along the Makran and Sunda subduction zones are also part of this system.
- Below is the tectonic map from Stern and Johnson (2010).

Simpli”ed map of the Arabian Plate, with plate boundaries, approximate plate convergence vectors, and principal geologic features. Note location of Central Arabian Magnetic Anomaly (CAMA).
- Here is the Scharf et al., 2015 map.

Tectonic setting of the Arabian Plate. Red and blue coloured symbols indicate divergence and convergence with overall amount and age, respectively. Green arrows show present-day GPS values with respect to fixed Europa from Iran [21] and white arrow from Oman [22]. a – [23]; b – [20]; c – [18]; d – [19]; e – [14]; f – [15]; g – [8]; h – [16]; i – [17]
- This is the Enami et al., 2010 figure.

Tectonic map of the Zagros Fold Belt showing the position and geometry of the Mountain Front Flexure (MFF). Earthquakes of M ≥ 5 are indicated by small black diamonds. Focal mechanisms from Talebian & Jackson (2004) are also shown, in black (Mw ≥ 5.3) and grey (Mw ≥ 5.3). KH, Khavir anticline; SI, Siah Kuh anticline; ZDF, Zagros Deformation Front.
- This is the tectonic map from Hessami, 2002.

a) Earthquakes with mb > 5.0 (Jackson and McKenzie, 1984) along seismogenic basement thrusts offset by major strike-slip faults. b) Schematic interpretative map of the main structural features in the Zagros basement. The overall north-south motion of Arabia increases along the belt from NW to SE (arrows with numbers). Central Iran acted as a rigid backstop and caused the strike-slip faults with N-S trends in the west to bulge increasingly eastward. Fault blocks in the north (elongated NW-SE) rotate anticlockwise; while fault blocks in the south (elongated NE-SW) rotate clockwise. c) Simple model involving parallel paper sheets illustrating the observed strike-slip faults in the Zagros. Opening between the sheets (i.e. faults) helped salt diapirs to extrude.
- Below are a series of figures from Verges et al., 2011. First is a map that shows the tectonics and locations of the cross section.

Tectonic map of the Zagros showing the location of the previously published cross-sections with the calculated amount of shortening and the extent of major hydrocarbon fields. The balanced cross-section is marked by the thick black line. M – Mand anticline. Dark grey: Naien-Baft ophiolites (Stöklin, 1968).
- Here are the cross sections from Verges et al. (2011).

Structural cross-sections showing the style of folding across the studied regional transect (see location in Fig. 3). (a) The front of the Zagros Fold Belt along the Anaran anticline above the Mountain Front Flexure (MFF in Emami et al. 2010); (b) the Kabir Kuh anticline, which represents a multi-detachment fold (Vergés et al. 2010); (c) folds developed in the Upper Cretaceous basinal stratigraphy showing much tighter and upright anticlines (modified from Casciello et al. 2009).
- Here is a map that displays an estimate of seismic hazard for the region (Jenkins et al., 2010). This comes from Giardini et al. (1999).
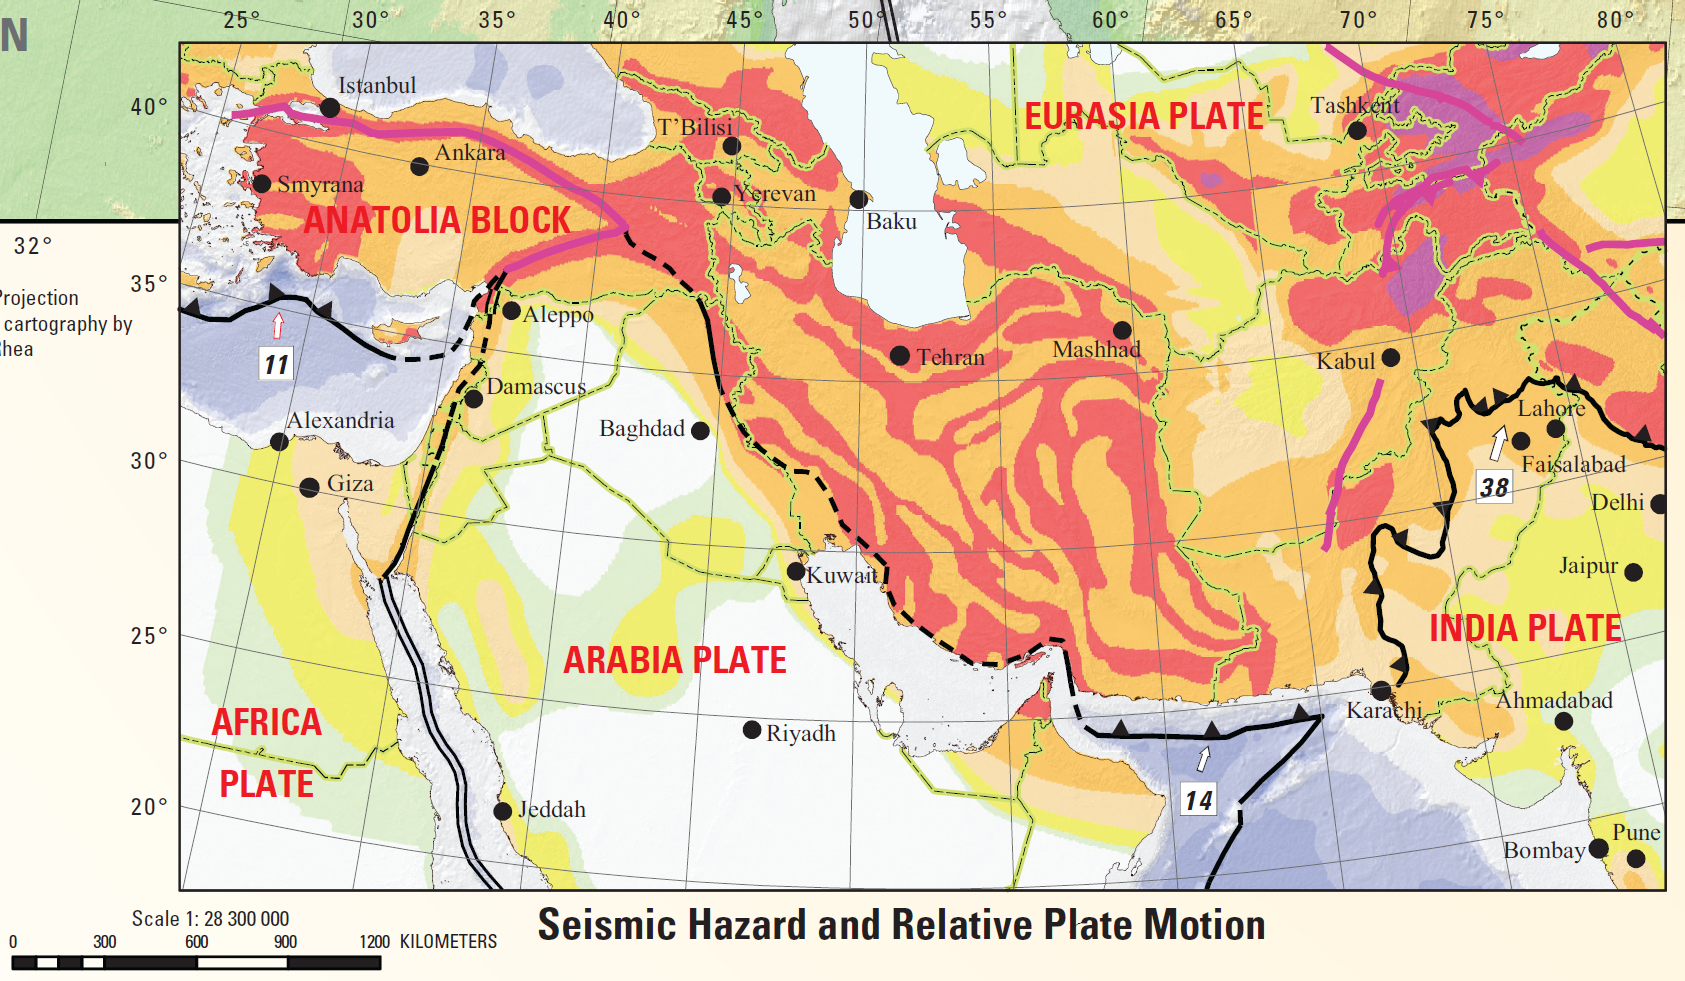
The Global Seismic Hazard Map. Peak ground acceleration (pga) with a 10% chance of exceedance in 50 years is depicted in m/s2. The site classification is rock everywhere except Canada and the United States, which assume rock/firm soil site classifications. White and green correspond to low seismicity hazard (0%-8%g), yellow and orange correspond to moderate seismic hazard (8%-24%g), pink and dark pink correspond to high seismicity hazard (24%-40%g), and red and brown correspond to very high seismic hazard (greater than 40%g).
- Just found this as it as posted to the Bertrand tweet (see social media below). This is a figure from Talebian and Jackson (2004) that uses Sumatra as an analogue to the oblique convergence along the Zagros thrust. Pretty cool.
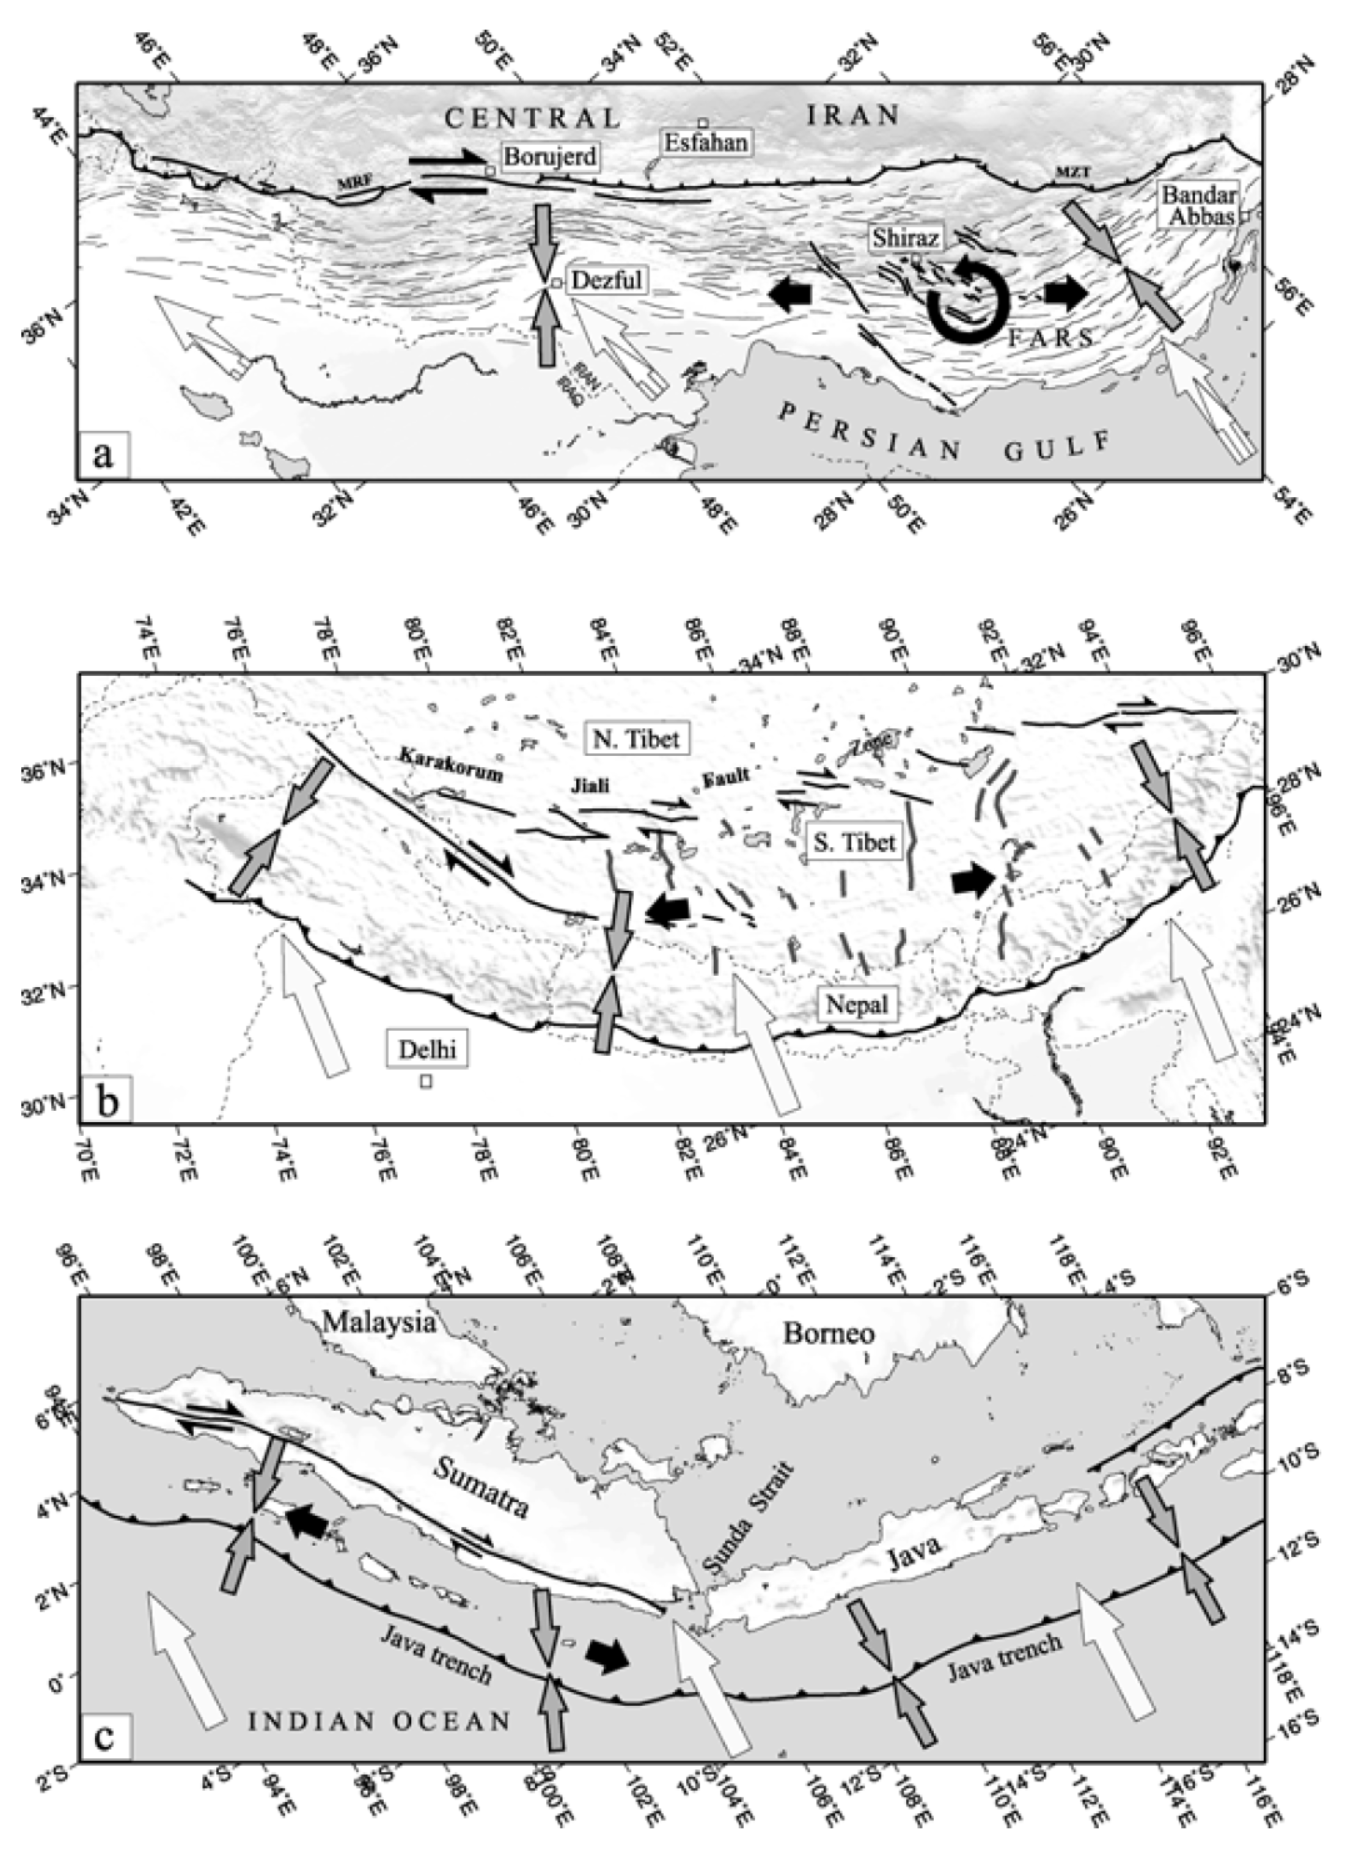
(a) Summary sketch of the tectonic pattern in the Zagros. Overall Arabia–Eurasia motions are shown by the big white arrows, as before. In the NW Zagros (Borujerd-Dezful), oblique shortening is partitioned into right-lateral strike-slip on the Main Recent Fault (MRF) and orthogonal shortening (large gray arrows). In the SE Zagros (Bandar Abbas) no strike-slip is necessary, as the shortening is parallel to the overall convergence. The central Zagros (Shiraz) is where the transition between these two regimes occurs, with anticlockwise rotating strike-slip faults allowing an along-strike extension (black arrows) between Bandar Abbas and Dezful. (b) A similar sketch for the Himalaya (after McCaffrey & N´abˇelek 1998). In this case the overall Tibet-India motion is likely to be slightly west of north. (The India-Eurasia motion is about 020◦, but Tibet moves east relative to both India and Eurasia: Wang et al. 2001). Thrust faulting slip vectors are radially outward around the entire arc (gray arrows). This leads to partitioning of the oblique convergence in the west, where right-lateral strike-slip is prominent on the Karakoram Fault, but no strike-slip in the east, where the convergence and shortening are parallel. The region in between extends parallel to the arc, on normal faults in southern Tibet. (c) A similar sketch for the Java–Sumatra arc, based on McCaffrey (1991). Slip partitioning occurs in the NW, with strike-slip faulting through Sumatra, but not in the SE, near Java. This change along the zone requires the Java–Sumatra forearc to extend along strike.
Geologic Fundamentals
- For more on the graphical representation of moment tensors and focal mechnisms, check this IRIS video out:
- Here is a fantastic infographic from Frisch et al. (2011). This figure shows some examples of earthquakes in different plate tectonic settings, and what their fault plane solutions are. There is a cross section showing these focal mechanisms for a thrust or reverse earthquake. The upper right corner includes my favorite figure of all time. This shows the first motion (up or down) for each of the four quadrants. This figure also shows how the amplitude of the seismic waves are greatest (generally) in the middle of the quadrant and decrease to zero at the nodal planes (the boundary of each quadrant).

- Here is another way to look at these beach balls.
The two beach balls show the stike-slip fault motions for the M6.4 (left) and M6.0 (right) earthquakes. Helena Buurman's primer on reading those symbols is here. pic.twitter.com/aWrrb8I9tj
— AK Earthquake Center (@AKearthquake) August 15, 2018
- There are three types of earthquakes, strike-slip, compressional (reverse or thrust, depending upon the dip of the fault), and extensional (normal). Here is are some animations of these three types of earthquake faults. The following three animations are from IRIS.
Strike Slip:
Compressional:
Extensional:
- This is an image from the USGS that shows how, when an oceanic plate moves over a hotspot, the volcanoes formed over the hotspot form a series of volcanoes that increase in age in the direction of plate motion. The presumption is that the hotspot is stable and stays in one location. Torsvik et al. (2017) use various methods to evaluate why this is a false presumption for the Hawaii Hotspot.
- Here is a map from Torsvik et al. (2017) that shows the age of volcanic rocks at different locations along the Hawaii-Emperor Seamount Chain.

A cutaway view along the Hawaiian island chain showing the inferred mantle plume that has fed the Hawaiian hot spot on the overriding Pacific Plate. The geologic ages of the oldest volcano on each island (Ma = millions of years ago) are progressively older to the northwest, consistent with the hot spot model for the origin of the Hawaiian Ridge-Emperor Seamount Chain. (Modified from image of Joel E. Robinson, USGS, in “This Dynamic Planet” map of Simkin and others, 2006.)

Hawaiian-Emperor Chain. White dots are the locations of radiometrically dated seamounts, atolls and islands, based on compilations of Doubrovine et al. and O’Connor et al. Features encircled with larger white circles are discussed in the text and Fig. 2. Marine gravity anomaly map is from Sandwell and Smith.
- 2018.11.25 M 6.3 Iran/Iraq
- 2017.12.01 M 6.1 Iran
- 2017.11.12 M 7.3 Iraq
- 2017.02.08 M 6.3 Makran subduction zone (Pakistan)
- 2015.10.27 M 7.5 Afghanistan
Middle East
General Overview
Earthquake Reports
Social Media
Significant #earthquake in #Iran, likely an aftershock of the M7.3 Ezgeleh earthquake of November 2017. The difference in focal mechanism reveals slip partitionning in the region. 2 other large strike-slip aftershocks were also recorded last summer pic.twitter.com/P2BOzGI625
— Baptiste Gombert (@BaptisteGomb) November 25, 2018
Mw=6.3, IRAN-IRAQ BORDER REGION (Depth: 10 km), 2018/11/25 16:37:31 UTC – Full details here: https://t.co/YoEYOD1agB pic.twitter.com/u54xzgx8ol
— Earthquakes (@geoscope_ipgp) November 25, 2018
strong #earthquake along #Iran #Iraq border, felt #Baghdad, #Kirkuk and #Mosul in Iraq and in #Kermanshah, #Hamadan, #Sulaymaniyah in Iran, even even #Kuwait @LastQuake @Quake_Tracker @JuskisErdbeben @UKEQ_Bulletin pic.twitter.com/NpLVsxxunx
— CATnews (@CATnewsDE) November 25, 2018
GFZ moment tensor solution of M6.3 earthquake on Iran-Iraq border https://t.co/ri4JlRyY3K #earthquake pic.twitter.com/VXAO5EdvNO
— Aram Fathian (@AramFathian) November 25, 2018
Earthquake in Irak Iran border was widely felt more than 500 km away. Local damage close to the epicentre cannot be excluded, but having struck an area of low population, no widespread damage is expected pic.twitter.com/AaxB5X0ZX8
— EMSC (@LastQuake) November 25, 2018
Mwp6.1 #earthquake Iran – Iraq Border Region 2018.11.25-16:37:34UTC https://t.co/kCIw9Vypa6
— Anthony Lomax 🌍🇪🇺 (@ALomaxNet) November 25, 2018
My thoughts and solidarity to the people affected by #IranEarthquake. Deeply proud of our @Iranian_RCS volunteers and staff, who are ready to support their local communities. pic.twitter.com/Axi1dlRFjQ
— Francesco Rocca (@Francescorocca) November 25, 2018
UPDATE: 2018.11.26
An interesting comparison of the latest M6.3 #Iran #Iraq #earthquake aftershocks and the 2013 #Khanaqin earthquake sequence. Epicenters from IRSC & @IRIS_EPO , focal mechanisms from GFZ pic.twitter.com/xTpds1Ke6V
— Sotiris Valkaniotis (@SotisValkan) November 26, 2018
Wrapped interferogram (2.8 cm/1 inch color contours) for M6.3 earthquake near Iran-Iraq border from automatic processing of Copernicus Sentinel-1 SAR by NASA Caltech-JPL ARIA and ESA, with USGS epicenter (star). No sign of surface ruptures, so all fault slip was at depth pic.twitter.com/7eMx6LcpbB
— Eric Fielding (@EricFielding) November 26, 2018
#Sentinel1 #InSAR descending interferogram for the M6.3 #Iran #Iraq #earthquake. No clear indications for surface ruptures, most of the slip occured at depth. Processed with DIAPASON at @esa_gep using @CopernicusEU #Sentinel1 data. pic.twitter.com/2Aj9y1759o
— Sotiris Valkaniotis (@SotisValkan) November 26, 2018
Simulated coseismic ground deformation map of M6.3 earthquake near Iran/Irap border from our "quickdeform" platform: https://t.co/lrLi8Nrbnt.
This website automatically display coseismic deformation maps of recent M >= 6 earthquakes for rapid hazard evaluations. pic.twitter.com/gDqRceAHK7— Wenbin Xu (@WenbXu) November 27, 2018
- Allen, M.B., Saville, C., Blac, E.K-P., Talebian, M., and Nissen, E., 2013. Orogenic plateau growth: Expansion of the Turkish-Iranian Plateau across the Zagros fold-and-thrust belt in Tectonics, v. 32, p. 171-190, doi:10.1002/tect.20025
- Emami, H., Verges, J., nalpas, T., Gillespie, P., Sharp, I., Karpuz, R., Blanc, E.P., and Goodarzi, G.H., 2010. Structure of the Mountain Front Flexure along the Anaran anticline in the Pusht-e Kuh Arc (NW Zagros, Iran): insights from sand box models in LETURMY, P. & ROBIN, C. (eds) Tectonic and Stratigraphic Evolution of Zagros and Makran during the Mesozoic–Cenozoic. Geological Society, London, Special Publications, 330, 155–178.
- Giardini, D., Grunthal, G., Shedlock, K., Zhang. P., and Global Seismic Hazards Program, 1999. Global seismic hazards map: Accessed on Jan. 9, 2007 at http://www.seismo.ethz.ch/GSHAP.
- Hessami, K., 2002. Tectonic History and Present-Day Deformation in the Zagros Fold-Thrust Belt, PhD for the Degree of Doctor of Philosophy in Mineralogy, Petrology, and Tectonics presented at Uppsala University in 2002, ISBN 91-554-5285-5
- Jenkins, Jennifer, Turner, Bethan, Turner, Rebecca, Hayes, G.P., Sinclair, Alison, Davies, Sian, Parker, A.L., Dart, R.L., Tarr, A.C., Villaseñor, Antonio, and Benz, H.M., compilers, 2013, Seismicity of the Earth 1900–2010 Middle East and vicinity (ver 1.1, Jan. 28, 2014): U.S. Geological Survey Open-File Report 2010–1083-K, scale 1:7,000,000, https://pubs.usgs.gov/of/2010/1083/k/.
- Scharf, A., Mattern, F., and Al Sadi, S., 2016. Kinematics of Post-obduction Deformation of the Tertiary Ridge at Al-Khod Village (Muscat Area, Oman) in SQU Journal for Science, v. 21, no. 1, p. 26-40
- Stern, R.J. and Johnson, P., 2010. Continental lithosphere of the Arabian Plate: A geologic, petrologic, and geophysical synthesis in Earth-Science Reviews, v. 101, p. 29-67.
- Talebian and Jackson, 2004. A reappraisal of earthquake focal mechanisms and active shortening in the Zagros mountains of Iran in GJI, v. 156, no. 3, P. 506–526, https://doi.org/10.1111/j.1365-246X.2004.02092.x
- Taymaz, T., Yilmaz, Y., and Dilek, Y., 2007. The geodynamics of the Aegean and Anatolia: introduction in Geological Society, London, Special Publications, v. 291; p. 1-16, doi:10.1144/SP291.1
- Verges, J., Saura, E., Casciello, E., Fernandez, M., Villasenor, A., Jimenez-Munt, I., and Garcia-Castellanos, D., 2011. Crustal-scale cross-sections across the NW Zagros belt: implications for the Arabian margin reconstruction in Geol. Mag, v. 148, no. 5-6, p. 739-761, doi:10.1017/S0016756811000331
- Woudloper, 2009. Tectonic map of southern Europe and the Middle East, showing tectonic structures of the western Alpide mountain belt.
References:
Return to the Earthquake Reports page.