Early on Valentines, those in New Zealand got a valentine from mother Earth. Here is the USGS website for this M 5.8 earthquake, which was felt broadly across the region.
This earthquake, and an M 4.1 aftershock, occurred in the region of a M 6.1 earthquake from which the economy is still recovering.
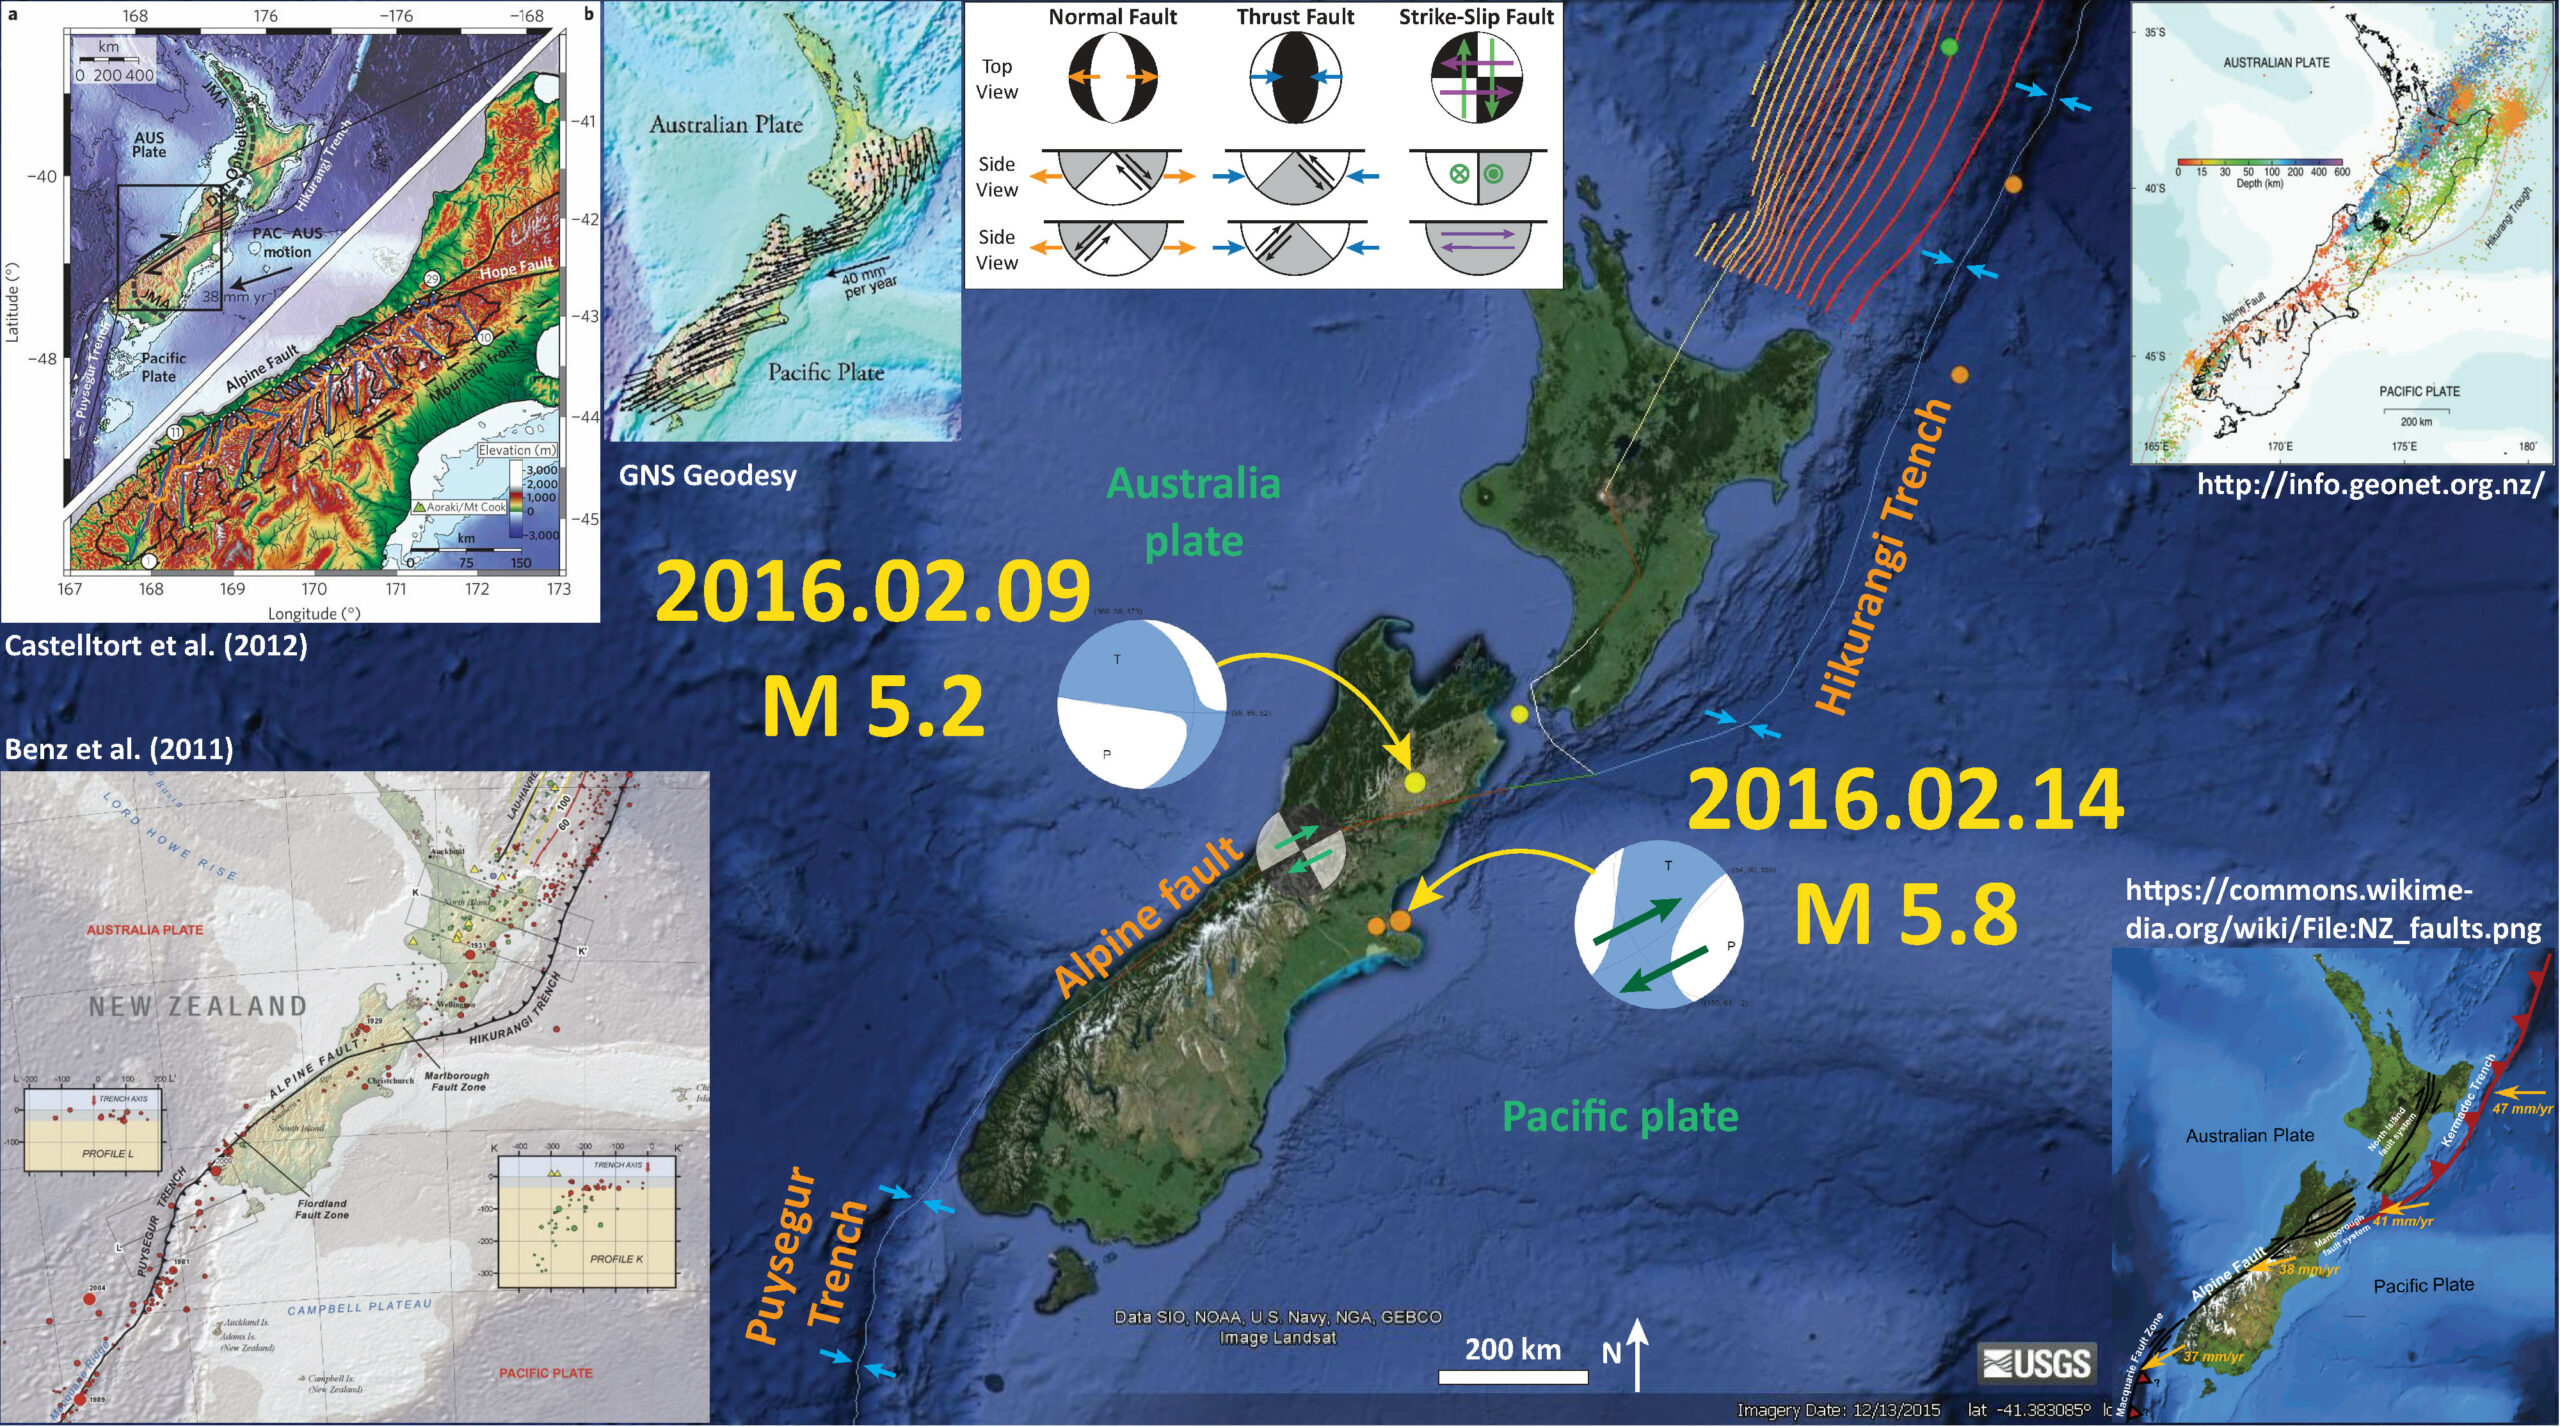
Below is a map that includes seismicity from the past month (note the M 5.2 to the north of today’s earthquake). I plot the epicenter of the M 5.8 as an orange circle and I place the USGS moment tensor with my interpretation for the sense of motion for this earthquake. The M 5.2 is along strike, southwest of a M 6.8 earthquake from 2013. Here is my report on this M 6.8 earthquake. In the upper left corner, I also include a figure from Castelltort et al. (2012) that shows the regional tectonics. In the lower left corner I include the tectonic map from Benz et al. (2011) which shows how the East Vergent subduction zone at the Hikurangi Trench transforms (pun intended) via the Alpine fault (a right lateral strike-slip fault) to the West Vergent subduction zone at the Puysegur Trench. Fault vergence refers to the up-dip direction of the fault.
In the earthquake report poster I also include a map from GNS Science that shows the relative motion of different locations in New Zealand. Along the northern part of the South Island, the direction of motion is ardently sub parallel to the Alpine fault. In the lower right corner, I include a fault map from Mike Norton as published on Wikipedia. In the upper right corner I include a map showing the seismicity from the past century with color representing depth, from GeoNet. The subduction zones to the north and south are well evidenced by these depth plots. Also, the seismicity in the northern 2/3 of the South Island are shown to be shallow, as expected for strike slip fault systems. The shallowness of these earthquakes contributes to how well they are felt to the public.
There is a legend that shows how moment tensors can be interpreted. Moment tensors are graphical solutions of seismic data that show two possible fault plane solutions. One must use local tectonics, along with other data, to be able to interpret which of the two possible solutions is correct. The legend shows how these two solutions are oriented for each example (Normal/Extensional, Thrust/Compressional, and Strike-Slip/Shear). There is more about moment tensors and focal mechanisms at the USGS.

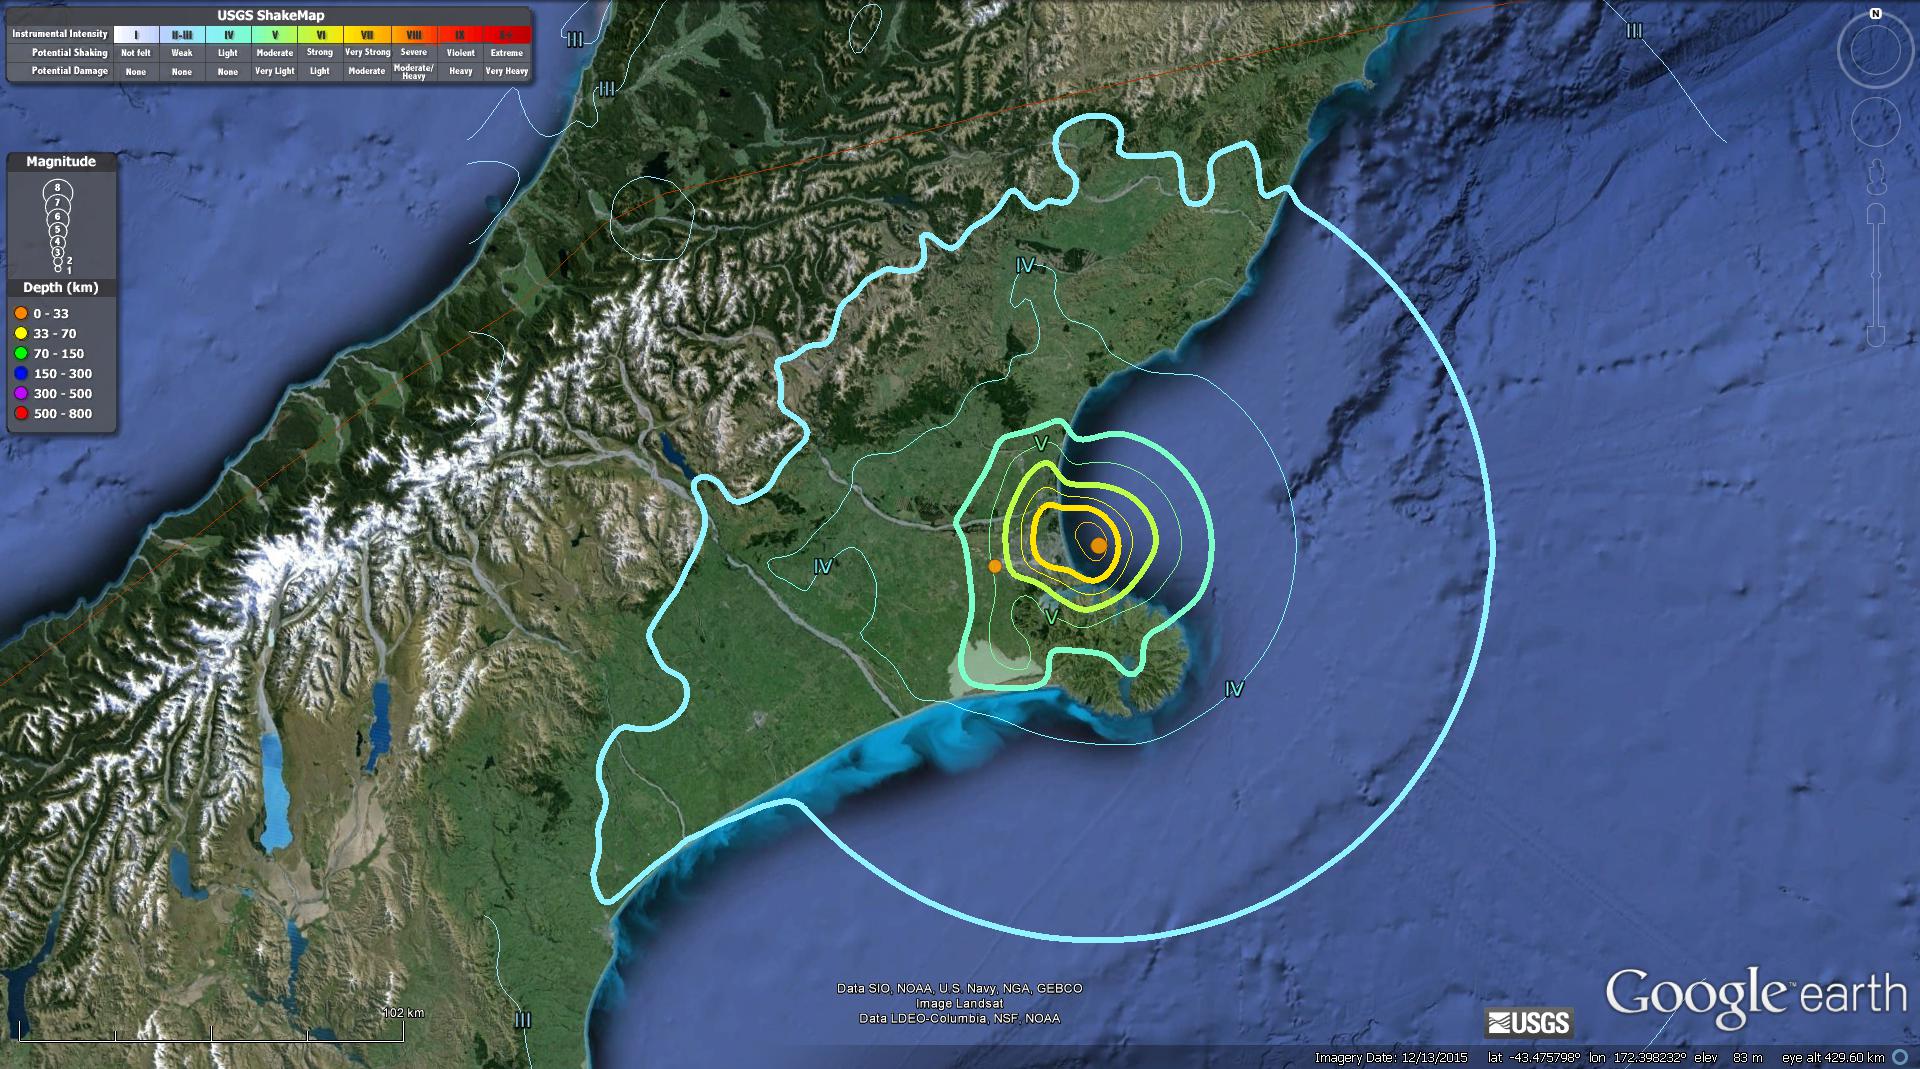
This M 5.8 earthquake was broadly felt. Here is a map that shows the Modified Mercalli Intensity (MMI) contours for this earthquake. The MMI is a qualitative measure of shaking intensity. More on the MMI scale can be found here and here.
For more on the graphical representation of moment tensors and focal mechnisms, check this IRIS video out:
GNS (New Zealand’s USGS) has a wonderful compilation of educational material for the tectonics of New Zealand. I include some of their maps and videos below.
Here is a video from GNS that describes the tectonics of New Zealand. This is a link to download the embedded video below (54 MB mp4).
On 2010.09.13, there was a M 7.0 earthquake (aka the Darfield Earthquake) out in a field and here is the USGS website for this earthquake. This earthquake was felt across all of New Zealand and felt strongly in Christchurch. Below is the “Did You Feel It?” map from the 2010 earthquake. There was not much damage because the location was “out in a field” (i.e. it was in rural NZ). Below is a blockquote from the USGS website for this M 7.0 earthquake.
Two people seriously injured, six bridges and many buildings damaged in the Christchurch area. About 30 km of right-lateral surface faulting with a maximum offset of more than 5 m was observed southeast of Darfield. Liquefaction caused damage at Bexley, Kaiapoi and in parts of Christchurch. Landslides were observed along the Rakaia River and the Port Hills area. Maximum intensity IX in the Christchurch-Greendale area and felt (VI) in much of Canterbury. Felt throughout New Zealand. Detailed information about this earthquake is available on the New Zealand GeoNet website at http://www.geonet.org.nz.

Here is a video that GNS put together to document the Darfield Earthquake. This is the yt link for the embedded video below.
However, on 2011.02.21, there was a M 6.1 earthquake that occurred in a location that led to strong ground shaking in the urban center of Christchurch. Here is the USGS website for this M 6.1 earthquake. The city and people are still recovering from this earthquake. The economics of the region will be hampered for decades to come. The “Canterbury Earthquake” occurred along a fault that did not rupture the surface, while the M 7.0 Darfield Earthquake had. GNS has more resources about this earthquake sequence here.
Here is a map prepared by GNS Science that shows the M 7.0 and M 6.1 mainshocks, as well as the aftershocks from this paired sequence.

Here is a map that GNS put together to help visualize their estimates of slip along the blind fault that ruptured in February of 2011. I include their text as a blockquote below the map.

Based on data from GPS stations, satellite radar images, seismographs and strong-motion recorders, the fault that caused the 22 February earthquake lies within about six kilometres of the city centre, along the southern edge of the city. The fault rupture (Fig. 1) was about 14 kilometres long, and extends east-northeast from Cashmere to the Avon-Heathcote estuary area. The fault plane extends a few kilometres offshore, but not much fault movement occurred beneath the ocean.
This Google map image shows the fault plane (rectangular area) across the southern part of Christchurch and northern Port Hills. Colours on the fault plane indicate the amount of slip between the two sides of the fault (see Fig. 2). The contour lines indicate the amount (in mm) the land has risen (blue contours) or subsided (red contours) due to the slip on the fault. The white line is the contour where there was no change in height. The red, green and yellow coloured symbols show some of the GPS stations whose displacements were used to derive the fault slip model.
The top of the fault lies at a depth of about a kilometre beneath the surface, and the rupture extends down along the fault plane for about seven kilometres. The fault is not a vertical cut through the earth, but rather it dips towards the south at an angle of about 65 degrees from the horizontal. The main part of the fault thus lies beneath the northern edge of the Port Hills.
I put together an animation that shows the earthquakes from New Zealand with magnitudes greater than or equal to M 6.5. Above is a screen shot of all these earthquakes and below is the animation. This is the kml file that I used to make this animation. Here is the query that I used to make this animation.

Here is a link to the mp4 file embedded below (2 MB mp4).
Here is an interesting (long) video about the Canterbury earthquake sequence. This is the yt link for the embedded video below.
-
References:
- Benz, H.M., Herman, Matthew, Tarr, A.C., Furlong, K.P., Hayes, G.P., Villaseñor, Antonio, Dart, R.L., and Rhea, Susan, 2011. Seismicity of the Earth 1900–2010 eastern margin of the Australia plate: U.S. Geological Survey Open-File Report 2010–1083-I, scale 1:8,000,000. http://pubs.usgs.gov/of/2010/1083/i/
- Castellort, S., Goren, L., Willett, S.D., Champagnac, J-D., Herman, F., and Braun, J., 2012. River drainage patterns in the New Zealand Alps primarily controlled by plate tectonic strain in Nature Geoscience, v. 5, p. 744-748.
2 thoughts on “Earthquake Report: New Zealand!”