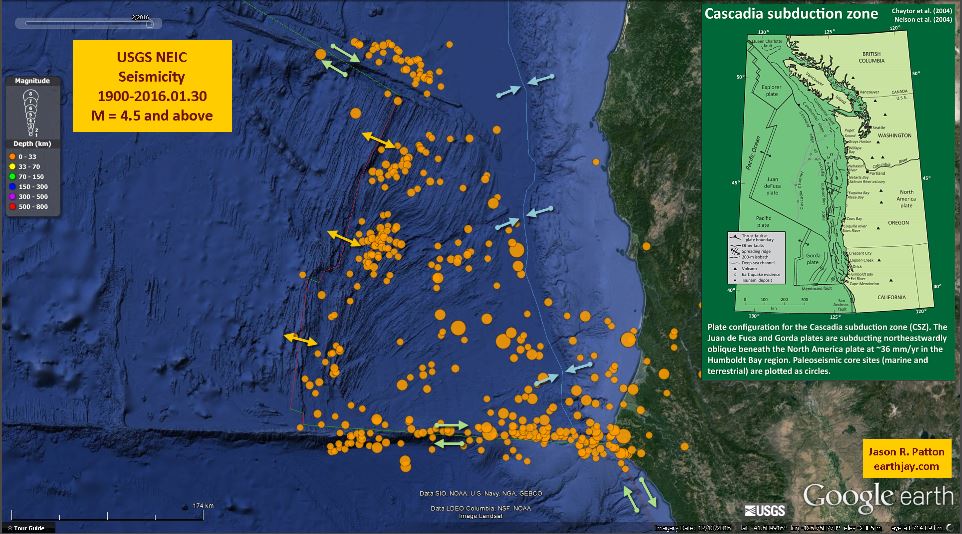
Following the earthquake pair today, I put together an animation showing the seismicity for this region between 1900 and 2016.01.30. I searched the USGS NEIC database for earthquakes of magnitude greater than or equal to M = 4.5. Here is my earthquake report for those earthquakes.
Here is a screenshot of the video.

Here is a download link for the video embedded below (2 MB mp4).
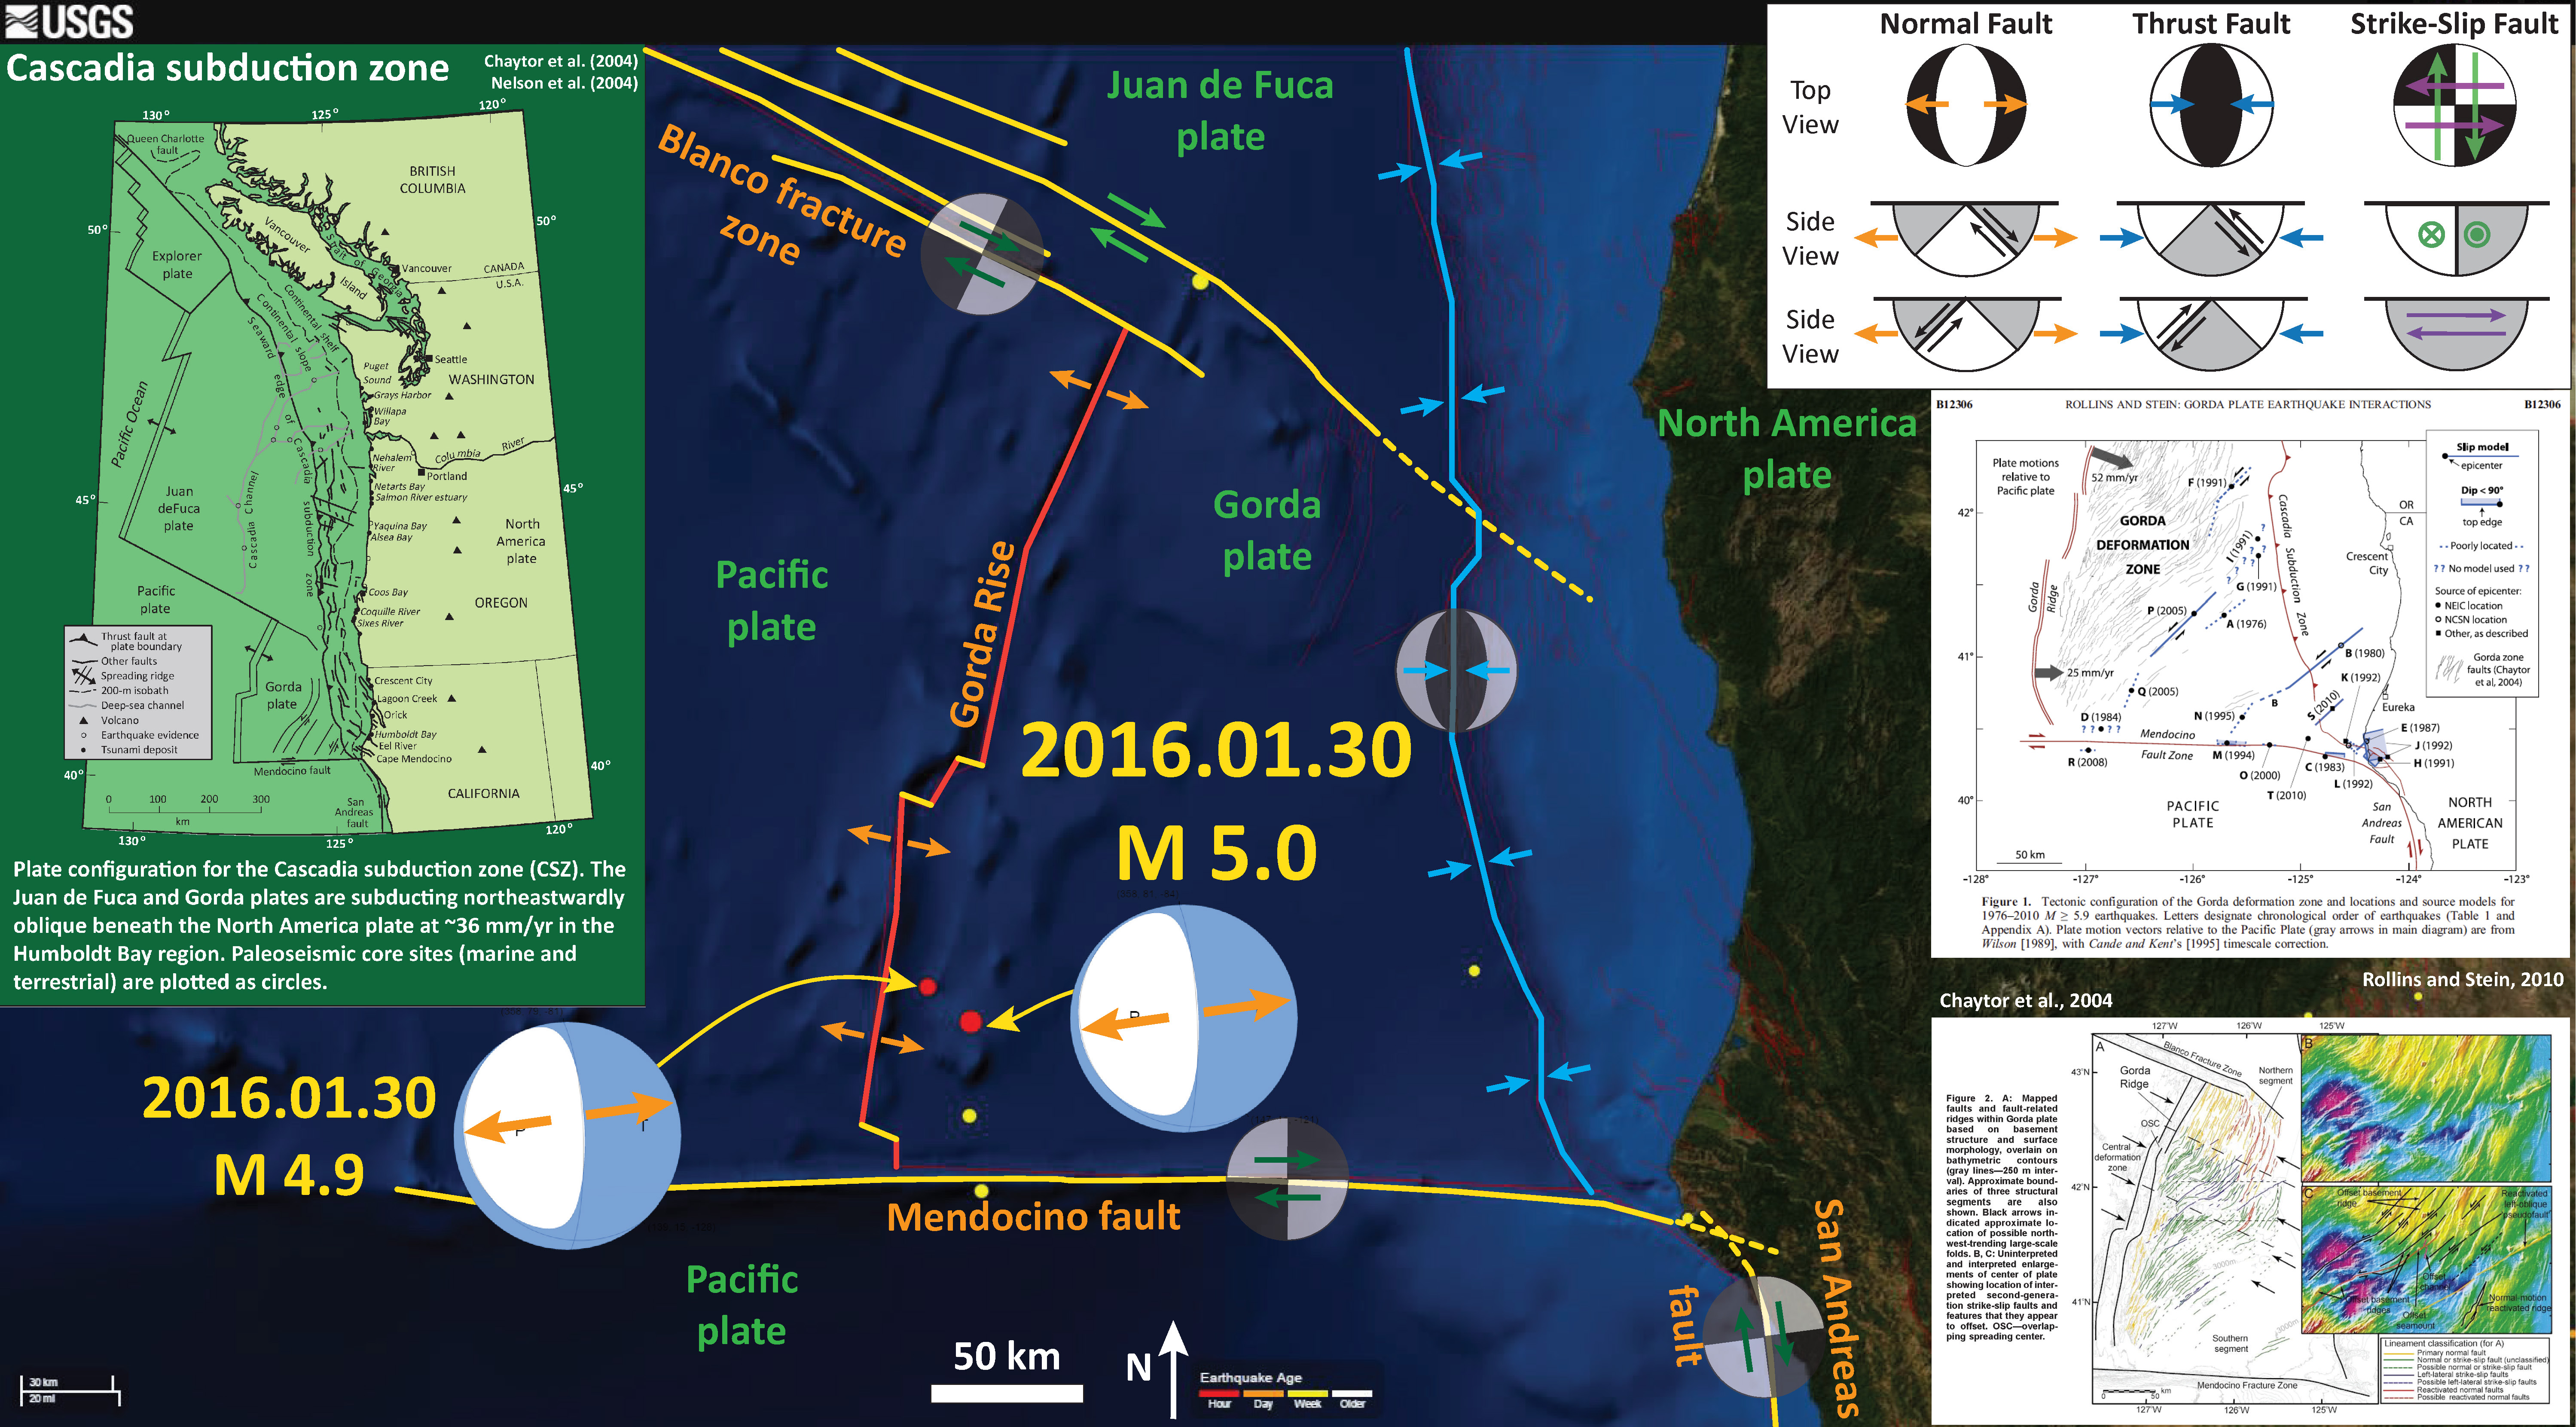
Here is my interpretive map for the two Gorda plate earthquakes.

