There have not been that many large earthquakes this year. This is good for one main reason, there is a lower potential for human suffering.
Therefore, there are fewer Earthquake Reports for this year.
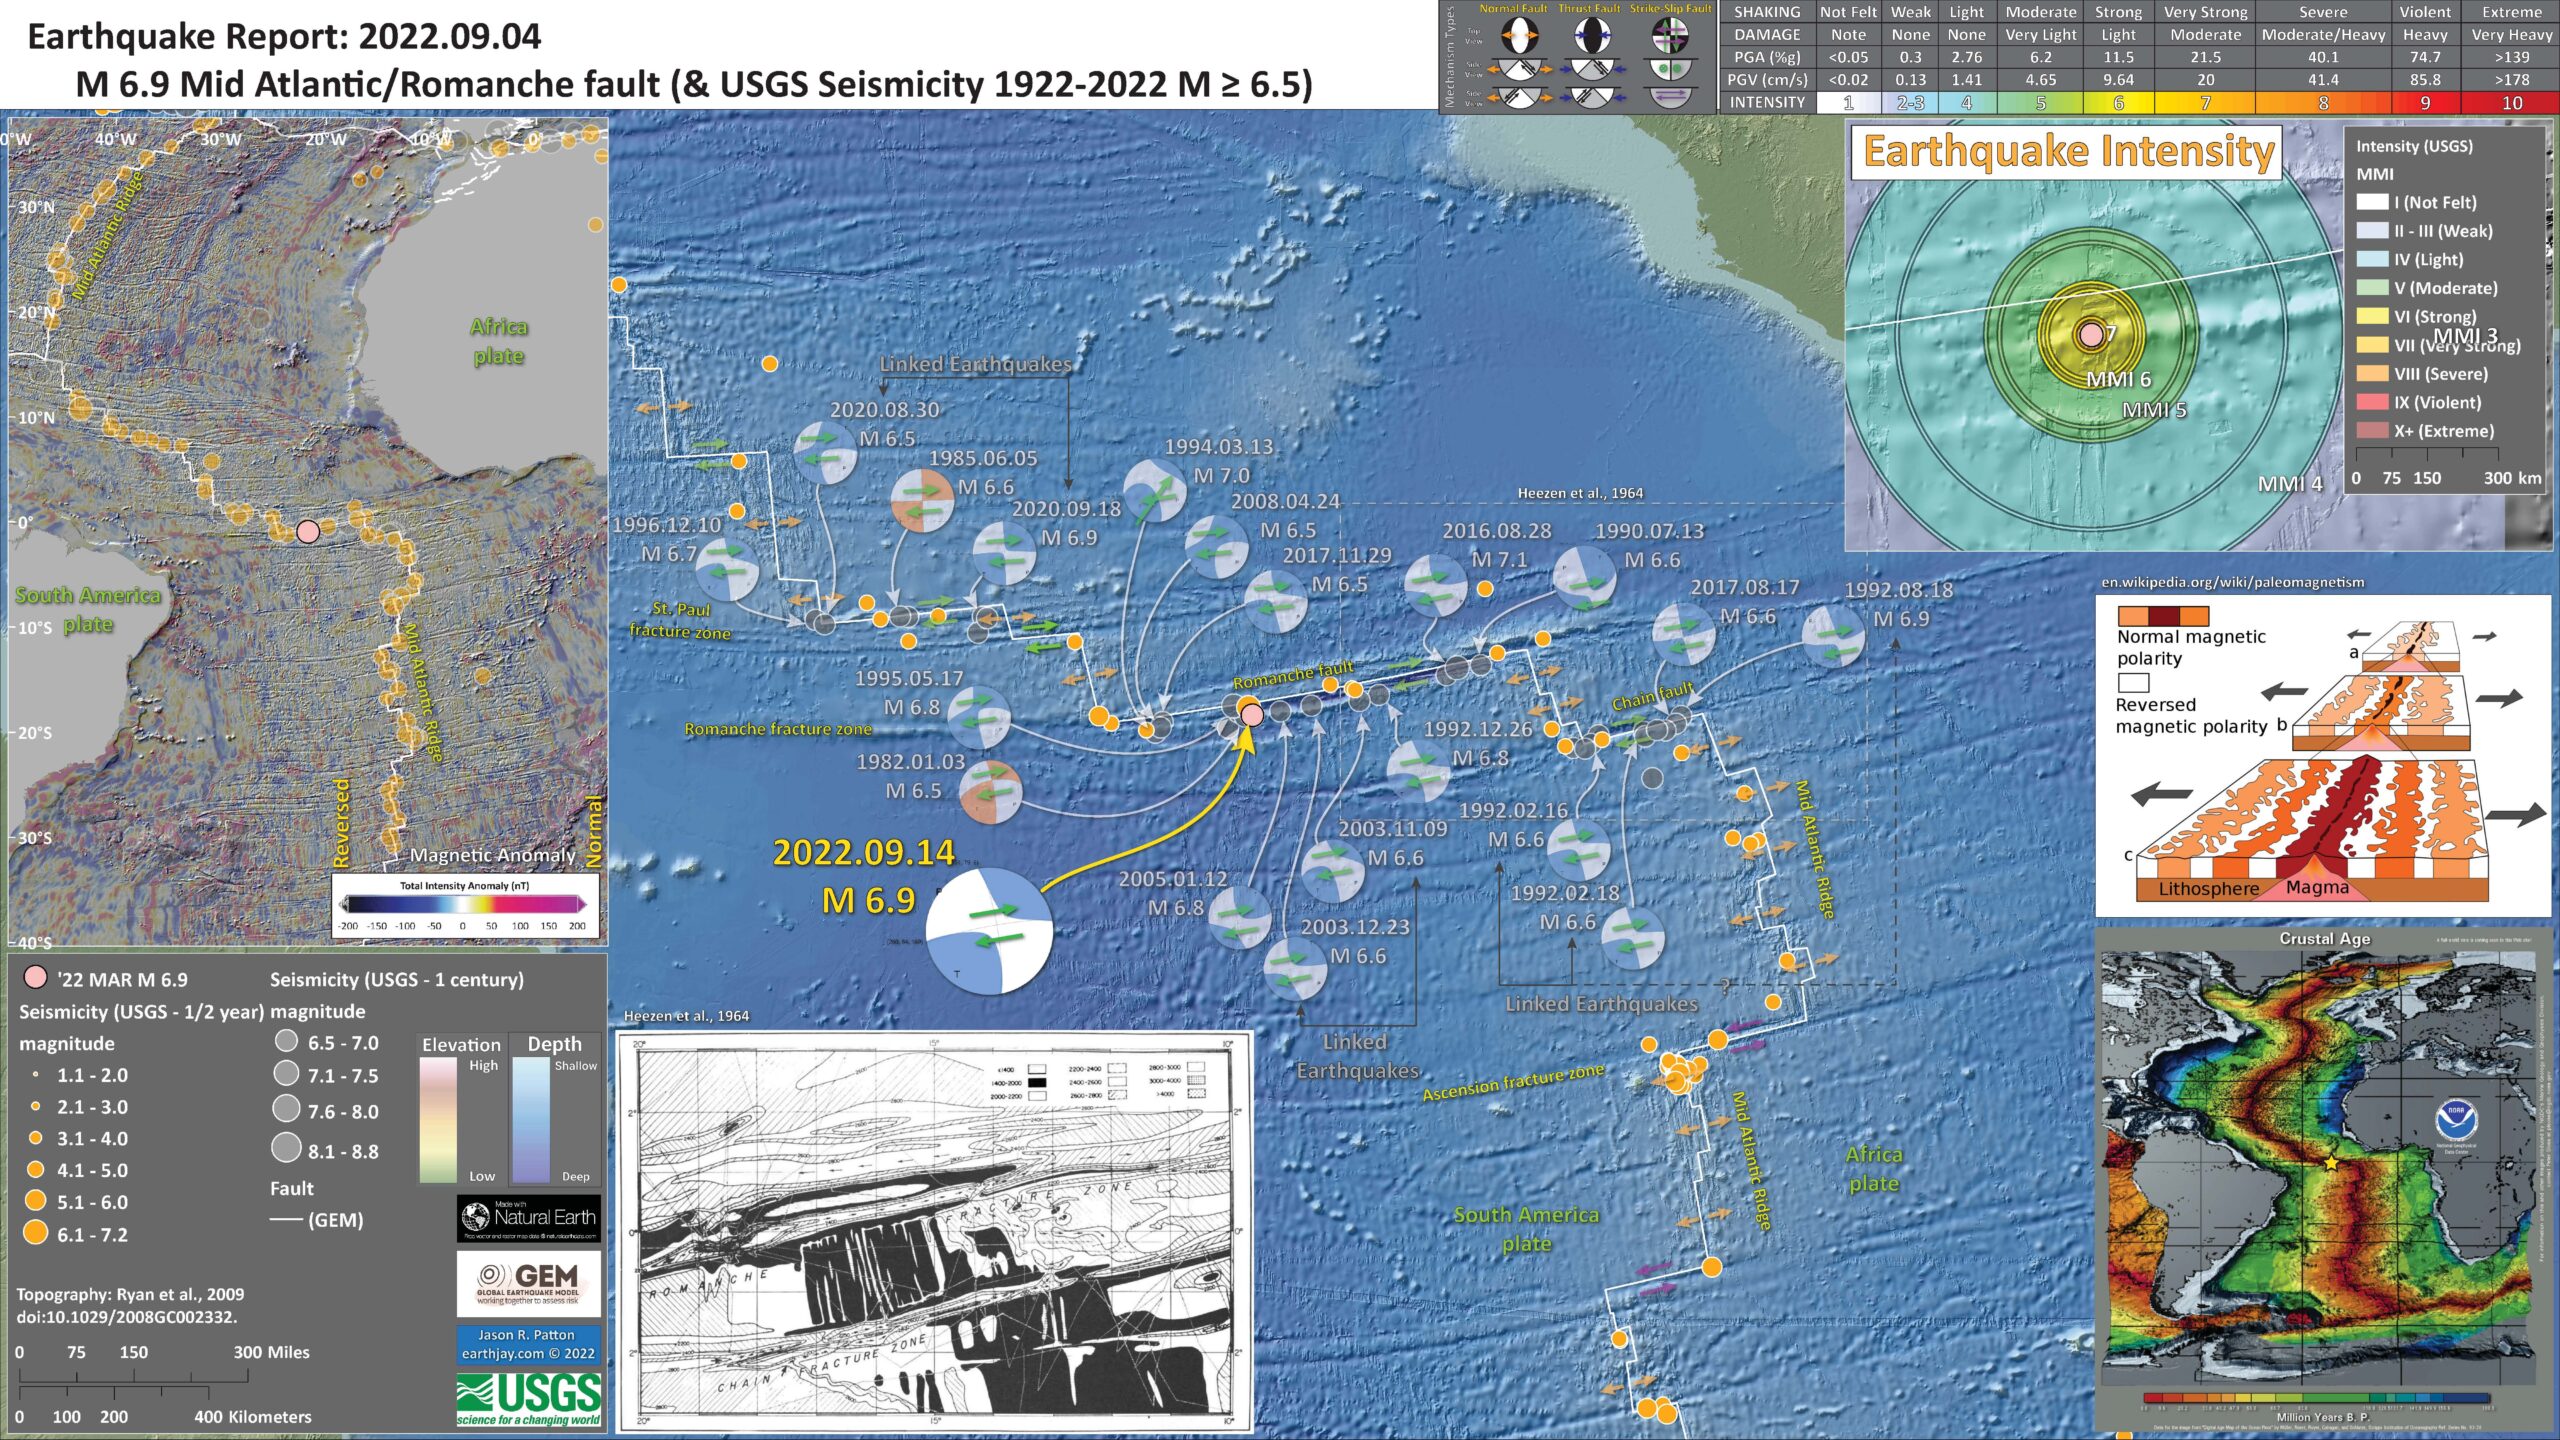
This morning (my time) there was a magnitude M 6.9 earthquake along the Romanche transform fault, a right-lateral strike-slip fault system that offsets the Mid Atlantic Ridge in the equatorial Atlantic Ocean. The fault is part of the Romanche fracture zone.
https://earthquake.usgs.gov/earthquakes/eventpage/us7000i53f/executive
The transform faults in this part of the Mid Atlantic Ridge plate boundary have a pattern of earthquakes that seem to max out in the lower 7 magnitudes. This may be (at least partly) due to the maximum length of these faults (?).
The Romanche fault is about 900 kilometers long. The Chain fault is about 250 km long. The St. Paul fault is about 350 km long.
-
Earthquake magnitude is controlled by three things:
- the size of the earthquake slip area, for most events, this is basically the length of the fault (since the width of the fault is controlled by the thickness of the lithosphere, or the crust)
- the amount that the fault slipped
- physical properties of the lithosphere or crust on either side of the fault (how “elastic” the Earth is)
Using empirical (data) based relations between earthquake subsurface rupture length and earthquake magnitude (Wells and Coppersmith, 1994), I calculate the maximum earthquake magnitude we may get on these three faults listed above.
Here are the data that Wells and Coppersmith use to establish these relations.
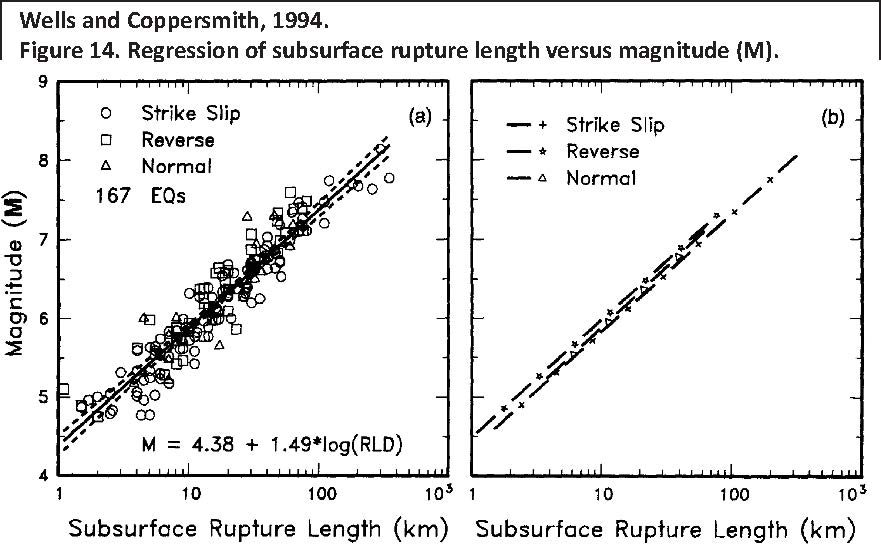
(a) Regression of subsurface rupture length on magnitude (M). Regression line shown for all-slip-type relationship. Short dashed line indicates 95% confidence interval. (b) Regression lines for strike-slip relationships. See Table 2 for regression coefficients. Length of regression lines shows the range of data for each relationship.
Here are the magnitude estimates for each of these fault systems.
![]()
Looking at the interpretive poster, we can see that there have not been any temblors that approach the sizes listed in this table. The largest historic earthquake was M 7.1 (there were several).
So, we may ask ourselves one of the most common questions people ask regarding earthquakes. Was this M 6.9 a foreshock to a larger earthquake?
Obviously, we cannot yet know this. Nobody can predict the future (at least not yet).
However, based on the incredibly short historic record of earthquakes, we may answer this question: “no, probably not.” This answer is tempered by the very short seismic record. If magnitude 8 earthquakes occur, on average, every 1000 years, then our ~100 year record might be too short to “notice” one of these M 8 events.
If we continue to look at the historic record, we will see that there appear to be three instances where one of these M 6.5-7 earthquakes had a later earthquake of a similar magnitude.
When an earthquake fault slips, the crust surrounding the fault squishes and expands, deforming elastically (like in one’s underwear). These changes in shape of the crust cause earthquake fault stresses to change. These changes in stress can either increase or decrease the chance of another earthquake.
I wrote more about this type of earthquake triggering for Temblor here. Head over there to learn more about “static coulomb stress triggering.”
In the poster, I label these earthquakes as “Linked Earthquakes.” Perhaps the later of each earthquake pair (or triple) was triggered by the change in static coulomb stress.
-
Here are the three sets of “Linked Earthquakes:”
- In 1992, along the Chain fault, the 16 Feb M 6.6 appears to have triggered the 18 Feb M 6.6. More speculatively, about 6 months later, it seems that there was a triggered M 6.9 on 18 Aug. Static Coulomb triggering typically has a limit of about 2-3 times the rupture length (and this depends of the pre-existing stress on the receiver fault, the fault that may be having triggered slip). A M 6.6 may have a rupture length of 50 km, so could possibly affect faults as far as 100-150 km away. The M 6.9 is about 70 km from the easternmost M 6.6, so it seems possible that the M 6.9 was triggered by the M 6.6.
- In 2003, along the Romanche fault, there were two M 6.6 earthquakes separated by about 6 weeks. These quakes are about 100 km apart, possibly close enough to be triggered.
- In 2020, along the St. Paul transform fault, there was a pair of quakes about 3 weeks and 340 km apart. The first quake was M 6.5, so this pair of events seems to far apart to be related.
So, given the historic record, it sure seems likely that there may be another M6-7 earthquakes in the region of the fault sometime in the next couple of months. And, given our lack of knowledge about the long term behavior of these faults, it is also possible that there could be a larger M 8 event.
Since we cannot yet know the real answer to this question, we are reminded of the advice that educators and emergency response people provide: If one lives in Earthquake Country, get earthquake prepared. Just a little effort to get better prepared makes a major difference in the outcome.
Head over to Earthquake Alliance where there are some excellent brochures about how to be better prepared and more resilient to earthquake and tsunami hazards. Living on Shaky Ground is one of my favorites!
Below is my interpretive poster for this earthquake
- I plot the seismicity from the past month, with diameter representing magnitude (see legend). I include earthquake epicenters from 1920-2020 with magnitudes M ≥ 3.0 in one version.
- I plot the USGS fault plane solutions (moment tensors in blue and focal mechanisms in orange), possibly in addition to some relevant historic earthquakes.
- A review of the basic base map variations and data that I use for the interpretive posters can be found on the Earthquake Reports page. I have improved these posters over time and some of this background information applies to the older posters.
- Some basic fundamentals of earthquake geology and plate tectonics can be found on the Earthquake Plate Tectonic Fundamentals page.
- In the lower right corner I include a map that shows the age of the oceanic crust in the Atlantic Ocean. Oceanic crust (or lithosphere) is created at mid ocean ridges, where there is extension that allows upward movement of magma, leading to the formation of oceanic crust. The Mid Atlantic Ridge system is one of these types of plate boundaries.
- Above the crust age map is an illustration showing the how the crust moving away from the ocean ridges leaves behind oceanic crust. The Earth’s magnetic polarity changes at times and the oceanic crust records these changes in magnetic polarity. These changes are the main reason why we know that the crust is formed along these ridge systems. Read more here.
- In the upper left corner is a small scale map that shows the historic seismicity, the plate boundary fault systems, and the magnetic anomalies. Places with crust formed when the magnetic field is like today, is colored red (a.k.a. normal polarity) and crust formed when the poles were reversed relative to today is blue (i.e., reversed polarity).
- In the upper right corner is a map that shows the earthquake intensity from this earthquake (using the modified Mercalli Intensity Scale). Intensity is a measure of how strongly the shaking is felt, not a measure of the earthquake size. So, the intensity gets smaller with distance (see how the highest intensity is nearest the earthquake epicenter).
- In the lower left center there is a map from Heezen et al. (1964). Heezen was an oceanographer that contributed greatly to our knowledge of the oceans. In this study, one of the things that they were studying is the flow of deep water (deep water flows largely because of changes in density of the seawater, controlled by salinity and temperature). Because of this, they were mapping the shape of the seafloor to see where this deep water could flow. Ths location of this map is outlined by a dashed rectangle in the main map.
I include some inset figures. Some of the same figures are located in different places on the larger scale map below.
- Here is the map with a month’s seismicity plotted.
Some Relevant Discussion and Figures
- Here is the Müller et al. (2008) figure from the interpretive poster above.

- Here a the Bonatti et al. (2001) figure showing the bathymetry of this area. I include the figure caption as a blockquote below.
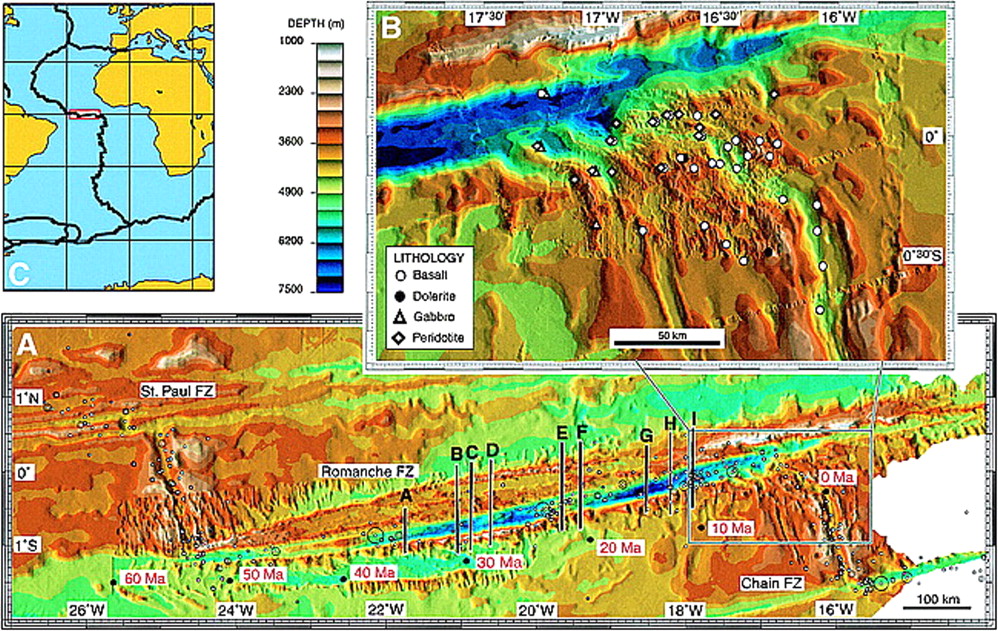
A: Multibeam topography of Romanche region, showing north-south profiles where sampling was carried out. Black dots and red numbers indicate estimated age (in million years) of lithosphere south of Romanche Transform, assuming spreading half-rate of 17 mm/yr within present-day ridge and transform geometry. White dots indicate epicenters of teleseismically recorded 1970–1995 events (magnitude . 4). FZ is fracture zone. B: Topography and petrology at eastern intersection of Romanche Fracture Zone with Mid-Atlantic Ridge. Data were obtained during expeditions S-16, S-19, and G-96 (Bonatti et al., 1994, 1996). C: Location of A along Mid-Atlantic Ridge.
- Dr. Stephen Hicks and their colleagues conducted a fascinating study of the 2016 M 7.1 earthquake. They hypothesize that the Romanche fault slipped in different parts of the fault at different times (during the earthquake).
- This map shows the historic seismicity of the region.
- Here is where Hicks et al. (2020) hypothesize that the slip slipped.
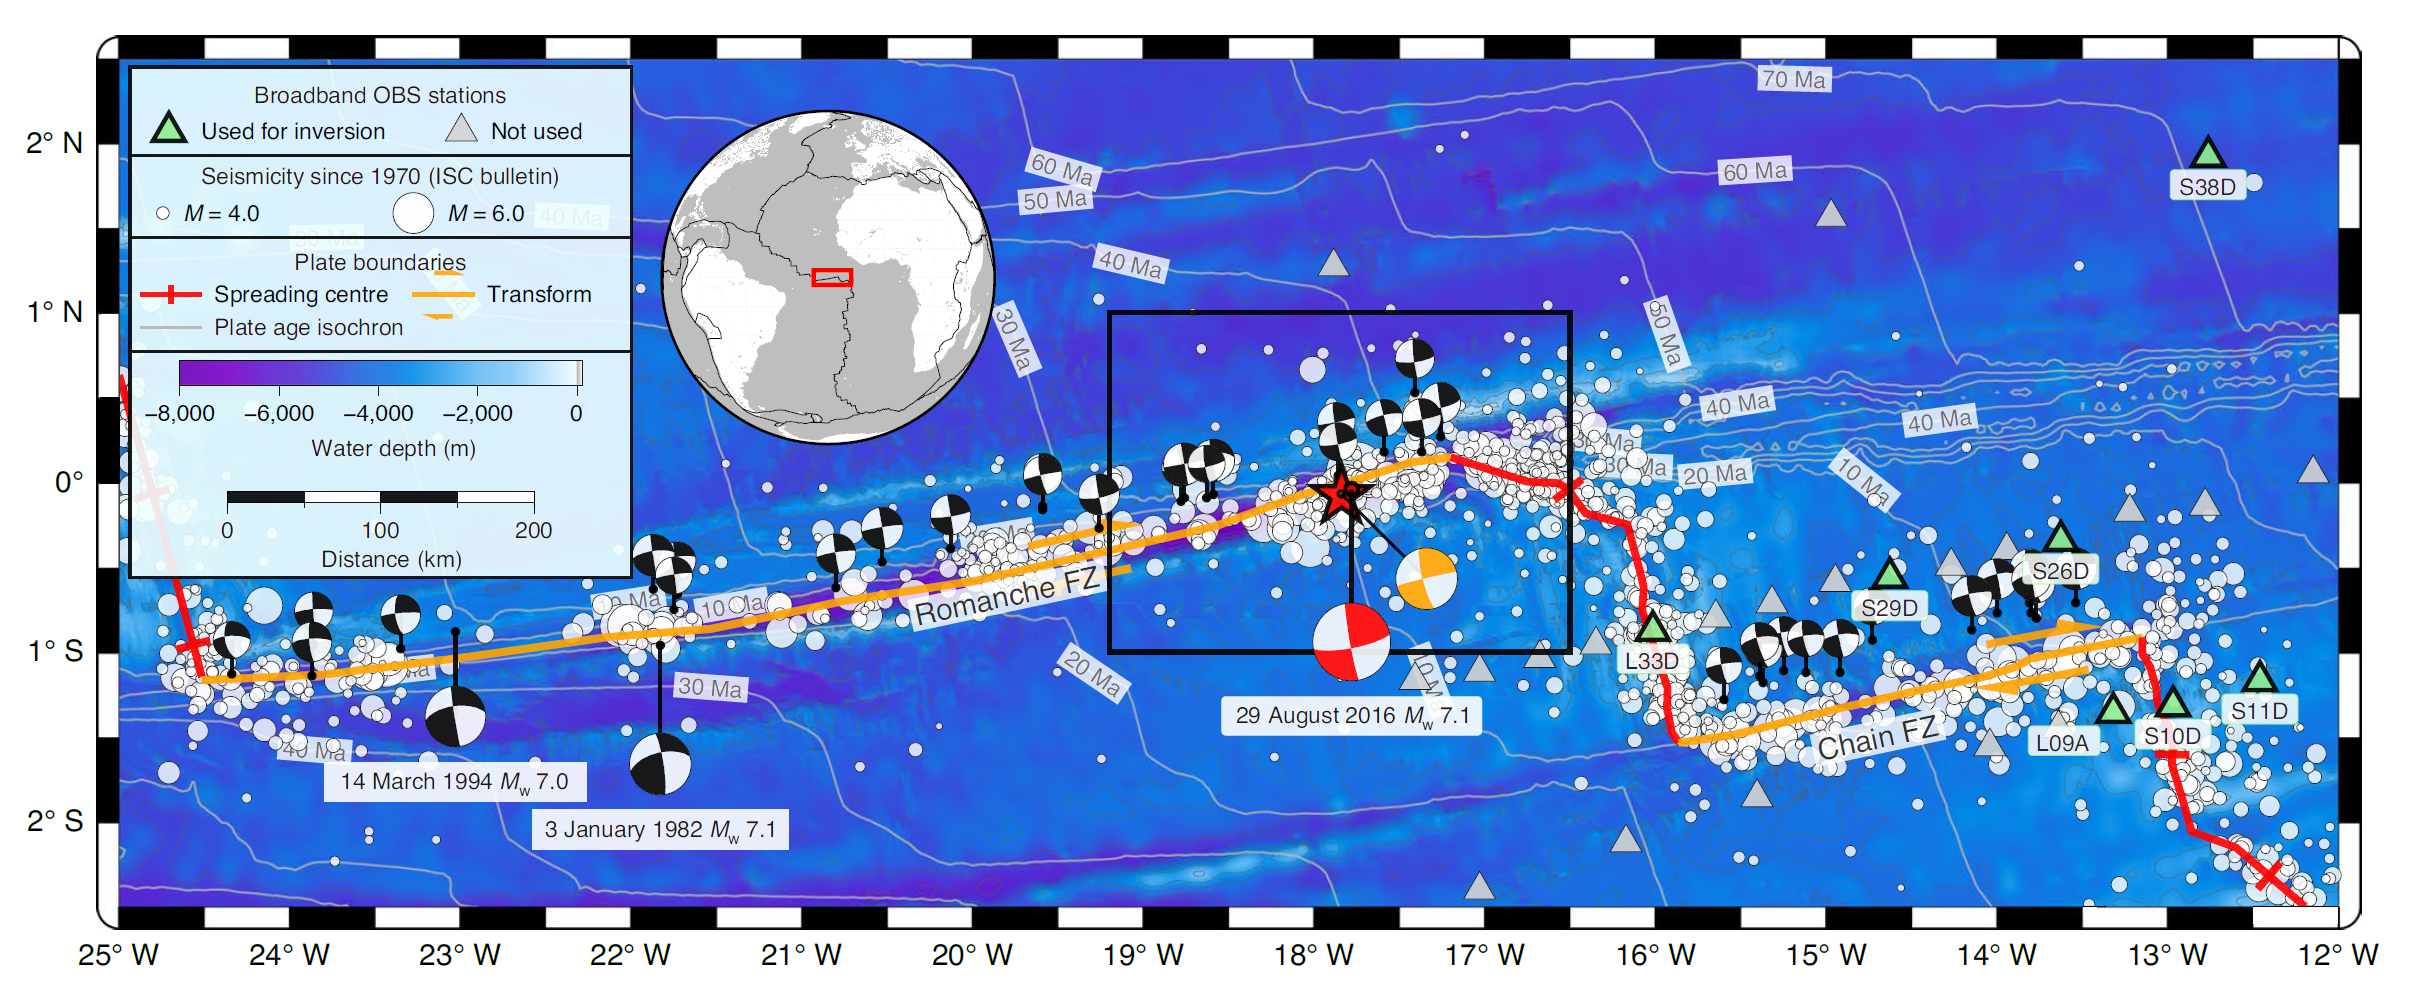
Seismotectonic context. The map location is given by the red rectangle on the inset globe. Focal mechanisms are shown for events with Mw > 6 (ref. 30). Mw > 7.0 events are labelled. Stations of the PI-LAB ocean bottom seismometer network are indicated by triangles. Our relocated hypocentre and low-frequency RMT of the 2016 earthquake are shown by the red star and red beach ball, respectively. The orange beach ball is a colocated Mw 5.8 used for the Mach cone analysis. The black rectangle shows the location of the map in Fig. 2. ISC Bulletin, Bulletin of the International Seismological Centre.

Interpretation of rupture dynamics for the 2016 Romanche earthquake. Top: perspective view of bathymetry along the Romanche FZ. Bottom: interpretive cross-section along the ruptured fault plane. Colours show a thermal profile based on half-space cooling. The green line denotes the predicted transition between velocity-strengthening and velocity-weakening frictional regimes (as expressed by the a – b friction rate parameter) from Gabbro data35. The numbers show the key stages of rupture evolution: (1) rupture initiation (star) in the oceanic mantle, (2) initiation phase has sufficient fracture energy to propagate upwards to the locked section of fault, (3) weak subshear rupture front travels east in the lower crust and/or upper mantle, (4) rupture reaches the locked, thinner crustal segment close to the weaker RTI (SE1), (5) sufficient fracture energy for a westward supershear rupture in the crust along the strongly coupled fault segment (SE2) and (6) rupture possibly terminated by a serpentinized and hydrothermally altered fault segment.
- 2022.09.04 M 6.9 Mid Atlantic Ridge (Romannche fracture zone)
- 2018.11.08 M 6.8 Mid Atlantic Ridge (Jan Mayen fracture zone)
- 2017.08.18 M 6.6 Mid Atlantic Ridge (Chain fracture zone)
- 2016.08.30 M 7.1 Mid Atlantic Ridge
- 2015.06.18 M 7.0 Mid Atlantic Ridge
- 2015.05.24 M 6.3 Mid Atlantic Ridge
- 2015.02.13 M 7.1 Mid Atlantic Ridge
Atlantic
General Overview
Earthquake Reports
Social Media
#EarthquakeReport for M 6.9 #Earthquake along the equatorial Mid Atlantic Ridge plate boundary
a right-lateral strike-slip earthquake along the Romanche transform faulthttps://t.co/LkglWJgBvD
read the report herehttps://t.co/8ZGxTJEU9v pic.twitter.com/axcwlSPDSI
— Jason "Jay" R. Patton (@patton_cascadia) September 5, 2022
Mw=7.0, CENTRAL MID-ATLANTIC RIDGE (Depth: 25 km), 2022/09/04 09:42:18 UTC – Full details here: https://t.co/MaNnp6eDAU pic.twitter.com/Gv39KoU3KQ
— Earthquakes (@geoscope_ipgp) September 4, 2022
Magnitude 6.9 #earthquake on the mid-Atlantic ridge a couple of hours ago (2022-09-04Z09:42) https://t.co/GwKH4H1yON Predominantly strike-slip (as expected there). Amazing T-phases on the Ascension island hydrophones (data via @IRIS_EPO) coming after the weaker converted P-wave. pic.twitter.com/rCwawAet0W
— Dr. Steven J. Gibbons (@stevenjgibbons) September 4, 2022
Major M6.9 right lateral fault #eartquake in oceanic Romanche fracture zone, offsetting central Mid-Atlantic Ridge (3cm/y). Large one for geologic setting, but no surface impact; no tsunami. Textbook behavior. #geohazards https://t.co/F3hXqtkikg pic.twitter.com/KcHL6p1nca
— 🌎 Prof Ben van der Pluijm ⚒️ (@vdpluijm) September 4, 2022
Magnitude 6.9 earthquake on the Mid-Atlantic ridge, recorded in New England – detected in Maine, Massachusetts and the Westport Observatory's seismic equipment 4,340 miles from the epicenter in the middle of the Atlantic ocean. @Weston_Quakes https://t.co/dS9MJOU3ow pic.twitter.com/wUJwQ8XBqh
— WestportAstroSociety (@westportskyguys) September 4, 2022
2022-09-04 strong M6.9 Central Mid-#Atlantic Ridge #earthquake recorded by online high quality data #RaspberryShakes + 3D trace from Canindé de São Francisco, #Brazil (2031.6km away) + area historical seismicity.#Python @raspishake @matplotlib #CitizenScienc pic.twitter.com/QYqq7lJPaW
— Giuseppe Petricca (@gmrpetricca) September 4, 2022
- Frisch, W., Meschede, M., Blakey, R., 2011. Plate Tectonics, Springer-Verlag, London, 213 pp.
- Hayes, G., 2018, Slab2 – A Comprehensive Subduction Zone Geometry Model: U.S. Geological Survey data release, https://doi.org/10.5066/F7PV6JNV.
- Holt, W. E., C. Kreemer, A. J. Haines, L. Estey, C. Meertens, G. Blewitt, and D. Lavallee (2005), Project helps constrain continental dynamics and seismic hazards, Eos Trans. AGU, 86(41), 383–387, , https://doi.org/10.1029/2005EO410002. /li>
- Jessee, M.A.N., Hamburger, M. W., Allstadt, K., Wald, D. J., Robeson, S. M., Tanyas, H., et al. (2018). A global empirical model for near-real-time assessment of seismically induced landslides. Journal of Geophysical Research: Earth Surface, 123, 1835–1859. https://doi.org/10.1029/2017JF004494
- Kreemer, C., J. Haines, W. Holt, G. Blewitt, and D. Lavallee (2000), On the determination of a global strain rate model, Geophys. J. Int., 52(10), 765–770.
- Kreemer, C., W. E. Holt, and A. J. Haines (2003), An integrated global model of present-day plate motions and plate boundary deformation, Geophys. J. Int., 154(1), 8–34, , https://doi.org/10.1046/j.1365-246X.2003.01917.x.
- Kreemer, C., G. Blewitt, E.C. Klein, 2014. A geodetic plate motion and Global Strain Rate Model in Geochemistry, Geophysics, Geosystems, v. 15, p. 3849-3889, https://doi.org/10.1002/2014GC005407.
- Meyer, B., Saltus, R., Chulliat, a., 2017. EMAG2: Earth Magnetic Anomaly Grid (2-arc-minute resolution) Version 3. National Centers for Environmental Information, NOAA. Model. https://doi.org/10.7289/V5H70CVX
- Müller, R.D., Sdrolias, M., Gaina, C. and Roest, W.R., 2008, Age spreading rates and spreading asymmetry of the world’s ocean crust in Geochemistry, Geophysics, Geosystems, 9, Q04006, https://doi.org/10.1029/2007GC001743
- Pagani,M. , J. Garcia-Pelaez, R. Gee, K. Johnson, V. Poggi, R. Styron, G. Weatherill, M. Simionato, D. Viganò, L. Danciu, D. Monelli (2018). Global Earthquake Model (GEM) Seismic Hazard Map (version 2018.1 – December 2018), DOI: 10.13117/GEM-GLOBAL-SEISMIC-HAZARD-MAP-2018.1
- Silva, V ., D Amo-Oduro, A Calderon, J Dabbeek, V Despotaki, L Martins, A Rao, M Simionato, D Viganò, C Yepes, A Acevedo, N Horspool, H Crowley, K Jaiswal, M Journeay, M Pittore, 2018. Global Earthquake Model (GEM) Seismic Risk Map (version 2018.1). https://doi.org/10.13117/GEM-GLOBAL-SEISMIC-RISK-MAP-2018.1
- Zhu, J., Baise, L. G., Thompson, E. M., 2017, An Updated Geospatial Liquefaction Model for Global Application, Bulletin of the Seismological Society of America, 107, p 1365-1385, https://doi.org/0.1785/0120160198
- Abercrombie, R.E. and Ekstrom, G., 2001. Earthquake slip on oceanic transform faults in Nature, v. 410, p. 74-77
- Bonatti, E., Brunello, D., Fabretti, P., Ligi, M., Porcaro, R.A., and Sealer, M., 2001. Steady-state creation of crust-free lithosphere at cold spots in mid-ocean ridges in Geology, v. 29, no. 11, p. 979-982.
- Hicks, S.P., Okuwaki, R., Steinberg, A., Rychert, C.A., Harmon, N. Abercrombie, R.E., Bogiatzis, P., Cataphors, D., Zahradnik, J., Kendall, J-M., Yagi, Y., Shimizu, K., and Sudhaus, H., 2020. Back-propagating supershear rupture in the 2016 Mw 7.1 Romanche transform fault earthquake in Nature Geoscience, v. 13, p. 647-653, https://doi.org/10.1038/s41561-020-0619-9
- Heezen, B.C., Bunce, E.T., Hersey, J.B., and Tharp, M., 1964. Chain and Romanche fracture zones in Deep-Sea research, v. 11, p. 11-33
- Müller, R.D., Sdrolias, M., Gaina, C., and Roest, W.R., 2008. Age, spreading rates and spreading symmetry of the world’s ocean crust in Geochem. Geophys. Geosyst., 9, Q04006, doi:10.1029/2007GC001743
- Torsvik, T.H., Tousse, S., Labaila, C., and Smethurst, M.A., 2009. A new scheme for the opening of the South Atlantic Ocean and the dissection of an Aptian salt basin in Geophysical Journal International, v. 177, p. 1315-1333.
References:
Basic & General References
Specific References
Return to the Earthquake Reports page.
- Sorted by Magnitude
- Sorted by Year
- Sorted by Day of the Year
- Sorted By Region