I don’t always have the time to write a proper Earthquake Report. However, I prepare interpretive posters for these events.
Because of this, I present Earthquake Report Lite. (but it is more than just water, like the adult beverage that claims otherwise). I will try to describe the figures included in the poster, but sometimes I will simply post the poster here.
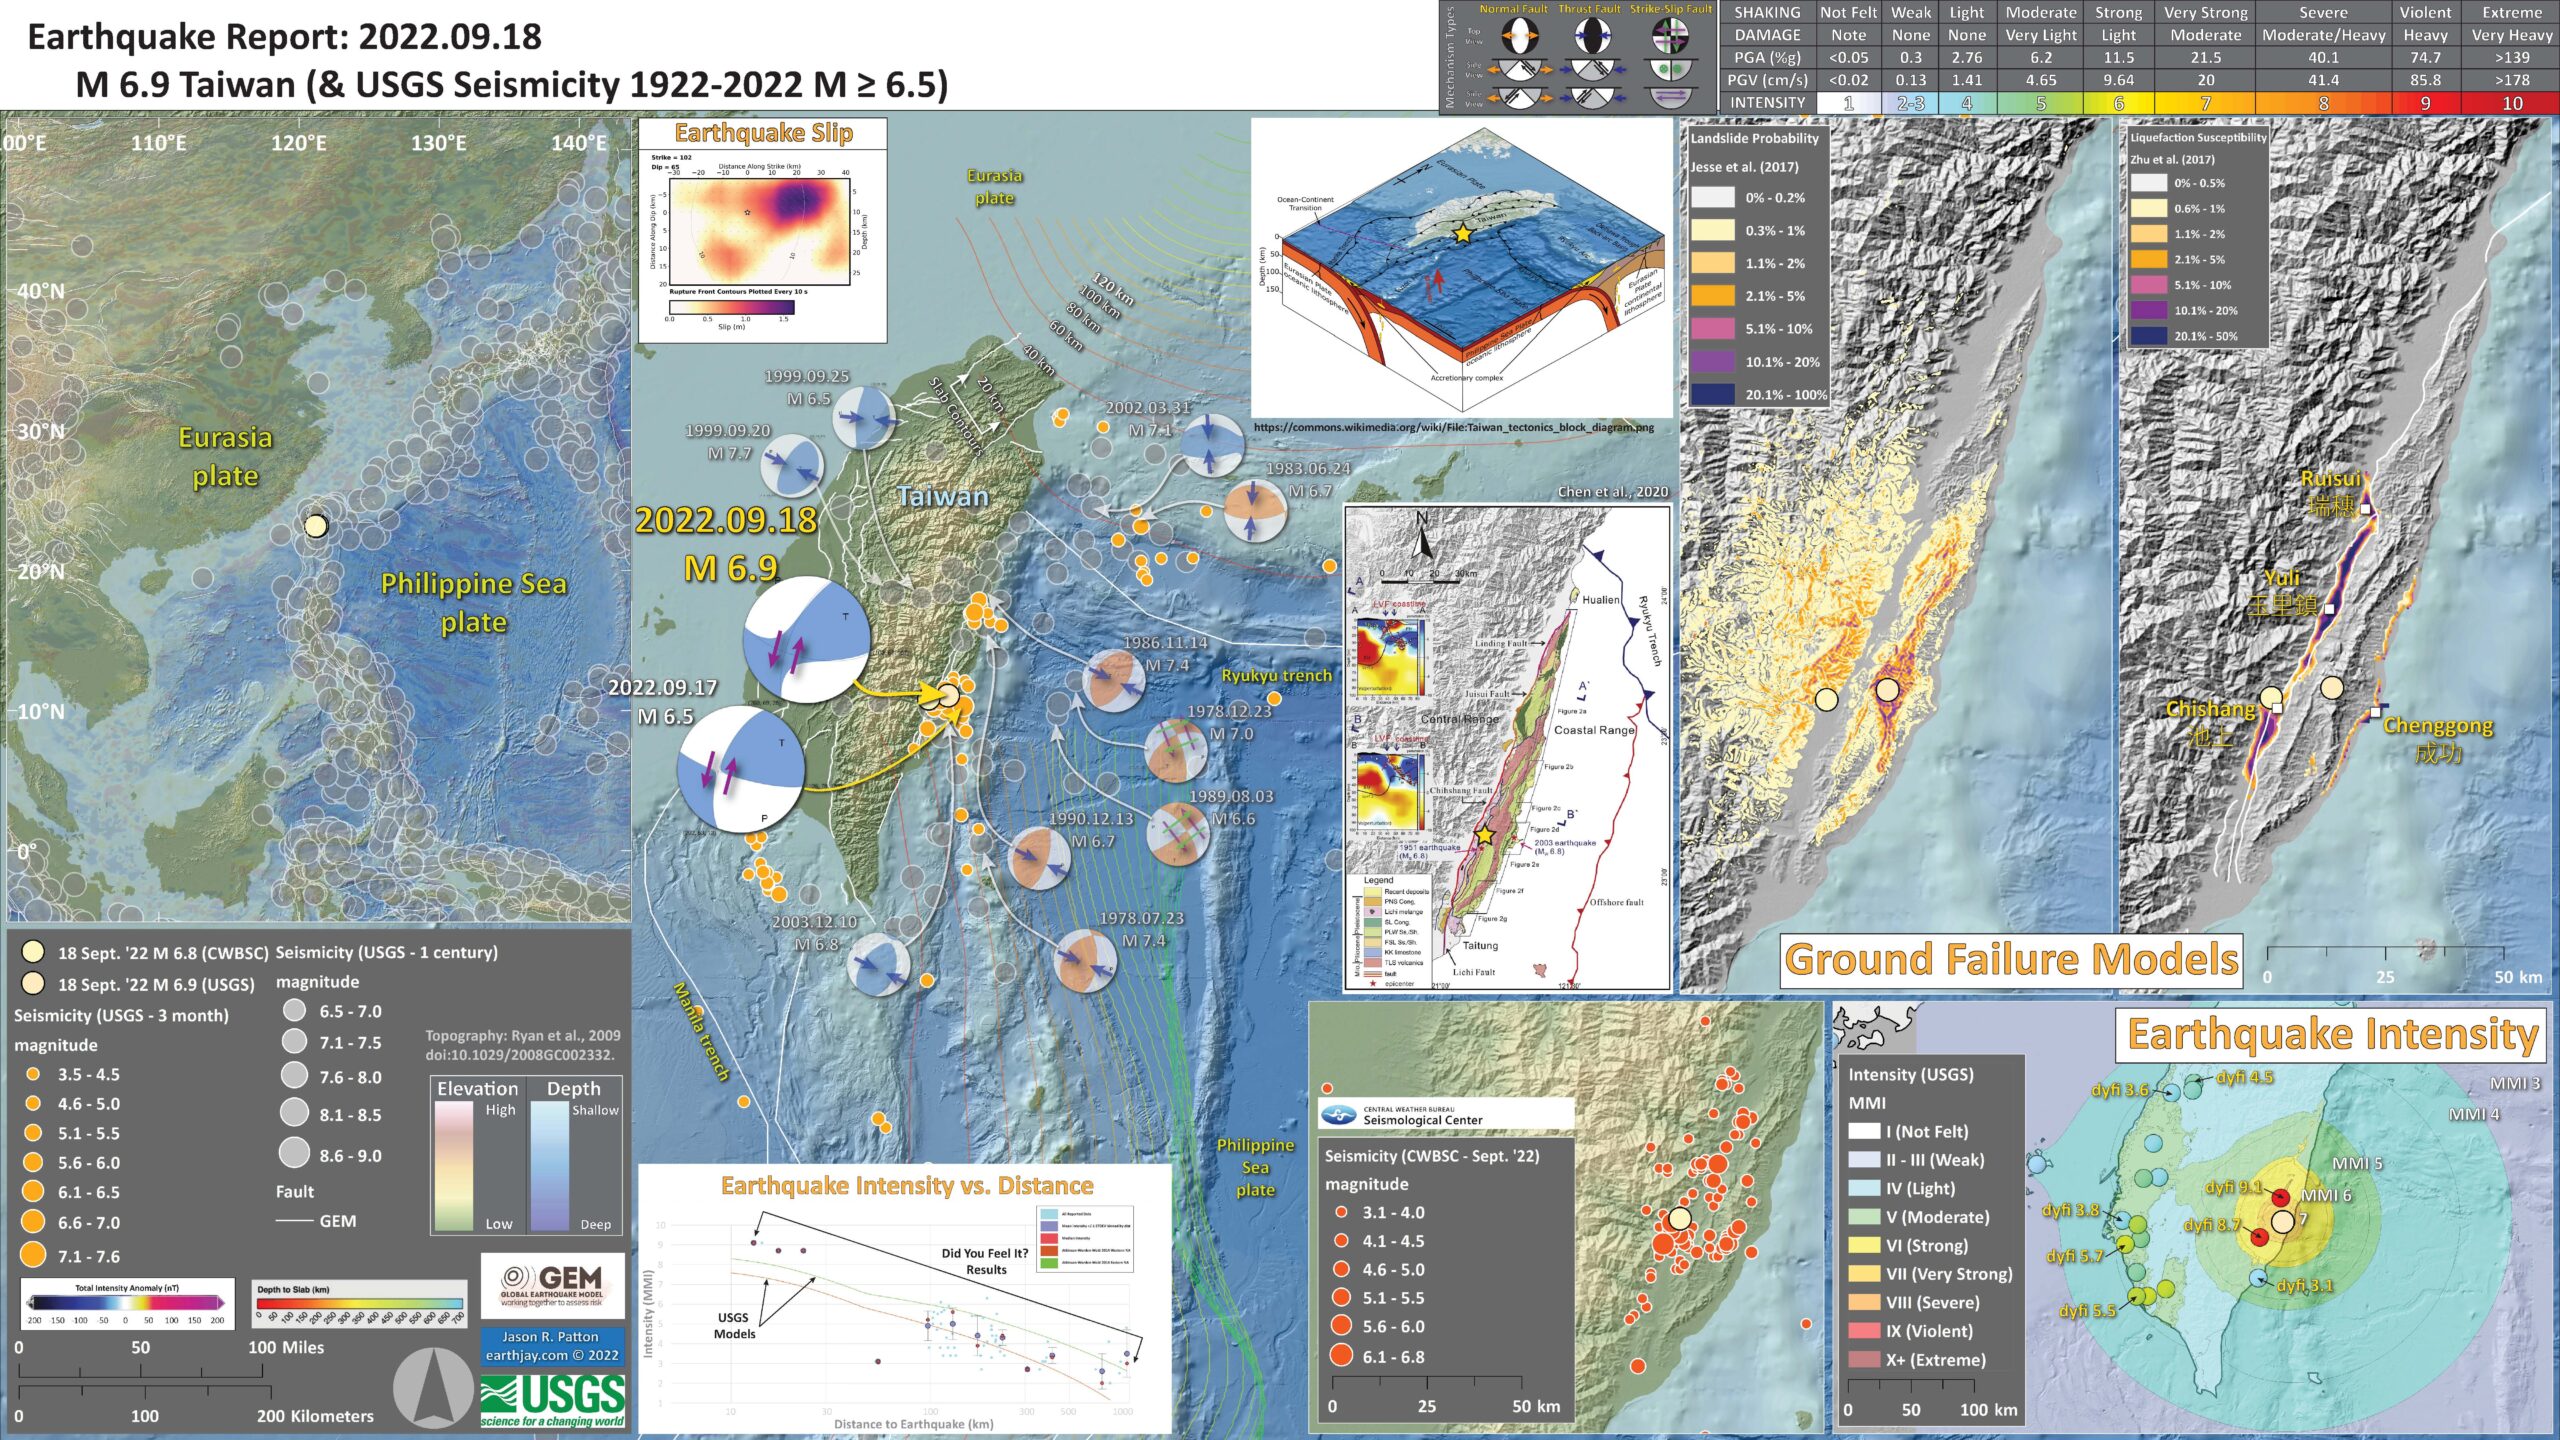
There was a magnitude M 6.9 earthquake in Taiwan on 18 September 2022.
https://earthquake.usgs.gov/earthquakes/eventpage/us7000i90q/executive
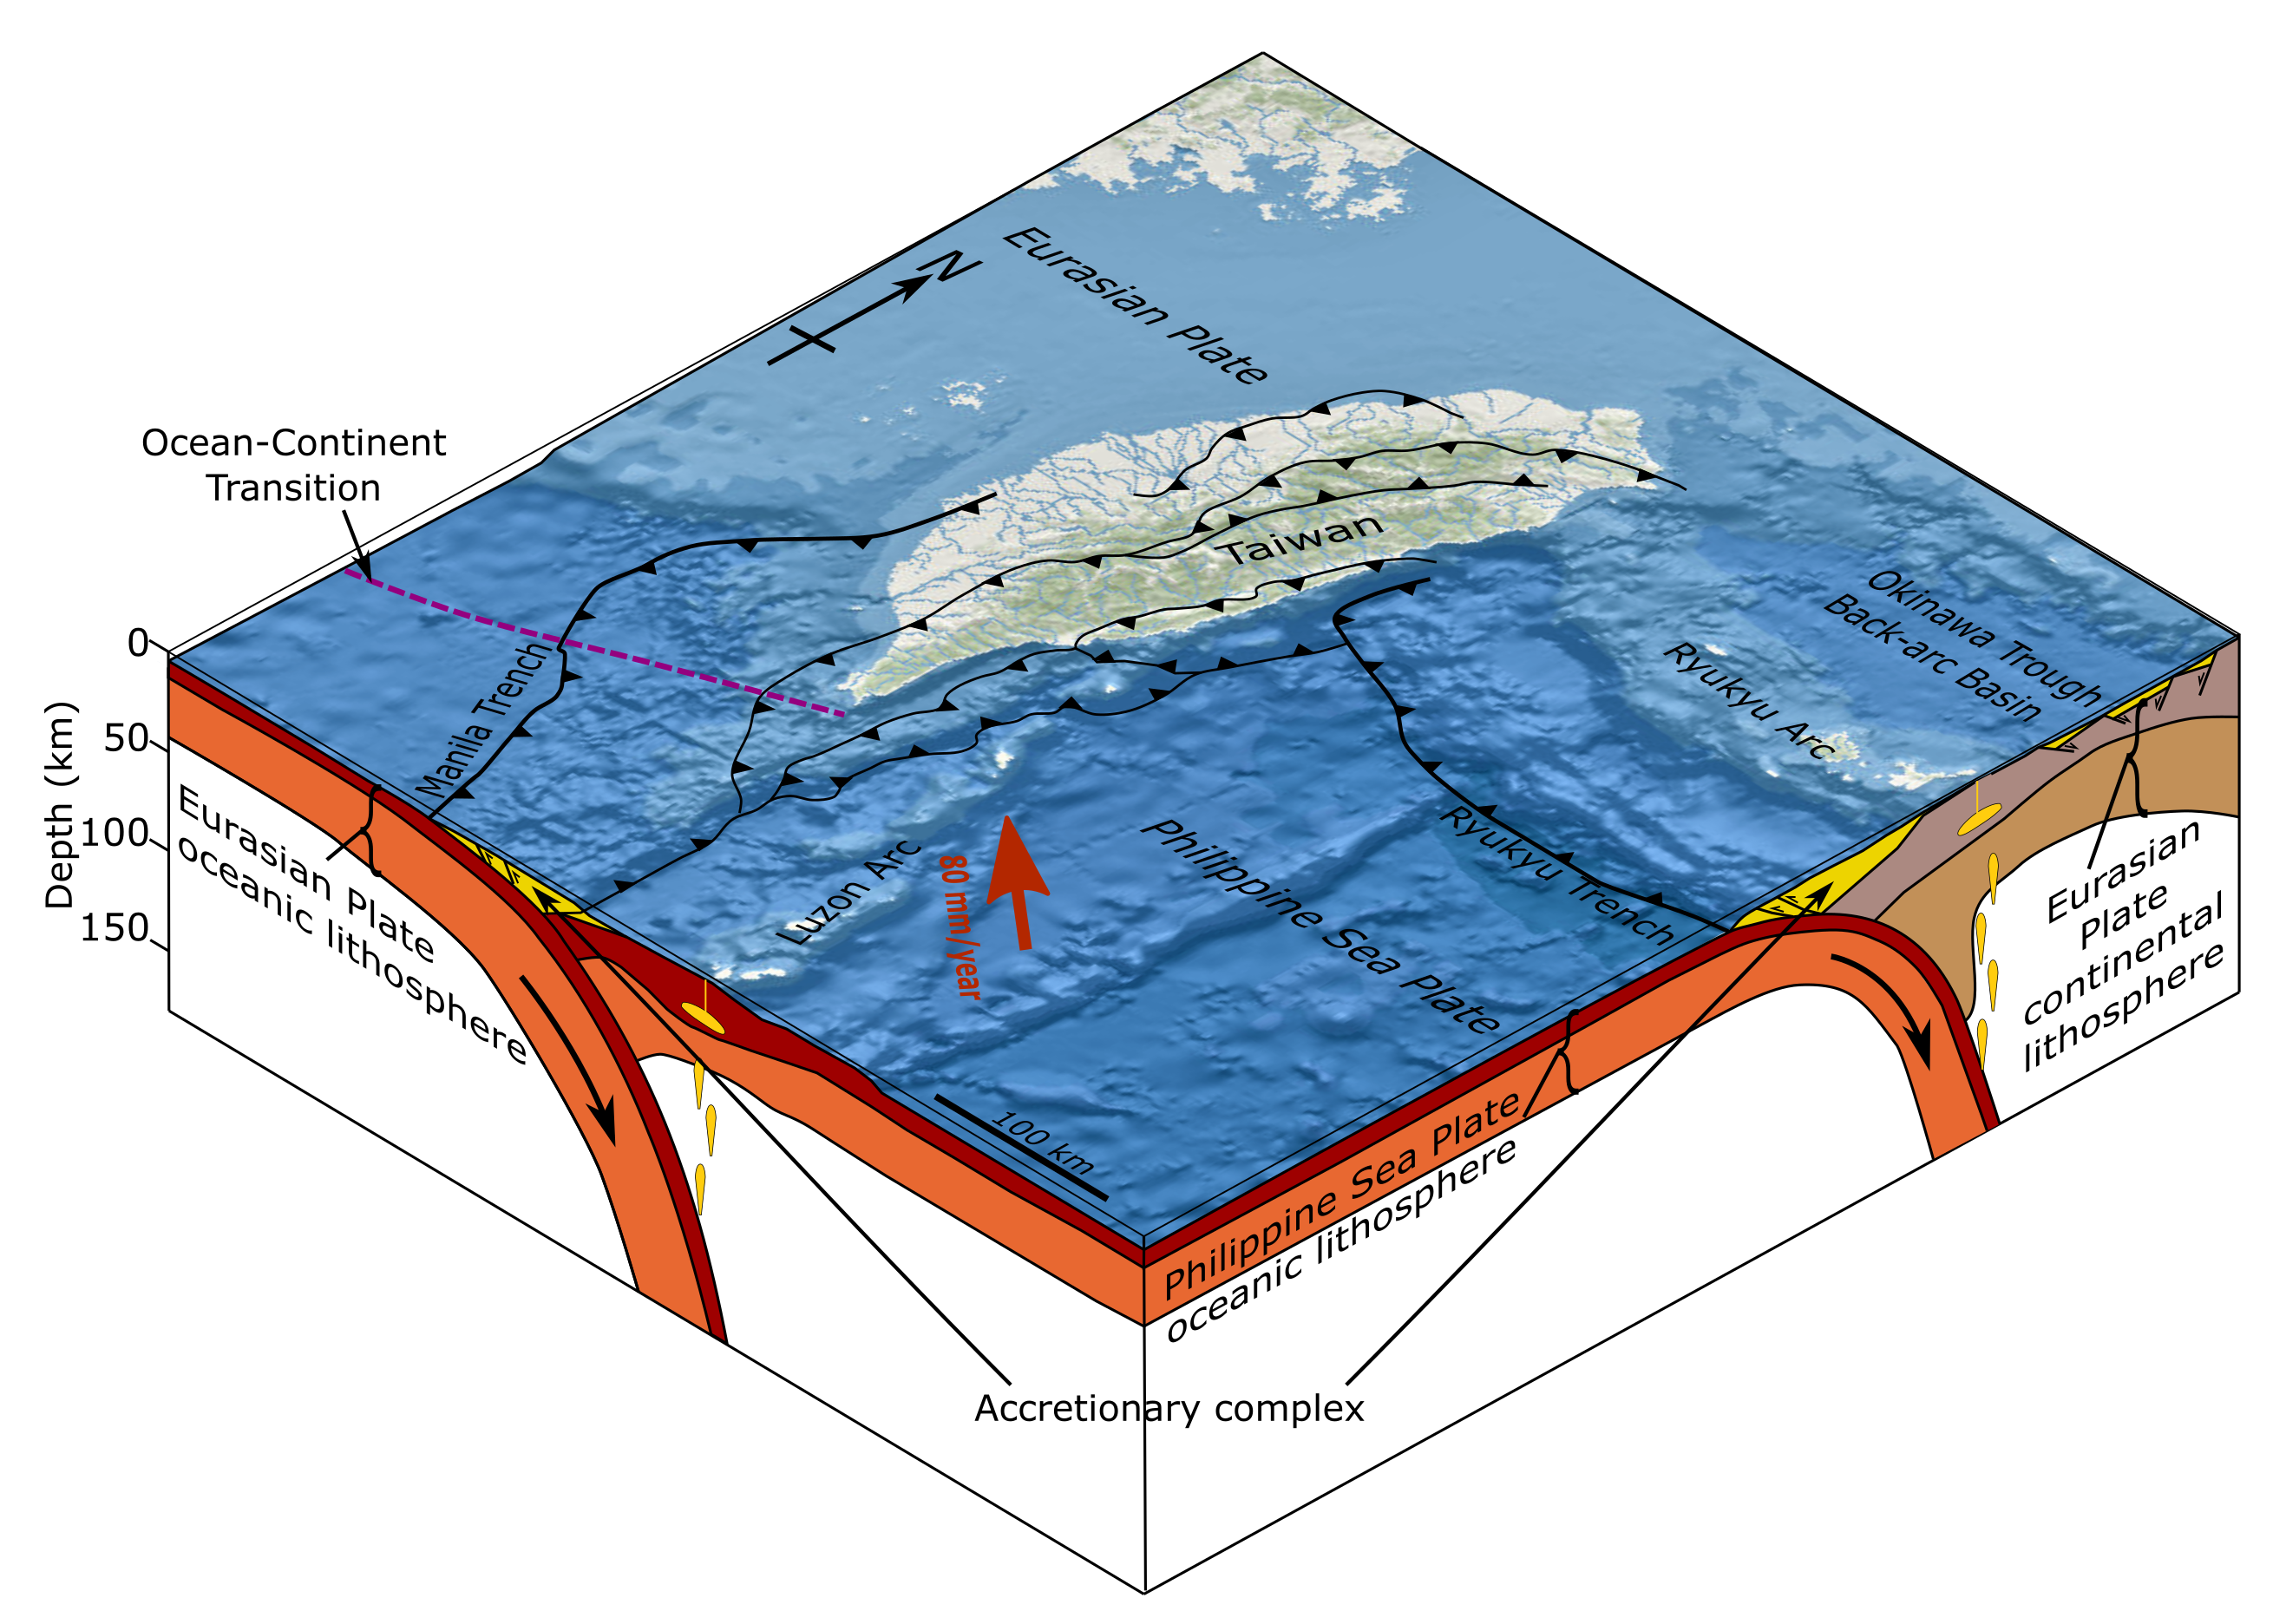
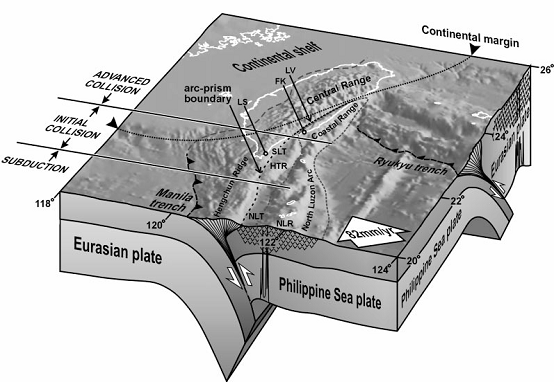
Taiwan is an interesting place, from a tectonic perspective. There is an intersection of several plate boundary fault systems here. Along the western boundary of Taiwan the Eurasia plate subducts (dives beneath) the Philippine Sea plate forming the Manila trench. This megathrust subduction zone fault system terminates somewhere in central-northern Taiwan.
Intersecting central Taiwan from the east is another subduction zone where the Philippine Sea plate subducts beneath the Eurasia plate, forming the Ryukyu trench.
There was an earthquake in Taiwan in 1999 that has been commemorated by creating a park and museum that preserves some of the evidence of the earthquake. This Chi-Chi earthquake cause lots of damage and, sadly, lots of suffering. In addition, because of the dominance of the computer chip manufacturing industry in Taiwan at the time, the price of computer chips was greatly inflated. The global economy suffered following this earthquake.
This 18 September 2022 M 6.9 earthquake occurred on a crustal fault that strikes (trends) parallel to the coast. Because of the mapped faults, I interpret this to have been a left-lateral strike slip earthquake.
There was a foreshock, a mag M 6.5 earthquake, nearby, the day before.
Below is my interpretive poster for this earthquake
- I plot the seismicity from the past month, with diameter representing magnitude (see legend). I include earthquake epicenters from 1921-2021 with magnitudes M ≥ 3.0 in one version.
- I plot the USGS fault plane solutions (moment tensors in blue and focal mechanisms in orange), possibly in addition to some relevant historic earthquakes.
- A review of the basic base map variations and data that I use for the interpretive posters can be found on the Earthquake Reports page. I have improved these posters over time and some of this background information applies to the older posters.
- Some basic fundamentals of earthquake geology and plate tectonics can be found on the Earthquake Plate Tectonic Fundamentals page.
- In the upper left corner is a map that shows the plates, their boundaries, and a century of seismicity.
- In the upper right are two maps that show models of how there may have been landslides or liquefaction because of the earthquake shaking and impacts. Read more about landslides and liquefaction here. I include both the USGS epicenter and the Central Weather Bureau Seismological Center epicenter (which is probably more accurate). However, these ground failure models are based on the USGS epicenter/location.
- To the left of those two maps is a low angle oblique view of the tectonic plates and how they are oriented relative to each other.
- Below that figure, in the center, is a map from Chen at al. (2020) that shows the earthquake fault mapping along eastern Taiwan. I place a yellow star in the location of the M 6.9 epicenter (the location of the earthquake on the ground surface).
- In the lower right corner is a map that shows the ground shaking from the earthquake, with color representing intensity using the Modified Mercalli Intensity (MMI) scale. The closer to the earthquake, the stronger the ground shaking. The colors on the map represent the USGS model of ground shaking. The colored circles represent reports from people who posted information on the USGS Did You Feel It? part of the website for this earthquake. There are things that affect the strength of ground shaking other than distance, which is why the reported intensities are different from the modeled intensities.
- To the left of the intensity map is a map that shows seismicity from the Central Weather Bureau Seismological Center. The locations of earthquakes from this center are better than those from the USGS since this organization runs a local seismic network (the USGS runs a global network). The local network uses more seismometers than the global network (so can detect more events, in this region).
- To the left of this seismicity map is a plot that shows how the shaking intensity models and reports relate to each other. The horizontal axis is distance from the earthquake and the vertical axis is shaking intensity (using the MMI scale, just like in the map to the right: these are the same datasets).
- In the upper left-center is a figure that shows the USGS earthquake slip model. This shows how much the fault slipped in different areas (based on their modeling, not observation). The model shows that there were places that may have slipped over 1.5 meters (5 feet).
I include some inset figures.
- Here is the map with 3 month’s seismicity plotted.
- I could not help myself. I am so excited to have this website back up and running, like a fully operational space station, that I include below some additional figures that help us understand the tectonic setting.
- Here is the low angle oblique view of the plate configuration in Taiwan.
- Here is the map from Chen at al. (2020) that shows the fault mapping in this area of eastern Taiwan.
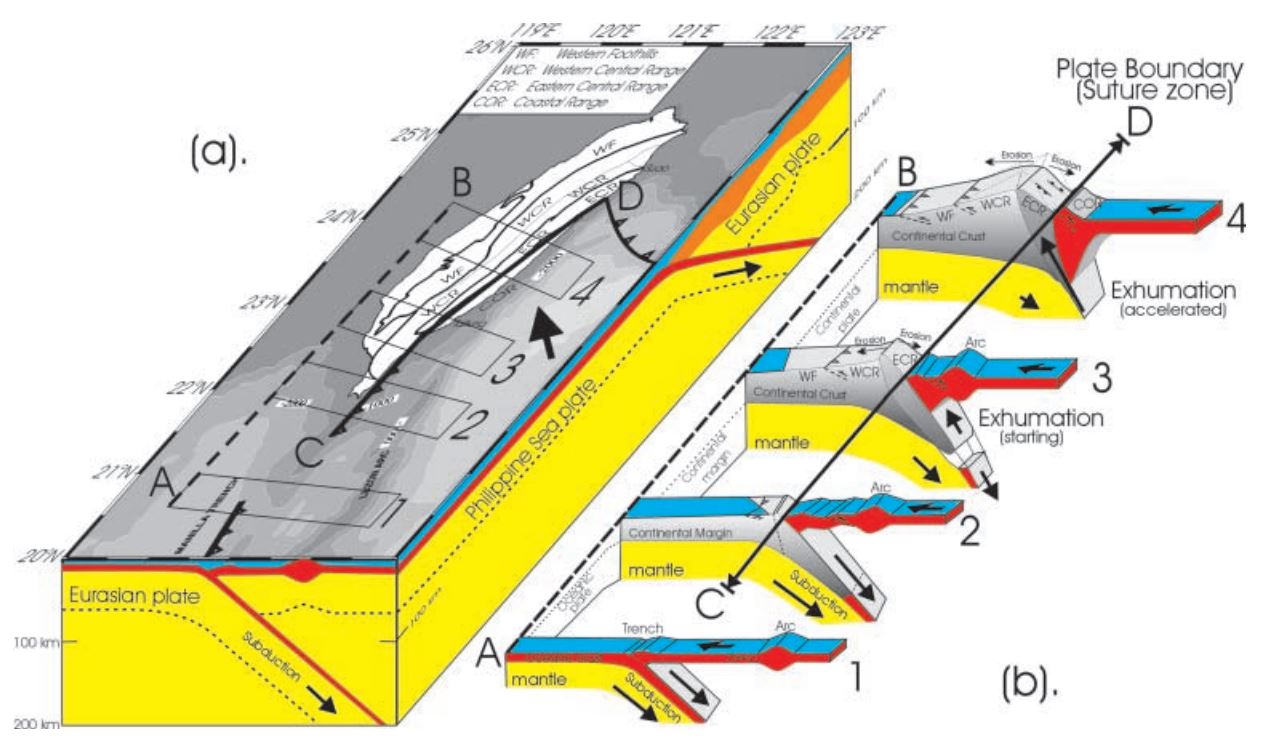
- Here is an oblique view of the plate configuration in this region. This is from Chang (2001).
- Here is a great interpretation showing how the Island of Taiwan is being uplifted and exhumed. This is from Lin (2002).
- Needless to say, this is an excellent map showing the complicated faulting of this region. This is from Theunissen et al. (2012).
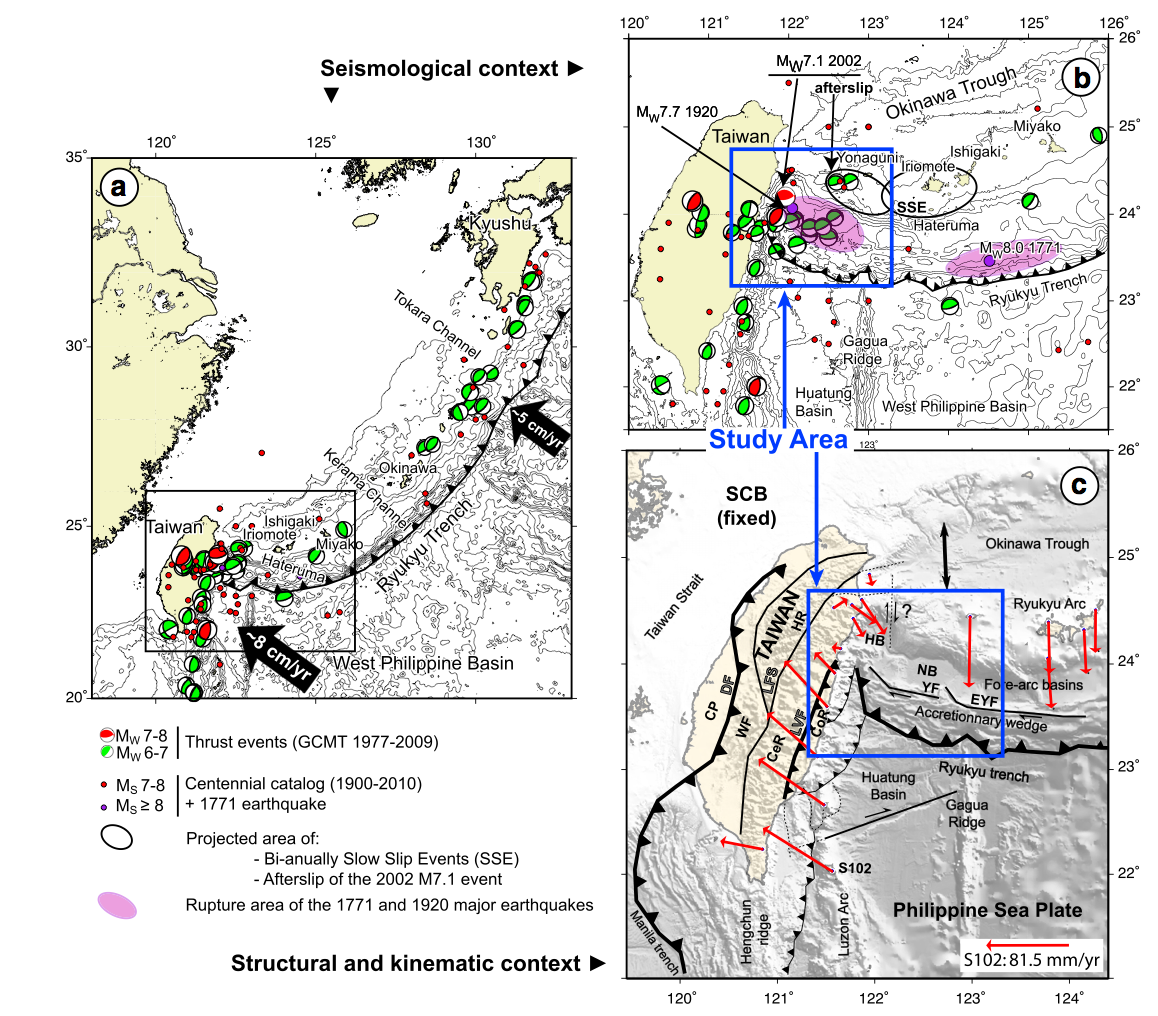
- Here is another tectonic interpretation map from here.
- Here is a great general overview of the tectonics of the region from Shyu et al. (2005). I include their figure caption below the image as a blockquote.
- This figure from Shyu et al. (2005) shows their interpretation of the different tectonic domains in Taiwan. This is a complicated region that includes collision zones in different orientations as the Okinawa Trough, Ryukyu Trench, and Manila Trench (all subduction zones) each intersect beneath and adjacent to Taiwan. I include their figure caption below the image as a blockquote.
- This map from Shyu et al. (2005) shows the earthquake slip regions for proposed earthquake scenarios. I include their figure caption below the image as a blockquote.
- This map from here shows the basement geology of Taiwan. Note the accretionary belts, including the forearc basin. This is a compilation from Teng et al. (2001) and Hsiao et al. (1998) as presented in Ustaszewski et al. (2012).
Supportive Figures
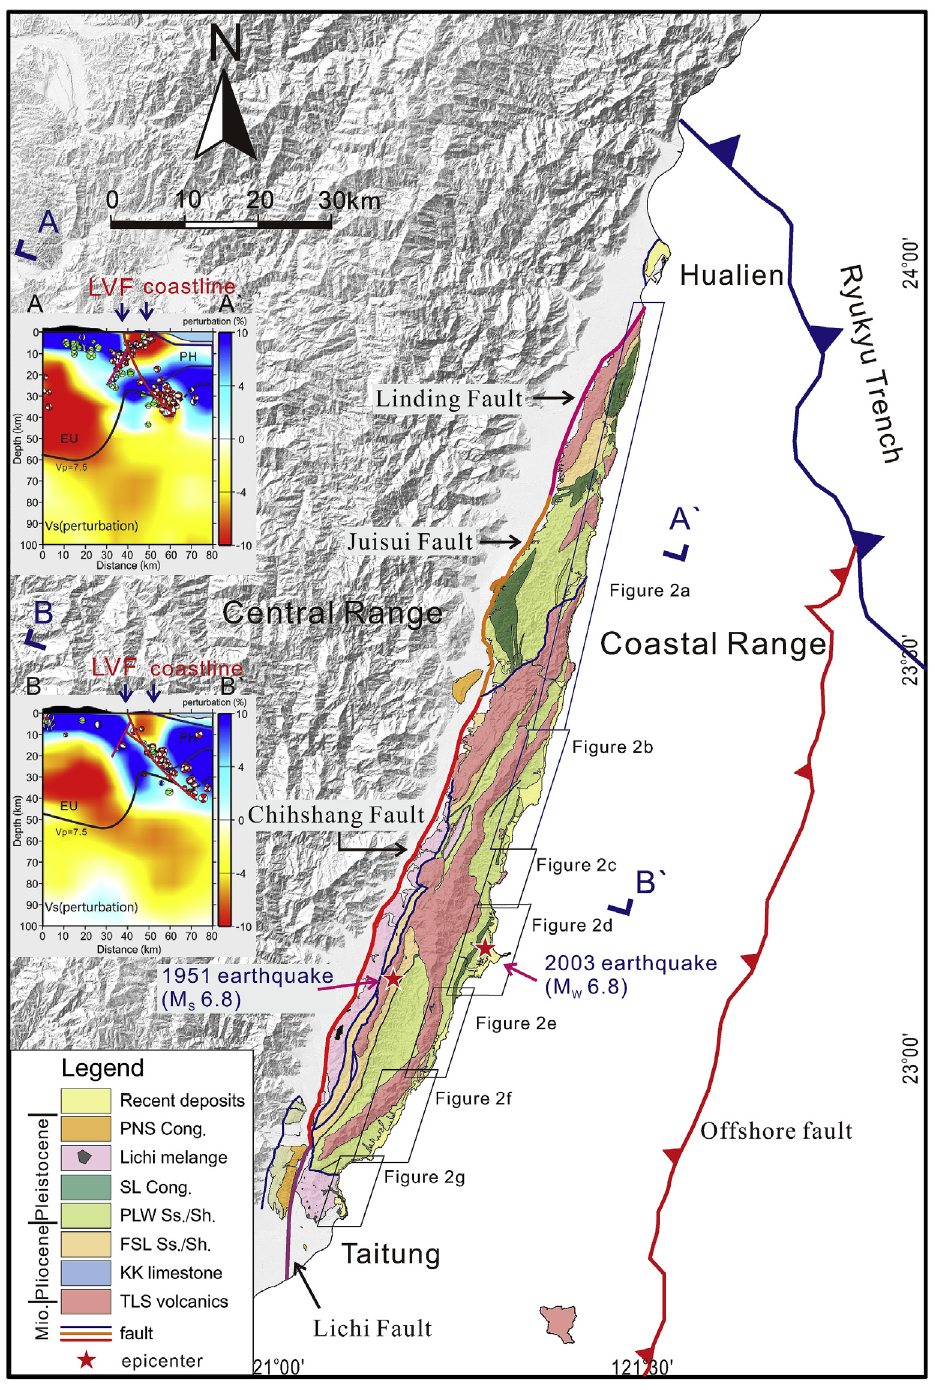
Geologic map of the Coastal Range on shaded relief (after Wang and Chen, 1993). The Longitudinal Valley Fault (LVF) can be subdivided into the Linding and Juisui locked Fault and the Chihshang and Lichi creeping Fault. Vertical cross-sections of VS perturbation tomography along the AeA0 and BeB0 profiles denote the Central Range, the Coastal Range, and the LVF. EU: Eurasian Plate; PH: Philippine Sea Plate.
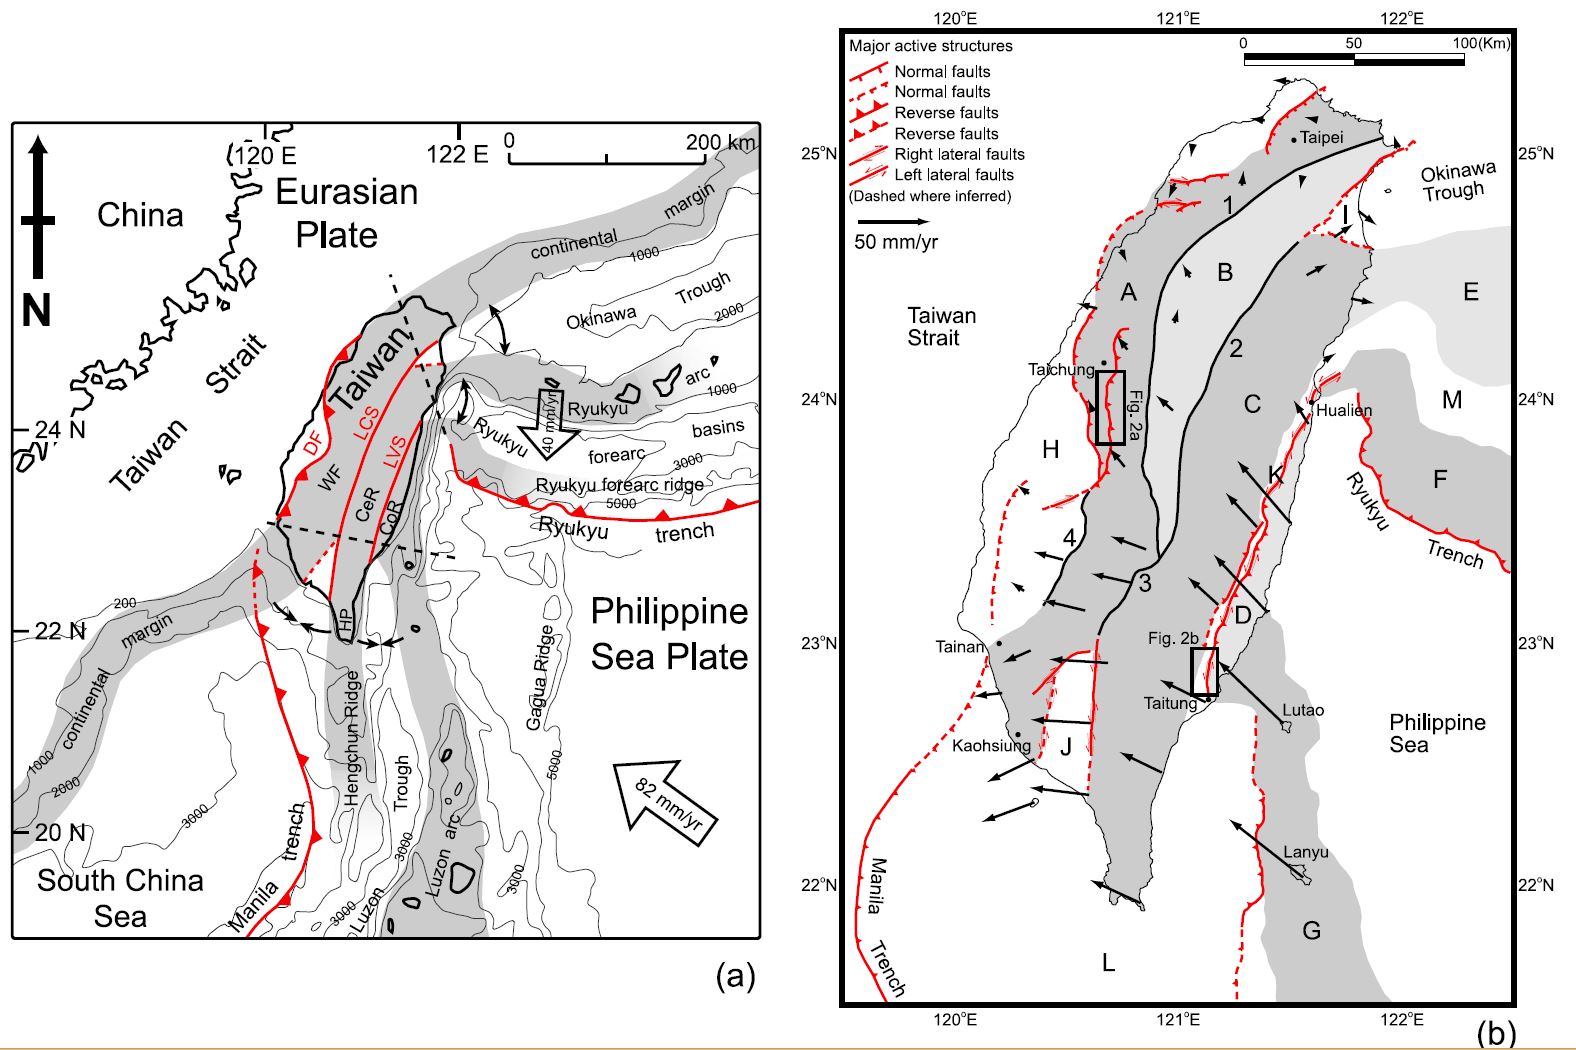
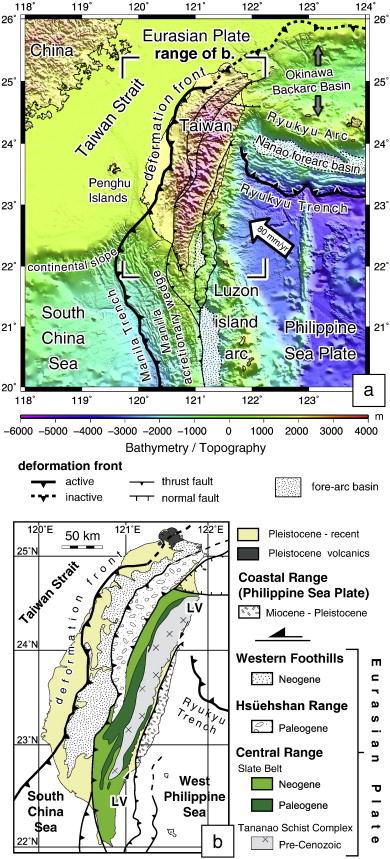
A neotectonic snapshot of Taiwan and adjacent regions. (a) Taiwan is currently experiencing a double suturing. In the south the Luzon volcanic arc is colliding with the Hengchun forearc ridge, which is, in turn, colliding with the Eurasian continental margin. In the north both sutures are unstitching. Their disengagement is forming both the Okinawa Trough and the forearc basins of the Ryukyu arc. Thus, in the course of passing through the island, the roles of the volcanic arc and forearc ridge flip along with the flipping of the polarity of subduction. The three gray strips represent the three lithospheric pieces of Taiwan’s tandem suturing and disarticulation: the Eurasian continental margin, the continental sliver, and the Luzon arc. Black arrows indicate the suturing and disarticulation. This concept is discussed in detail by Shyu et al. [2005]. Current velocity vector of the Philippine Sea plate relative to the Eurasian plate is adapted from Yu et al. [1997, 1999]. Current velocity vector of the Ryukyu arc is adapted from Lallemand and Liu [1998]. Black dashed lines are the northern and western limits of the Wadati-Benioff zone of the two subducting systems, taken from the seismicity database of the Central Weather Bureau, Taiwan. DF, deformation front; LCS, Lishan-Chaochou suture; LVS, Longitudinal Valley suture; WF, Western Foothills; CeR, Central Range; CoR, Coastal Range; HP, Hengchun Peninsula. (b) Major tectonic elements around Taiwan. Active structures identified in this study are shown in red. Major inactive faults that form the boundaries of tectonic elements are shown in black: 1, Chiuchih fault; 2, Lishan fault; 3, Laonung fault; 4, Chukou fault. Selected GPS vectors relative to the stable Eurasian continental shelf are adapted from Yu et al. [1997]. A,Western Foothills; B, Hsueshan Range; C, Central Range and Hengchun Peninsula; D, Coastal Range; E, westernmost Ryukyu arc; F, Yaeyama forearc ridge; G, northernmost Luzon arc; H, western Taiwan coastal plains; I, Lanyang Plain; J, Pingtung Plain; K, Longitudinal Valley; L, submarine Hengchun Ridge; M, Ryukyu forearc basins.
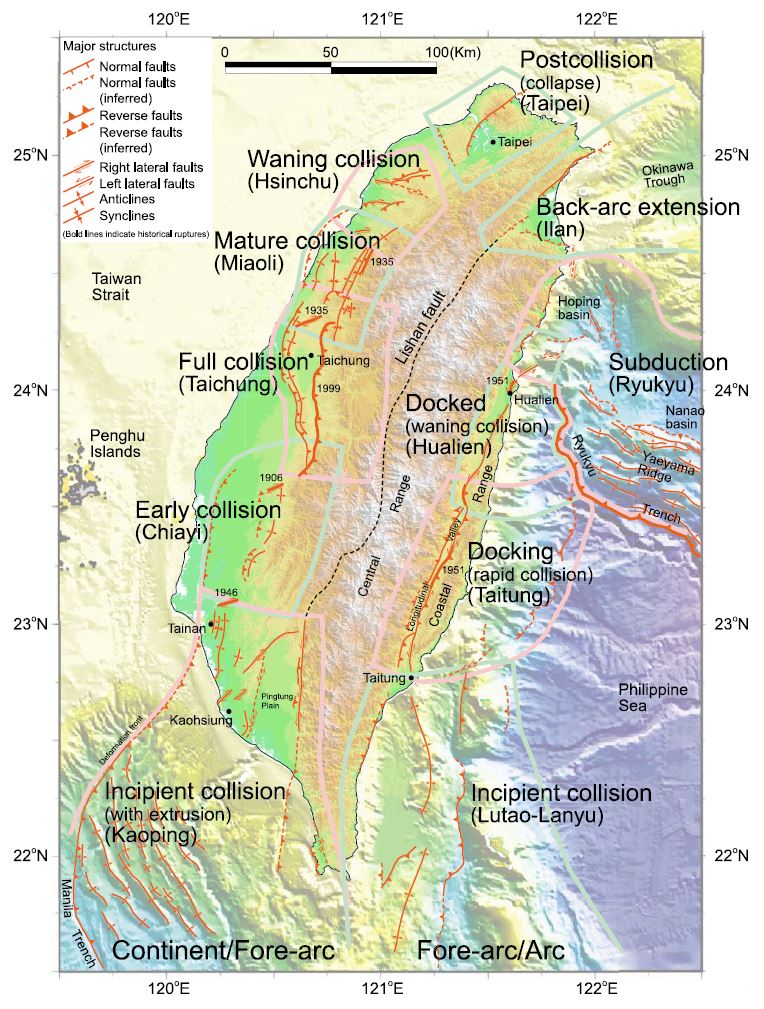
Map of major active faults and folds of Taiwan (in red) showing that the two sutures are producing separate western and eastern neotectonic belts. Each collision belt matures and then decays progressively from south to north. This occurs in discrete steps, manifested as seven distinct neotectonic domains along the western belt and four along the eastern. A distinctive assemblage of active structures defines each domain. For example, two principal structures dominate the Taichung Domain. Rupture in 1999 of one of these, the Chelungpu fault, caused the disastrous Chi-Chi earthquake. The Lishan fault (dashed black line) is the suture between forearc ridge and continental margin. Thick light green and pink lines are boundaries of domains.
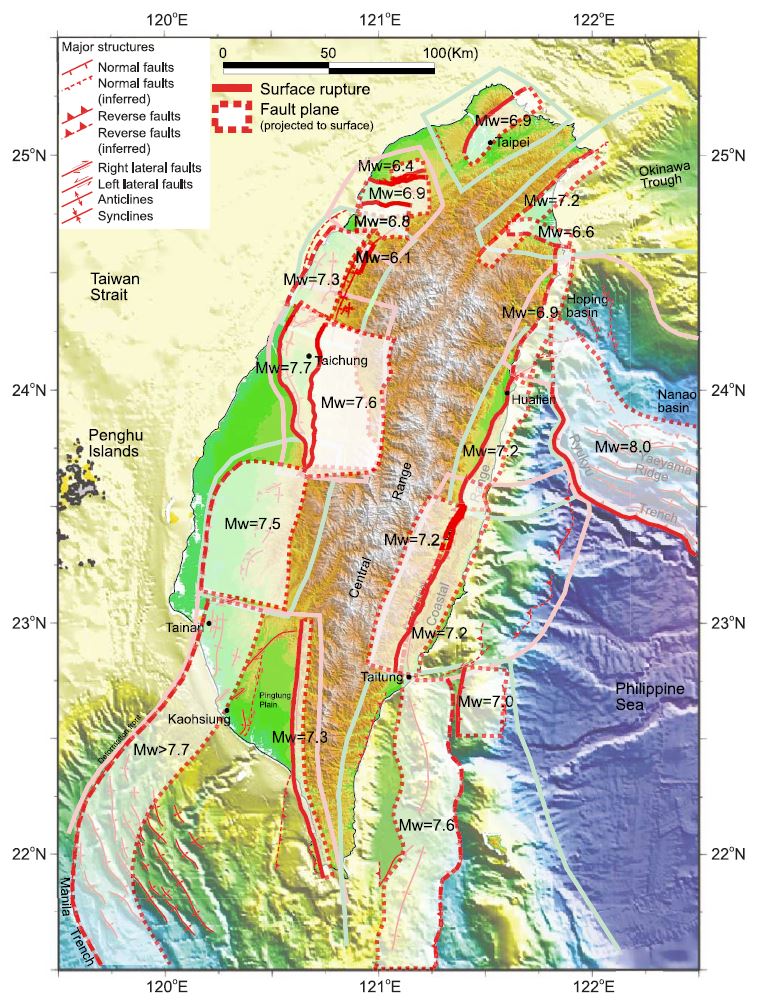
Proposed major sources for future large earthquakes in and around Taiwan. Thick red lines are proposed future ruptures, and the white patches are rupture planes projected to the surface. Here we have selected only a few representative scenarios from Table 1. Earthquake magnitude of each scenario is predicted value from our calculation.
Social Media:
#EarthquakeReport for M 6.9 #Earthquake in Taiwan on 18 September 2022
there was lots of damage and some casualties :-(
landslides and liquefaction models show that there was a high likelihood for these.https://t.co/3tzXgvQl26
damage informationhttps://t.co/I95RUCSWkh pic.twitter.com/TPKL95vqHI
— Jason "Jay" R. Patton (@patton_cascadia) November 9, 2022
- 2022.09.18 M 6.9 Taiwan
- 2021.05.21 M 7.3 China
- 2018.01.11 M 6.0 Burma
- 2017.08.08 M 6.3 China (different)
- 2017.08.08 M 6.5 China
- 2016.08.24 M 6.8 Burma
- 2016.04.13 M 6.9 Burma
- 2016.02.23 M 5.9 Antarctic plate
- 2016.02.05 M 6.4 Taiwan
- 2016.02.05 M 6.4 Taiwan Update #1
- 2015.12.04 M 7.1 SE India Ridge
- 2015.04.24 M 7.8 Nepal
- 2015.04.25 M 7.8 Nepal Update #1
- 2015.04.25 M 7.8 Nepal Update #2
- 2015.04.26 M 7.8 Nepal Update #3
- 2015.04.26 M 7.8 Nepal Update #4
- 2015.04.27 M 7.8 Nepal Update #5
- 2015.04.27 M 7.8 Nepal Update #6
India | Asia | India Ocean
Earthquake Reports
- Frisch, W., Meschede, M., Blakey, R., 2011. Plate Tectonics, Springer-Verlag, London, 213 pp.
- Hayes, G., 2018, Slab2 – A Comprehensive Subduction Zone Geometry Model: U.S. Geological Survey data release, https://doi.org/10.5066/F7PV6JNV.
- Holt, W. E., C. Kreemer, A. J. Haines, L. Estey, C. Meertens, G. Blewitt, and D. Lavallee (2005), Project helps constrain continental dynamics and seismic hazards, Eos Trans. AGU, 86(41), 383–387, , https://doi.org/10.1029/2005EO410002. /li>
- Jessee, M.A.N., Hamburger, M. W., Allstadt, K., Wald, D. J., Robeson, S. M., Tanyas, H., et al. (2018). A global empirical model for near-real-time assessment of seismically induced landslides. Journal of Geophysical Research: Earth Surface, 123, 1835–1859. https://doi.org/10.1029/2017JF004494
- Kreemer, C., J. Haines, W. Holt, G. Blewitt, and D. Lavallee (2000), On the determination of a global strain rate model, Geophys. J. Int., 52(10), 765–770.
- Kreemer, C., W. E. Holt, and A. J. Haines (2003), An integrated global model of present-day plate motions and plate boundary deformation, Geophys. J. Int., 154(1), 8–34, , https://doi.org/10.1046/j.1365-246X.2003.01917.x.
- Kreemer, C., G. Blewitt, E.C. Klein, 2014. A geodetic plate motion and Global Strain Rate Model in Geochemistry, Geophysics, Geosystems, v. 15, p. 3849-3889, https://doi.org/10.1002/2014GC005407.
- Meyer, B., Saltus, R., Chulliat, a., 2017. EMAG2: Earth Magnetic Anomaly Grid (2-arc-minute resolution) Version 3. National Centers for Environmental Information, NOAA. Model. https://doi.org/10.7289/V5H70CVX
- Müller, R.D., Sdrolias, M., Gaina, C. and Roest, W.R., 2008, Age spreading rates and spreading asymmetry of the world’s ocean crust in Geochemistry, Geophysics, Geosystems, 9, Q04006, https://doi.org/10.1029/2007GC001743
- Pagani,M. , J. Garcia-Pelaez, R. Gee, K. Johnson, V. Poggi, R. Styron, G. Weatherill, M. Simionato, D. Viganò, L. Danciu, D. Monelli (2018). Global Earthquake Model (GEM) Seismic Hazard Map (version 2018.1 – December 2018), DOI: 10.13117/GEM-GLOBAL-SEISMIC-HAZARD-MAP-2018.1
- Silva, V ., D Amo-Oduro, A Calderon, J Dabbeek, V Despotaki, L Martins, A Rao, M Simionato, D Viganò, C Yepes, A Acevedo, N Horspool, H Crowley, K Jaiswal, M Journeay, M Pittore, 2018. Global Earthquake Model (GEM) Seismic Risk Map (version 2018.1). https://doi.org/10.13117/GEM-GLOBAL-SEISMIC-RISK-MAP-2018.1
- Zhu, J., Baise, L. G., Thompson, E. M., 2017, An Updated Geospatial Liquefaction Model for Global Application, Bulletin of the Seismological Society of America, 107, p 1365-1385, https://doi.org/0.1785/0120160198
- Chen, W-S., Yang, C.Y., Chen, S-T., and Huang, Y-C., 2020. New insights into Holocene marine terrace development caused by seismic and aseismic faulting in the Coastal Range, eastern Taiwan in Quaternary Science Reviews, vol. 240, https://doi.org/10.1016/j.quascirev.2020.106369
- Shyu, J. B. H., K. Sieh, Y.-G. Chen, and C.-S. Liu, 2005. Neotectonic architecture of Taiwan and its implications for future large earthquakes in J. Geophys. Res., 110, B08402, doi:10.1029/2004JB003251.
- Smoczyk, G.M., Hayes, G.P., Hamburger, M.W., Benz, H.M., Villaseñor, Antonio, and Furlong, K.P., 2013. Seismicity of the Earth 1900–2012 Philippine Sea Plate and vicinity: U.S. Geological Survey Open-File Report 2010–1083-M, scale 1:10,000,000, http://dx.doi.org/10.3133/ofr20101083m.
- Ustaszewski, K., Wu, Y-M., Suppe, J., Huang, H-H., Chang, C-H., and Carena, S., 2012. Crust–mantle boundaries in the Taiwan–Luzon arc-continent collision system determined from local earthquake tomography and 1D models: Implications for the mode of subduction polarity reversal in Tectonophysics, v. 578, p. 31-49.
References:
Basic & General References
Specific References
Return to the Earthquake Reports page.
- Sorted by Magnitude
- Sorted by Year
- Sorted by Day of the Year
- Sorted By Region