Busy week!
We just had a M 7.3 earthquake in northern Venezuela. Sadly, this large earthquake has the potential to be quite damaging to people and their belongings (buildings, infrastructure).
https://earthquake.usgs.gov/earthquakes/eventpage/us1000gez7/executive
The northeastern part of Venezuela lies a large strike-slip plate boundary fault, the El Pilar fault. This fault is rather complicated as it strikes through the region. There are thrust faults and normal faults forming ocean basins and mountains along strike.
Many of the earthquakes along this fault system are strike-slip earthquakes (e.g. the 1997.07.09 M 7.0 earthquake which is just to the southwest of today’s temblor. However, today’s earthquake broke my immediate expectations for strike-slip tectonics. There is a south vergent (dipping to the north) thrust fault system that strikes (is oriented) east-west along the Península de Paria, just north of highway 9, east of Carupano, Venezuela. Audenard et al. (2000, 2006) compiled a Quaternary Fault database for Venezuela, which helps us interpret today’s earthquake. I suspect that this earthquake occurred on this thrust fault system. I bet those that work in this area even know the name of this fault.
However, looking at the epicenter and the location of the thrust fault, this is probably not on this thrust fault. When I initially wrote this report, the depth was much shallower. Currently, the hypocentral (3-D location) depth is 123 km, so cannot be on that thrust fault.
The best alternative might be the subduction zone associated with the Lesser Antilles.
GPS data support the hypothesis that the El Pilar fault is accumulating strike-slip strain, but there is a paucity of evidence that there is active convergence across the thrust fault. However, there does appear to be some small amount of contraction (Reinoza, et a.,. 2015).
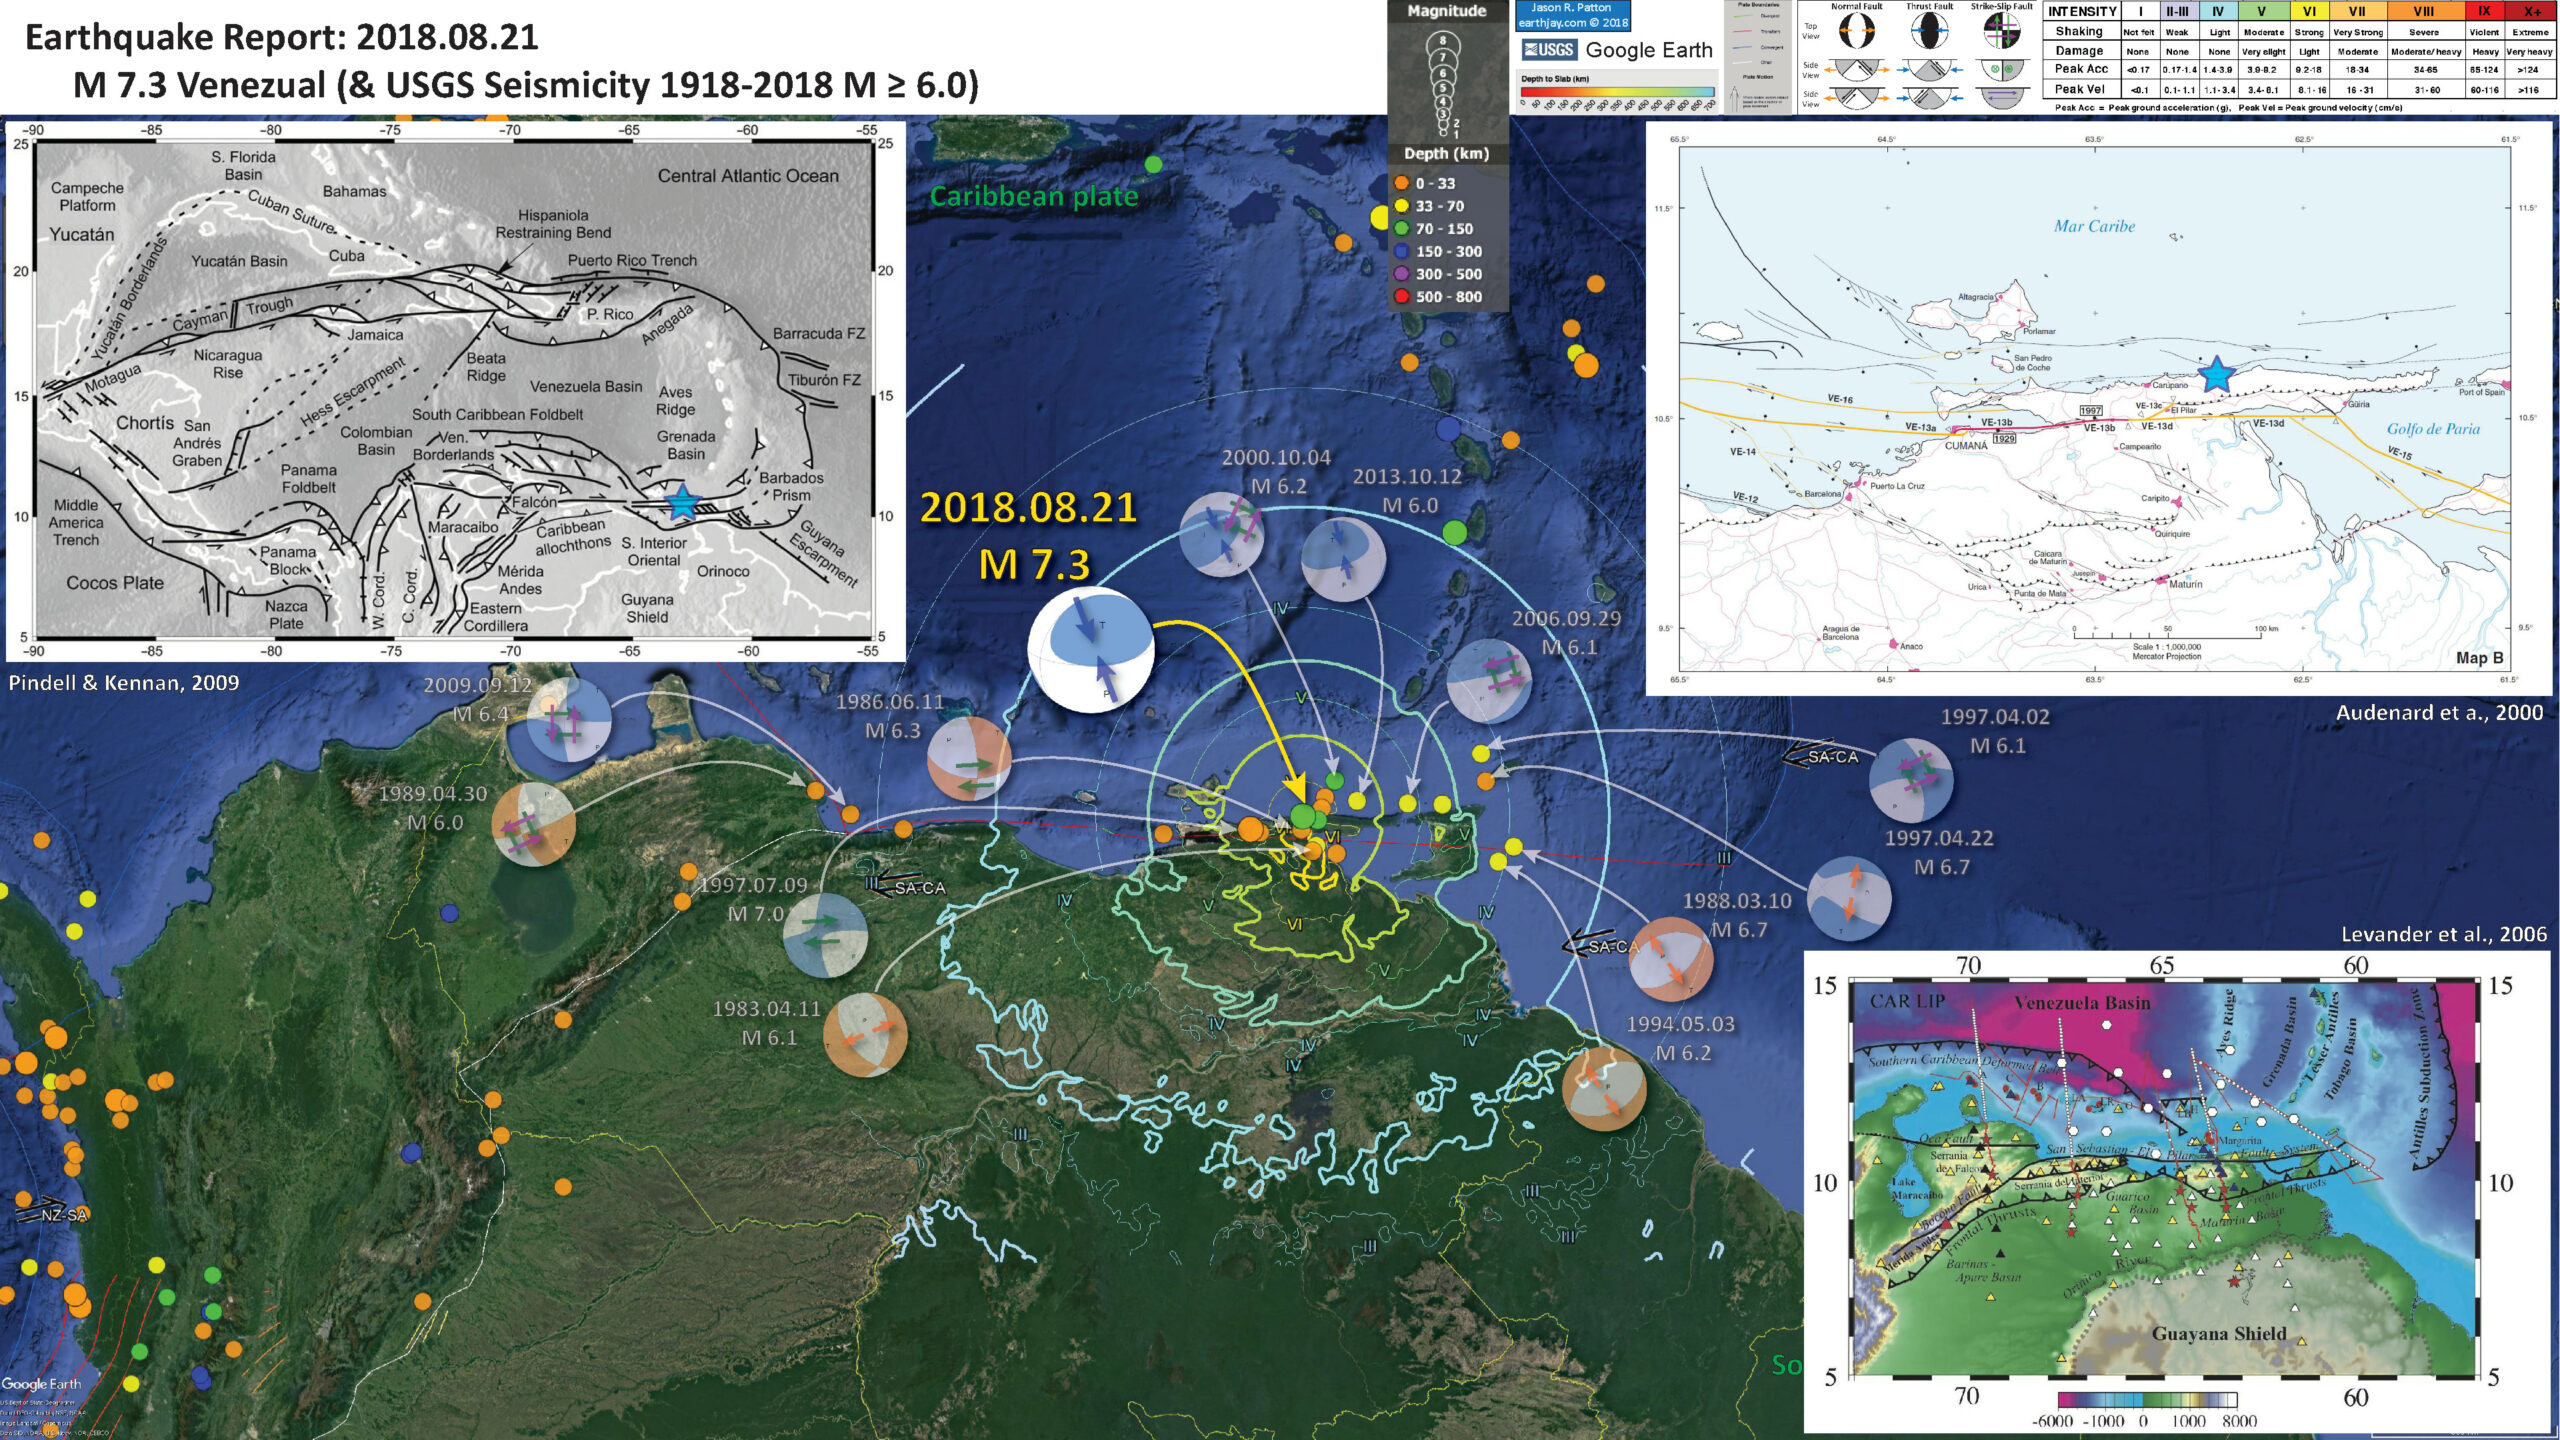
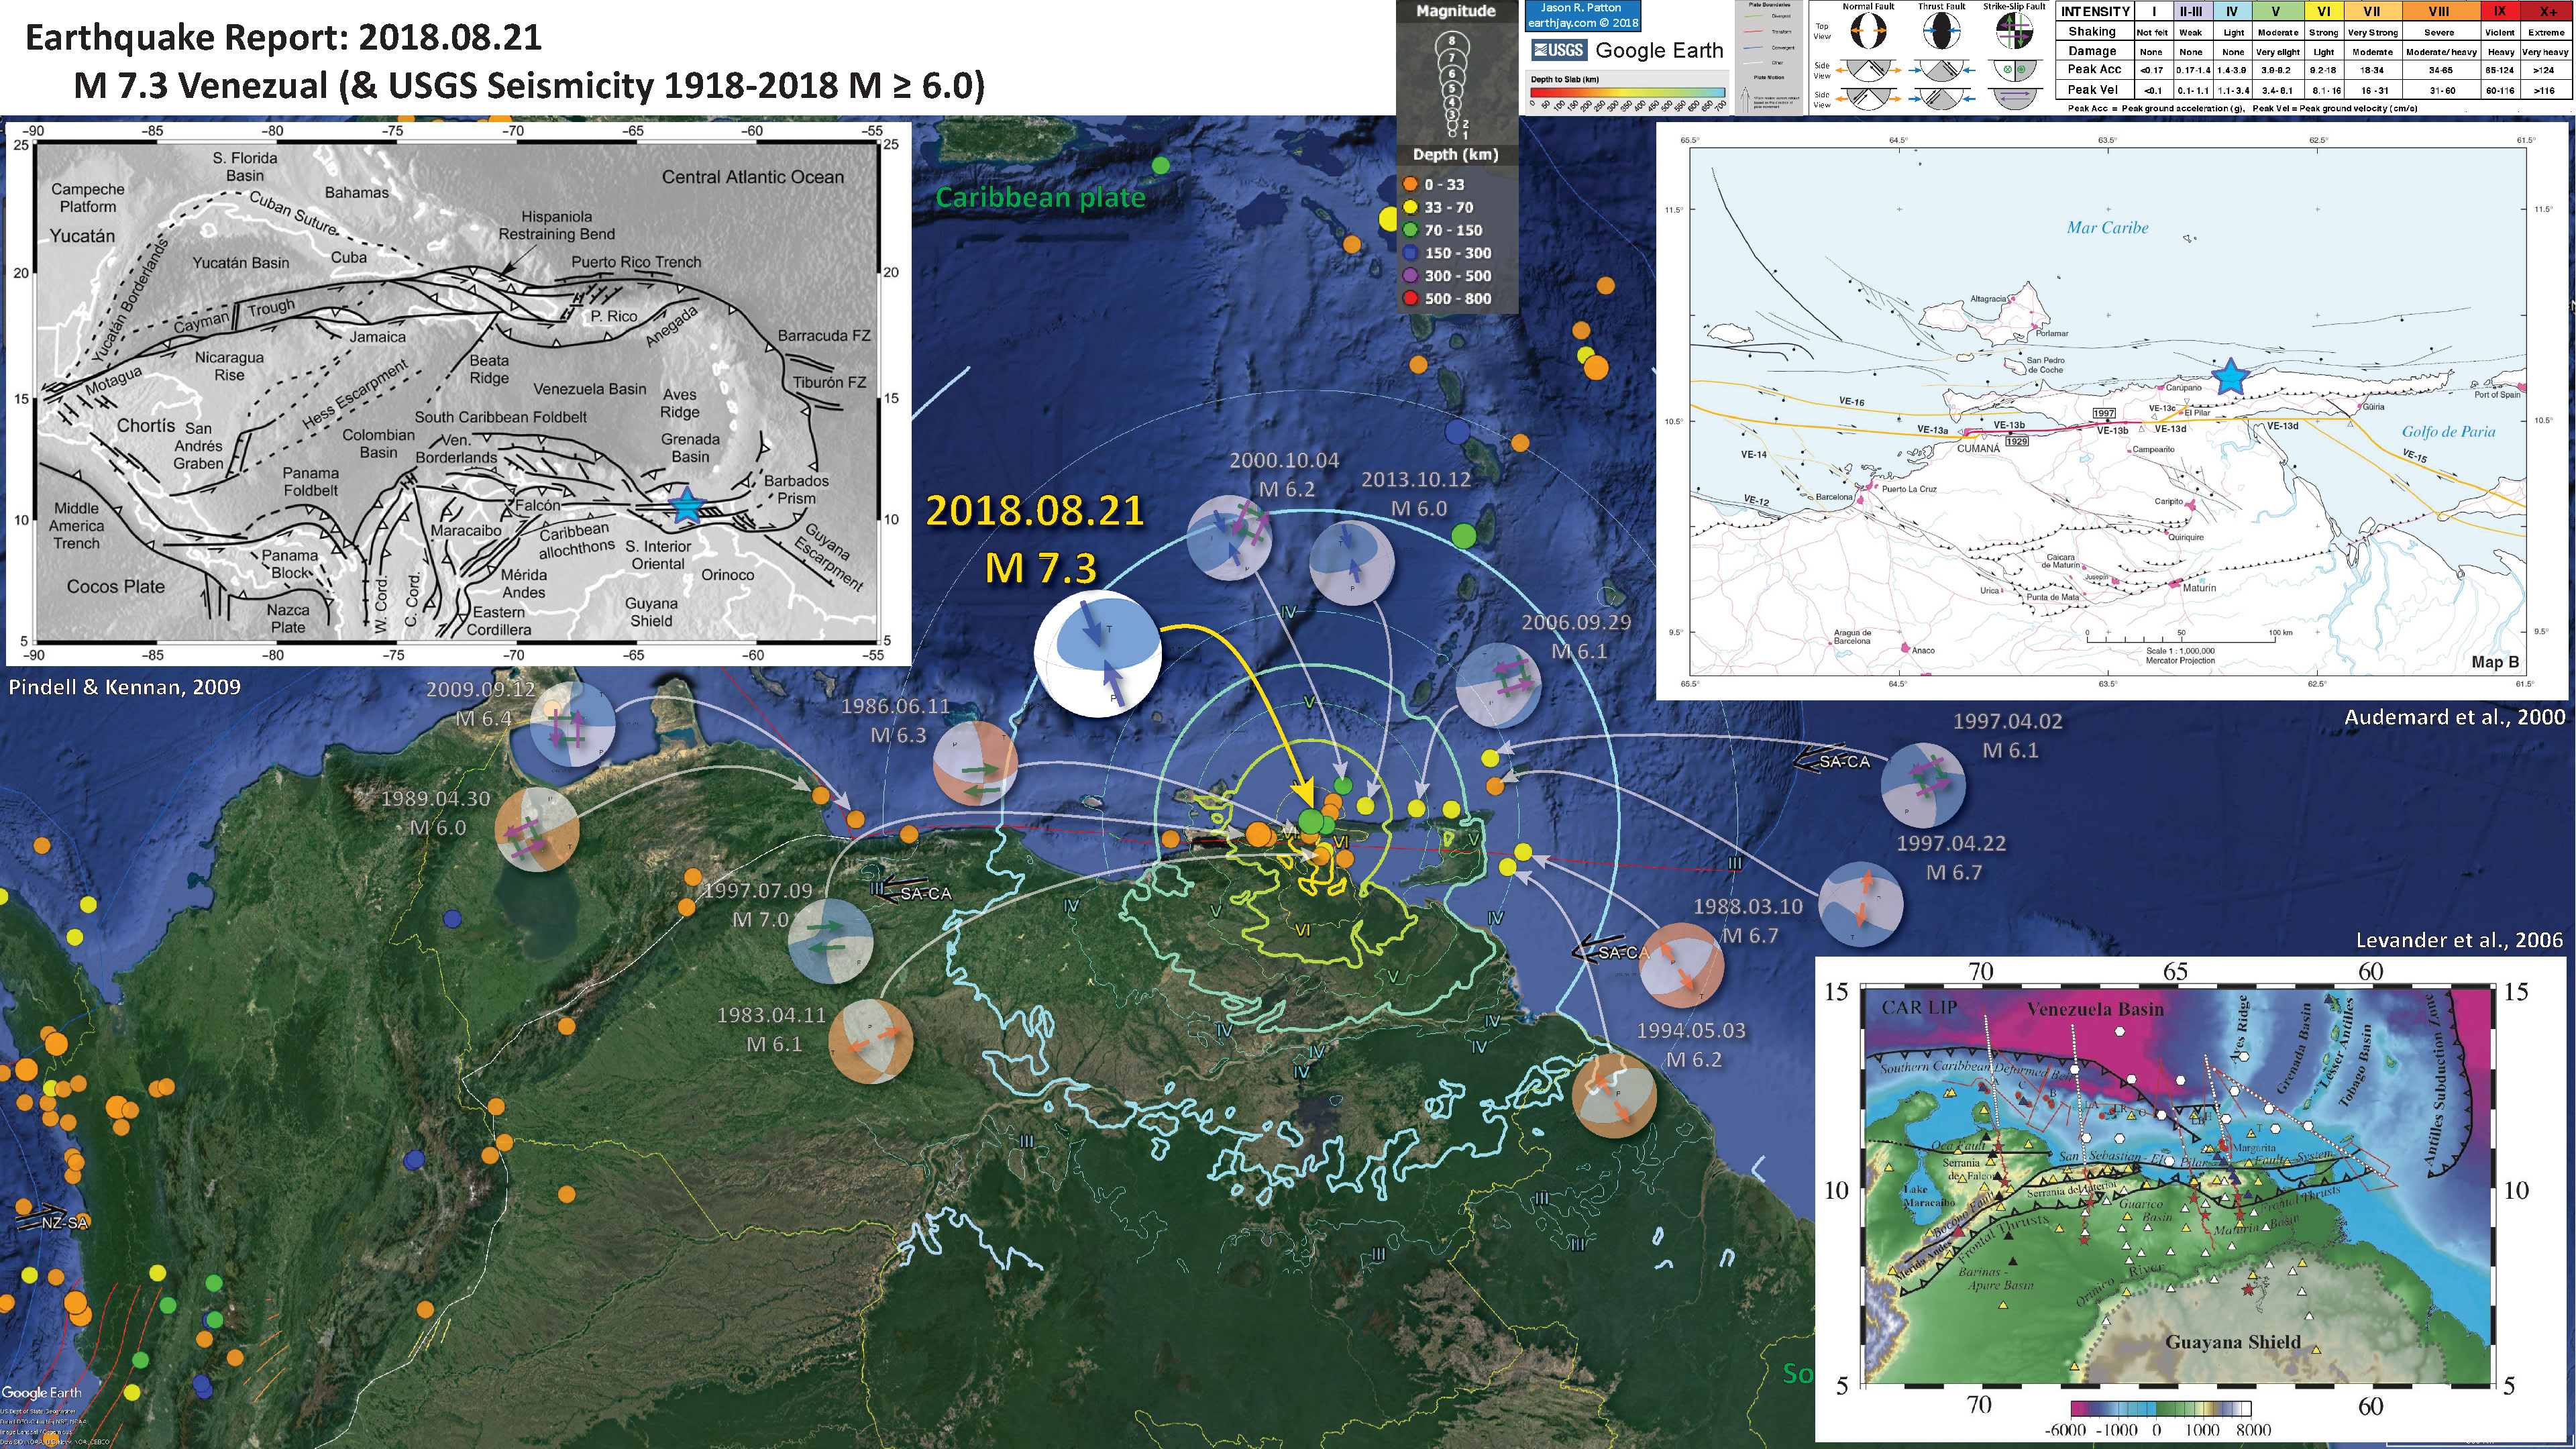
Below is my interpretive poster for this earthquake
I plot the seismicity from the past month, with color representing depth and diameter representing magnitude (see legend). I include earthquake epicenters from 1918-2018 with magnitudes M ≥ 6.0 in one version.
I plot the USGS fault plane solutions (moment tensors in blue and focal mechanisms in orange), possibly in addition to some relevant historic earthquakes.
- I placed a moment tensor / focal mechanism legend on the poster. There is more material from the USGS web sites about moment tensors and focal mechanisms (the beach ball symbols). Both moment tensors and focal mechanisms are solutions to seismologic data that reveal two possible interpretations for fault orientation and sense of motion. One must use other information, like the regional tectonics, to interpret which of the two possibilities is more likely.
- I also include the shaking intensity contours on the map. These use the Modified Mercalli Intensity Scale (MMI; see the legend on the map). This is based upon a computer model estimate of ground motions, different from the “Did You Feel It?” estimate of ground motions that is actually based on real observations. The MMI is a qualitative measure of shaking intensity. More on the MMI scale can be found here and here. This is based upon a computer model estimate of ground motions, different from the “Did You Feel It?” estimate of ground motions that is actually based on real observations.
- I include the slab contours plotted (Hayes et al., 2012), which are contours that represent the depth to the subduction zone fault. These are mostly based upon seismicity. The depths of the earthquakes have considerable error and do not all occur along the subduction zone faults, so these slab contours are simply the best estimate for the location of the fault. However, the slab contours are only in the southwestern portion of this map.
- In the upper left corner is a map from Pindel and Kennan (2009) that shows the plate tectonic boundaries of the Caribbean and northern South America.
- In the lower right corner is another map that shows teh regional tectonics (Levander et al., 2006).
- In the upper right corner is a larger scale map showing the faulting in the region surrounding today’s M 7.3 earthquake (Audenard et al., 2000).
I include some inset figures. Some of the same figures are located in different places on the larger scale map below.
- Here is the map with a month’s seismicity plotted, along with USGS earthquakes M ≥ 6.0.
Other Report Pages
Some Relevant Discussion and Figures
- Here is the Pindell and Kennan (2009) map.

Present day tectonic map of the Caribbean region.
- Here is the Pindell and Kennan (2009) figure that shows how the large strike-slip plate boundary on teh north side of Venezuela grew from the west over time.

Motion histories of: North (NA) and South America (SA) relative to Indo-Atlantic hot spot (IAHS) Mu¨ller et al. (1993) reference frame (grey lines; NA wrt IAHS and SA wrt IAHS); hot spots relative to North America (dashed black line; IAHS wrt NA); Caribbean relative to North America (heaviest black line; Car wrt NA), as summarized from former relative positions of the Caribbean Trench (lighter black lines). Also shown: Cayman Trough (grey outline); Cenozoic convergence between the Americas (inset upper right; P88 ¼ Pindell et al. 1988; M99 ¼ Mu¨ller et al. 1999); seismic tomographic profile of van der Hilst (1990) (inset, lower right).
- Here is the Audemard (2000) map showing the many faults in this region.

- This is a map from Reinoza et al. (2015) where they present their geodetic analysis (analysis of the deformation of the earth). These authors use GPS data to evaluate the potential activity of the El Pilar fault.

Location map of the active faults in northeastern Venezuela [Audemard et al., 2000] showing distribution of the GNSS stations: yellow squares, green circles, and red triangles are GNSS sites on which the acquisition campaigns were carried out in 2003, 2005, and 2013 respectively; the blue star corresponds to the cGNSS CUMA station of REMOS-IGVSB Network. We show the epicenter location of 1929 and 1997 events with their respective proposed ruptures (orange lines) [Audemard, 2007]. (top right) The inset box shows a schematic geodynamic map of the southeastern Caribbean [Audemard, 1999b; Audemard et al., 2000; Weber et al., 2001]. Legend: BF = Boconó Fault, EPF = El Pilar Fault, OAF = Oca Ancón fault, SMBF = Santa Marta Bucaramanga Fault, and SSF = San Sebastian Fault.
- Here are the GPS data. The white arrows (vectors) show the observed velocities (motion rate) for the GPS sites shown on the previous map. The black arrows (vectors) show how their model results compare with the observational data.

Observed velocities (white arrows) with error ellipses for 66% confidence level and simulated velocities (black arrows) according to the upgrade of displacement-simulation method. All displacements are based on the South America reference frame.
- Here are some cross sections showing the El Pilar fault, along with some of the thrust faults in the region. Section B is just to the west of where this M 7.3 earthquake happened.

Simplified sections across the southeastern Caribbean margin (based on maps and sections by Bellizzia et al. (1976), Stéphan et al. (1980), Campos (1981), Beck (1986), Chevalier (1987); locations in Fig. 1).
Geologic Fundamentals
- For more on the graphical representation of moment tensors and focal mechnisms, check this IRIS video out:
- Here is a fantastic infographic from Frisch et al. (2011). This figure shows some examples of earthquakes in different plate tectonic settings, and what their fault plane solutions are. There is a cross section showing these focal mechanisms for a thrust or reverse earthquake. The upper right corner includes my favorite figure of all time. This shows the first motion (up or down) for each of the four quadrants. This figure also shows how the amplitude of the seismic waves are greatest (generally) in the middle of the quadrant and decrease to zero at the nodal planes (the boundary of each quadrant).

- Here is another way to look at these beach balls.
The two beach balls show the stike-slip fault motions for the M6.4 (left) and M6.0 (right) earthquakes. Helena Buurman's primer on reading those symbols is here. pic.twitter.com/aWrrb8I9tj
— AK Earthquake Center (@AKearthquake) August 15, 2018
- There are three types of earthquakes, strike-slip, compressional (reverse or thrust, depending upon the dip of the fault), and extensional (normal). Here is are some animations of these three types of earthquake faults. The following three animations are from IRIS.
Strike Slip:
Compressional:
Extensional:
- This is an image from the USGS that shows how, when an oceanic plate moves over a hotspot, the volcanoes formed over the hotspot form a series of volcanoes that increase in age in the direction of plate motion. The presumption is that the hotspot is stable and stays in one location. Torsvik et al. (2017) use various methods to evaluate why this is a false presumption for the Hawaii Hotspot.
- Here is a map from Torsvik et al. (2017) that shows the age of volcanic rocks at different locations along the Hawaii-Emperor Seamount Chain.

A cutaway view along the Hawaiian island chain showing the inferred mantle plume that has fed the Hawaiian hot spot on the overriding Pacific Plate. The geologic ages of the oldest volcano on each island (Ma = millions of years ago) are progressively older to the northwest, consistent with the hot spot model for the origin of the Hawaiian Ridge-Emperor Seamount Chain. (Modified from image of Joel E. Robinson, USGS, in “This Dynamic Planet” map of Simkin and others, 2006.)

Hawaiian-Emperor Chain. White dots are the locations of radiometrically dated seamounts, atolls and islands, based on compilations of Doubrovine et al. and O’Connor et al. Features encircled with larger white circles are discussed in the text and Fig. 2. Marine gravity anomaly map is from Sandwell and Smith.
- 2016.01.17 1900-2016 Summary northern Caribbean
- 2018.01.10 M 7.6 Cayman Trough
- 2016.01.17 M 5.1 pair Cuba
Caribbean Earthquake Reports
General Overview
Earthquake Reports
- 2010.02.27 M 8.8 Earthquake Review
- 2018.08.21 M 7.3 Venezuela
- 2018.04.02 M 6.8 Bolivia
- 2018.01.14 M 7.1 Peru
- 2018.01.15 M 7.1 Peru Update #1
- 2017.06.30 M 6.0 Ecuador
- 2017.04.24 M 6.9 Chile
- 2017.04.23 M 5.9 Chile
- 2016.12.25 M 7.6 Chile
- 2016.11.24 M 7.0 El Salvador
- 2016.11.04 M 6.4 Maule, Chile
- 2016.04.16 M 7.8 Ecuador
- 2016.04.16 M 7.8 Ecuador Update #1
- 2015.11.29 M 5.9 Argentina
- 2015.11.11 M 6.9 Chile
- 2015.11.24 M 7.6 Peru
- 2015.11.26 M 7.6 Peru Update
- 2015.09.16 M 8.3 Chile
- 2014.04.01 M 8.2 Chile
- 2010.02.27 M 8.8 Chile
- 1960.05.22 M 9.5 Chile
Chile | South America
General Overview
Earthquake Reports
Social Media
New: Magnitude 7.3 earthquake strikes in northern Venezuela, possibly the country’s largest earthquake in almost 200 years. Shaking was felt 1000s of kilometers away. (Image: USGS) https://t.co/bzgcagbZ5i pic.twitter.com/RLuSshccXD
— Erik Klemetti (@eruptionsblog) August 22, 2018
Historical (~past century) seismicity in area of today's M7.3 quake in Venezuela at intermediate depth (~150 km). Today's event appears to be at edge of subducting slab (or at least its seismicity), with several historical events of similar magnitude and depth to North. pic.twitter.com/xdnHMKDolM
— Jascha Polet (@CPPGeophysics) August 22, 2018
3D view of #earthquakes inside the earth along the SE edge of the Caribbean Plate. The large green dot is the hypocenter of todays M7.3 #VenezuelaEarthquake. (Colors indicate depth, size dot size indicates magnitude). https://t.co/MQYFz7UpWD pic.twitter.com/8dFWNuQ0K2
— IRIS Earthquake Sci (@IRIS_EPO) August 22, 2018
The 29 October 1900 M7.7 #Venezuela #earthquake was larger than today's (@Seismo_Steve). The ground shook for 50 seconds in Caracas. Charles Richter himself published a magnitude of M8.4. Other later magnitudes were smaller (Fiedler, 1988) but very few seismograms were recorded. pic.twitter.com/aKstkUkm1u
— Dr. Kasey Aderhold (@kaseyaderhold) August 22, 2018
Global surface body wave record sections of the M7.3 #VenezuelaEarthquake https://t.co/OJJhV9lL7J pic.twitter.com/RbyBRid8ox
— IRIS Earthquake Sci (@IRIS_EPO) August 22, 2018
It's been a busy few days for my @raspishake! The M7.3 Venezuelan earthquake was captured clearly in Turlock at 21:41:26 UTC… 9 min and 44 sec to travel the 4025 surface miles to Turlock!https://t.co/H3VRPKluBT pic.twitter.com/6El2CRBc1S
— Ryan Hollister (@phaneritic) August 22, 2018
M7.3 earthquake today along the northern coast of Venezuela is one of the largest ever recorded earthquakes along the boundary between the Caribbean & South American plates.
There was an M7.7 quake to the west in 1900 but this will have preceded detailed instrumental recordings pic.twitter.com/e9HY0inE9E— Stephen Hicks (@seismo_steve) August 21, 2018
Mw=7.3, NEAR COAST OF VENEZUELA (Depth: 112 km), 2018/08/21 21:31:42 UTC – Full details here: https://t.co/fOGIcUNrDx pic.twitter.com/W6CukRFIxU
— Earthquakes (@geoscope_ipgp) August 21, 2018
The moment of occurrence Powerful 7.3-magnitude earthquake rattles Venezuela Strong damage recorded in #TrinidadYTobago https://t.co/wjBOsdRIDW
— live (@live1439) August 21, 2018
— flatearth world news (@FLATEARTHCENTER) August 21, 2018
Sismo pic.twitter.com/sw5fkIj764
— Juan Carlos Finol (@jcfinolb) August 21, 2018
M7 #earthquake #Venezuela: acceleration seismogram recorded at Grenville, Grenada about 200km northeast of the epicenter shows up to 2min of possibly felt shaking. https://t.co/9avYl65EZk pic.twitter.com/cbYrtb8XGs
— Anthony Lomax 🌍🇪🇺 (@ALomaxNet) August 21, 2018
M7.3 earthquake in Venezuela, ~150 km deep so low probability of a significant tsunami. Event has a reverse faulting mechanism, of which there have been a few in that area historically. https://t.co/bZ5BW9IfSc https://t.co/3oeIy3lwDM pic.twitter.com/Y2TDnTKiim
— Jascha Polet (@CPPGeophysics) August 21, 2018
FirstMoMech: Mwp7.0 #earthquake Near Coast of Venezuela https://t.co/kCIw9Vypa6 pic.twitter.com/ly2iuEojzK
— Anthony Lomax 🌍🇪🇺 (@ALomaxNet) August 21, 2018
The 1766 eq, which could well be the predecessor of today's, was the largest one (Mw 7.8) in the CA-SA PBZ. It is interpreted as an intermediate-depth (60-200 km) eq.
In the same depth range of today eq??? https://t.co/vKTOv9UC7m— Franck Audemard (@DrSeawater) August 22, 2018
- Audemard, F.A., Machette, M.N., Cox, J.W., Dart, R.L., and Haller, K.M., 2000. Map and Database of Quaternary Faults in Venezuela and its Offshore Regions, USGS Open File Report 00-018
- Hayes, G.P., Wald, D.J., and Johnson, R.L., 2012. Slab1.0: A three-dimensional model of global subduction zone geometries in, J. Geophys. Res., 117, B01302, doi:10.1029/2011JB008524
- Jouanne, F., Audemard, F.A., Beckm, C., Van Welden, A., Ollarves, R., and Reinoz, C., 2011. Present-day deformation along the El Pilar Fault in eastern Venezuela: Evidence of creep along a major transform boundary in Journal of Geodynamics, v. 51., p. 398-410, doi:10.1016/j.jog.2010.11.003
- Meyer, B., Saltus, R., Chulliat, a., 2017. EMAG2: Earth Magnetic Anomaly Grid (2-arc-minute resolution) Version 3. National Centers for Environmental Information, NOAA. Model. doi:10.7289/V5H70CVX
- Pindell, J.L. and Kennan, L., 2009. Tectonic evolution of the Gulf of Mexico, Caribbean and northern South America in the mantle reference frame: an update in JAMES, K. H., LORENTE, M. A. & PINDELL, J. L. (eds) The Origin and Evolution of the Caribbean Plate. Geological Society, London, Special Publications, 328, 1–55.
DOI: 10.1144/SP328.1 - Reinoza, C., F. Jouanne, F. A. Audemard, M. Schmitz, and C. Beck (2015), Geodetic exploration of strain along the El Pilar Fault in northeastern Venezuela, J. Geophys. Res. Solid Earth, 120, 1993– 2013, doi:10.1002/2014JB011483.
References:
°
≥